
Hydrological Mapping in the Luquillo Experimental Forest: New Local Datum Improves Watershed Ecological Knowledge


Abstract
:1. Introduction
2. Methods
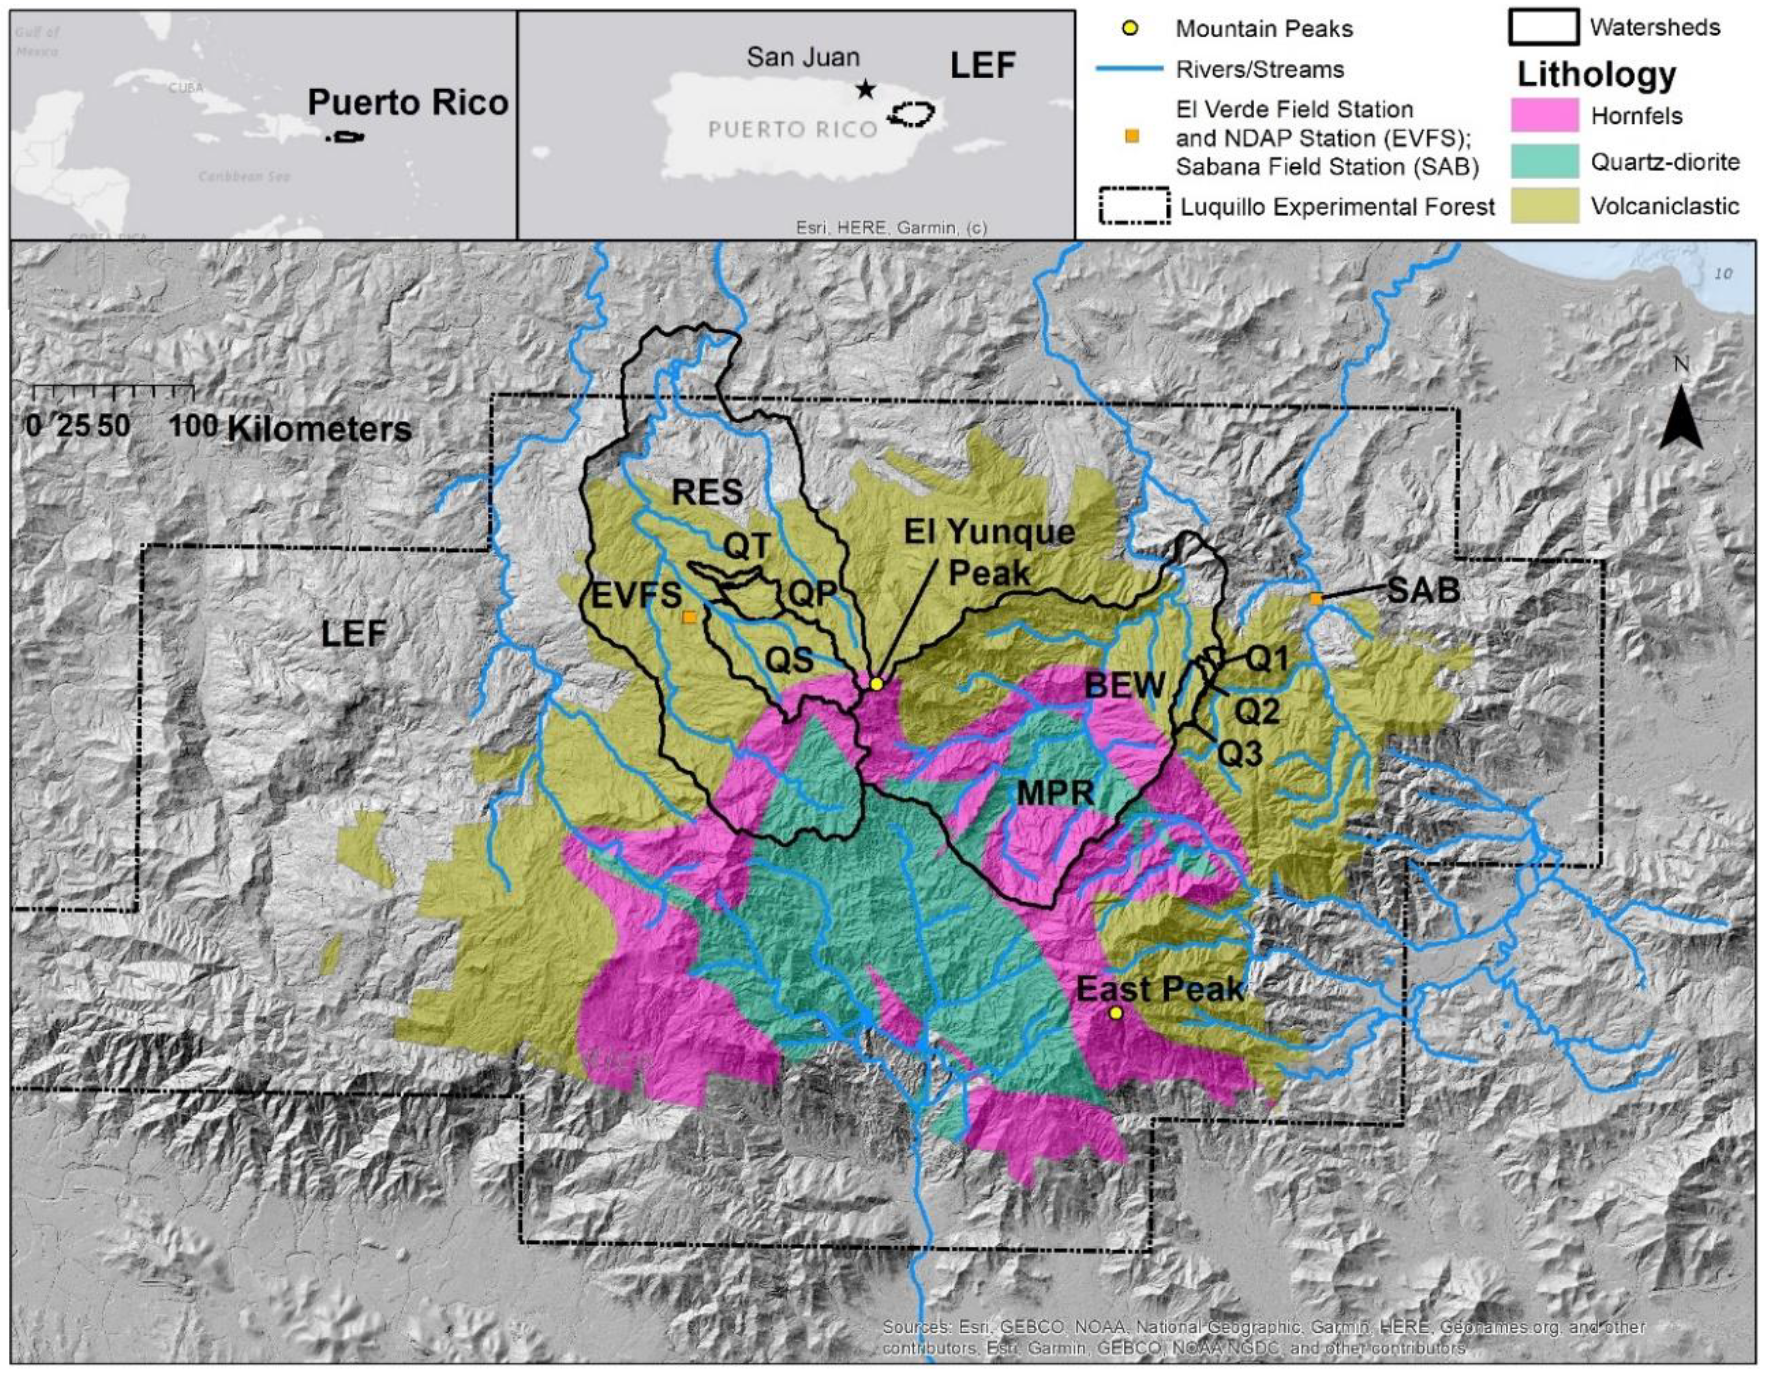
2.1. Study Site
2.2. Data Needs for Densification of the Hydrographic Network
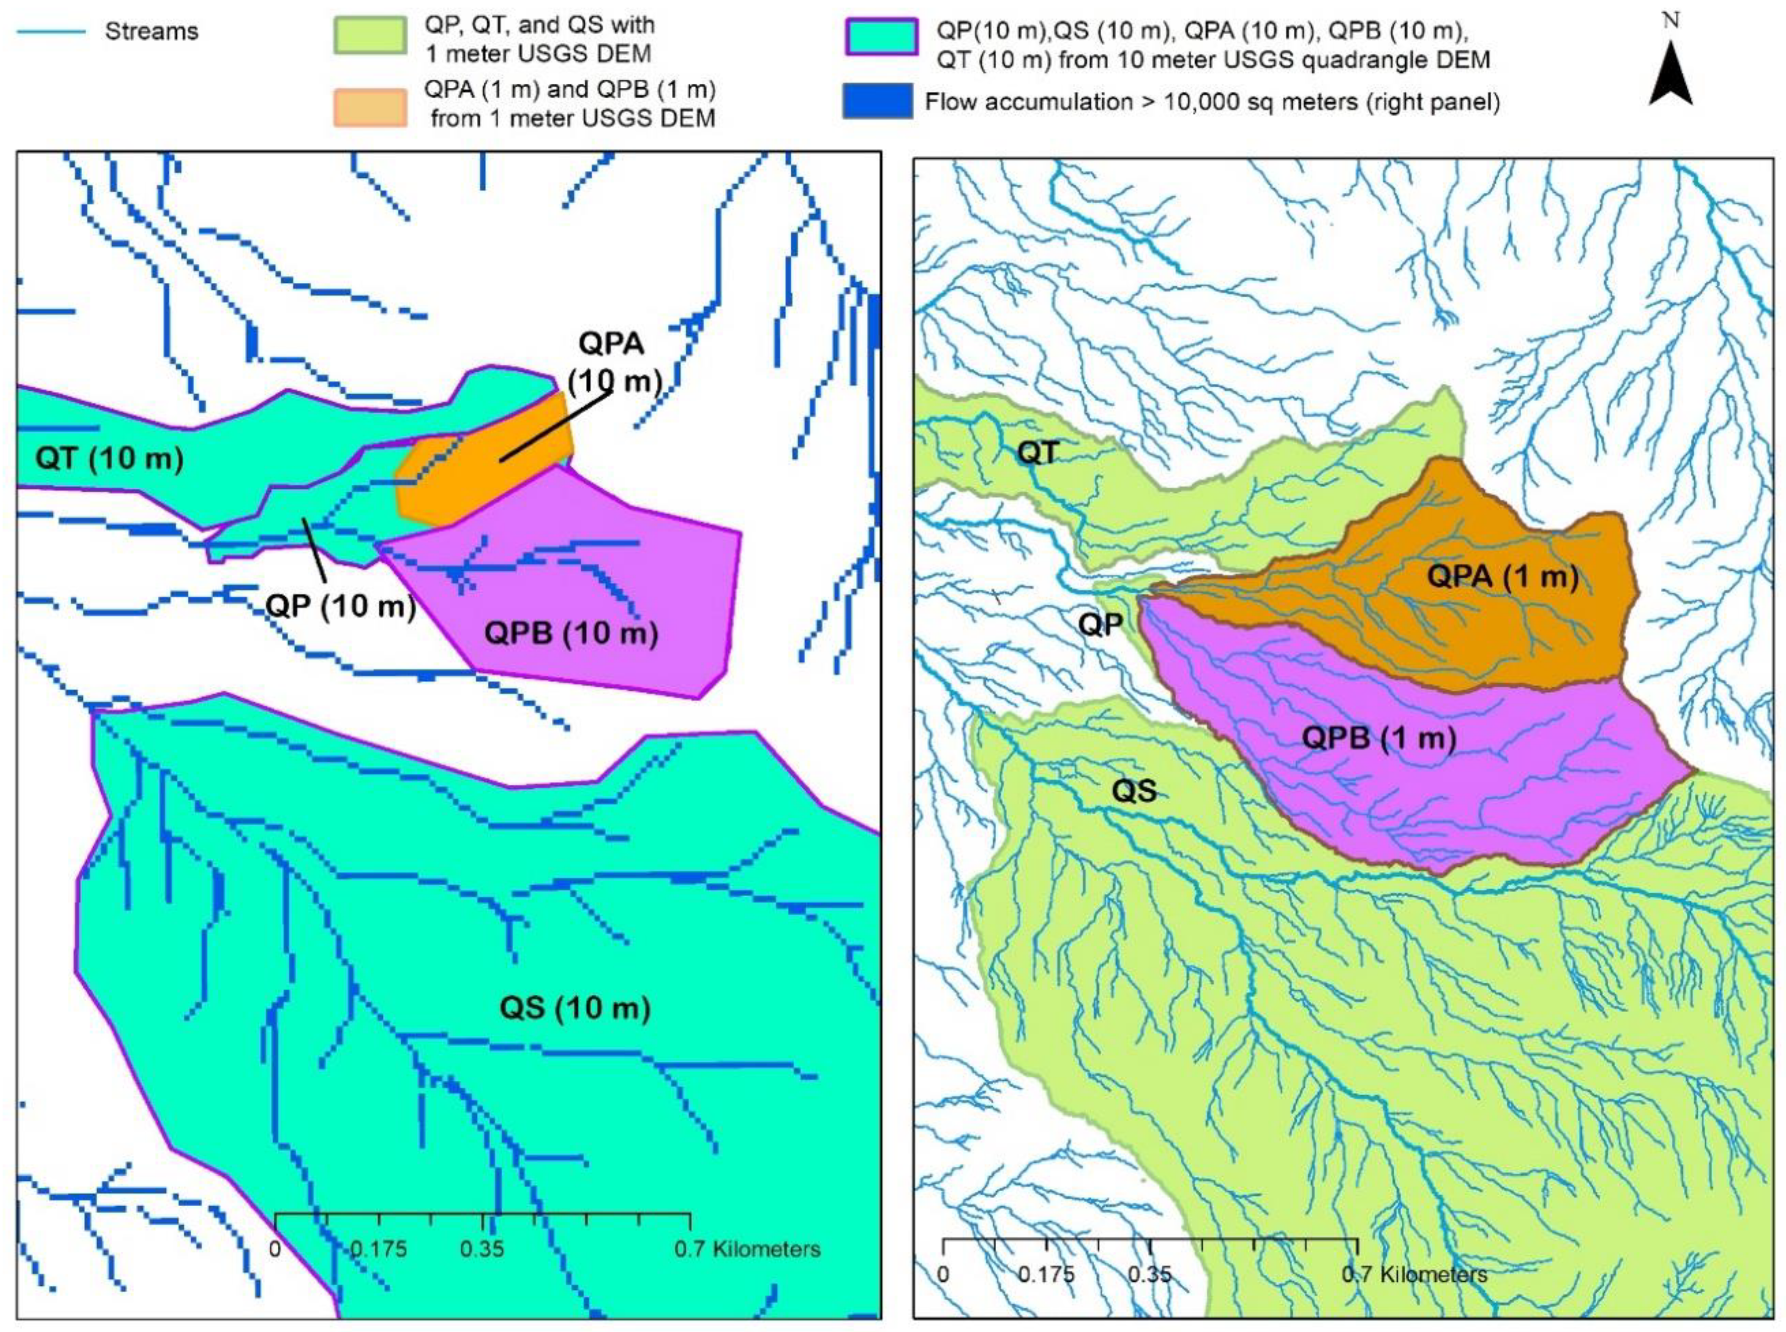
2.3. Processing Decisions and Trade-Offs in Generating a Hydrographic Network
3. Results
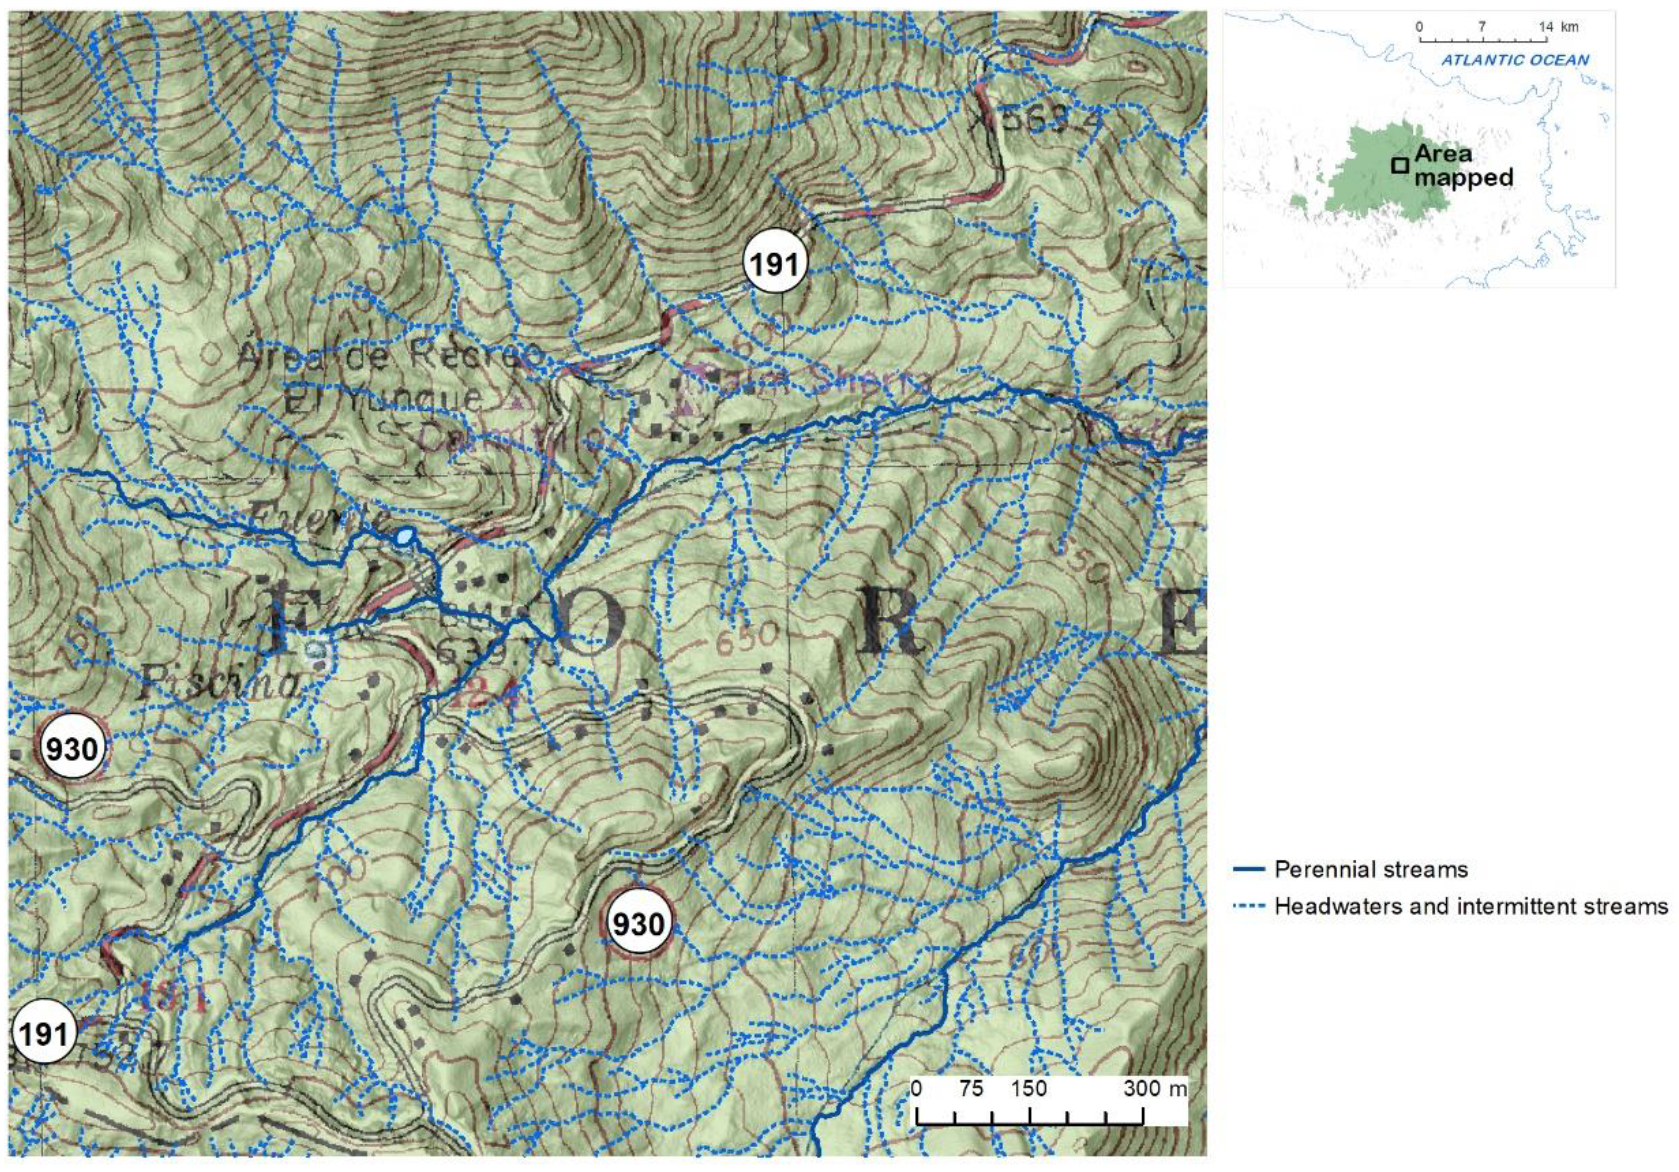
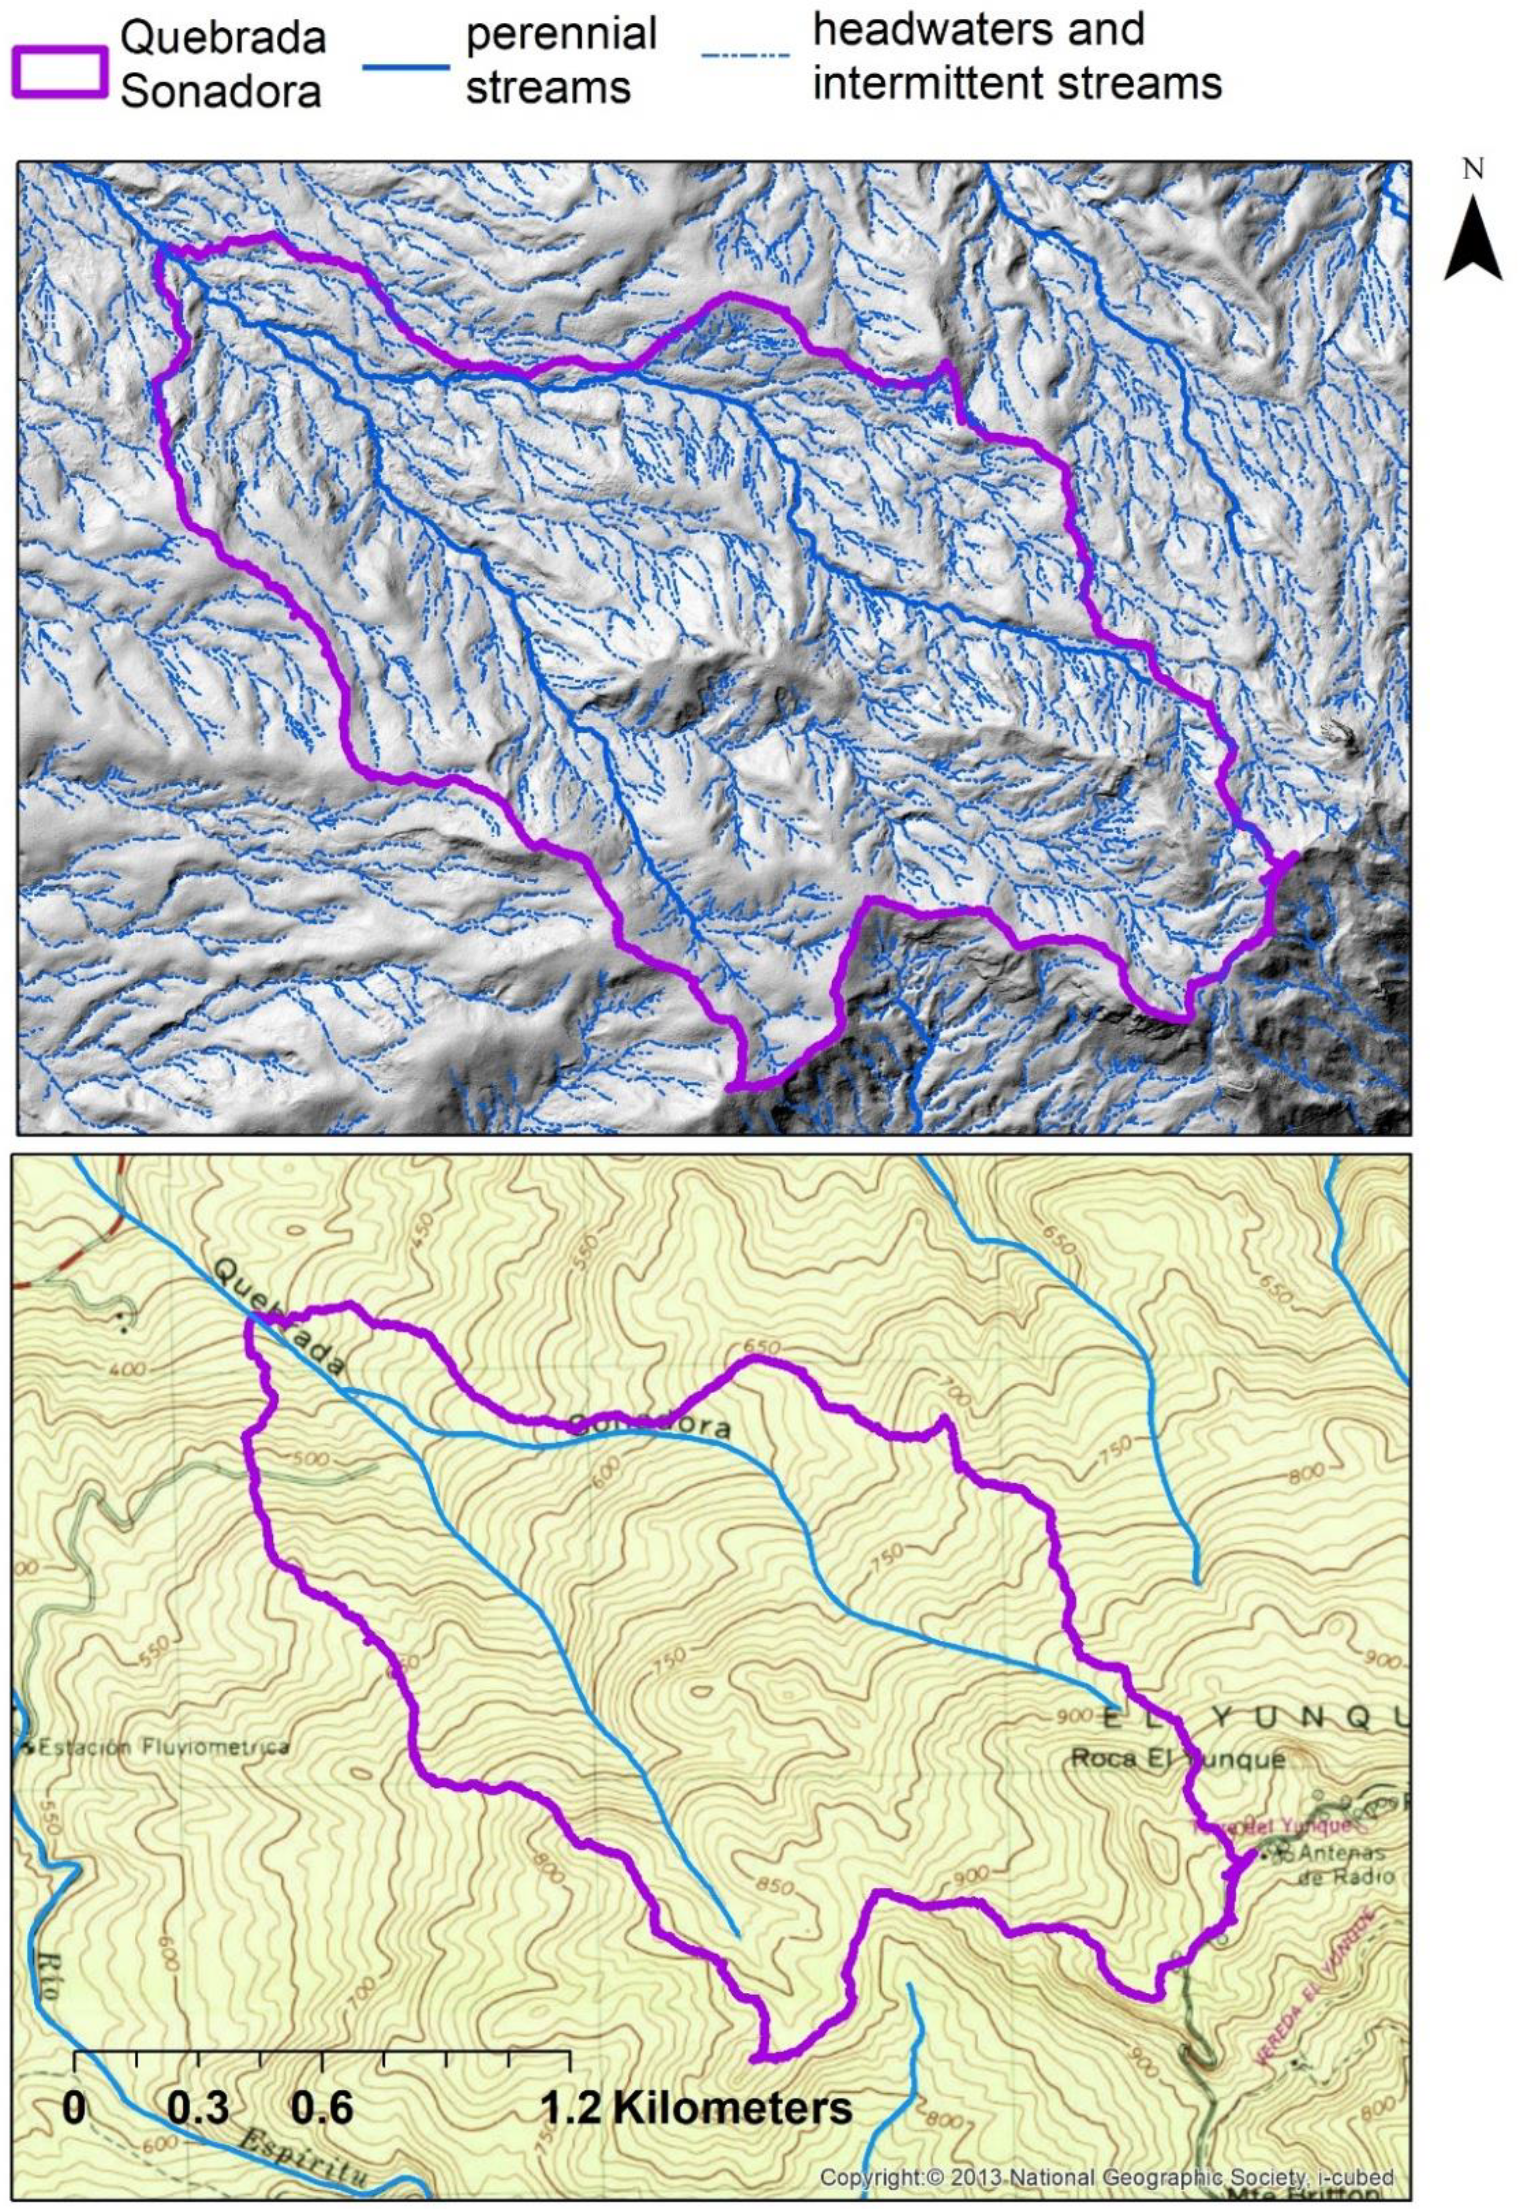
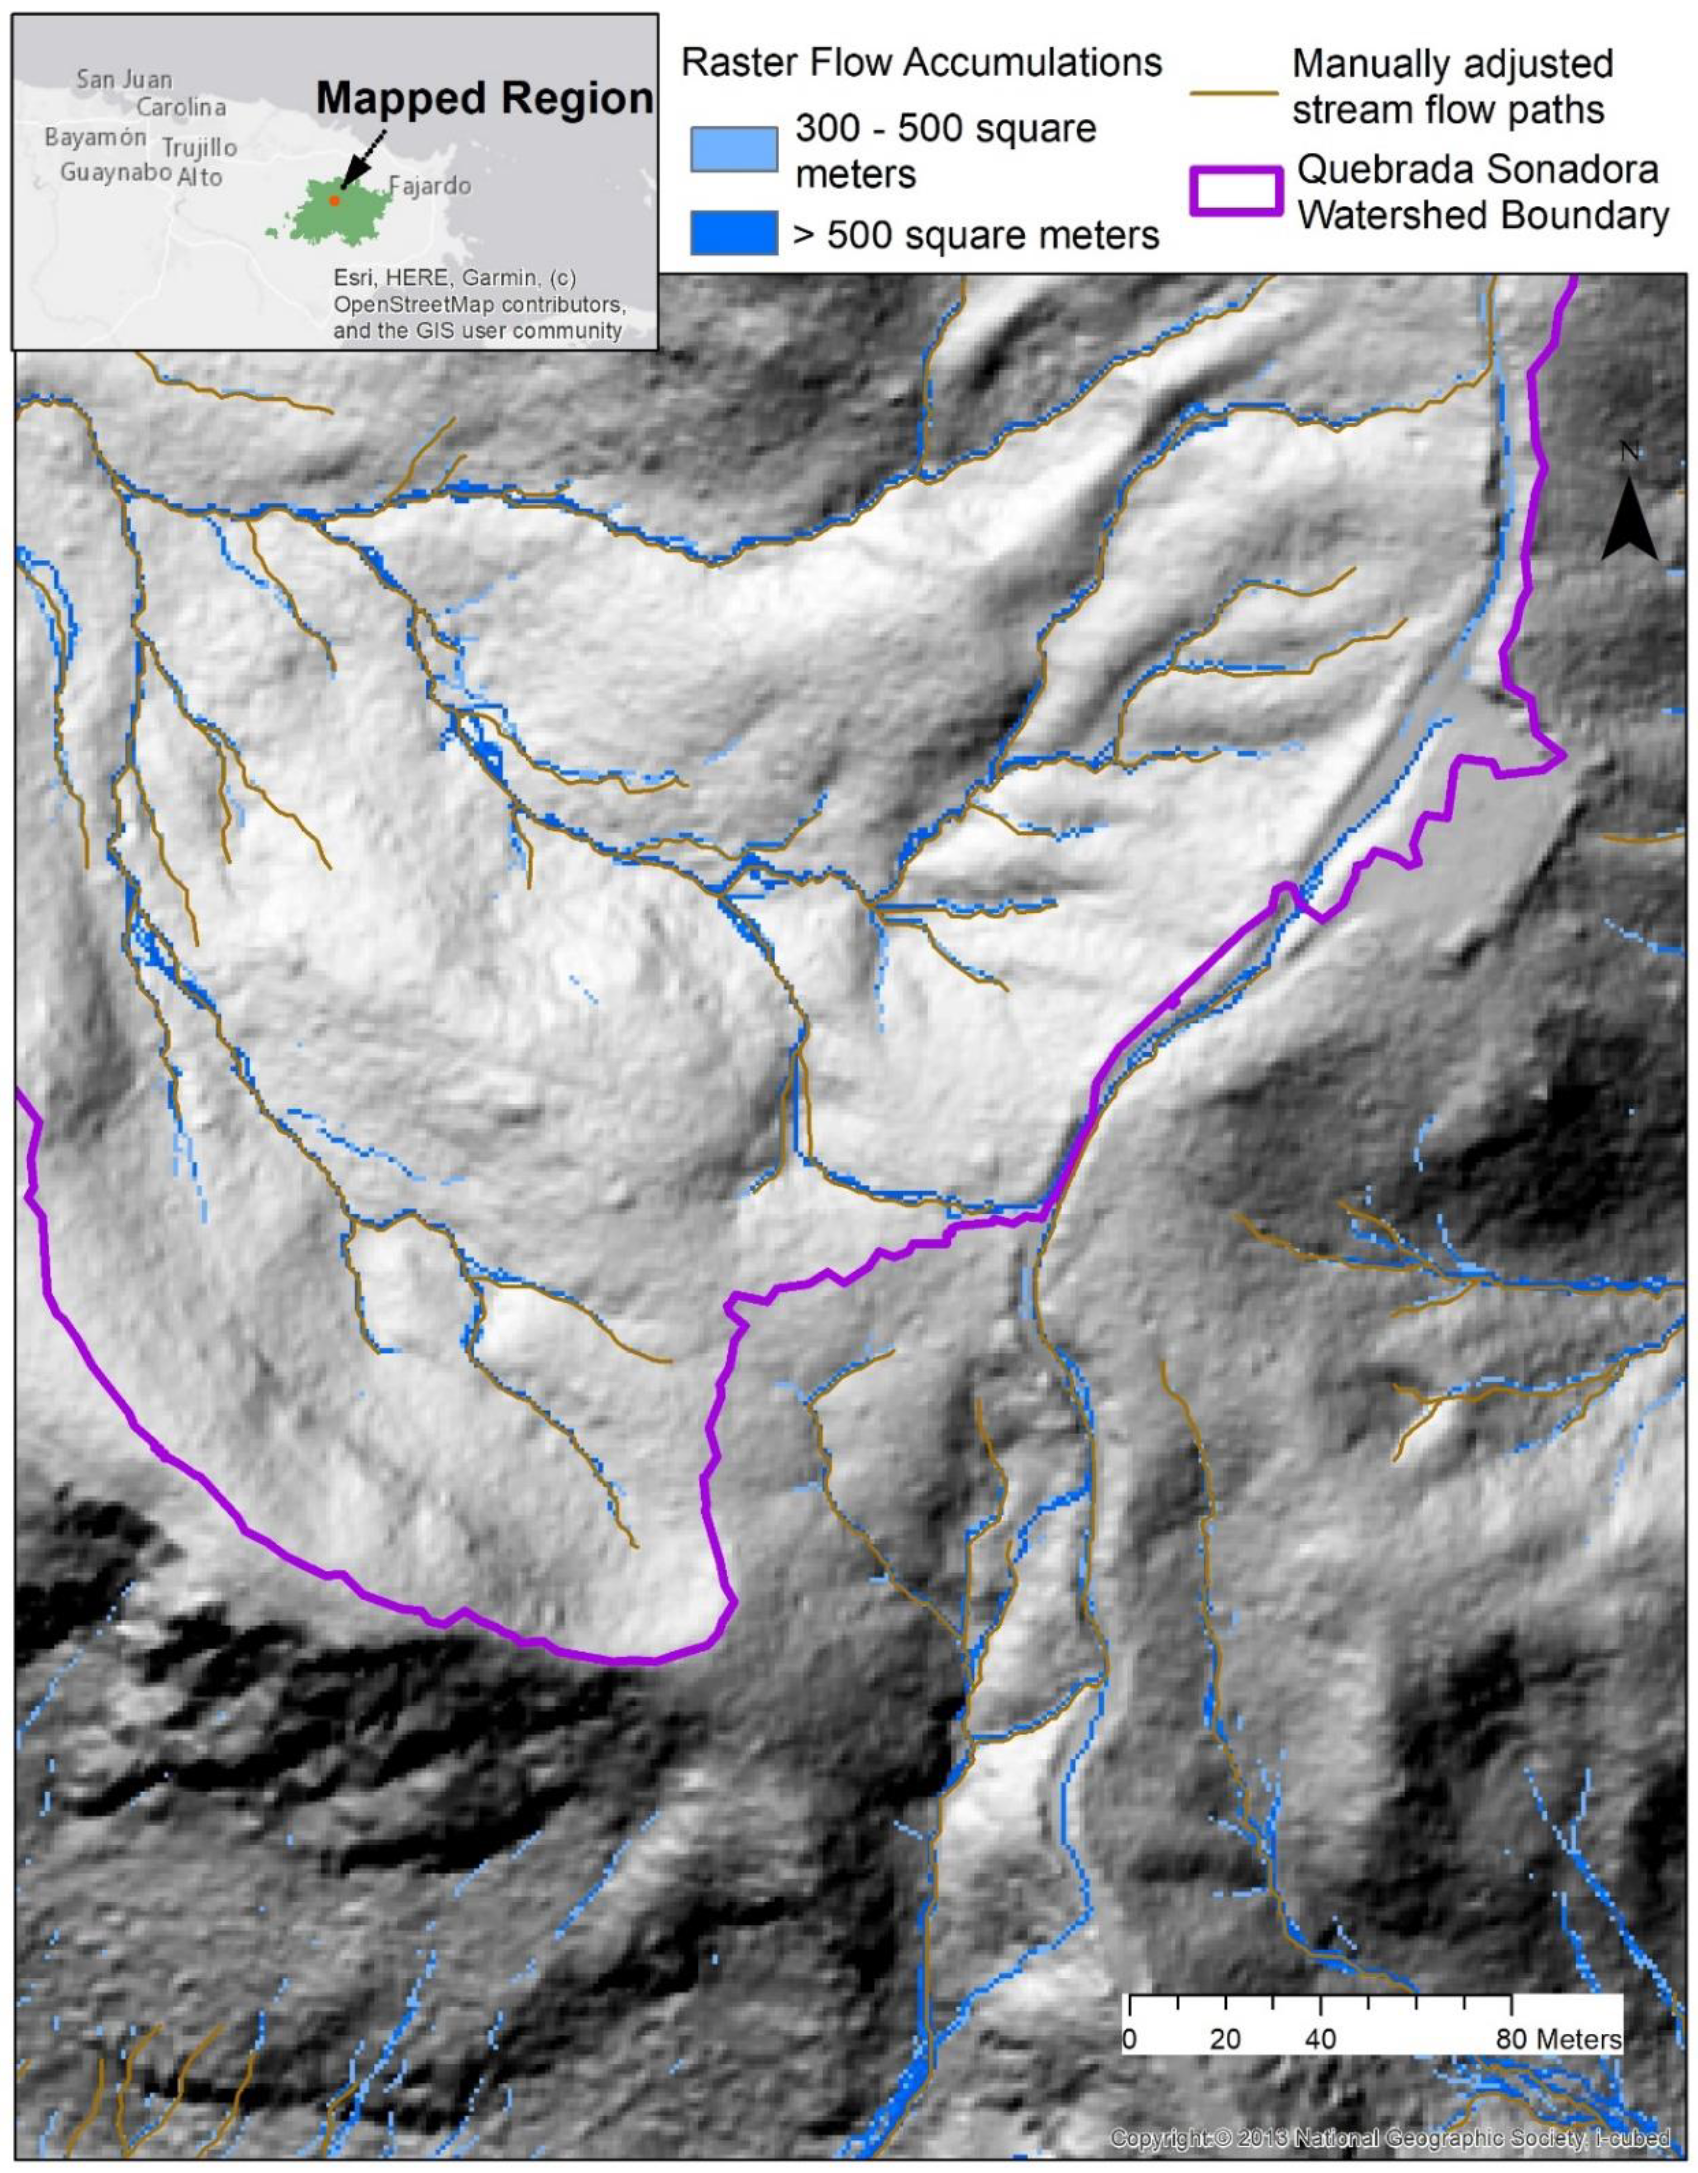
3.1. The Sonadora Sub-Watershed and Stream Systems, a Long-Term Research Area Densification Case Study
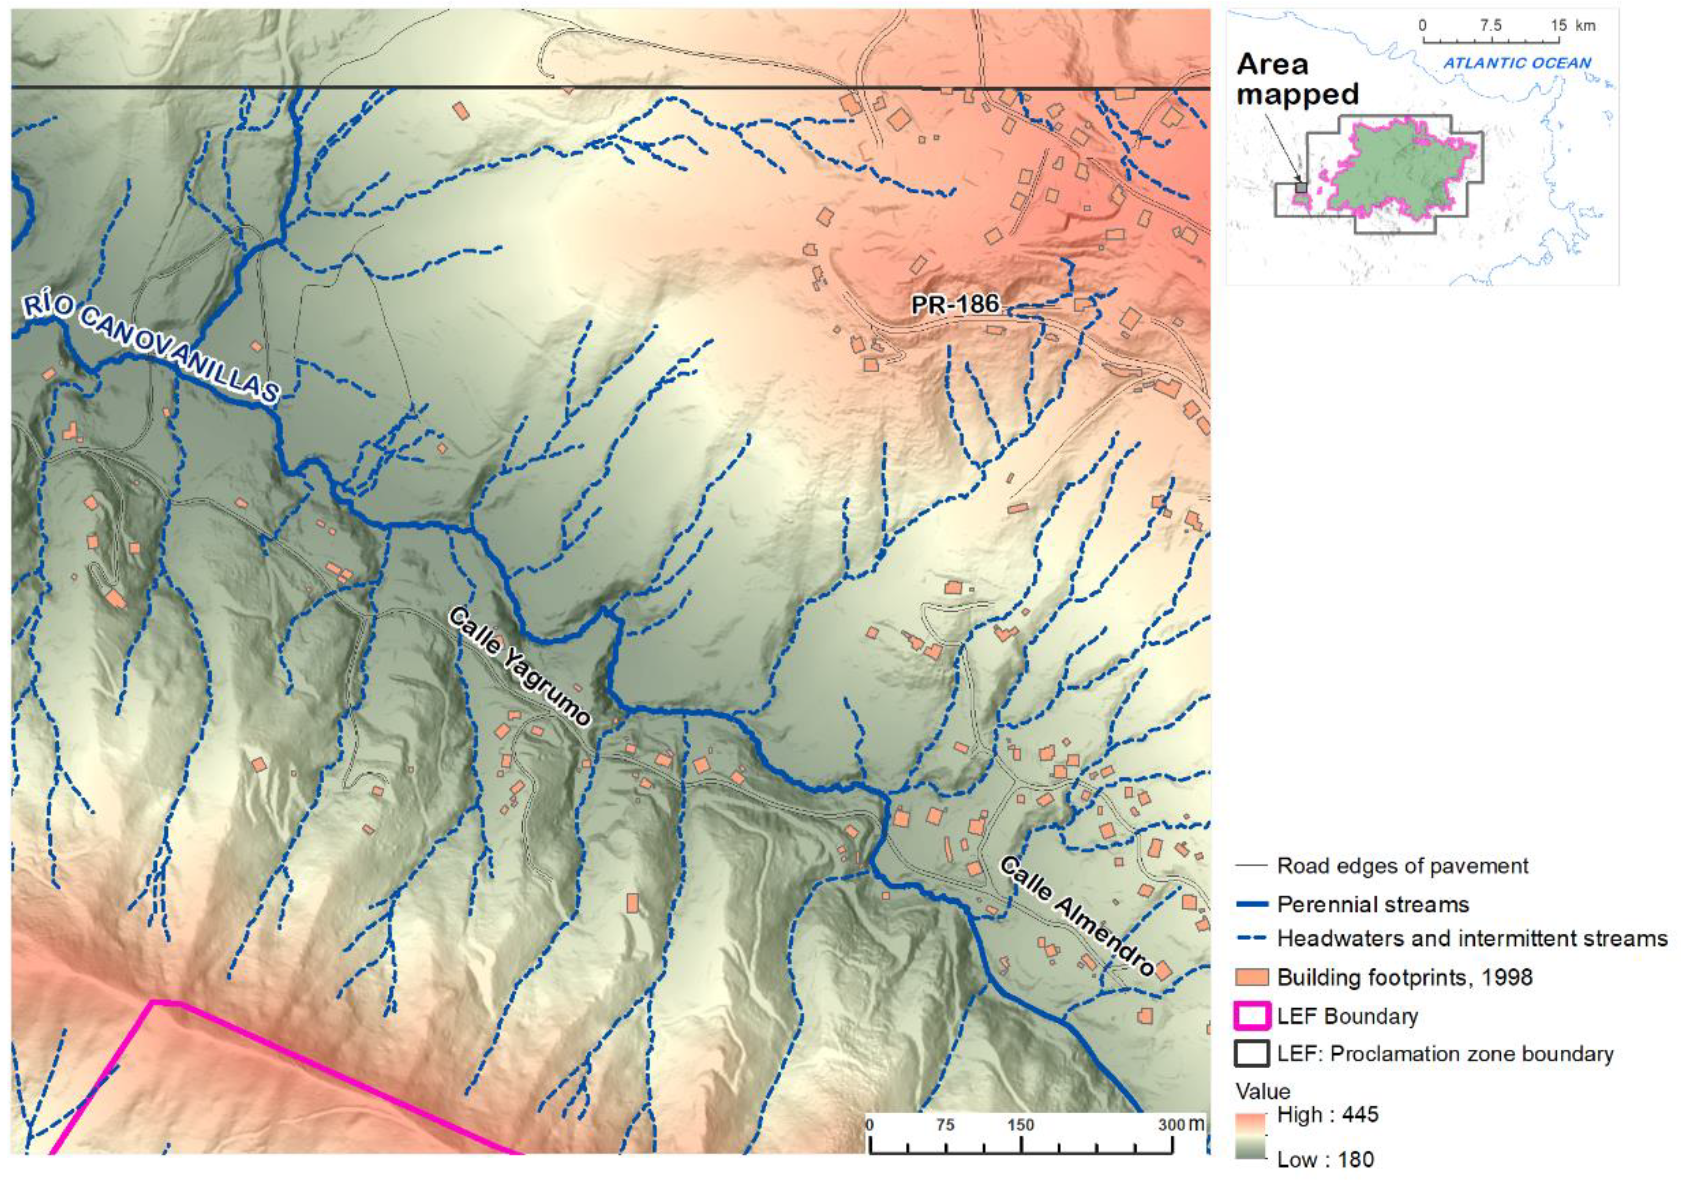
3.2. Other or Ongoing Challenges of Work within the LEF and Surrounding Landscape
4. Discussion
4.1. Ongoing Work with Densified Hydrological Networks
4.2. Opportunities and Challenges to Improve Watershed Ecological Knowledge
Author Contributions
Funding
Institutional Review Board Statement
Informed Consent Statement
Data Availability Statement
Acknowledgments
Conflicts of Interest
References
- Carlson, R.R.; Foo, S.A.; Asner, G.P. Land use impacts on coral reef health: A ridge-to-reef perspective. Front. Mar. Sci. 2019, 6, 562. [Google Scholar] [CrossRef]
- Pringle, C.M. Threats to US public lands from cumulative hydrologic alterations outside of their boundaries. Ecol. Appl. 2000, 10, 971–989. [Google Scholar] [CrossRef]
- Allen, G.H.; Pavelsky, T.M. Global extent of rivers and streams. Science 2018, 361, 585–588. [Google Scholar] [CrossRef] [PubMed] [Green Version]
- Heartsill Scalley, T. Freshwater resources in the insular Caribbean: An environmental perspective. Caribb. Stud. 2012, 40, 63–93. [Google Scholar] [CrossRef] [Green Version]
- Smith, W.E.; Kwak, T.J. Tropical insular fish assemblages are resilient to flood disturbance. Ecosphere 2015, 6, 1–16. [Google Scholar] [CrossRef] [Green Version]
- Gutiérrez-Fonseca, P.E.; Ramírez, A.; Pringle, C.M.; Torres, P.J.; McDowell, W.H.; Covich, A.; Crowl, T.; Pérez-Reyes, O. When the rainforest dries: Drought effects on a montane tropical stream ecosystem in Puerto Rico. Freshw. Sci. 2020, 39, 197–212. [Google Scholar] [CrossRef]
- Colón-Rivera, R.J.; Feagin, R.A.; West, J.B.; López, N.B.; Benítez-Joubert, R.J. Hydrological modification, saltwater intrusion, and tree water use of a Pterocarpus officinalis swamp in Puerto Rico. Estuar. Coast. Shelf Sci. 2014, 147, 156–167. [Google Scholar] [CrossRef]
- Pike, A.S.; Scatena, F.N.; Wohl, E.E. Lithological and fluvial controls on the geomorphology of tropical montane stream channels in Puerto Rico. Earth Surf. Process. Landforms 2010, 35, 1402–1417. [Google Scholar] [CrossRef]
- Horgby, Å.; Segatto, P.L.; Bertuzzo, E.; Lauerwald, R.; Lehner, B.; Ulseth, A.J.; Vennemann, T.W.; Battin, T.J. Unexpected large evasion fluxes of carbon dioxide from turbulent streams draining the world’s mountains. Nat. Commun. 2019, 10, 4888. [Google Scholar] [CrossRef] [PubMed] [Green Version]
- Harris, N.L.; Lugo, A.E.; Brown, S.; Heartsill-Scalley, T. Luquillo Experimental Forest: Research History and Opportunities; Experimental Forest and Range EFR-1; USDA Forest Service: Washington, DC, USA, 2012; 152p. Available online: https://www.fs.usda.gov/detail/iitf/research/?cid=fseprd488601 (accessed on 12 March 2021).
- Brantley, S.L.; Megonigal, J.P.; Scatena, F.N.; Balogh-Brunstad, Z.; Barnes, R.T.; Bruns, M.A.; Van Cappellen, P.; Dontsova, K.; Hartnett, H.E.; Hartshorn, A.S.; et al. Twelve Testable Hypotheses on The Geobiology of Weathering. Geobiology 2011, 9, 140–165. [Google Scholar] [CrossRef] [PubMed]
- Doyle, D.R.; Smith, D.A. Definition and Densification of the Puerto Rico Vertical Datum of 2002. Surv. Land Inf. Sci. 2012, 72, 109–118. [Google Scholar]
- Cifuentes, E. Crean un Mecanismo para Estudiar la faz de la Tierra. El Nuevo Dia, 17 March 2002; 32–33. [Google Scholar]
- Arundel, S.T.; Archuleta, C.M.; Phillips, L.A.; Roche, B.L.; Constance, E.W.U.S. Geological Survey Techniques and Methods: Book 11. In 1-Meter Digital Elevation Model Specification; U.S. Geological Survey: Reston, VA, USA, 2015; Chapter B7; 25p. [Google Scholar] [CrossRef]
- Leon, M.C.; Heartsill-Scalley, T.; Santiago, I.; McDowell, W.H. Watersheds and Stream Networks in the Luquillo Experimental Forest, Puerto Rico; HydroShare: Cambridge, MA, USA, 2021. [Google Scholar] [CrossRef]
- McDowell, W.; Leon, M.; Shattuck, M.; Potter, J.; Heartsill-Scalley, T.; Gonzalez, G.; Shanley, J. Luquillo Experimental Forest: Catchment Science in the Montane Tropics. Authorea Preprints. 2020. Available online: https://www.authorea.com/doi/full/10.22541/au.160193299.93849714 (accessed on 12 March 2021).
- U.S. Geological Survey. National Geospatial Program US Topo Product Standard, EL Yunque, PR Quadrangle; U.S. Geological Survey: Reston, VA, USA, 2011.
- Luquillo Critical Zone Observatory. Luquillo Critical Zone Observatory 2010–2011 LiDAR Survey for the Rio Mameyes and Rio Blanco Watersheds; NCALM, NSF EAR-0922307; HydroShare: Cambridge, MA, USA, 2011. [Google Scholar] [CrossRef]
- Schellekens, J.; Scatena, F.N.; Bruijnzeel, L.A.; van Dijk, A.I.J.M.; Groen, M.M.A.; van Hogezand, R.J.P. Stormflow generation in a small rainforest catchment in the Luquillo Experimental Forest, Puerto Rico. Hydrol. Process. 2004, 18, 505–530. [Google Scholar] [CrossRef]
- Pike, A.S. Application of Digital Terrain Analysis to Estimate Hydrological Variables in the Luquillo Mountains of Puerto Rico; Conference Proceeding; IAHS-AISH Publication: Wallingford, UK, 2006; pp. 81–85. Available online: https://iahs.info/uploads/dms/13640.18-81-85-78-308-Pike.pdf (accessed on 12 March 2021).
- Cook, B.D.; Nelson, R.F.; Middleton, E.M.; Morton, D.C.; McCorkel, J.T.; Masek, J.G.; Ranson, K.J.; Ly, V.; Montesano, P.M. NASA Goddard’s Lidar, Hyperspectral and Thermal (G-LiHT) airborne imager. Remote Sens. 2013, 5, 4045–4066. [Google Scholar] [CrossRef] [Green Version]
- Bawiec, W.J. (Ed.) Geology, Geochemistry, Geophysics, Mineral Occurrences and Mineral Resource Assessment for the Commonwealth of Puerto Rico; Open-File Report 98-038; U.S. Geological Survey: Reston, VA, USA, 1999; available online only.
- Murphy, S.F.; Stallard, R.F.; Scholl, M.A.; González, G.; Torres-Sánchez, A.J. Reassessing rainfall in the Luquillo Mountains, Puerto Rico: Local and global ecohydrological implications. PLoS ONE 2017, 12, e0180987. [Google Scholar] [CrossRef] [PubMed] [Green Version]
- Pike, A.S.; Scatena, F.N. Longitudinal Patterns in Stream Channel Geomorphology and Aquatic Habitat in the Luquillo Mountains of Puerto Rico. Ph.D. Thesis, University of Pennsylvania, Philadelphia, PA, USA, 2008. [Google Scholar]
- Leon, M.C. LCZO–GIS/Map Data–Puerto Rico–(1998–2012), HydroShare. 2020. Available online: http://www.hydroshare.org/resource/cabf89b7f00f4dd4ab2c556f10aae0ef (accessed on 12 March 2021).
- Leon, M.C. LCZO-GIS/Map Data-GIS Web Map and Datasets-Northeastern Puerto Rico-(1998–Ongoing), HydroShare. 2020. Available online: http://www.hydroshare.org/resource/663a9d44e9a24b2391b2903b2bb266fc (accessed on 12 March 2021).
- Strauch, A.M.; MacKenzie, R.A.; Giardina, C.P.; Bruland, G.L. Climate driven changes to rainfall and streamflow patterns in a model tropical island hydrological system. J. Hydrol. 2015, 523, 160–169. [Google Scholar] [CrossRef]
- Sidle, R.C.; Gomi, T.; Tsukamoto, Y. Discovery of zero-order basins as an important link for progress in hydrogeomorphology. Hydrol. Process. 2018, 32, 3059–3065. [Google Scholar] [CrossRef]
- Gomi, T.; Sidle, R.C.; Richardson, J.S. Understanding processes and downstream linkages of headwater systems: Headwaters differ from downstream reaches by their close coupling to hillslope processes, more temporal and spatial variation, and their need for different means of protection from land use. BioScience 2002, 52, 905–916. [Google Scholar]
- Taylor, M.A.; Stephenson, T.S.; Chen, A.A.; Stephenson, K.A. Climate change and the Caribbean: Review and response. Caribb. Stud. 2012, 40, 169–200. [Google Scholar] [CrossRef]
- Herrera, D.A.; Ault, T.R.; Fasullo, J.T.; Coats, S.J.; Carrillo, C.M.; Cook, B.I.; Williams, A.P. Exacerbation of the 2013–2016 pan-Caribbean drought by anthropogenic warming. Geophys. Res. Lett. 2018, 45, 10619–10626. [Google Scholar] [CrossRef] [Green Version]
- Heartsill-Scalley, T.; Scatena, F.N.; Moya, S.; Lugo, A.E. Long-term dynamics of organic matter and elements exported as coarse particulates from two Caribbean montane watersheds. J. Trop. Ecol. 2012, 28, 127–139. Available online: https://0-www-jstor-org.brum.beds.ac.uk/stable/41411841 (accessed on 12 March 2021). [CrossRef]
- Datry, T.; Foulquier, A.; Corti, R.; Von Schiller, D.; Tockner, K.; Mendoza-Lera, C.; Clement, J.C.; Gessner, M.O.; Moleon, M.; Stubbington, R.; et al. A global analysis of terrestrial plant litter dynamics in non-perennial waterways. Nat. Geosci. 2018, 11, 497–503. [Google Scholar] [CrossRef]
- Sidle, R.C.; Tsuboyama, Y.; Noguchi, S.; Hosoda, I.; Fujieda, M.; Shimizu, T. Stormflow generation in steep forested headwaters: A linked hydrogeomorphic paradigm. Hydrol. Process. 2000, 14, 369–385. [Google Scholar] [CrossRef]
- Covich, A.P.; Crowl, T.A.; Heartsill-Scalley, T. Effects of drought and hurricane disturbances on headwater distributions of palaemonid river shrimp (Macrobrachium spp.) in the Luquillo Mountains, Puerto Rico. J. N. Am. Benthol. Soc. 2006, 25, 99–107. [Google Scholar] [CrossRef]


| 1 m Resolution DEM | 10 m Resolution DEM | ||||||||||
|---|---|---|---|---|---|---|---|---|---|---|---|
| Watershed | Mean Elevation (m) | Slope Degree | Mean Elevation(m) | Slope Degree | |||||||
| Site | Area m2 | Precip mm year−1 | CMS | Min | Max | Mean | Min | Max | Mean | ||
| Mameyes | |||||||||||
| Q3 | 328,497 | 3864 | 0.015 | 265 | 679 | 456 | 30 | 508 | 558 | 543 | 21 |
| Q2 | 63,536 | 3655 | 0.003 | 267 | 454 | 341 | 31 | 385 | 391 | 389 | 32 |
| Q1 | 62,412 | 3536 | 0.003 | 260 | 411 | 336 | 30 | 326 | 414 | 377 | 22 |
| Espíritu Santo | |||||||||||
| QT | 182,494 | 3516 | 0.009 | 268 | 578 | 395 | 21 | 286 | 290 | 288 | 9 |
| QS | 2,351,924 | 3861 | 0.145 | 372 | 1011 | 534 | 22 | 349 | 1033 | 761 | 17 |
| QP | 416,361 | 3642 | 0.027 | 391 | 653 | 408 | 16 | 314 | 645 | 431 | 16 |
| QPB | 237,350 | 3943 | 0.016 | 398 | 652 | 532 | 20 | 478 | 552 | 507 | 16 |
| QPA | 171,928 | 3848 | 0.011 | 401 | 628 | 532 | 23 | 484 | 642 | 582 | 19 |
Publisher’s Note: MDPI stays neutral with regard to jurisdictional claims in published maps and institutional affiliations. |
© 2021 by the authors. Licensee MDPI, Basel, Switzerland. This article is an open access article distributed under the terms and conditions of the Creative Commons Attribution (CC BY) license (http://creativecommons.org/licenses/by/4.0/).
Share and Cite
Leon, M.C.; Heartsill-Scalley, T.; Santiago, I.; McDowell, W.H. Hydrological Mapping in the Luquillo Experimental Forest: New Local Datum Improves Watershed Ecological Knowledge. Hydrology 2021, 8, 54. https://0-doi-org.brum.beds.ac.uk/10.3390/hydrology8010054
Leon MC, Heartsill-Scalley T, Santiago I, McDowell WH. Hydrological Mapping in the Luquillo Experimental Forest: New Local Datum Improves Watershed Ecological Knowledge. Hydrology. 2021; 8(1):54. https://0-doi-org.brum.beds.ac.uk/10.3390/hydrology8010054
Chicago/Turabian StyleLeon, Miguel C., Tamara Heartsill-Scalley, Iván Santiago, and William H. McDowell. 2021. "Hydrological Mapping in the Luquillo Experimental Forest: New Local Datum Improves Watershed Ecological Knowledge" Hydrology 8, no. 1: 54. https://0-doi-org.brum.beds.ac.uk/10.3390/hydrology8010054