Article

Rainfall-Induced Landslides and Erosion Processes in the Road Network of the Jaén Province (Southern Spain)

by
Ramón Carpena
1,2,
Joaquín Tovar-Pescador
3,4,
Mario Sánchez-Gómez
4,5,
Julio Calero
4,5,
Israel Mellado
5,
Francisco Moya
6 and
Tomás Fernández
4,6,*
1
Department of Mechanical Engineering, University of Jaén, 23071 Jaén, Spain
2
Municipal Infrastructures Area, Deputy of Jaén, 23071 Jaén, Spain
3
Department of Physics, University of Jaén, 23071 Jaén, Spain
4
Centre for Advanced Studies in Earth Sciences, Energy and Environment, University of Jaén, 23071 Jaén, Spain
5
Department of Geology, University of Jaén, 23071 Jaén, Spain
6
Department of Cartographic, Geodetic and Photogrammetric Engineering, University of Jaén, 23071 Jaén, Spain
*
Author to whom correspondence should be addressed.
Submission received: 31 May 2021 / Revised: 23 June 2021 / Accepted: 1 July 2021 / Published: 5 July 2021
(This article belongs to the Special Issue Rainfall-Induced Landslides Hazard)

Abstract

:
Rainfall thresholds are one of the most widely applied methods for indirectly estimating landslide return periods, which are subsequently used in hazard analyses. In this study, the starting point is an incidence database of landslides and erosive processes affecting the road network of the province of Jaén (southern Spain), in which the positions and dates of civil repair works can be found. Meanwhile, the use of a daily rainfall database in a dense grid (1 km) allowed for the estimation of the rainfall series at each incidence point with high precision. Considering the news in the local media and applying spatial proximity, temporal proximity, and maximum return period criteria, rainfall events of various duration (1 to 90 days) could be associated approximately with each point. Then, the rainfall thresholds and their return periods were estimated. A linear equation was adjusted for the rainfall duration threshold (E = 6.408 D + 74.829), and a power-law curve was adjusted for the intensity–duration pair (I = 47.961 D−0.458). Non-significant differences were observed between the thresholds and the return periods for the lower and higher magnitude incidences, but the durations for the former were lower (1–13 days), compared to those of the latter (7–22 days). From the equations, rainfall events of different durations could be estimated for use in hazard analysis, as well as for the future development of warning systems.

Graphical Abstract

1. Introduction

Landslides are considered one of the most important natural hazards worldwide, causing thousands of victims per year and costs worth billions of euros [1,2,3,4,5,6]. Landslides originate in different mountainous regions in Europe [7], such as the Alps, Norway, and the Mediterranean countries [8,9], and specifically in Spain and the Betic Cordilleras [10,11,12]. Compared with other risk phenomena, such as earthquakes or floods, the effects of landslides are more diffuse and continuous in space and time; thus, according to some studies, their impact has been underestimated [4]. Despite this, they produce significant damage to infrastructure, properties, and the environment itself, as well as interrupting socio-economic activity [1,2,3].
One of the most effective measures for risk prevention and mitigation is its evaluation which, according to the classic formulation of Varnes [1], includes both the hazard (probability that a potentially harmful phenomenon occurs in a given space and time) and the exposure and vulnerability of the elements at risk. For the former, there exist deterministic methods based on precise knowledge of the factors conditioning the instability [13]. These include geotechnical properties, terrain morphology, and the hydrological conditions usually conditioned by rainfall as the triggering factor [14,15,16,17,18]. However, the difficulty of obtaining accurate data [19], especially for studies carried out in a more or less extensive area, leads to probabilistic methods being more frequently applied in hazard studies. Probabilistic methods are based on correlation analyses between determinant factors and landslides, both by means of bivariate approaches [12,20,21] and multivariate ones [3,21,22,23]; however, in recent years, machine learning techniques have become increasingly used [21,24]. The first step in these analyses is to elaborate inventories or databases that collect the spatial locations, occurrence times (dating), and thematic attributes of the movements [11,25]. For this, direct observation, geomatics data capture techniques, and in situ or laboratory tests of the different terrain properties are used [11,26].
Among them, dating is usually one of the most complicated issues for landslides, due to their aforementioned diffuse and continuous nature [27,28]. Direct dating requires recording by direct observation or in-situ sensors; however, geomatics techniques, such as Global Navigation and Satellite Systems (GNSS), photogrammetry, optical remote sensing (ORS), LiDAR, and Interferometry of Synthetic Aperture Radar (InSAR), have allowed for important advances, especially following their spatial and temporal resolution increases [29,30]. Another option is indirect dating from triggering factors [26,31], such as earthquakes and/or rainfall, which are more easily recorded by different instruments, usually gauges or digital sensors. Considering that rainfall is the triggering factor in most cases, it is necessary to establish the relationship between rainfall and landslides, which have been done in numerous studies worldwide [32,33,34,35,36,37,38].
Many of these studies have allowed the calculation of rainfall thresholds using empirical methods [9,19,28,36,39,40,41,42,43,44,45,46,47,48,49,50,51,52,53,54], especially for shallow movements (debris and mud flows, shallow slides and even erosion processes, especially gullies [55,56]), where the correlation with intense rainfall events is clearer, although it has also been applied to deep ones [40]. As in the aforementioned deterministic methods [14,15,16,17,18], these thresholds are based on the fact that an increase in rainfall leads to a change in the hydrological soil conditions and then in slope instability. Thus, some approaches have used not only the triggering rainfall, but the antecedent rainfall that influences the hydrological conditions [16,18,19,32,35,40,57,58] and, in some cases, so-called hydro-meteorological thresholds have been developed [59,60,61,62]. Other studies have considered the influence of conditioning factors on the thresholds [45,50], even the main annual precipitation (MAP) [47,63].
In some works, very precise knowledge of the rainfall data (hourly), as well as the moment in which the movement starts, have been used [9,19,41,42,43,44,45,46,47,48,49,50,53]; meanwhile, in others, only the daily rainfall data are known [28,36,40,51,52]. There are even cases in which the landslide time or date can only be approximated [36,40,43,51] and reconstructed after subsequent inventories and/or reviews from the news found in the media [28,40,51,52]. In any case, following [42], different variables can be used to define these thresholds, such as the total event rainfall (E), rainfall event–duration (E–D), intensity–duration (I–D), and rainfall event–intensity (E–I). Although most studies have been carried out at the local level, there are some cases of application over large regions [42,43,44,45,46], as well as works and databases that collect indices all over the world [43,54]. Moreover, some works have led to the development of algorithms and computational tools that can calculate these thresholds [48,49].
Once the thresholds are determined, they can be applied to predict the probability of landslide occurrence by determining the return periods [19,28,36,40,41,51,52], which can be incorporated into the corresponding hazard maps [64,65]. Likewise, they can be integrated into (early) warning systems [21,63,64], which can prevent the population and authorities from being subjected to landslides in those cases in which the rainfall threshold is reached.
The objective of this study is the determination of rainfall thresholds that cause landslides or erosion processes associated with the road network of the Jaén province. For this, an incidence inventory or database between 1997 and 2013 and a rainfall database between 1971 and 2016 are available. Then, news from the local media were also considered in the analysis that allowed associating incidences with rainfall events. This has led to the calculation of rainfall thresholds and the return periods, thus allowing for hazard modelling in the province of Jaén and the development of warning systems in future works.

2. Materials and Methods
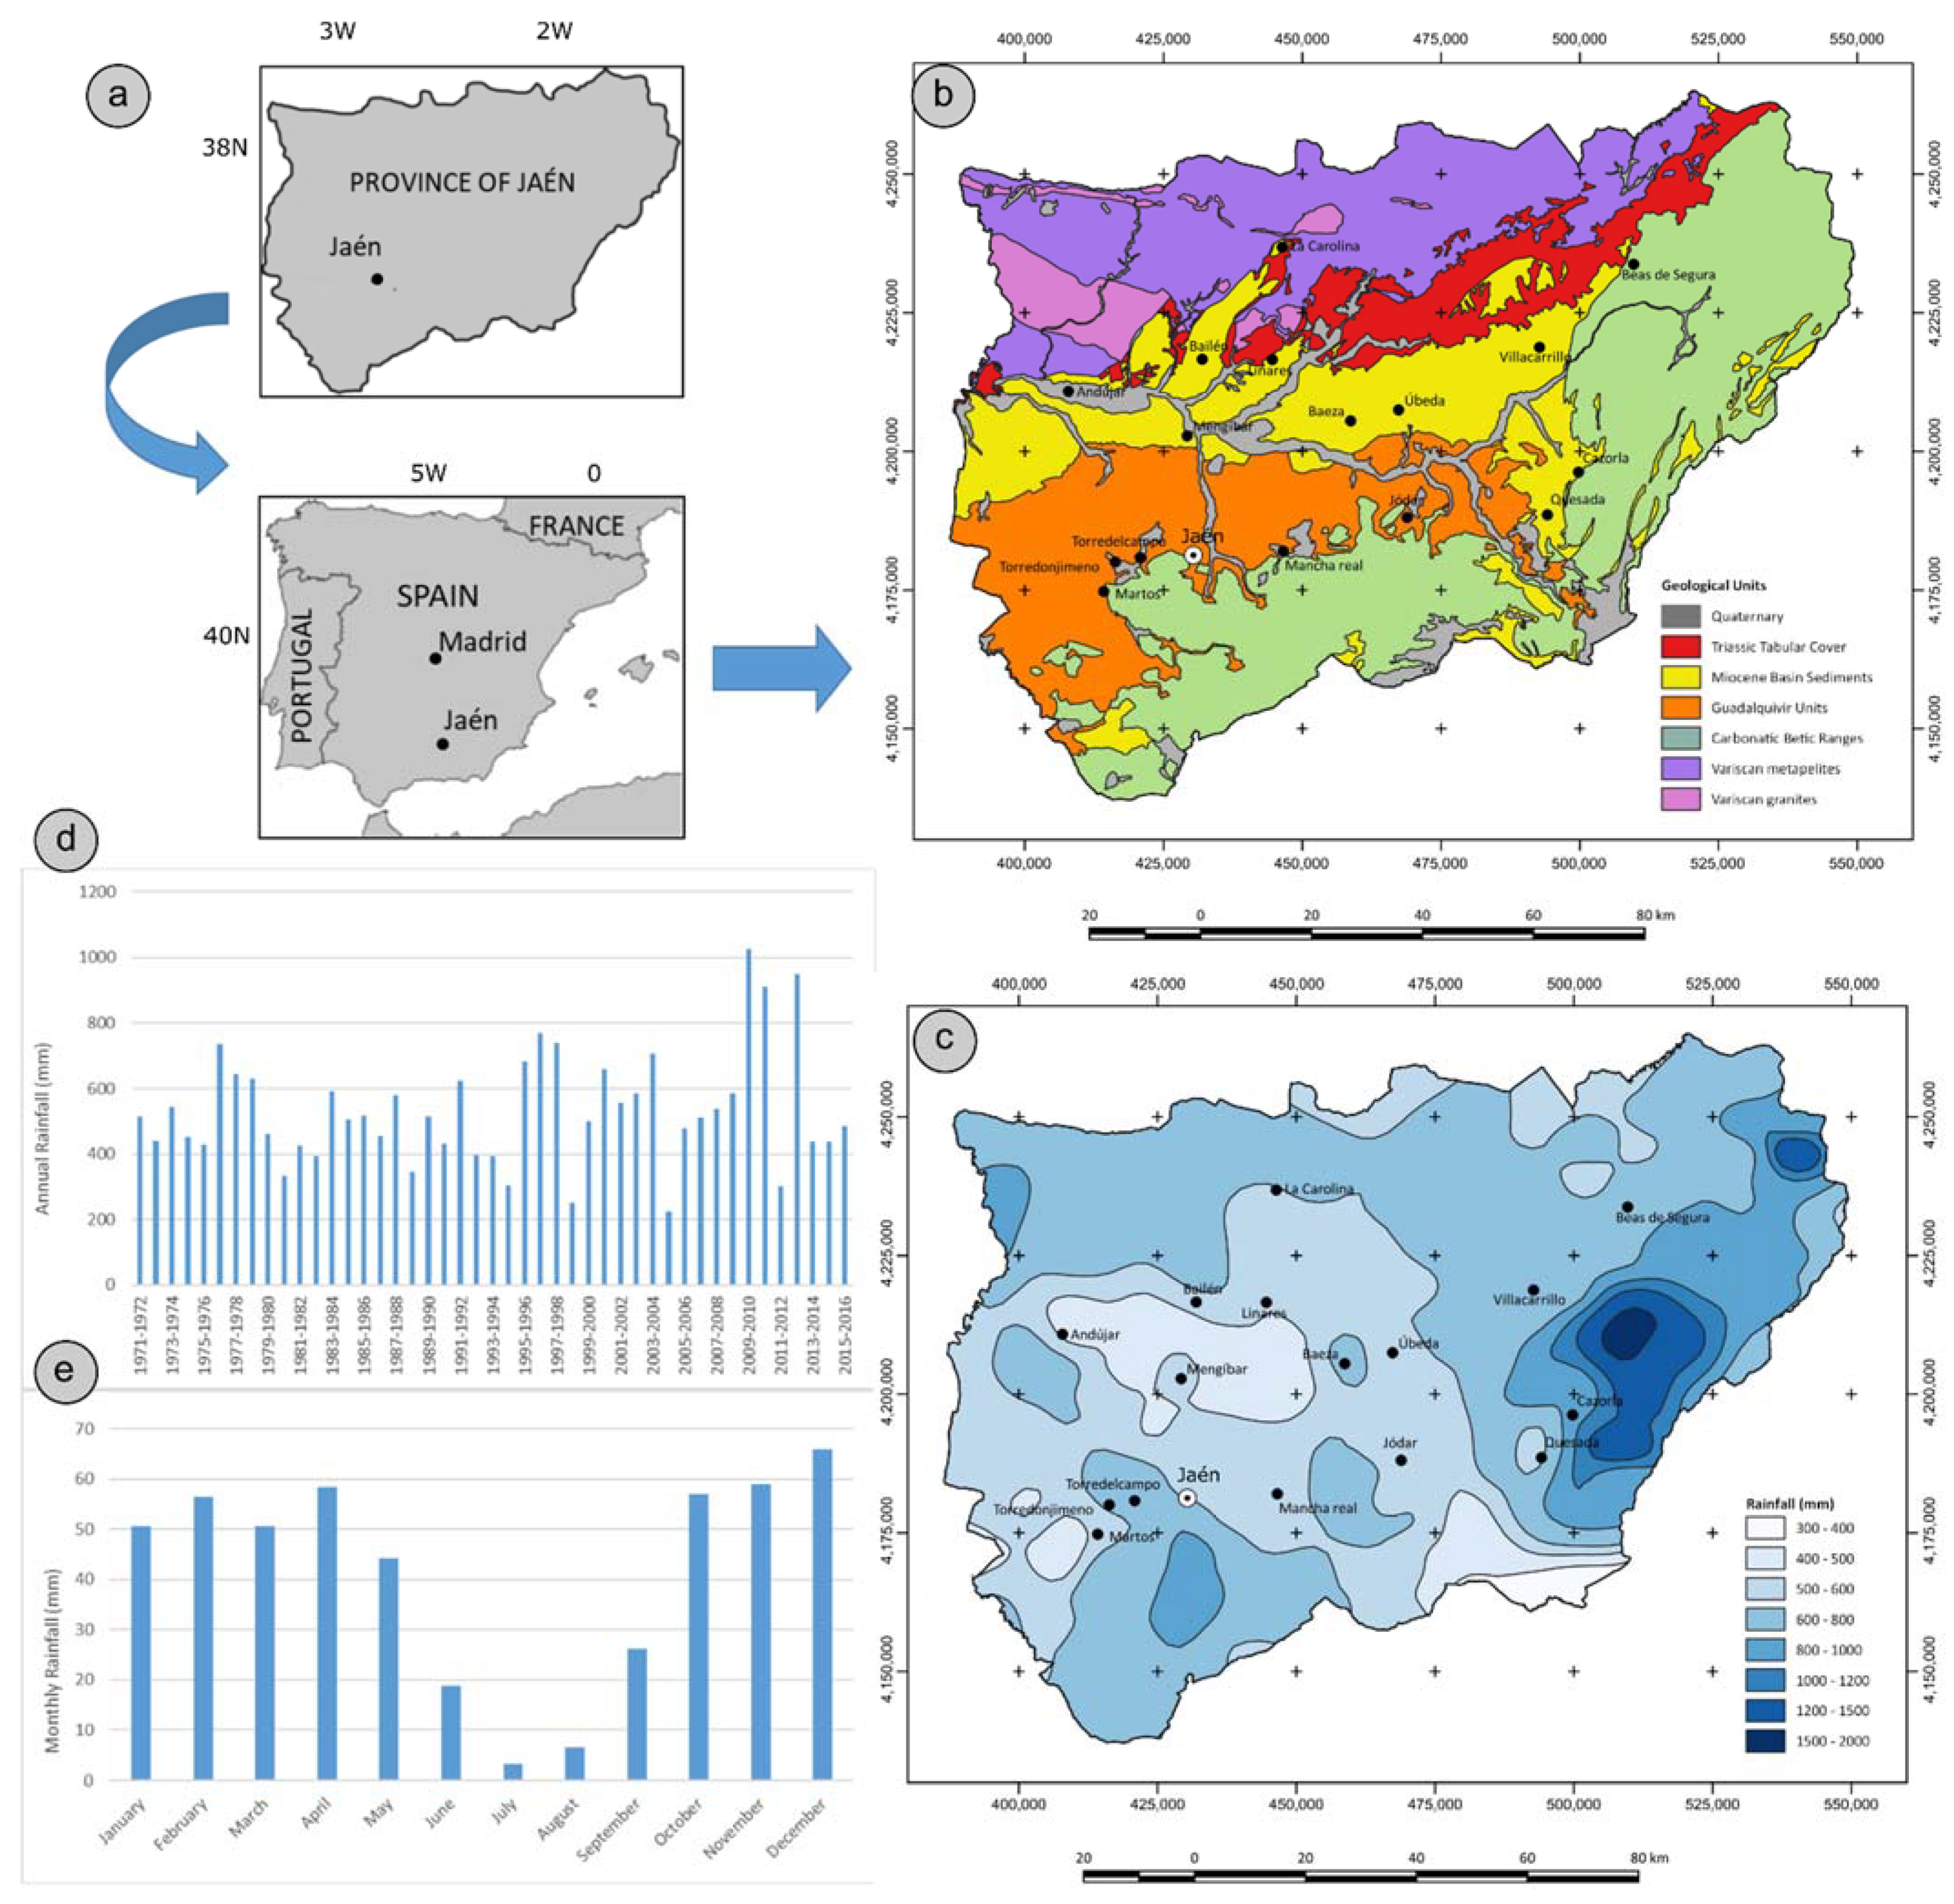
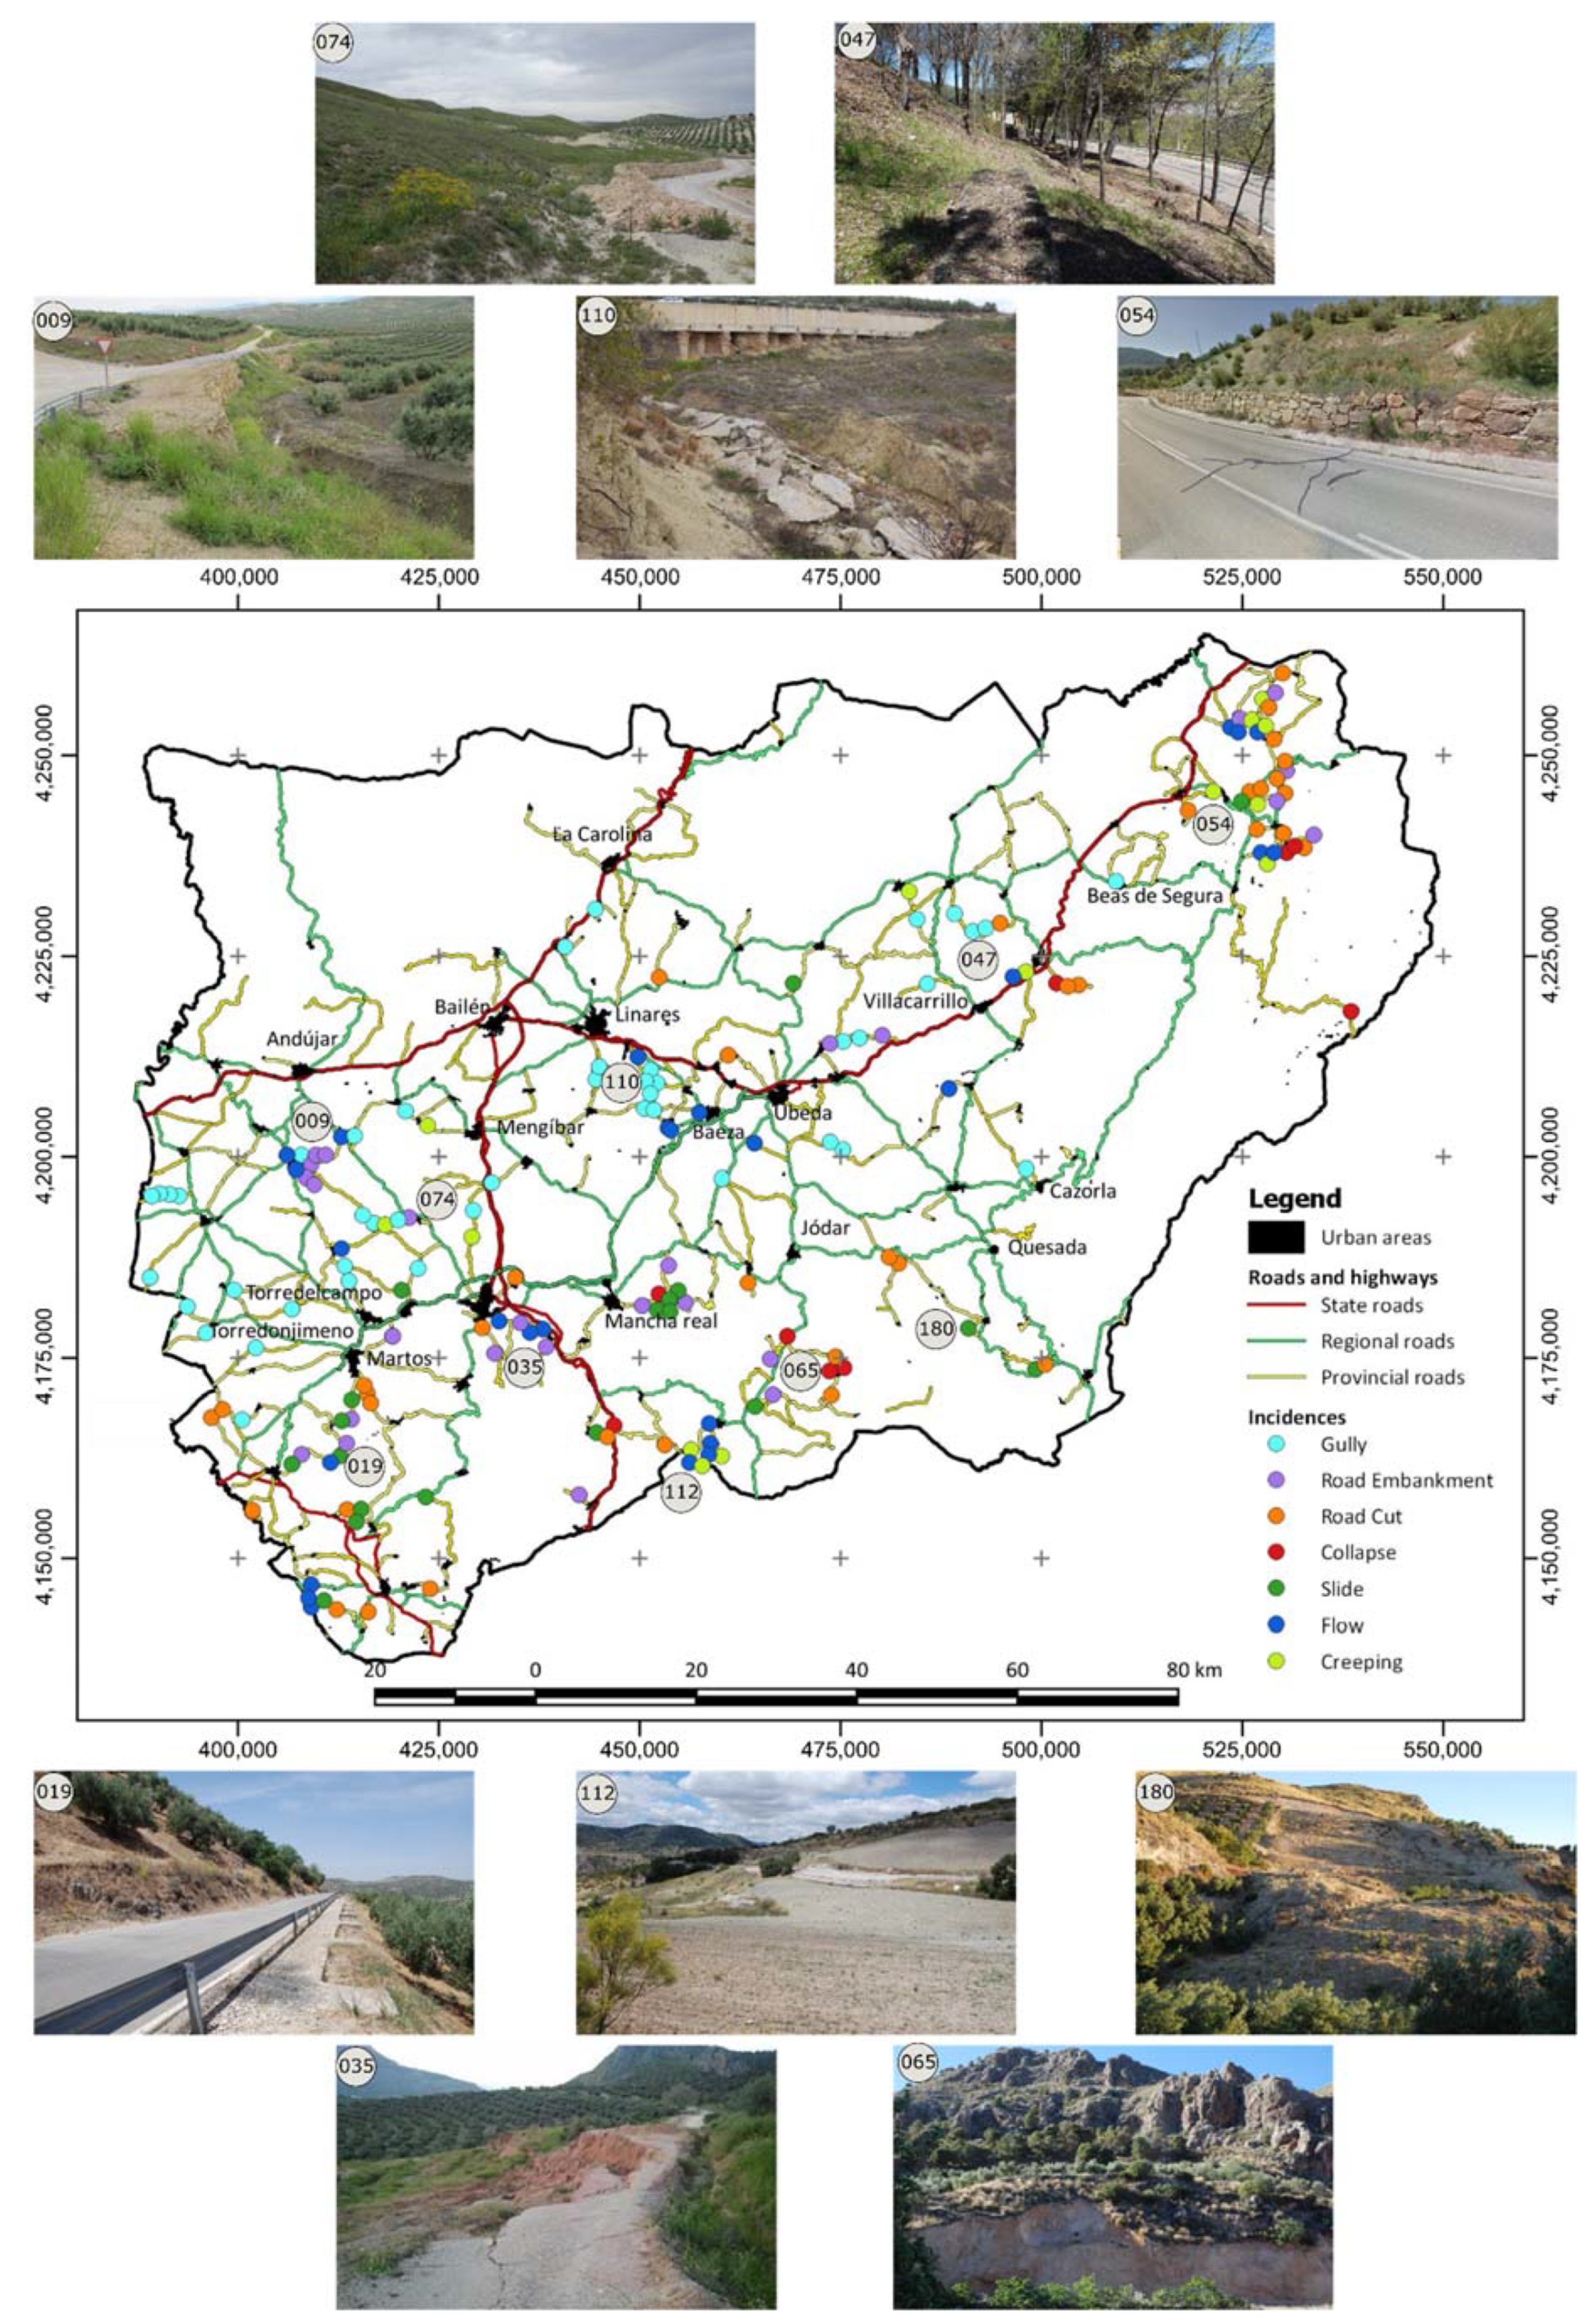
2.1. Study Area

The study area (Figure 1) corresponds to the province of Jaén (13,486 km2). It coincides approximately with the natural region of the eastern or upper Guadalquivir River basin. The altitude ranges between 152 and 2160 m, with an average value of 715 m. The average slope is 12.21°, although it is also very variable between the mountain ranges and the lower lands of the Guadalquivir valley.
From the geological and morphological point of view, three domains can be distinguished which, from South to North, are as follows (Figure 1b):
  • The External Zones of the Betic Cordillera, which are made up of mesozoic and cenozoic carbonate or loamy-clayey rocks, structured as a fold and thrust belt from the lower Miocene to the present [66], in which several paleogeographic domains appear (Prebetic and Subbetic). The Betic External Zone form several mountain ranges (Sierra Cazorla and Segura, Sierra Mágina and Sierra Sur of Jaén), partially isolated by main rivers and tributaries of the Guadalquivir River.
  • The sedimentary infill of the Guadalquivir basin, differentiated into two parts. In the north, the Guadalquivir basin is filled with Miocene loamy and clayey sediments, which are slightly deformed and which overlie the tabular cover of the Iberian Massif, made up of Triassic clays and sandstones and Jurassic limestones. In the south, the infill of the basin is highly deformed by the Betic Miocene displacements, which incorporate tectonically Betic soft materials as Triassic evaporites (salt and gypsum) or Cretaceous clayey marls [66].
  • The Variscan Domain, which constitutes the outcropping basement of the Iberian Massif, in which metapelites (slates, grauwackes, and so on) and intruding igneous rocks (granites and granodiorites) are the predominant lithologies.
Over all these materials, quaternary deposits related to present fluvial dynamics and slope sediments are located.
From the climatic point of view, the province of Jaén corresponds mostly to the hot summer Mediterranean (Csa de Koppen) [67] climate type. More specifically, it can be catalogued as the Mediterranean meridional type of the Guadalquivir valley [68]. This is characterized by a mean annual precipitation (MAP) between 500 and 650 mm, with maximum values distributed between the autumn, winter, and spring and minimum values in the summer. Meanwhile, the average temperatures are 17–18.5 °C, with very pronounced maximum values in summer. However, there are sectors in the province with MAP higher than 1000 mm in the mountain ranges (Mediterranean mountain), and others with MAP that does not reach 400 mm in the southeast (Mediterranean arid), as shown in Figure 1c.
Thus, at a central point representative of the average physical conditions of the province (point 066 of the incidence database, see below), the MAP was 533 mm within the period considered (1971–2016), with a minimum value of 223 mm in the hydrological year 2004–2005 and a maximum value of 1026 mm, which was reached in 2009–2010 (Figure 1d). This wide interval shows the variability of precipitation over the years, with a standard deviation of 172 mm and coefficient of variation of 0.32. Within the year, rainfall was higher between November and April (50–60 mm) and lower between June and September (below 25 mm), with a monthly average rainfall of 41.4 mm (Figure 1e).
The predominant land-use is agricultural crops; within them, olive grove constitutes 44% (5928 km2) of the province’s surface area [69]. To a lesser extent, other crops (e.g., cereal) and areas of natural vegetation appear in the mountains, along with scrub and coniferous/hardwood forests.
The province has a population of 638,000 inhabitants, with only 2 urban areas exceeding 50,000 inhabitants [70], and a low industrial activity focused on agriculture. On the other hand, it has a road network of different orders (state, regional, and provincial), in which the A-44 and A-316 highways stand out. This study is focused on the extensive and penetrative road network of the Provincial Deputy of Jaén, which is about 1600 km long. This network is a fairly representative sample of the different physical environments of the province and, so, its study can provide valuable information on the instability conditions, not only in the network environment, but also in the whole province.

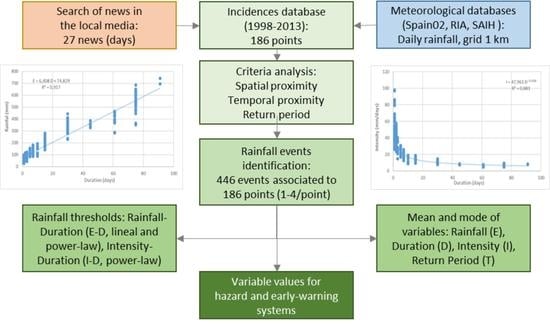
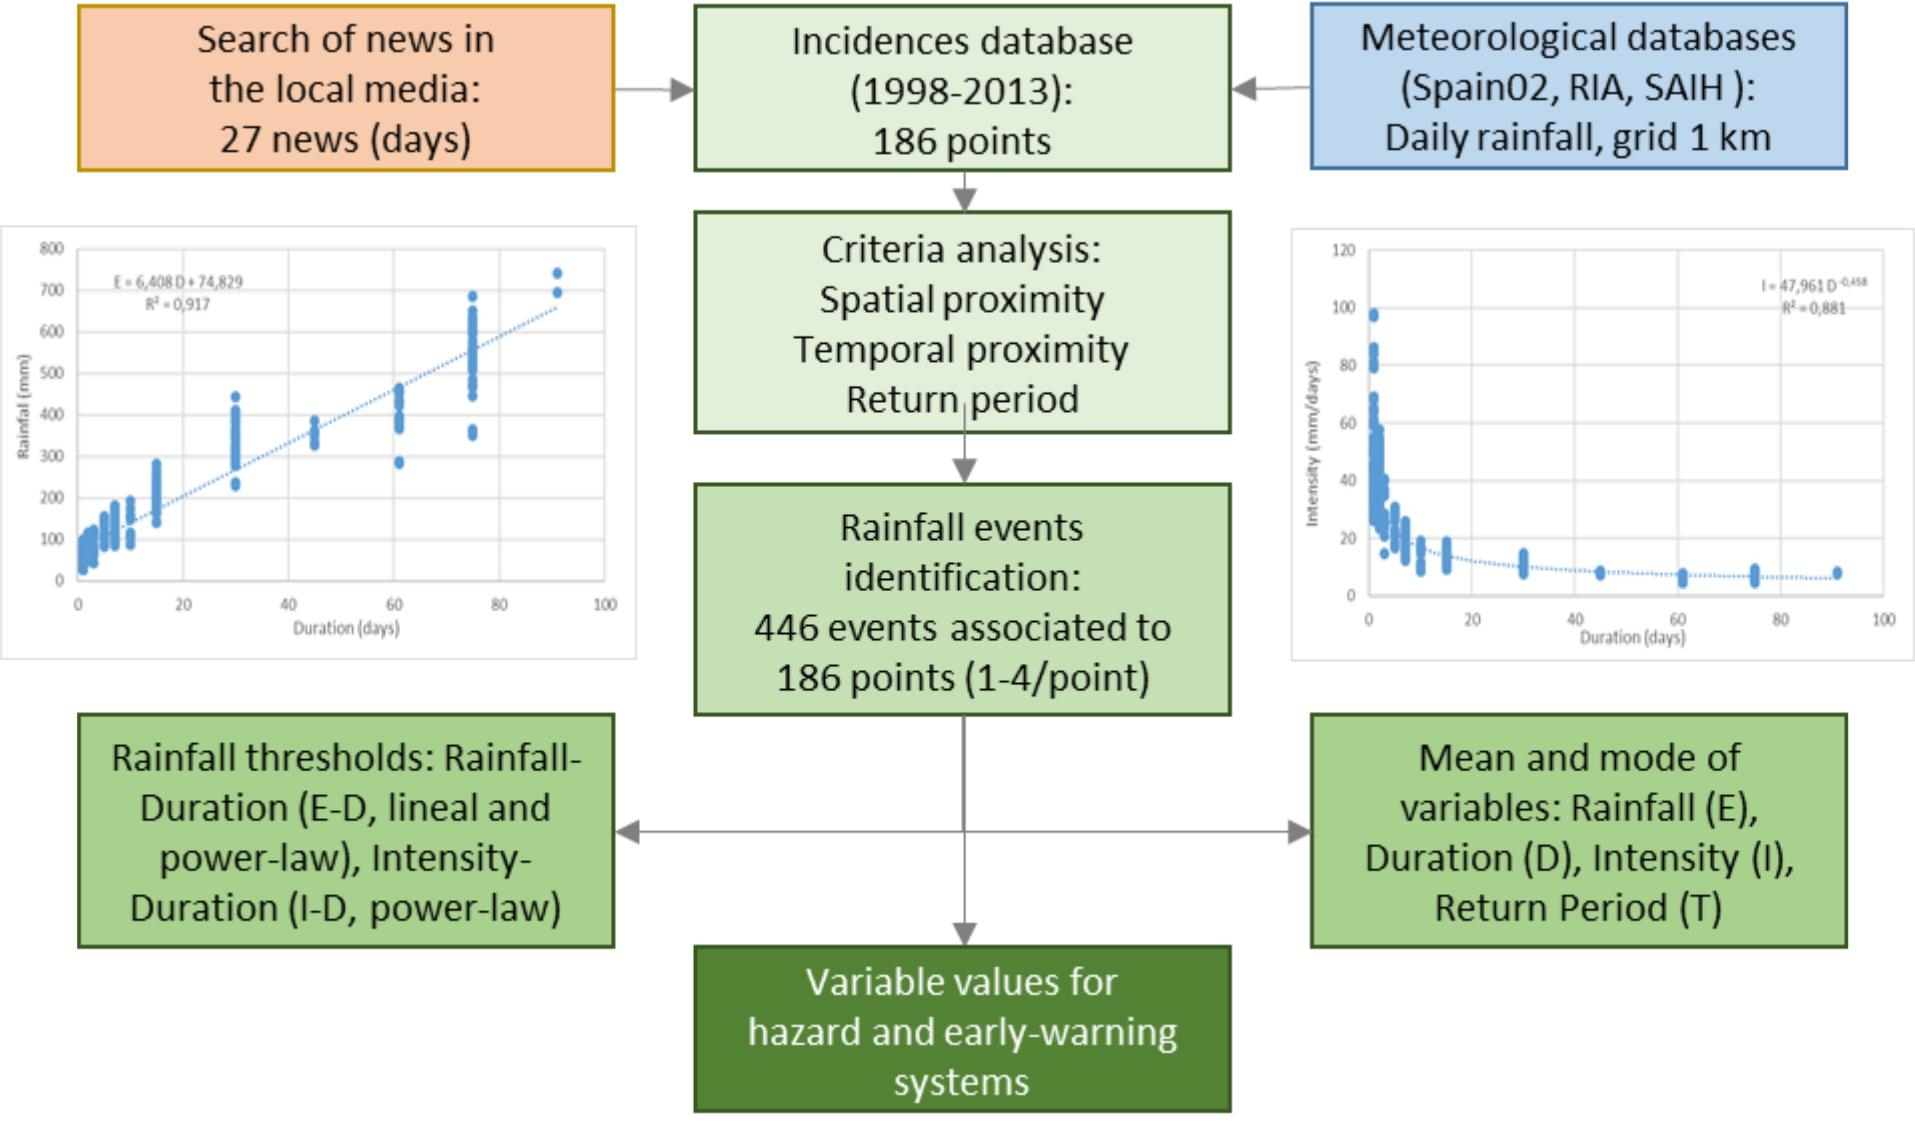
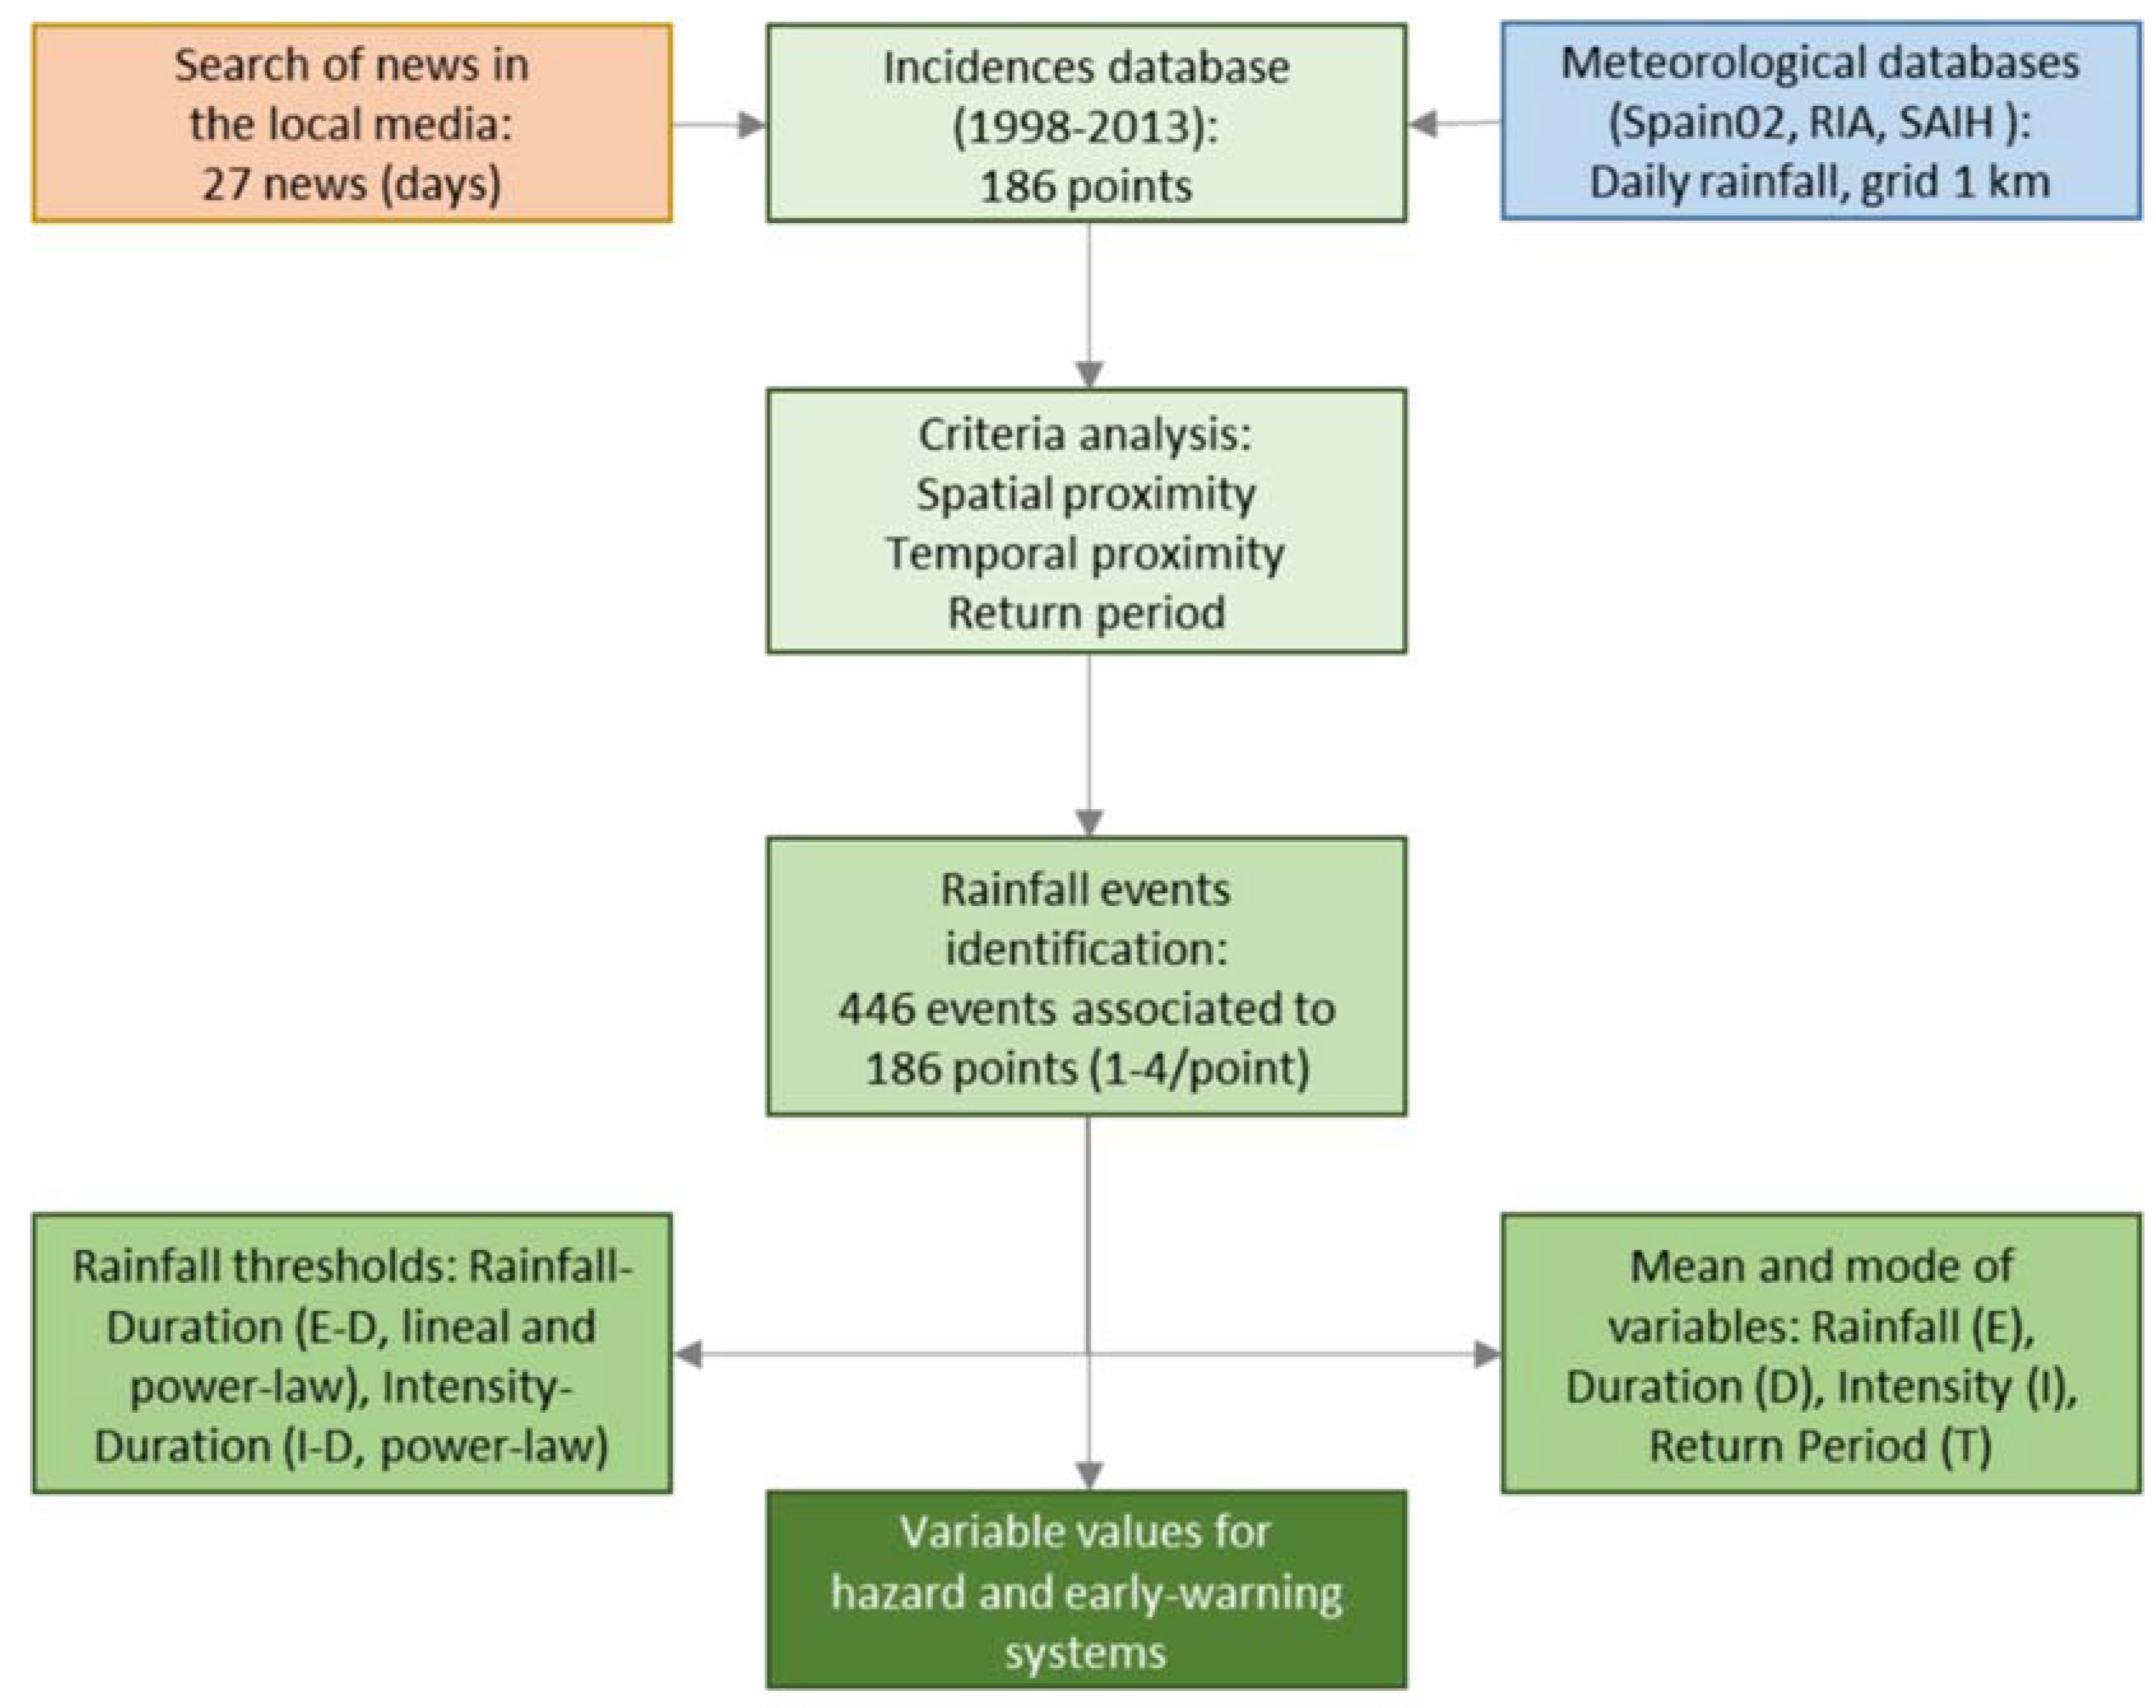
2.2. Incidence Database

The overall methodology followed in this study is shown in Figure 2. The first step is the elaboration of the database of incidences on the road network of the Jaén province. This includes data extracted from the files of the works carried out for their repair and maintenance, completed with field data and other data extracted from previous maps. The database has been elaborated through the years, by gathering information on road interventions that took place from 1998 to 2013.
Thus, the original database included data identifying the incidence (coordinates, project, works, and so on); vegetation and land-use; geomorphological and topographic data; geotechnical data (load capacity, constructive conditions, and so on); hydrogeology (drainage and permeability); description of the incidence (year, month, typology of incidence, roads, kilometres, and so on); geology (lithology and surface formations); road data (road surface, slope, curvature radius, and so on); and, finally, the constructive solution adopted. The database was subsequently tested on the ground, especially with regard to geology and the descriptions of the incidences, as well as morphological aspects.
Finally, the recorded and reviewed incidences were digitized onto the orthophotography and subsequently refined using several GIS tools (e.g., clipping, buffering). The result was an enriched incidence inventory or database of the road network of the province. A basic distinction was made between two categories: the lower magnitude and shallower processes that affect the road surface, road cuts, and embankments; and the higher magnitude processes that involve a certain general slope instability. Among the former, the following types were differentiated: erosive processes (gullies), undercut of road embankments, and small slides and collapses of the road cuts. Among the latter, slides, earth or mud flows, and creeping processes were differentiated. The inventory is presented and described in Section 3.1.

2.3. Rainfall Data Processing

Different meteorological databases were used to estimate the rainfall series:
  • Spain02 Database, high-resolution daily precipitation data, developed by the Institute of Physics of Cantabria (Spain) and the Spanish Meteorological Agency (AEMET) from a dense network of more than 2500 quality-controlled stations for precipitation and near 250 for temperatures. The Spain02.v5 provides daily data from 1951 to 2015, gridded in increments of 0.1°, corresponding approximately to a resolution of 10 km [71,72].
  • RIA database, a network of agroclimate information by the Department of Agriculture, Fisheries, and Rural Development of the Andalusian Government [73]. It contains updated data on the networks of automatic meteorological stations (~120 stations), which are equipped with electronic sensors and distributed throughout the Andalusian territory.
  • Database of the network of the Automatic Hydrological Information System (SAIH) from the Authority of the Guadalquivir River Hydrographical Basin [74].
  • Data obtained by the Atmosphere and Solar Radiation Modeling (MATRAS) research group from the Weather Research and Forecasting (WRF) model using the Integrated Forecasting System (IFS) reanalysis data provided by the European Centre for Medium-Range Weather Forecasts (ECMWF) and local data of the meteorological station of the University of Jaén [75].
The data processing comprised the integration of the previous databases and the application of physical and statistical filters, which allowed us to obtain an interpolated regular grid at 1 km. This grid was used to assign a daily rainfall value, from 1971 to 2016, to each of the 186 incidence points of the road network in the province of Jaén. The value assigned was that of the closest grid node which, taking into account its resolution, is a point located at a small distance (lower than 1 km). For the daily precipitation values in the province of Jáen, three zones can be considered, in two of which the WRF underestimates the precipitation and, in the other, it is weakly overestimated. To reduce the uncertainty of the data provided by the WRF, we used data obtained at ground stations as control points. Using geostatistical techniques, the uncertainty was less than 12% in all cases. Therefore, although the densification of the grid tended to smooth the real values, the estimation error and the uncertainty derived was low.

2.4. Rainfall Event Identification

The identification of rainy events associated with the landslides and erosive processes in the study area was based on relating the incidence database with the rainfall series.
First, from the daily data, the accumulated rainfall over 2 days, 3 days, 5 days, 7 days (1 week), 10 days, 15 days, 30 days (1 month), 45 days, 60 days (2 months), 75 days, and 90 days (3 months) were calculated, in order to analyse the influence of short- and medium-term rainfall on the generation of landslide and erosion processes.
Then, different rainfall variables could be defined: rainfall amount associated with the event (E) in mm; duration of the event (D) in days; and the intensity (I), which was calculated as the relationship between the rainfall and the duration of the event and expressed in mm/day. For each rainfall event–duration (E–D) pair, the probability of exceedance and return period (T) in years were calculated considering a Weibull series, as in previous studies [36,40,51,52].
Meanwhile, the incidence database only included information about the month in which the civil work started, while the accurate date when the incidence occurred remained unknown. Thus, additional information was used, in order to estimate a more precise date. For this, we used information found in the media, especially the news published in the local and regional press, such as the IDEAL newspaper [76], which has a historical record since 2006 and can be accessed freely on the internet. This approach has been used in some previous works [28,40]. After a deep search, based on terms such as landslides (and their synonymous terms in Spanish), road affected, traffic interruption, and so on, a total of 98 news items were found between 2006 and 2013, of which 27 events were directly related to the incidences (i.e., landslides or erosive processes). These are summarized in Table 1.
Then, three criteria were applied: the spatial proximity, the temporal proximity, and the magnitude of the rainy event.
  • The spatial proximity between the approximate location in the media and the incidence coordinates were estimated in the GIS. First, sections of roads and affected towns or municipalities mentioned in the news were selected. Then, a spatial query allowed for the identification of those incidences close to them. Five classes were established, depending on the distance: Class 1, 0–1 km; Class 2, 1–2 km; Class 3, 2–5 km; Class 4, 5–10 km; and Class 5, more than 10 km.
  • The temporal proximity was addressed by analysing the time interval between the date of the news appearing in the local media and the month associated with the previously selected incidences. Five classes were also considered: Class 1, 0–3 months; Class 2, 3–6 months, Class 3, 6–12 months, Class 4, 12–24 months; and Class 5, more than 24 months. Summing the classes for the spatial and temporal proximities, only those incidences with a maximum of 6 points (e.g., Class 3 in both, or Classes 2 and 4 in each one) were selected. Thus, each incidence point could be associated with several rainfall events and their rainfall–duration (E–-D) pairs. In addition to the events identified from the news, the complete rainfall series for the two years previous to the month of each incidence were examined, searching for the major events in each interval of duration. If events different from the above were found, they were also added to the database.
  • Finally, the magnitudes of the rainfall events were considered. First, following some previous studies [36,40,51], the E–D pair with the longest return period was selected, for each of the events associated with an incidence, as the one most likely to trigger it. Moreover, according to [40], of all the possible events (E–D pairs) associated with each incidence, those which presented a return period of fewer than five years were discarded, as they were considered non-relevant for incidence triggering. This procedure allowed for enrichment of the incidence database, thus including several E–D pairs for each incidence (see some examples in the results Section 3.2).

2.5. Rainfall Threshold Calculation

Prior to the determination of the thresholds, the rainfall variables were analysed, by calculating their mean and modal values, both globally and for each of the typologies considered, in order to determine whether there were differences between the landslides of different typologies and magnitudes.
In this work, the determination of thresholds of the rainfall–duration (E–D) type was considered, which usually respond to linear equations of the type:
E = a × D + b,
although equations with a power-law can also fit:
E = α Dβ.
This type of threshold has been considered more appropriate for cases where only daily data are available [28,51,52]. They allow for knowledge of the amount of rainfall necessary to generate landslide or erosive processes, depending on the number of days. Nevertheless, thresholds of the intensity–duration (I–D) type were also determined, although these are more commonly used when intensity per hour (mm/hour) data are available [42,43]. In this case, power-law equations were adjusted. Both thresholds were calculated globally for all the incidence points, but they were also discriminated by typologies.

3. Results

3.1. Incidence Database

The incidence database is shown in the map of Figure 3. It shows the typology and magnitude of the incidences, according to published classifications of landslides [77,78], and includes some significant examples in the study area. In general, practically all the incidences corresponded to shallow phenomena but, within them, two types were differentiated, depending on their size or magnitude [79]:
  • Very shallow processes, with magnitude between extremely and very small (<5000 m3). These correspond to ruptures in the road cut, either of the slide or collapse-rockfall typologies, but also undercuts of the road embankment. Meanwhile, erosive processes (gullies) were identified, which also produce incidences on the roads.
  • Shallow processes in which there is mobilization of the slope where the road is located, with a magnitude generally between small and medium (5000–500,000 m3). Within these, slope movements of a slide or flow type were considered, according to [77,78]. Soil creeping processes were also distinguished from those flows which were well-defined in the landscape.
The distribution by typology is shown in Table 2. As can be observed, there were 46 incidences corresponding to gully processes, 47 punctual incidences in road cuts (38 landslides and 9 collapses), and 30 incidences associated to undercutting in road embankments. Then, 77 incidences were directly related to the road; that is, to human activity. Moreover, there were 63 landslides of higher magnitude, among which 21 slides, 26 flows, and 16 creeping areas were identified.
Meanwhile, Table 3 shows the distribution of the year in which the civil works to repair the road started. Most of them were concentrated into two years, 2010 (61 incidences) and 2013 (70 incidences).

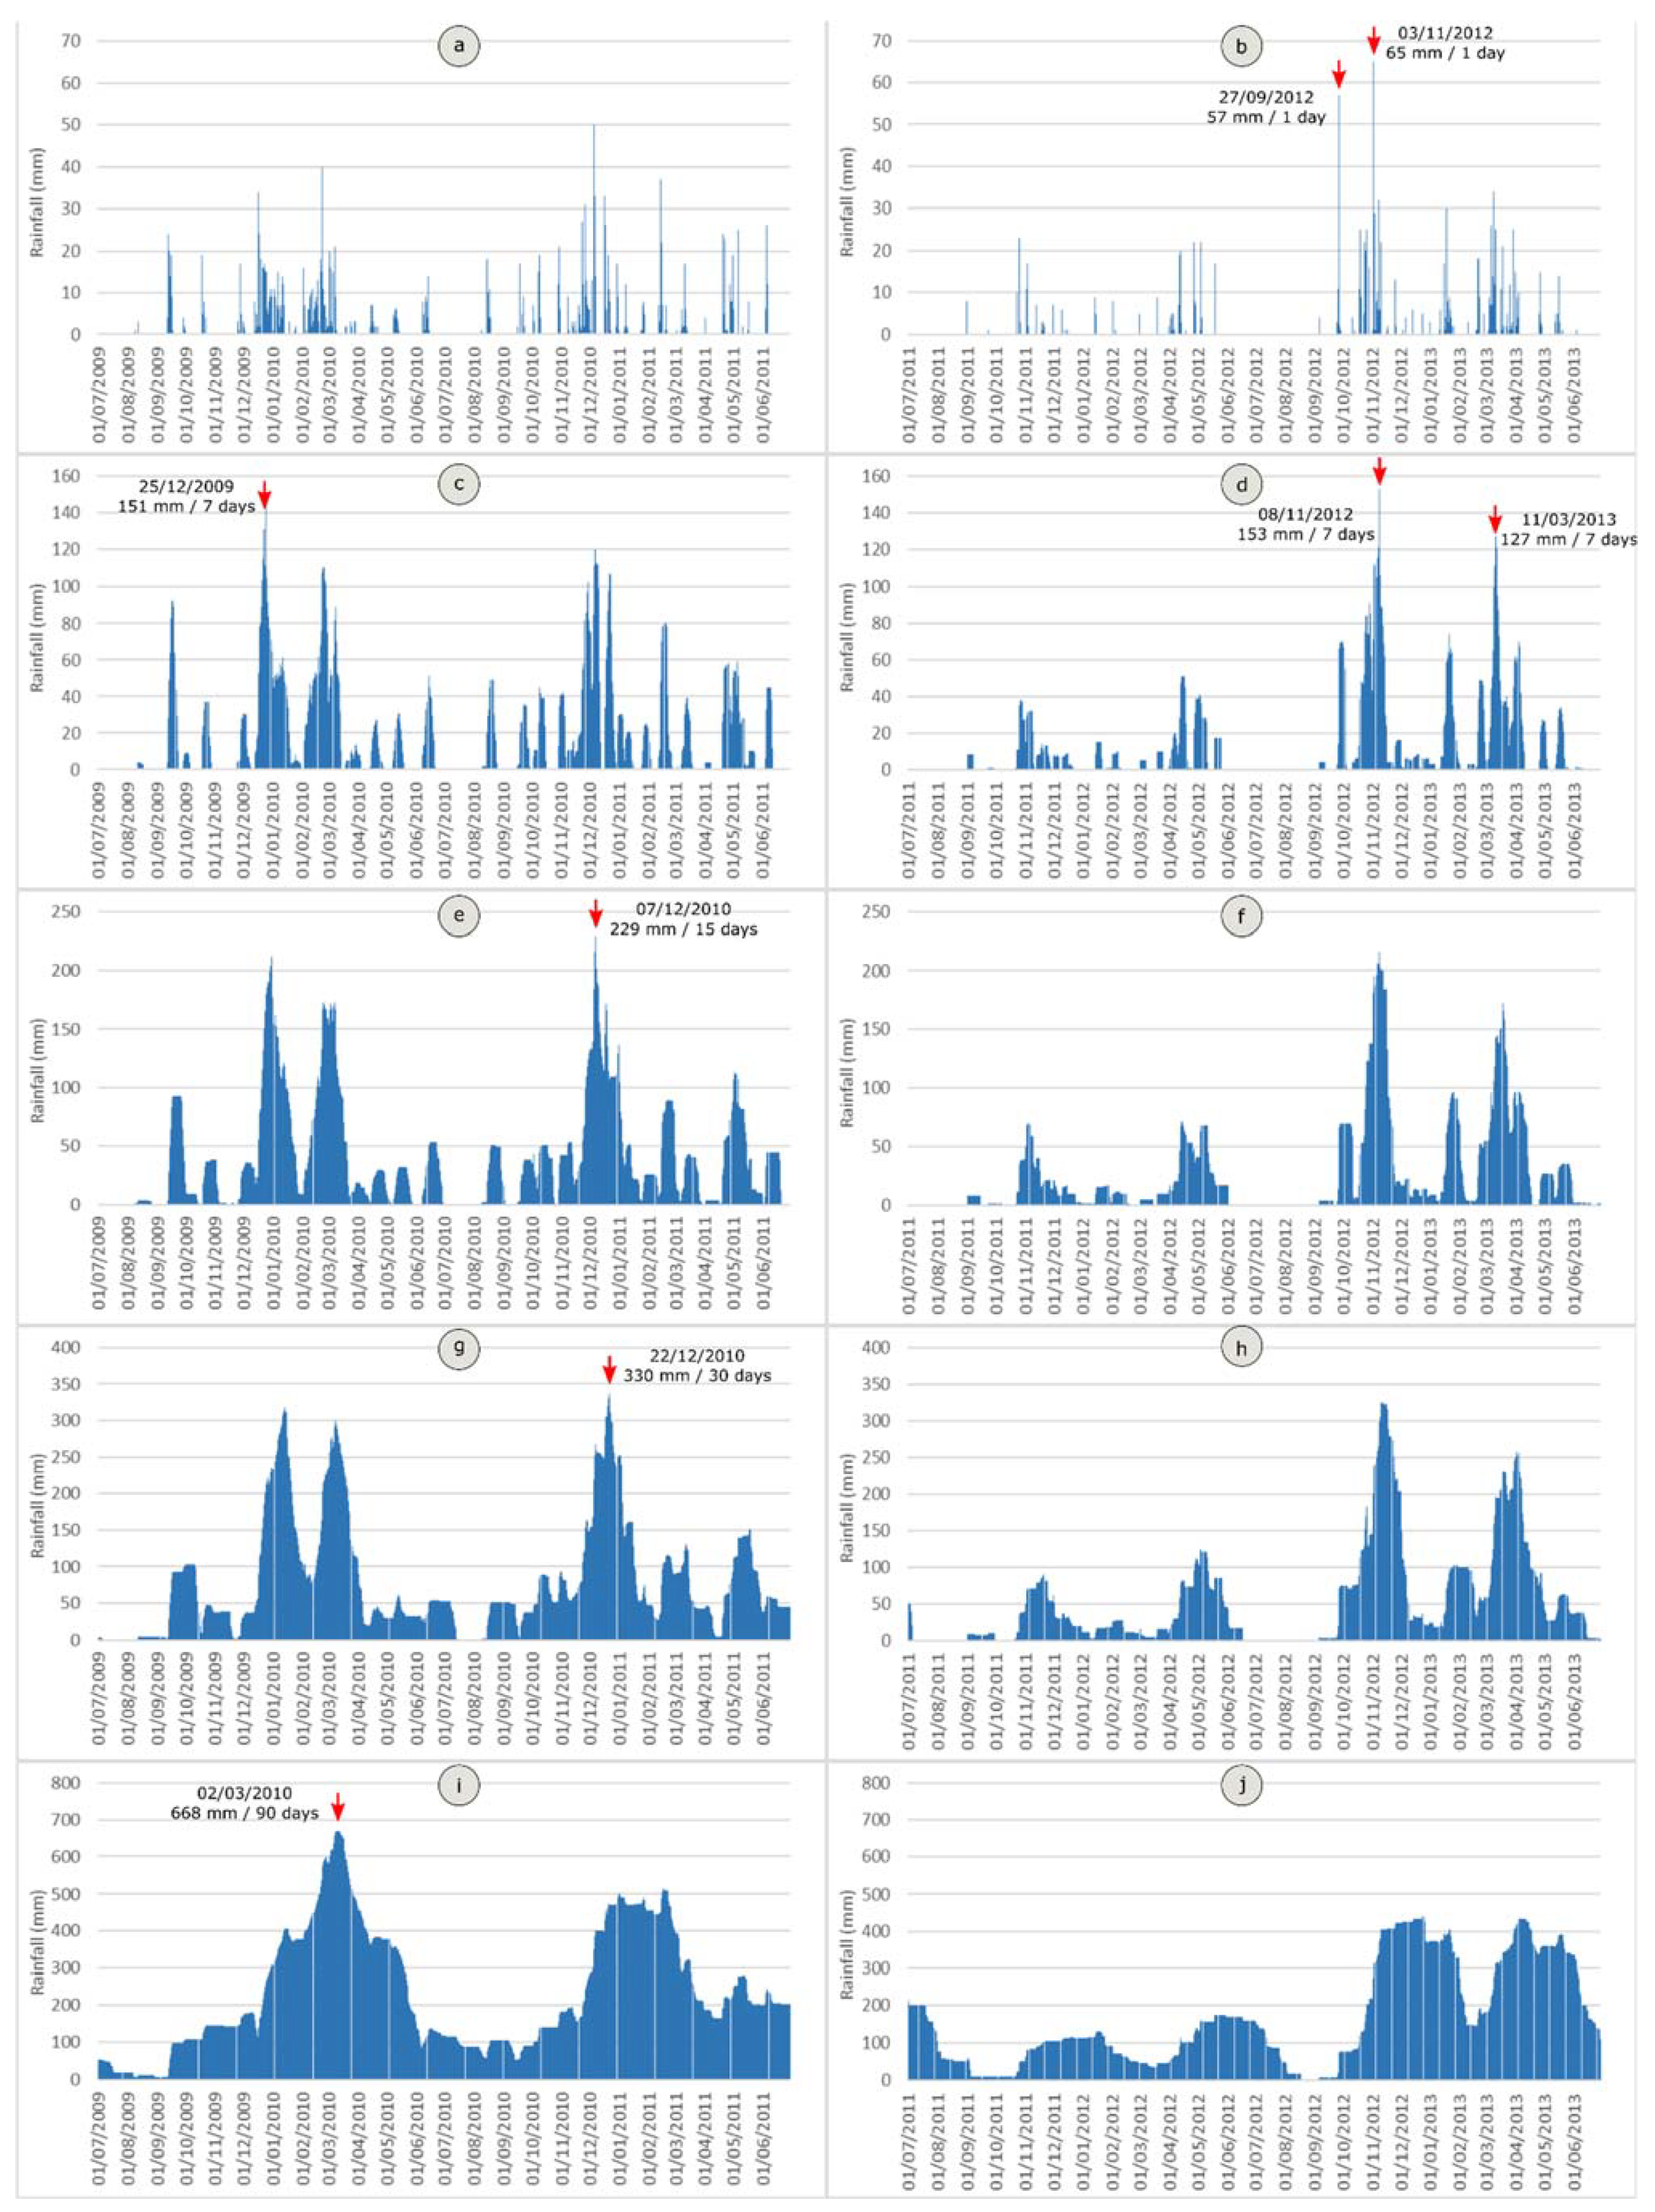
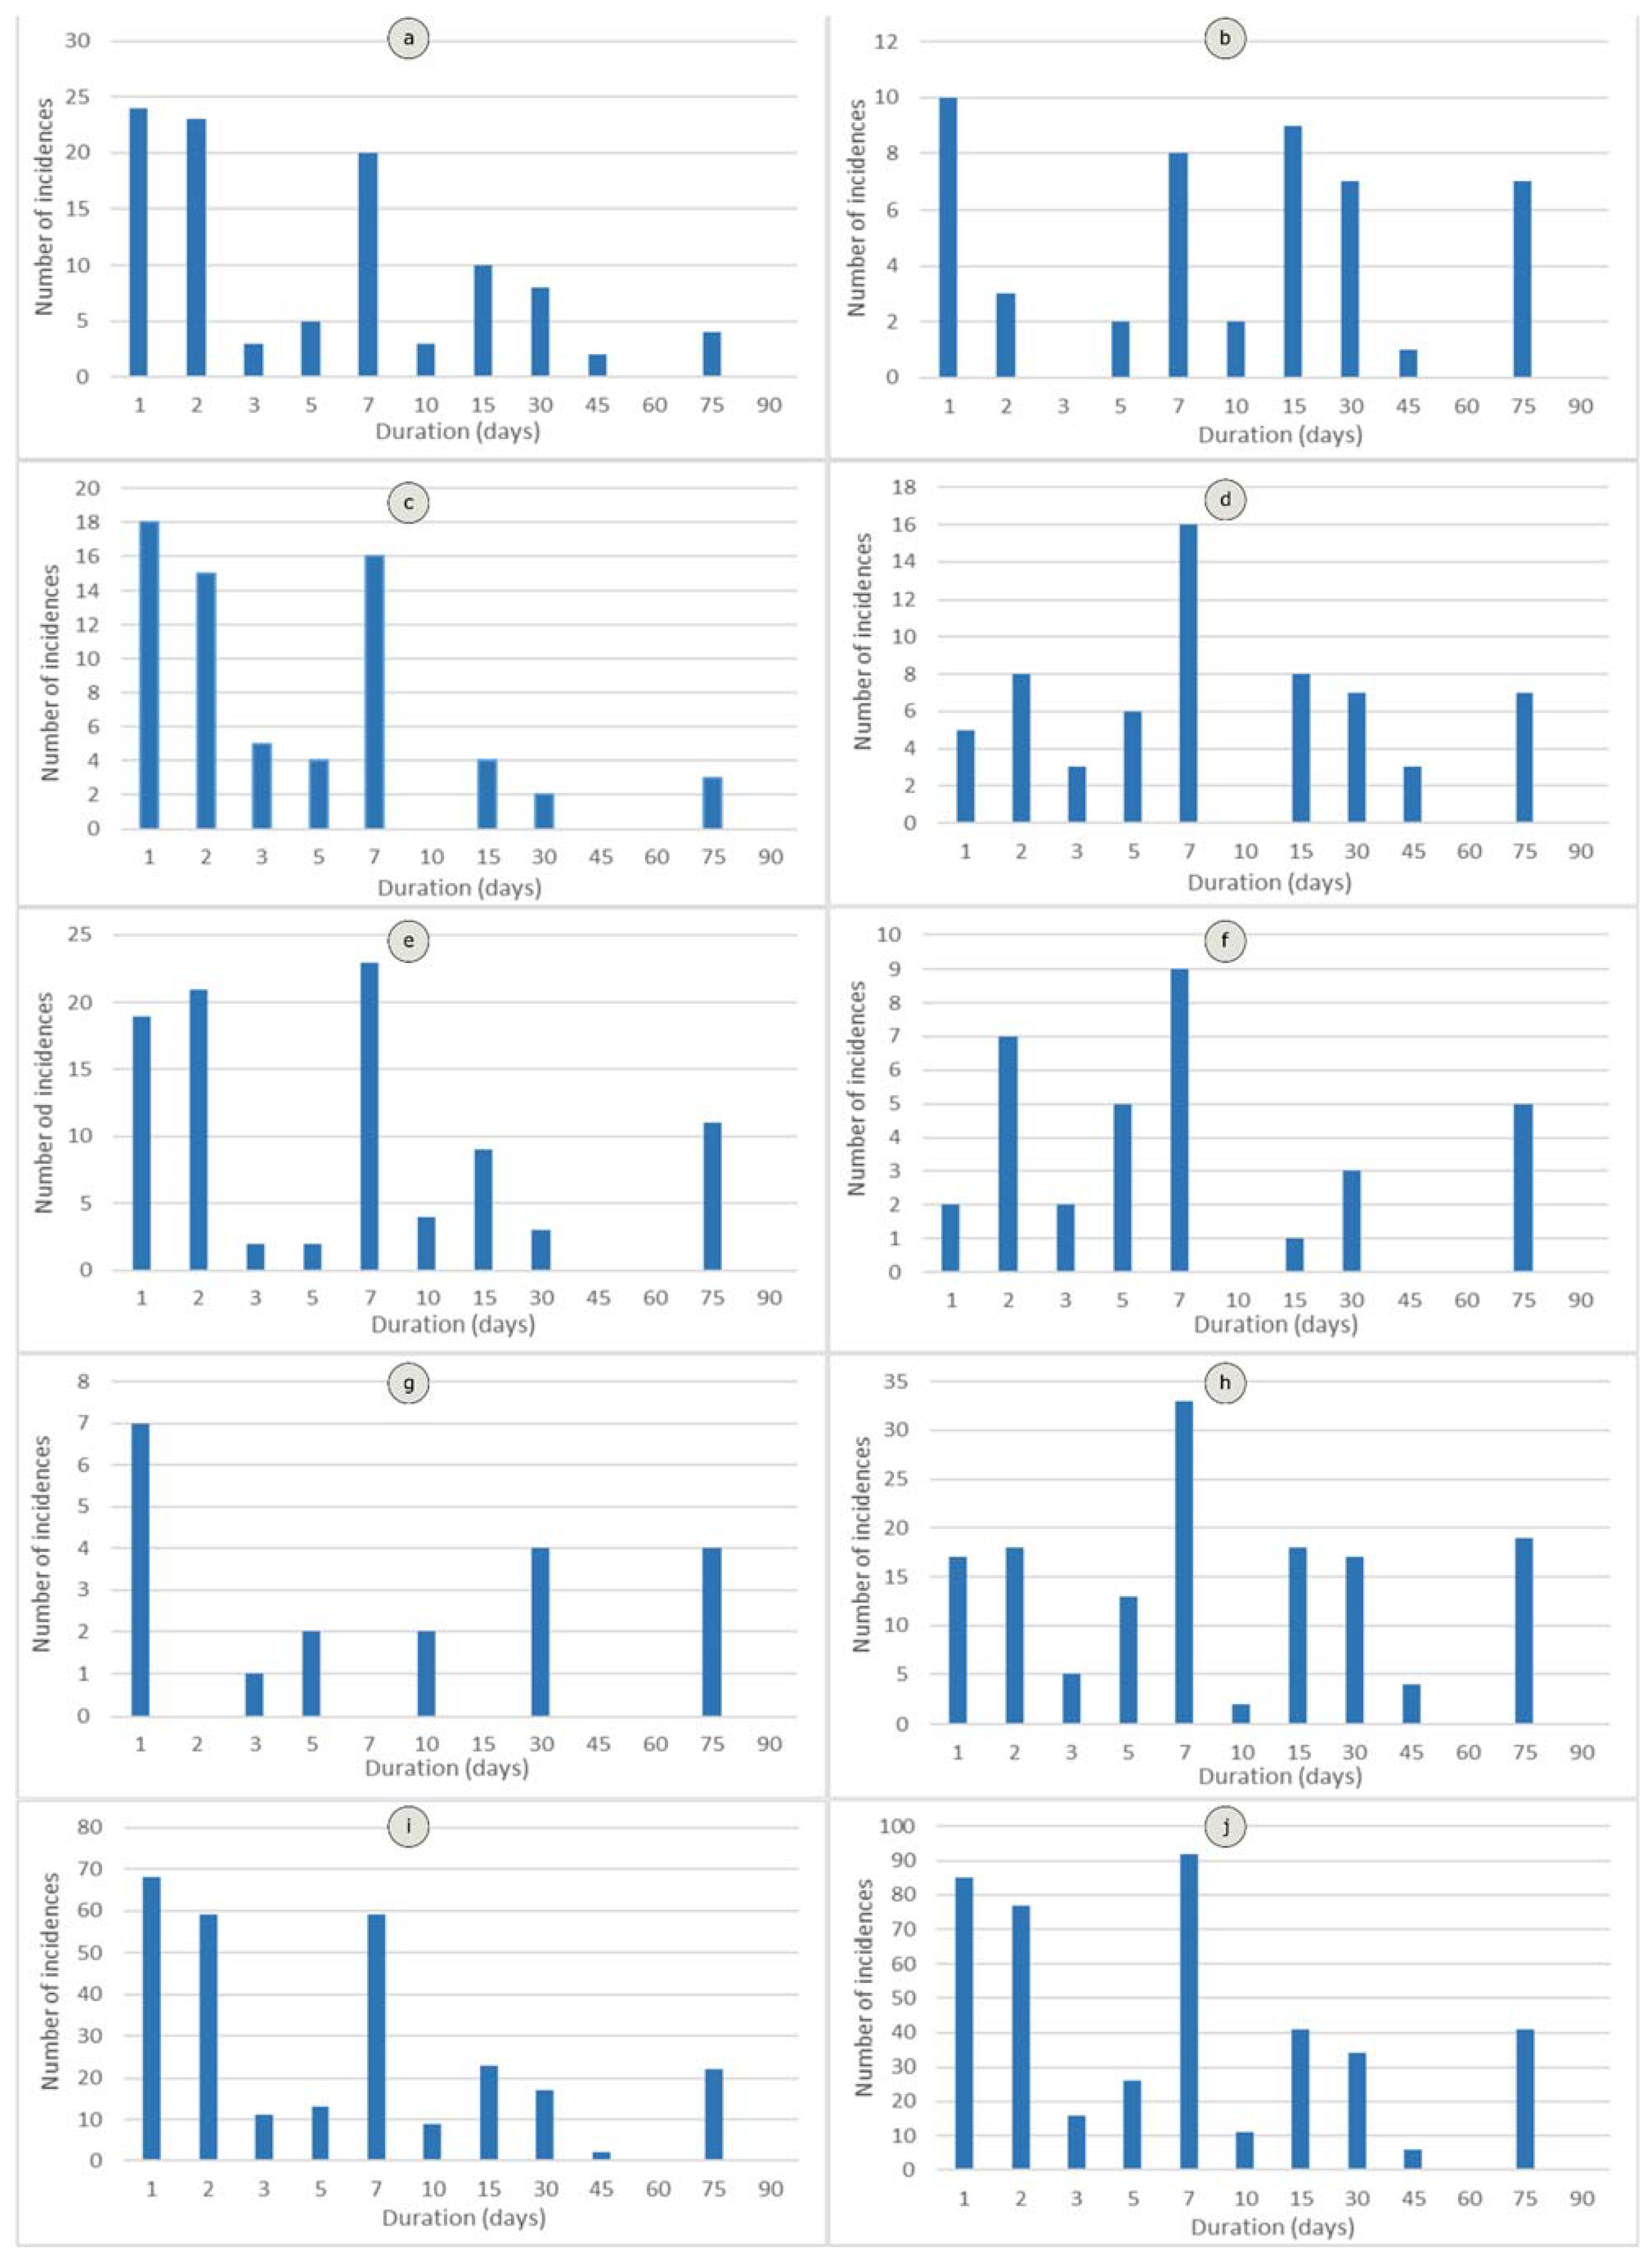
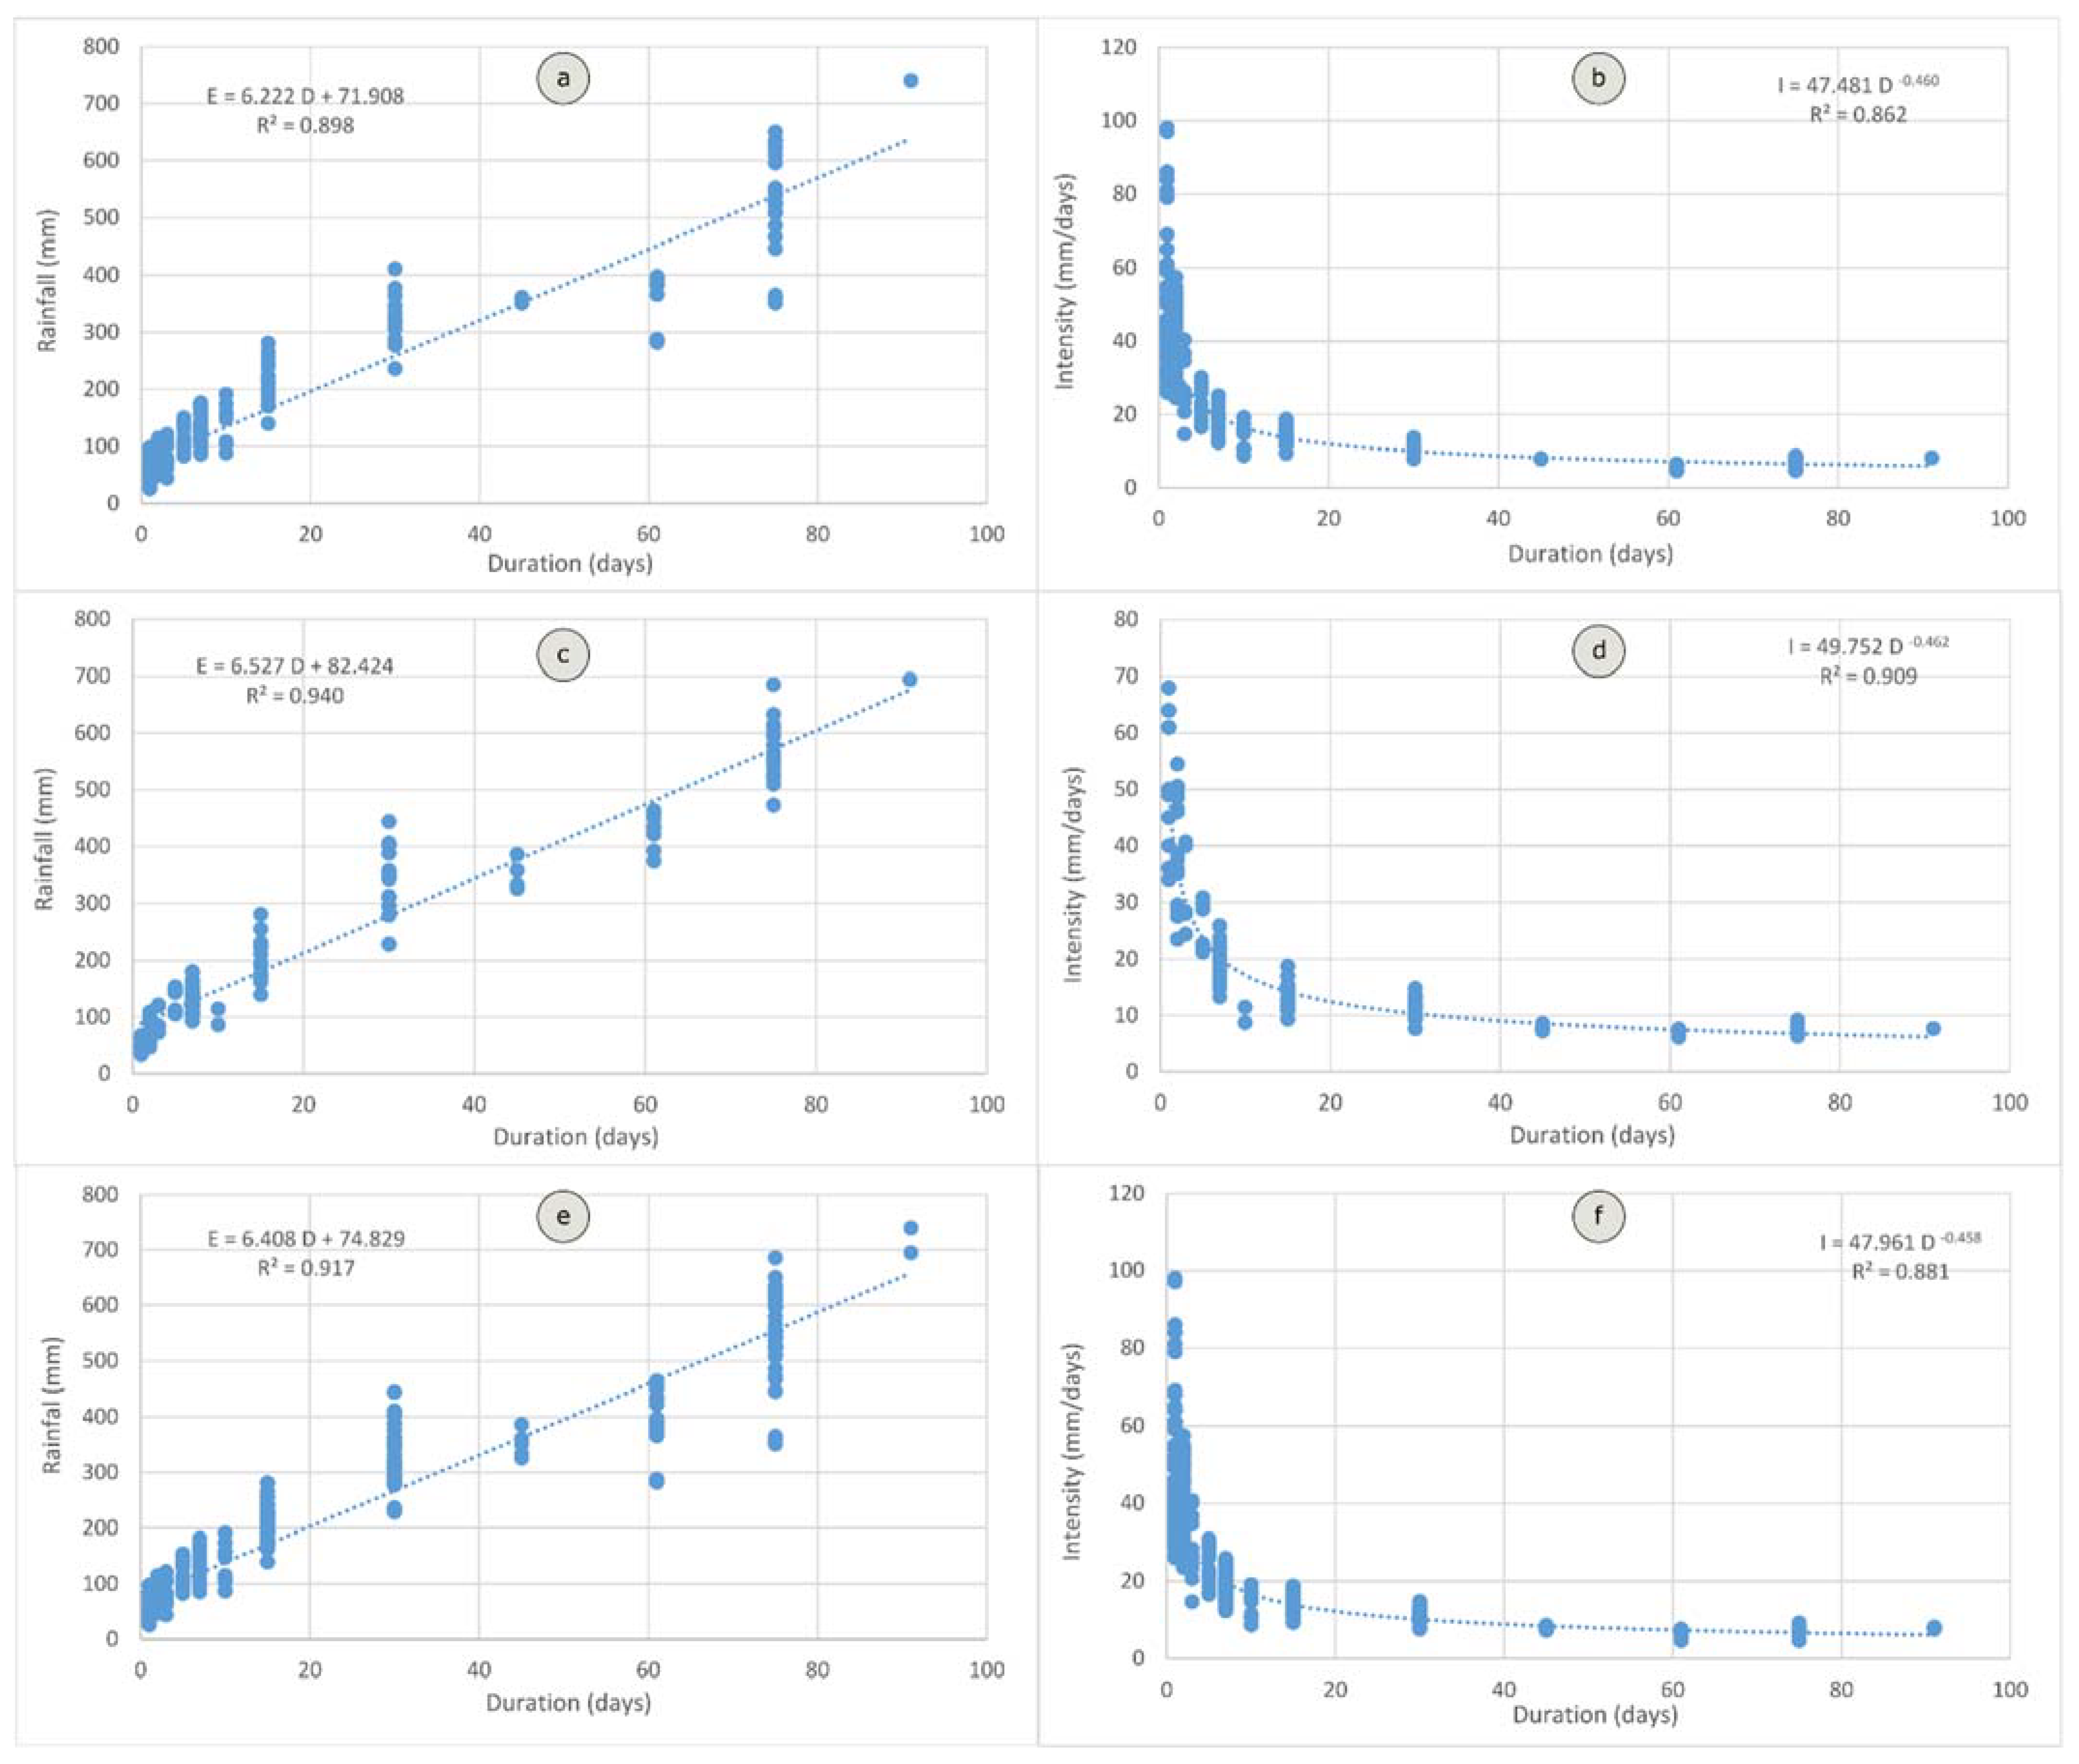
3.2. Rainfall Events

Figure 4 shows the daily rainfall series associated with the aforementioned significant incidence points (shown in the map of Figure 3), where different rainfall events can be observed. Following the methodology described, the rainfall events associated with each incidence were searched in the two years (24 months) previous to the starting of the repair work. Thus, Figure 5 shows the two-year rainfall series for different event durations in two significant incidence points (099 and 181, not shown in Figure 3). Some arrows in red have been included to point out the rainfall events identified in each incidence, which were later used in the thresholds calculation.
A total of 446 rainfall events (E–D pairs) associated with the 186 incidence points were found that met the established criteria of spatial and temporal proximity, as well as the maximum return periods. Thus, 17 points were associated with 4 potential events, 60 points with 3, 86 points with 2, and 21 points with a single event. Meanwhile, some events affected the whole province in a general way and, therefore, the provincial road network, while others affected more restricted sectors. Some of them, those affecting a minimum of 5 points, are shown in Table 4.
Figure 6 also shows isohyets (rainfall) maps of some general events of different dura-tion.
Among the general events, those occurring in the autumn–winter of the hydrological year 2009–2010 stood out: 25–30/12/2009, with rainfall close to 150 mm and exceeding 200 mm, in 5 and 15 days, respectively, at about 20–25 points of the provincial network (Figure 5c and Figure 6b); the events of 06–13/01/2010, with rainfall that exceeded 300 mm in 30 days (Figure 6c); and, finally, the accumulated rainfall that occurred on 22/02/2010, when 570 mm was reached in 75 days at 41 points (Figure 6d) and on 02/03/2010 with 660 mm in 90 days (Figure 5i). In all these cases, the return periods were quite long, generally between 15 and 22.5 years and, in some cases, reaching the total period analysed (45 years).
The second important rainy period occurred in the year 2012–2013, with several events: 03–08/11/2012, with daily rainfall that exceeded 50 mm, 2-day rainfall around 70 mm, and weekly rainfall that reached 150 mm (Figure 5b–d and Figure 6e,f), all generalized in the road network (50–60 points). The return period was 9 to 15 years. Subsequently, on 18/03/2013, rainfall of 166 mm was reached in 15 days at 43 points, with a return period of 6 years.
More locally, there were other rainfall events potentially associated with incidences such as those at the end of 1997, when 400 mm was exceeded in 60 days (Figure 6a), mainly in the mountain ranges; spring 2004 or 2008, with more than 50 mm in 1 day in different sectors; autumn–winter 2010, with 80 mm in 2 days, 230 mm in 15 days (Figure 5e) and 360 mm in 45 days (Figure 5g) in the mountain ranges and the central hills; or those of the end of summer 2012, with almost 60 mm in a day in the southern and western parts of the province (Figure 5b). In all of these events, the return periods were between 5 and 10 years.

3.3. Rainfall Thresholds

Table 5 shows the mean values of the rainfall amount, duration, and intensity (E, D and I) variables, as well as the modal value of the duration, the total events, and discriminated by typology. Likewise, Figure 7 shows the histograms of the duration of the events.
From the data shown in Table 5 and Figure 7, a shorter duration of rain events was generally observed in the lower magnitude incidences, with an average value of 13.70 days (the modal value being 1 day). Meanwhile, for the higher magnitude incidences, such as slides, flows, and creeping processes, the average duration was 21.60 days with a modal value of 7 days. In the lower magnitude incidences, the average rainfall was 223 mm and the intensity was 22 mm/day. For the higher magnitude landslides, the average rainfall was 155 mm, with an average intensity of 28 mm/day.
Regarding the thresholds, Table 6 shows the equations obtained both for the rainfall–duration (E–D) threshold (linear and power-law adjustment), and for the intensity–duration (I–D) threshold (power-law adjustment). The table also shows the coefficient of determination (R2) of the adjustment. Figure 8 shows these thresholds for lower and higher magnitude incidences.
As can be seen from Table 6 and Figure 8, the equations were quite similar for both the lower and higher magnitude incidences; although, in the case of linear adjustments, the intercept in the former (72)—especially in the collapses (61)—was lower than that in the latter (82), the slopes being similar. In the same way, the power-law base was somewhat lower in the lower magnitude incidences (47.5) than in the higher magnitude ones (49.7), both for the E–D and I–D thresholds.

4. Discussion

From the results obtained, it can be observed that the road network in the Jaén province was affected by numerous incidences in the period studied. A set of 186 incidences was registered, of which 123 (66%) corresponded to lower magnitude processes (gullies, undercut of road embankments, slides and collapses in road cuts,) and 63 (33%) corresponded to processes that were also shallow but of higher magnitude, affecting the entire slope (slides, flows, and creeping). Although all the movements affected the road network, some of them (undercut on road embankment, slides and collapses in road cuts, comprising 47% of the incidences) can be considered as directly related to human activities.
The temporal distribution was quite irregular, concentrated mainly in two years: 2010 (with 60 incidences) and 2013 (with 71), representing more than 75% of incidences.
This distribution seems to be related to the occurrence of rainy periods in the province. Without the contribution of other factors, given the low tectonic activity [80], rainfall was the main triggering factor for landslides in the province. As indicated in the introduction, the relationship between landslides and rainfall has been well-established throughout the world [32,33,35], particularly in Europe [42,43] and in the Mediterranean countries [8,9,44,46]. In Spain, these relationships have also been found [28,51,52,81].
Thus, the simple observation of the distribution of the mean annual precipitation (MAP) of point 066, representative of the whole province (Figure 1d), as well as the series of daily rainfall associated with different incidence points (Figure 4), allowed for the establishment of this relationship. Thus, considering the mean annual precipitation (MAP) of 533 mm at point 066, 1026 mm was reached in the hydrological year 2009–2010, 911 mm in 2010–2011, and 950 mm in 2012–2013. The activity of these years has also been observed in natural slopes of some sectors of the province [30]. Meanwhile, the remaining years barely exceeded 600 mm, except for 1976–1977, 1995–1998, and 2003–2004. However, discarding the first years in which there was no recording of incidences, the intense rainfall of other years, such as 1997–1998 and 2003–2004, was not reflected in the incidence database, as explained by the lower magnitude of the rainfall events or because the incidences were not registered (being in the first years of the database elaboration).
Analysis of the rainfall series associated with each incidence made it possible to more precisely identify a set of possible events for each point in different intervals of antecedent rainfall (duration), based on criteria of spatial and temporal proximity, in relation to the news that had appeared in the local media. Figure 5 shows some of these possible events with different durations, associated with two significant incidence points of different magnitude. Thus, for the point 099 (a higher magnitude incidence), several events were observed in the hydrological years 2009–2010 and 2010–2011; while, for the point 174 (a lower magnitude incidence), several events took place in the hydrological year 2012–2013. Some of these events corresponded to those that occurred with different magnitude in some sectors of the province, or those affecting the whole of the road network in a generalized way, as shown in Table 7. They also coincided with the years in which the MAP was higher, as mentioned above.
At the point 099 (whose civil works started in June 2011), the two-year antecedent rainfall series began in the hydrological year 2009–2010, with a rainfall of 150 mm in 7 days to more than 200 mm in 15 days in December. Rainfall continued in January, reaching more than 300 mm in 30 days and, in February–March, it exceeded 570 mm in 75 days and 680 mm in 90 days, more than the annual precipitation in most of the province. After summer 2010, the rainfall recovered, reaching values of 120 mm in 7 days, 230 mm in 15 days, and near 340 m in 30 days for December. Thus, four E–D pairs were selected, for different dates that met the aforementioned criteria (Figure 5), with return periods higher than 20 years (even reaching 45 years), as the most important events of the entire rainfall series. Meanwhile, at point 174 (whose civil works started in June 2013), the series of antecedent rainfall reached important values from September and, especially, November 2012, with events of daily rainfall greater than 60 mm and weekly rainfall of 150 mm, accumulating about 300 mm in 30 days by the end of this month. After this rainy period, the rainfall decreased, but recovered in March 2013 and reached values close to 130 mm in 7 days. Then, four E–D pairs were selected, with return periods always greater than 5 years (mostly between 10 and 20 years). These two particular examples coincided with the following analysis, in which the lower magnitude incidences were usually related to intense rainfall of short duration (1–7 days), while higher magnitude incidences required a longer duration (1–3 months).
Analysis of the average values of the considered variables showed some aspects of interest, such as a shorter duration of the events associated with lower magnitude incidences (mode of 1 day and mean of about 13 days), compared to those of higher magnitude (mode of 7 days and mean higher than 20 days). Consequently, the amount of rainfall was lower in the former (around 150 mm) than in the latter (around 225 mm), unlike the intensity (28 and 22 mm/day, respectively). This difference in behaviour has been pointed out in previous studies considering deep landslides [36,40], where the duration of antecedent rainfall ranged between less than 15 days for shallow landslides to more than 30 days for deeper ones [36,40]. Usually, the prediction is more complex for deeper landslides, for which it is necessary to consider the antecedent rainfall that determines the soil moisture conditions in the medium-term [16,18,19,28,40,41,42,43,51,52,57,59,60,61,62,81], or even the variation in annual rainfall over several years [58]. These landslides are triggered by a reduction in the shear strength of affected soils and rocks, related to the constant increase in groundwater level as an effect of long-term rainfall periods [40]. Although deep landslides were not considered in the strict sense in this study, a certain difference was observed between the lower and higher magnitude incidences, with respect to the duration of events causing the incidences.
In any case, the consideration of antecedent rainfall provides a simple way to introduce hydrogeological conditions into these studies, even when only shallow landslides are analysed. Some studies, which have mainly used daily data (such as in this one), have been based on the analysis of rainfall duration periods longer than 1 month [51], while other, more sophisticated methods distinguish between the antecedent and triggering rainfall [28,52]. The use of a calibrated antecedent rainfall that decreases with time [38,40] provides another way to simulate the hydrological conditions; however, in this preliminary study, in which the incidence date had high uncertainty, a simple method based only on rainfall amount–duration pairs was applied.
Regarding the rainfall thresholds, we focused especially on E–D type pairs, as they are two truly independent variables [45,46,56]. In addition, in this case (as in other ones), we utilised daily data [28,40,51,52,62,82], which can make it difficult to accurately calculate the intensity, with respect to those other studies that use hourly data [42,43]. Nevertheless, the adjustment of linear equations was tested, with good results, as in previous studies with daily data [51], as well as power-law curves for both the E–D and I–D thresholds (Table 6 and Figure 8). The different thresholds show a good general fit (R2 higher than 0.9), without significant differences between them. Moreover, normalized thresholds using the MAP were calculated, and all the equations were expressed using the duration (D) in hours in order to facilitate comparison with other studies. Most of these results were not included in the previous section, for simplicity, but are summarized in Table 7, where a comparison with the thresholds obtained by other authors is shown.
In general, the thresholds were within an order of magnitude of those corresponding to other studies, validating the results of this work. However, it must be taken into account that some of them used lower value thresholds; that is, thresholds adjusted such that only a reduced percentile (10, 5, or 1%) of the landslides is under the threshold curve. In this study, we mainly considered thresholds adjusted to the mean values, but the threshold of lower values (5%) was also calculated for the linear adjustment (Table 7, low). From both thresholds, the rainfall amount and intensity corresponding to the different durations were calculated, which could be used to develop a warning system regarding the activation of incidences in the road network of the province of Jaén (Table 8).
Hydro-meteorological thresholds [59,60,61,62] are increasingly being used to overcome the drawbacks of rainfall thresholds, which do not consider adequately the hydrological conditions of slopes and, besides, produce a great proportion of false positives in the prediction, thus limiting the development of warning systems. There exist different methods to determine these thresholds, some of them based on hydro(geo)logical models which take into account detailed data of the phreatic level, soil humidity, porosity, permeability, saturation, rainfall, and so on [59,60,61], while others are based on data at the basin level, such as rainfall, evapotranspiration, runoff, and so on [62]. In both, additional data are necessary, which were not available in this case, such that they were discarded herein.
Considering the differences by typology, only small differences were observed between the values obtained; the intercept of linear adjustment and the base of the power-law being somewhat higher in the incidences of higher magnitude than in the lower magnitude ones. It must be taken into account that, in any case, the incidences affecting the road network were always shallow, and moreover, the temporal resolution of the data (daily rainfall) was most likely too low to find differences. Differences between the incidences more directly related to the human activities regarding to those less related were not observed. The only typology that presented a certain difference with respect to the remaining incidences, were the collapses (with a lower slope and intercept). This typology is usually associated with steeper areas and road cuts (which are prone to landslides) and the thresholds are likely lower than in other incidences. However, as discussed above, the duration showed higher values in the higher magnitude incidences then in the lower magnitude ones.
The importance of assessing the uncertainty in the determination of rainfall thresh-olds has been discussed in several studies, given that they are based on empirical data which are not always acquired with the required accuracy [42,43,44], both in the spatiotemporal component and in the measurement component (rainfall gauges). Approaches based on bootstrapping techniques [45] have been proposed, in order to estimate the uncertainty of the power-law parameters (α as the base or scaling parameter; and β as the exponent or the shape parameter) in the E–D thresholds. These approaches have been used in other studies oriented to the development of warning systems [45,46,48,49,53], where uncertainty values representing 5–10% of these parameters have been found [50]. The influence of the temporal resolution on the uncertainty has also been analysed, resulting in smaller scaling parameters (intercepts in logarithmic scale), higher shape parameter (slopes), shorter ranges of validity of the thresholds, and higher uncertainties when the temporal resolution decreased [53]. In this study, the main uncertainty source was not the spatial component, as the meteorological data grid was quite dense (1 km) but, instead, the temporal component (daily rainfall resolution), and especially the uncertainty of the incidence date. This date was estimated from the month when the civil work started, applying the criteria of spatial and temporal proximity to the news appearing in the local media, as well as the magnitude of the event (return period). In these conditions, a validation analysis with the use of positive and negative events is difficult to implement. These limitations, in terms of the data, and the preliminary nature of the study, led us to not consider the uncertainty analysis. Nevertheless, future works utilising more data and with the objective of developing a warning system should address these concerns regarding validation and uncertainty analyses.
Finally, a brief note on the relationships between landslide activity, rainfall, and the global climate could be necessary, although it exceeds the objectives of this study. Several studies [36,37,38,40,52] have pointed to a relationship between rainfall of high intensity (which generates landslides) and global climatic phenomena. Among these, the well-known teleconnections stand out, such as the South Pacific-El Niño oscillation (ENSO), the North Atlantic oscillation (NAO), or the Western Mediterranean oscillation (WeMo). All of them are related, and may have an influence on the rainfall of the Iberian Peninsula and the Mediterranean [84,85], as has been observed in the Balearic Islands [37].
It is well-known that the high negative anomalies of the NAO (NAOi) are the origin of rainy winters and storms in Portugal and the whole of the Iberian Peninsula [84], thus producing floods [86] and landslides [28,36,40,52]. In this case, they are mainly related to deep landslides [40], but also to shallow landslides [36,52]. Meanwhile, the WeMo also seems to influence the rainfall in the Mediterranean area of the Iberian Peninsula [87]. Thus, in southern Spain, the relationships between both indices and rainfall have been analysed [52]. Although a significant correlation has not been obtained, two of the wettest hydrological years, such as 1995–1996 and 2009–2010 (the latter being one of the years with the highest activity in the study area), were observed to be related to negative anomalies of both indices.
Regarding the role of climate change in rainfall-triggered landslides, this is an interesting issue currently in discussion [88], although the prediction of rainfall events that generate landslides has shown a high level of uncertainty [89]. However, it seems clear that a global climate change scenario, in which severe events such as intense rainfalls are expected [90], should influence landslide activity [91], specifically the rainfall thresholds [88]. Predictions for Spain and the Mediterranean [92,93] have pointed out, in this direction, that Severe Weather Threats (SWEATs) are estimated to increase in the near future, especially in the summer and autumn [94]. Thus, higher levels of hazard and risk affecting civil infrastructure in the province of Jaén are also expected, as has been shown by a preliminary approach, in which a 30% increase in daily rainfall was found in some sectors of the province [95].

5. Conclusions

Rainfall thresholds are one of the most widely applied methods for indirectly estimating landslide return periods, which are subsequently used in hazard analyses. They are also used in the implementation of early-warning systems.
In this work, the starting point was an incidence database in the road network of the province of Jaén, in which the positions and dates of civil repair works are contained. Moreover, a meteorological database with daily rainfall data in a dense grid (1 km) allowed us to link the rainfall series to the incidence points accurately. Then, the identification of rainfall events that potentially generated landslides and erosion processes was addressed, using criteria related to the spatial proximity, temporal proximity, and return period, additionally considering the news appearing in the local media.
Regarding the results, some relevant aspects could be extracted:
  • Several events were identified, the most important being related to the hydrological years 2009–2010 and 2012–2013. Some of them were located in specific areas and other ones affected practically the entire road network. The return periods of these significant events were always greater than 5 years and, in some cases, exceeded 10–20 years.
  • The lower magnitude incidences usually presented a shorter duration (mode of 1–15 days), compared to those of higher magnitude (7–30 days). Consequently, the amount of rain was lower in the former (around 150 mm) than in the latter (around 225 mm).
  • The thresholds obtained for both the rainfall–duration (E–D) and intensity–duration (I–D) pairs were on the same order of magnitude as those calculated by other authors, some of them in a similar environment (i.e., Mediterranean countries). The different types of thresholds tested (E–D or I–D, linear or power-law) showed a good fit, without significant differences, likely due to duration data being in units of days, not in hours, and the shallow nature of all the incidences.
  • In this case, there were no differences in the thresholds between the lower and higher magnitude incidences, unlike the variables (E, I, D) themselves.
  • Finally, from the thresholds, rainfall amounts and intensities for different durations of the events were calculated (e.g., about 80 mm for 1 day and more than 250 mm for 1 month), considering not only the threshold adjusted to the mean values but the threshold adjusted to the lower values.
Future improvements to the study should first address extension of the database to other roads, and even the inclusion of landslides on natural slopes, which would allow the thresholds and calculated variables to be refined. In this sense, recording the incidences or landslides with precise knowledge of the date of occurrence could contribute to this refinement. The use of more accurate data would also allow for addressing advanced models, in which antecedent and triggering rainfalls are distinguished and, even (if additional data were available), the determination of hydro-meteorological thresholds. Another future approach consists of estimating the uncertainty of the models and their validation (e.g., using different samples of incidences for training and testing, or by means of temporal validation). Then, these thresholds may be reliably used in hazard analysis or for the implementation of (early) warning systems in the study area.

Author Contributions

Conceptualization: R.C., T.F., J.T.-P., M.S.-G. and J.C.; methodology: R.C., T.F., and J.T.-P.; field work: R.C., I.M. and F.M.; data curation: R.C., T.F., I.M. and F.M.; writing: R.C., T.F. and M.S.-G.; supervision: J.T.-P. and M.S.-G.; project administration: R.C. and J.T.-P.; funding acquisition: R.C., J.T.-P. and T.F. All authors have read and agreed to the published version of the manuscript.

Funding

This work was financed by the following projects: The Convene “Risks associated to the Road Network of the Jaén Province” of the Deputy of Jaén; “Development of a methodology for the landslide hazard mapping: Application to the province of Jaén” (Center for Advanced Studies in Earth Sciences, Energy and Environment of the University of Jaén); “SPS-LIDAR (National Research Agency of Spain; ref. RTI2018-099638-B-I00)”.

Institutional Review Board Statement

Not applicable.

Informed Consent Statement

Not applicable.

Acknowledgments

The authors thank AEMET and UC for the data provided for this work (Spain02 v5 data set, available at http://www.meteo.unican.es/datasets/spain02 (accessed on 15 May 2021)).We also acknowledge the help of the groups TEP213 (SFT), RNM325, RNM127, and TEP220 (Matras) of PAIDI, and the research project SUSTAINOLIVE (PRIMA projects) of the UE.

Conflicts of Interest

The authors declare no conflict of interest.

References

  1. Varnes, D.J. Landslide Hazard Zonation: A Review of Principles and Practice, Natural Hazards; UNESCO: Paris, France, 1984. [Google Scholar]
  2. Schuster, R.L. Socioeconomic significance of landslides. In Landslides: Investigation and Mitigation; Turner, A.K., Schuster, R.L., Eds.; Transportation Research Board Special Report 247; National Academy of Sciences: Washington, DC, USA, 1996; pp. 12–35. [Google Scholar]
  3. Guzzetti, F.; Carrara, A.; Cardinali, M.; Reichenbach, P. Landslide hazard evaluation: A review of current techniques and their application in a multi-scale study. Geomorphology 1999, 31, 181–216. [Google Scholar] [CrossRef]
  4. Petley, D. Global patterns of loss of life from landslides. Geology 2012, 40, 927–930. [Google Scholar] [CrossRef]
  5. GAR. 2009. Available online: https://www.preventionweb.net/english/hyogo/gar/2009/ (accessed on 15 May 2021).
  6. GAR. 2019. Available online: https://gar.undrr.org/report-2019 (accessed on 15 May 2021).
  7. Spizzichino, D.; Margottini, C.; Trigila, A.; Iadanza, C. Landslide impacts in Europe: Weaknesses and strengths of databases available at European and national scale. In Landslide Science and Practice, Proceedings of the Second World Landslide Forum, Rome, Italy, 3–9 October 2011; Springer: Berlin/Heidelberg, Germany, 2013; pp. 73–80. [Google Scholar]
  8. Cardinali, M.; Reichenbach, P.; Guzzetti, F.; Ardizzone, F.; Antonini, G.; Galli, M.; Cacciano, M.; Castellani, M.; Salvati, P. A geomorphological approach to the estimation of landslide hazards and risks in Umbria, Central Italy. Nat. Hazards Earth Syst. Sci. 2002, 2, 57–72. [Google Scholar] [CrossRef] [Green Version]
  9. Guzzetti, F.; Cardinali, M.; Reichenbach, P.; Cipolla, F.; Sebastiani, C.; Galli, M.; Salvati, P. Landslides triggered by the 23 November 2000 rainfall event in the Imperia Province, Western Liguria, Italy. Eng. Geol. 2004, 73, 229–245. [Google Scholar] [CrossRef]
  10. Ayala, F.J.; Elizaga, E.; de González Vallejo, L.I. Impacto Económico y Social de los Riesgos Geológicos en España; ITGE: Madrid, Spain, 1987; p. 134. [Google Scholar]
  11. Chacón, J.; Irigaray, C.; Fernández, T.; El Hamdouni, R. Engineering geology maps: Landslides and Geographical Information Systems (GIS). Bull. Eng. Geol. Environ. 2006, 65, 341–411. [Google Scholar] [CrossRef]
  12. Irigaray, C.; Fernández, T.; El Hamdouni, R.; Chacón, J. Evaluation and validation of landslide susceptibility maps obtained by a GIS matrix method: Examples from the Betic Cordillera (southern Spain). Nat. Hazards 2007, 41, 61–79. [Google Scholar] [CrossRef]
  13. Van Westen, C.J. The modelling of landslide hazards using GIS. Surv. Geophys. 2000, 21, 241–255. [Google Scholar] [CrossRef]
  14. Terlien, M.T.J. The determination of statistical and deterministic hydrological landslide-triggering thresholds. Env. Geol. 1998, 35, 124–130. [Google Scholar] [CrossRef]
  15. Crosta, G.B.; Frattini, P. Distributed modelling of shallow landslides triggered by intense rainfall. Nat. Hazards Earth Syst. Sci. 2003, 3, 81–93. [Google Scholar] [CrossRef] [Green Version]
  16. Bogaard, T.A.; Greco, R. Landslide hydrology: From hydrology to pore pressure. Wiley Interdiscip. Rev. Water 2016, 3, 439–459. [Google Scholar] [CrossRef]
  17. Lazzari, M.; Piccarreta, M. Landslide disasters triggered by extreme rainfall events: The Case of Montescaglioso (Basilicata, Southern Italy). Geosciences 2018, 8, 377. [Google Scholar] [CrossRef] [Green Version]
  18. Sidle, R.C.; Greco, R.; Bogaard, T. Overview of landslide hydrology. Water 2019, 11, 148. [Google Scholar] [CrossRef] [Green Version]
  19. Aleotti, P. A warning system for rainfall-induced shallow failures. Eng. Geol. 2004, 73, 247–265. [Google Scholar] [CrossRef]
  20. Chung, C.J.F.; Fabbri, A.G. Probabilistic prediction models for landslide hazard mapping. Photogramm. Eng. Remote Sens. 1999, 65, 1389–1399. [Google Scholar]
  21. Reichenbach, P.; Rossi, M.; Malamud, B.; Mihri, M.; Guzzetti, F. A review of statistically-based landslide susceptibility models. Earth Sci. Rev. 2018, 180, 60–91. [Google Scholar] [CrossRef]
  22. Carrara, A. Multivariate models for landslide hazard evaluation. A “Black Box” approach. In Proceedings of the Workshop on Natural Disasters in European Mediterranean Countries, Perugia, Italy, 27 June–1 July 1998; pp. 205–224. [Google Scholar]
  23. Brenning, A. Spatial prediction models for landslide hazards: Review, comparison and evaluation. Nat. Hazards Earth Syst. Sci. 2005, 5, 853–862. [Google Scholar] [CrossRef]
  24. Merghadi, A.; Yunus, A.P.; Dou, J.; Whiteley, J.; Thaipham, B.; Tien, D.; Avtar, R.; Abderrahmane, B. Earth-science reviews machine learning methods for landslide susceptibility studies: A comparative overview of algorithm performance. Earth Sci. Rev. 2020, 207, 103225. [Google Scholar] [CrossRef]
  25. Guzzetti, F.; Cesare, A.; Cardinali, M.; Fiorucci, F.; Santangelo, M.; Chang, K. Earth-science reviews landslide inventory maps: New tools for an old problem. Earth Sci. Rev. 2012, 112, 42–66. [Google Scholar] [CrossRef] [Green Version]
  26. Fell, R.; Corominas, J.; Bonnard, C.; Cascini, L.; Leroi, E.; Savage, W.Z. Guidelines for landslide susceptibility, hazard and risk zoning for land use planning. Eng. Geol. 2008, 102, 85–98. [Google Scholar] [CrossRef] [Green Version]
  27. Ibsen, M.-L.; Brunsden, D. The nature, use and problems of historical archives for the temporal occurrence of landslides, with specific reference to the south coast of Britain, Ventnor, Isle of Wight. Geomorphology 1996, 15, 241–258. [Google Scholar] [CrossRef]
  28. Palenzuela, J.A.; Jiménez-Perálvarez, J.D.; Chacón, J.; Irigaray, C. Assessing critical rainfall thresholds for landslide triggering by generating additional information from a reduced database: An approach with examples from the Betic Cordillera (Spain). Nat. Hazards 2016, 84, 185–212. [Google Scholar] [CrossRef]
  29. Scaioni, M.; Longoni, L.; Melillo, V.; Papini, M. Remote sensing for landslide investigations: An overview of recent achievements and perspectives. Remote Sens. 2014, 6, 9600–9652. [Google Scholar] [CrossRef] [Green Version]
  30. Fernández, T.; Pérez-García, J.L.; Gómez-López, J.M.; Cardenal, J.; Moya, F.; Delgado, J. Multitemporal landslide inventory and activity analysis by means of aerial photogrammetry and LiDAR techniques in an area of Southern Spain. Remote Sens. 2021, 13, 2110. [Google Scholar] [CrossRef]
  31. Corominas, J.; Moya, J. A review of assessing landslide frequency for hazard zoning purposes. Eng. Geol. 2008, 102, 193–213. [Google Scholar] [CrossRef]
  32. Crozier, M.J. Techniques for the morphometric analysis of landslips. Z. Geomorphol. 1973, 17, 78–101. [Google Scholar]
  33. Finlay, P.J.; Fell, R.; Maguire, P.K. The relationship between the probability of landslide occurrence and rainfall. Can. Geotech. J. 1997, 34, 811–824. [Google Scholar] [CrossRef]
  34. Irigaray, C.; Lamas, F.; El Hamdouni, R.; Fernández, T.; Chacón, J. The importance of the precipitation and the susceptibility of the slopes for the triggering of landslides along the roads. Nat. Hazards 2000, 21, 65–81. [Google Scholar] [CrossRef]
  35. Wieczorek, G.; Glade, T. Climatic factors influencing occurrence of debris flows. In Debris-Flow Hazards and Related Phenomena; Springer: Berlin/Heidelberg, Germany, 2005; pp. 325–362. [Google Scholar]
  36. Zezere, J.L.; Trigo, R.M.; Fragoso, M.; Oliveira, S.C.; Garcia, R.A.C. Rainfall-triggered landslides in the Lisbon region over 2006 and relationships with the North Atlantic Oscillation. Nat. Hazards Earth Syst. Sci. 2008, 8, 483–499. [Google Scholar] [CrossRef] [Green Version]
  37. Luque-Espinar, J.A.; Mateos, R.M.; García-Moreno, I.; Pardo-Igúzquiza, E.; Herrera, G. Spectral analysis of climate cycles to predict rainfall induced landslides in the western Mediterranean. Nat. Hazards 2017, 89, 985–1007. [Google Scholar] [CrossRef]
  38. Moreiras, S.M.; Vergara, I.; Pont, D.; Araneo, D. Were merely storm-landslides driven by the 2015–2016 Niño in the Mendoza River valley? Landslides 2018, 15, 997–1014. [Google Scholar] [CrossRef]
  39. Caine, N. The rainfall intensity: Duration control of shallow landslides and debris flows. Geogr. Ann. Ser. A Phys. Geogr. 1980, 62, 23–27. [Google Scholar]
  40. Zezere, J.L.; Trigo, R.; Trigo, I. Shallow and deep landslides induced by rainfall in the Lisbon region (Portugal): Assessment of relationships with the North Atlantic Oscillation. Nat. Hazards Earth Syst. Sci. 2005, 5, 331–344. [Google Scholar] [CrossRef]
  41. Cardinali, M.; Galli, M.; Guzzetti, F.; Ardizzone, F.; Reichenbach, P.; Bartoccini, P. Rainfall induced landslides in December 2004 in south-western Umbria, central Italy: Types, extent, damage and risk assessment. Nat. Hazards Earth Syst. Sci. 2006, 6, 237–260. [Google Scholar] [CrossRef]
  42. Guzzetti, F.; Peruccacci, S.; Rossi, M.; Stark, C.P. Rainfall thresholds for the initiation of landslides in central and southern Europe. Meteorol. Atmos. Phys. 2007, 98, 239–267. [Google Scholar] [CrossRef]
  43. Guzzetti, F.; Peruccacci, S.; Rossi, M.; Stark, C. The rainfall intensity—Duration control of shallow landslides and debris flows: An update. Landslides 2008, 5, 3–17. [Google Scholar] [CrossRef]
  44. Brunetti, M.T.; Peruccacci, S.; Rossi, M.; Luciani, S.; Valigi, D.; Guzzetti, F. Rainfall thresholds for the possible occurrence of landslides in Italy. Nat. Hazards Earth Syst. Sci. 2010, 10, 447–458. [Google Scholar] [CrossRef]
  45. Peruccacci, S.; Brunetti, M.T.; Luciani, S.; Vennari, C.; Guzzetti, F. Lithological and seasonal control of rainfall thresholds for the possible initiation of landslides in central Italy. Geomorphology 2012, 139-140, 79–90. [Google Scholar] [CrossRef]
  46. Peruccacci, S.; Brunetti, M.T.; Gariano, S.L.; Melillo, M.; Rossi, M.; Guzzetti, F. Rainfall thresholds for possible landslide occurrence in Italy. Geomorphology 2017, 290, 39–57. [Google Scholar] [CrossRef]
  47. Vennari, C.; Gariano, S.L.; Antronico, L.; Brunetti, M.T.; Iovine, G.; Peruccacci, S.; Terranova, O.; Guzzetti, F. Rainfall thresholds for shallow landslide occurrence in Calabria, Southern Italy. Nat. Hazards Earth Syst. Sci. 2014, 14, 317–330. [Google Scholar] [CrossRef] [Green Version]
  48. Melillo, M.; Brunetti, M.T.; Peruccacci, S.; Gariano, S.L.; Guzzetti, F. Rainfall thresholds for the possible landslide occurrence in Sicily (Southern Italy) based on the automatic reconstruction of rainfall events. Landslides 2016, 13, 165–172. [Google Scholar] [CrossRef]
  49. Melillo, M.; Brunetti, M.T.; Peruccacci, S.; Gariano, S.L.; Roccati, A.; Guzzetti, F. A tool for the automatic calculation of rainfall thresholds for landslide occurrence. Environ. Model. Softw. 2018, 105, 230–243. [Google Scholar] [CrossRef]
  50. Palladino, M.R.; Viero, A.; Turconi, L.; Brunetti, M.T.; Peruccacci, S.; Melillo, M.; Luino, F.; Deganutti, A.M.; Guzzetti, F. Rainfall thresholds for the activation of shallow landslides in the Italian Alps: The role of environmental conditioning factors. Geomorphology 2018, 303, 53–67. [Google Scholar] [CrossRef]
  51. Valenzuela, P.; Zêzere, J.L.; Domínguez-Cuesta, M.J.; Antonio, M.; García, M. Empirical rainfall thresholds for the triggering of landslides in Asturias (NW Spain). Landslides 2019, 16, 1285–1300. [Google Scholar] [CrossRef]
  52. Palenzuela, J.A.; Soto, J.; Irigaray, C. Characteristics of rainfall events triggering landslides in two climatologically different areas: Southern Ecuador and southern Spain. Hydrology 2020, 7, 45. [Google Scholar] [CrossRef]
  53. Gariano, S.L.; Melillo, M.; Peruccacci, S.; Brunetti, M.T. How much does the rainfall temporal resolution affect rainfall thresholds for landslide triggering? Nat. Hazards 2020, 100, 655–670. [Google Scholar] [CrossRef] [Green Version]
  54. IRPI. Available online: http://rainfallthresholds.irpi.cnr.it/threshold_info.htm (accessed on 15 May 2021).
  55. Daggupati, P.; Douglas-Mankin, K.; Sheshukov, A.; Barnes, P. Monitoring and estimating ephemeral gully erosion using field measurements and GIS. In Proceedings of the ASABE Annual International Meeting, Pittsburgh, PA, USA, 20–23 June 2010; p. 1009663. [Google Scholar]
  56. Swiechowicz, J. Rainfall threshold for ephemeral gully erosion in foothill cultivated lands (Wisnicz Foothills, Poland). In Proceedings of the EGU General Assembly, Vienna, Austria, 17–22 April 2016; Volume 18. [Google Scholar]
  57. Glade, T.; Crozier, M.; Smith, P. Applying probability determination to refine landslide-triggering rainfall thresholds using an empirical “Antecedent Daily Rainfall Model”. Pure Appl. Geophys. 2000, 157, 1059–1079. [Google Scholar] [CrossRef]
  58. Bonnard, C.H.; Noverraz, F. Influence of climate change on large landslides: Assessment of long term movements and trends. In Proceedings of the International Conference on Landslides—Causes, Impacts and Countermeasures, Davos, Switzerland, 17–21 June 2001; Kuhne, M., Einstein, H.H., Krauter, E., Klapperich, H., Pottler, R., Eds.; VGE: Essen, Germany, 2001; pp. 121–138. [Google Scholar]
  59. Bogaard, T.A.; Greco, R. Invited perspectives: Hydrological perspectives on precipitation intensity-duration thresholds for landslide initiation: Proposing hydro-meteorological thresholds. Nat. Hazards Earth Syst. Sci. 2018, 18, 31–39. [Google Scholar] [CrossRef] [Green Version]
  60. Marino, P.; Peres, D.J.; Cancelliere, A.; Greco, R.; Bogaard, T.A. Soil moisture information can improve shallow landslide forecasting using the hydrometeorological threshold approach. Landslides 2020, 17, 2041–2054. [Google Scholar] [CrossRef]
  61. Mirus, B.B.; Morphew, M.D.; Smith, J.B. Developing hydro-meteorological thresholds for shallow landslide initiation and early warning. Water 2018, 10, 1274. [Google Scholar] [CrossRef] [Green Version]
  62. Ciavolella, M.; Bogaard, T.A.; Gargano, A.; Greco, R. Is there predictive power in hydrological catchment information for regional landslide hazard assessment? Procedia Earth Planet. Sci. 2016, 16, 195–203. [Google Scholar] [CrossRef] [Green Version]
  63. Martelloni, G.; Segoni, S.; Fanti, R.; Catani, F. Rainfall thresholds for the forecasting of landslide occurrence at regional scale. Landslides 2012, 9, 485–495. [Google Scholar] [CrossRef] [Green Version]
  64. Segoni, S.; Lagomarsino, D.; Fanti, R.; Moretti, S.; Casagli, N. Integration of rainfall thresholds and susceptibility maps in the Emilia Romagna (Italy) regional-scale landslide warning system. Landslides 2015, 12, 773–785. [Google Scholar] [CrossRef] [Green Version]
  65. Lin, G.; Chang, M.; Huang, Y.; Ho, J. Assessment of susceptibility to rainfall-induced landslides using improved self-organizing linear output map, support vector machine, and logistic regression. Eng. Geol. 2017, 224, 62–74. [Google Scholar] [CrossRef]
  66. Pérez-Valera, F.; Sánchez-Gómez, M.; Pérez-López, A.; Pérez-Valera, L.A. An evaporite-bearing accretionary complex in the northern front of the Betic-Rif orogeny. Tectonics 2017, 36, 1006–1036. [Google Scholar] [CrossRef] [Green Version]
  67. AEMET. Agencia Estatal de Meteorología, 2018. Mapas Climáticos de España (1981–2010). Ministerio para la Transición Ecológica, España. Available online: http://www.aemet.es/documentos/es/conocermas/recursos_en_linea/publicaciones_y_estudios/publicaciones/MapasclimaticosdeEspana19812010/MapasclimaticosdeEspana19812010.pdf (accessed on 15 May 2021).
  68. Martín-Vide, J.; Olcina, J. Climas y Tiempos de España; Alianza Editorial: Madrid, Spain, 2001; p. 258. [Google Scholar]
  69. ESYRCE. Encuesta Sobre Superficies y Rendimientos de Cultivos. Ministerio de Agricultura, Pesca y Alimentación. España. 2019. Available online: https://www.mapa.gob.es/es/estadistica/temas/estadisticas-agrarias/agricultura/esyrce/ (accessed on 15 May 2021).
  70. INE. Instituto Nacional de Estadística. Available online: https://www.ine.es/jaxiT3/Tabla.htm?t=2876&L=0 (accessed on 15 May 2021).
  71. Herrera, S.; Gutiérrez, J.M.; Ancell, R.; Pons, M.R.; Frías, M.D.; Fernández, J. Development and analysis of a 50 year high-resolution daily gridded precipitation dataset over Spain (Spain02). Int. J. Climatol. 2012, 32, 74–85. [Google Scholar] [CrossRef] [Green Version]
  72. Herrera, S.; Fernández, J.; Gutiérrez, J.M. Update of the Spain02 gridded observational dataset for Euro-CORDEX evaluation: Assessing the effect of the interpolation methodology. Int. J. Climatol. 2016, 36, 900–908. [Google Scholar] [CrossRef] [Green Version]
  73. RIA Database. Available online: https://www.juntadeandalucia.es/agriculturaypesca/ifapa/riaweb/web/inicio_estaciones (accessed on 15 May 2021).
  74. SAIH. Available online: https://www.chguadalquivir.es/saih/ (accessed on 15 May 2021).
  75. MATRAS. Available online: https://matras.ujaen.es/ (accessed on 15 May 2021).
  76. IDEAL. Available online: https://www.ideal.es/hemeroteca/historico.html (accessed on 15 May 2021).
  77. Varnes, D.J. Slope movement, types and processes. In Landslides: Analysis and Control; Schuster, R.L., Krizek, R.J., Eds.; Transportation Research Board Special Report; National Academy of Sciences: Washington, DC, USA, 1978; Volume 176, pp. 12–33. [Google Scholar]
  78. Hungr, O.; Leroueil, S.; Picarelli, L. The Varnes classification of landslide types, an update. Landslides 2014, 11, 167–194. [Google Scholar] [CrossRef]
  79. Fell, R. Landslide risk assessment and acceptable risk. Can. Geotech. J. 1994, 31, 261–272. [Google Scholar] [CrossRef]
  80. Sánchez-Gómez, M.; Peláez, J.A.; García-Tortosa, F.J.; Pérez-Valera, F.; Sanz de Galdeano, C. La serie sísmica de Torreperogil (Jaén, Cuenca del Guadalquivir oriental): Evidencias de deformación tectónica en el área epicentral. Rev. Soc. Geol. Esp. 2014, 27, 301–318. [Google Scholar]
  81. Corominas, J.; Moya, J. Reconstructing recent landslide activity in relation to rainfall in the Llobregat River basin, Eastern Pyrenees, Spain. Geomorphology 1999, 30, 79–93. [Google Scholar] [CrossRef]
  82. Floris, M.; Mari, M.; Romeo, R.W.; Gori, U. Modelling of landslide-triggering factors—A case study in the Northern Apennines, Italy. In Lecture Notes in Earth Sciences: Engineering Geology for Infrastructure Planning in Europe; Hack, R., Azzam, R., Charlier, R., Eds.; Springer: Berlin/Heidelberg, Germany, 2004; Volume 104, pp. 745–753. [Google Scholar]
  83. Zezere, J.L.; Rodrigues, M.L. Rainfall thresholds for landsliding in Lisbon Area (Portugal). In Landslides; Rybar, J., Stemberk, J., Wagner, P., Eds.; A.A. Balkema: Lisse, The Netherlands, 2002; pp. 333–338. [Google Scholar]
  84. Trigo, R.M.; Pozo, D.; Timothy, C.; Osborn, J.; Castro, Y.; Gámiz, S.; Esteban, M.J. NAO influence on precipitation, river flow and water resources in the Iberian Peninsula. Int. J. Climatol. 2004, 24, 925–944. [Google Scholar] [CrossRef]
  85. Pozo-Vázquez, D.; Gámiz-Fortis, S.R.; Tovar-Pescador, J.; Esteban-Parra, M.J.; Castro-Díez, Y. El Niño—Southern Oscillation events and associated European winter precipitation anomalies. Int. J. Climatol. 2005, 25, 17–31. [Google Scholar] [CrossRef]
  86. Santos, M.; Fragoso, M.; Santos, J.A. Damaging flood severity assessment in Northern Portugal over more than 150 years (1865–2016). Nat. Hazards 2018, 91, 983–1002. [Google Scholar] [CrossRef]
  87. Lemus Cánovas, M.; López-Bustins, J.A. Variabilidad espacio-temporal de la precipitación en el sur de Cataluña y su relación con la oscilación del Mediterráneo Occidental (WeMO). In Proceedings of the X International Congress AEC: Clima, Sociedad, Riesgos y Ordenación del Territorio, Alicante, Spain, 5–8 October 2016; Volume 21, pp. 225–236. [Google Scholar]
  88. Alvioli, M.; Melillo, M.; Guzzetti, F.; Rossi, M.; Palazzi, E.; von Hardenberg, J.; Brunetti, M.T.; Peruccacci, S. Implications of climate change on landslide hazard in Central Italy. Sci. Total Environ. 2018, 630, 1528–1543. [Google Scholar] [CrossRef] [PubMed]
  89. Coe, J.A.; Godt, J.W. Review of approaches for assessing the impact of climate change on landslide hazards. In Proceedings of the Landslides and Engineered Slopes, Protecting Society through Improved Understanding 11th International and 2nd North American Symposium on Landslides and Engineered Slopes, Banff, AB, Canada, 3–8 June 2012; pp. 371–377. [Google Scholar]
  90. IPCC. Climate Change 2013: The Physical Science Basis. Contribution of Working Group I to the Fifth Assessment Report of the Intergovernmental Panel on Climate Change; Cambridge University Press: Cambridge, UK; New York, NY, USA, 2013. [Google Scholar]
  91. Gariano, S.L.; Guzzetti, F. Landslides in a changing climate. Earth Sci. Rev. 2016, 162, 227–252. [Google Scholar] [CrossRef] [Green Version]
  92. Lin-Ye, J.; García-León, M.; Gracia, V.; Ortego, M.I.; Conte, D.; Perez-Gomez, B.; Sánchez-Arcilla, A. Modelling of future extreme storm surges at the NW Mediterranean coast (Spain). Water 2020, 12, 472. [Google Scholar] [CrossRef] [Green Version]
  93. Mathbout, S.; Lopez-Bustins, J.A.; Royé, D.; Martin-Vide, J.; Benhamrouche, A. Spatiotemporal variability of daily precipitation concentratio and its relationship to teleconnection patterns over the Mediterranean during 1975–2015. Int. J. Climatol. 2019, 40, 1435–1455. [Google Scholar] [CrossRef]
  94. Viceto, C.; Marta-Almeida, M.; Rocha, A. Future climate change of stability indices for the Iberian Peninsula. Int. J. Climatol. 2017, 37, 4390–4408. [Google Scholar] [CrossRef]
  95. Fernández, T.; Gómez-López, J.M.; Pérez-García, J.L.; Cardenal, J.; Delgado, J.; Tovar-Pescador, J.; Sánchez-Gómez, M.; Calero, J. Analysis of the evolution of gully erosion in olive groves using photogrammetry techniques. Relationships with rainfall regime. ISPRS Ann. Photogramm. Remote Sens. Spat. Inf. Sci. 2020, VI-3/W1-2020, 19–26. [Google Scholar] [CrossRef]
Figure 1. Location, geological setting, and climatic characterization: (a) location; (b) geological setting; (c) mean annual precipitation (MAP) of the province; (d) series of annual precipitation; and (e) monthly precipitation.
Hydrology 08 00100 g001
Figure 2. Methodology workflow.
Hydrology 08 00100 g002
Figure 3. Map of incidences. Points: (009), gully; (019), undercutting of the road embankment; (035), flow; (047), creeping process; (054), slide in the road cut; (065), collapse over the road; (074), creeping process; (110), flow and gullies; (112), flow and creep; (180), slide in the slope of the road.
Hydrology 08 00100 g003
Figure 4. Rainfall series of the incidence points shown in Figure 3.
Hydrology 08 00100 g004
Figure 5. Rainfalls series (two-year) for the incidence points 099 and 174: (a,b), Daily rainfall; (c,d), 7-day antecedent rainfall; (e,f), 15-day antecedent rainfall; (g,h), 30-day antecedent rainfall; and (i,j), 90-day antecedent rainfall. Red arrows represent the days (E–D pairs) selected as rainfall events for each point.
Hydrology 08 00100 g005
Figure 6. Isohyets maps of some events: (a) 31/12/1997 (D = 60 days); (b) 30/12/2009 (D = 15 days); (c) 13/01/2010 (D = 30 days); (d) 22/02/2010 (D = 75 days); (e) 03/11/2012 (D = 2 days); and (f) 08/11/2012 (D = 7 days).
Hydrology 08 00100 g006
Figure 7. Duration of rainfall event for incidences of the different typologies (a): Gullies; (c): undercut in road embankments; (e): slides in road cuts; (g): collapses; (i): total of lower magnitude (very shallow) incidences; (b): slides; (d): flows; (f): creep; (h): total of higher magnitude (shallow) incidences; and (j) all incidences.
Hydrology 08 00100 g007
Figure 8. Rainfall thresholds: (a) E–D for lower magnitude incidences; (b) I–D for lower magnitude incidences; (c) E–D for higher magnitude incidences; (d) I–D for higher magnitude incidences; (e) E–D for all incidences; and (f) I–D for all incidences.
Hydrology 08 00100 g008
Table 1. News about incidences registered in the local media: S, slides; R, (rock)falls; M, mud and earth; U, road undercut; W, water, F, floods; T, traffic cuts. Sectors: SS, Sierra Sur; SM, Sierra Mágina; SC, Sierra Cazorla; SG, Sierra Segura; J, Jaén (capital city); CH, Central Hills; W, Western sector; N, Northern sector; Gen., general.
DateDescriptionZone
12/09/2006R, M, W, FSS, W
06/04/2007R, MSG
10/09/2008M, W, TCH, N
08/08/2009RN
11/08/2009M, TSS
25/12/2009M, TGen.
28/12/2009R, M, F, TSS, SC, J, CH
07/01/2010W, TSS, SM, SC, SG, W
11/01/2010R, U, F, TSS, SC, W
15/01/2010S, RSS, W
19/01/2010S, R, U, TSS, SC, J, CH
19/02/2010S, R, UGen.
21/02/2010S, R, USS, SC, SG, J, CH
23/02/2010R, F, TGen.
07/03/2010S, TSS, J, W
10/03/2010S, U, FSS, SM, CH
30/10/2010R, W, TSM, CH
08/12/2010RSS, J, N
20/12/2010R, M, WGen.
02/05/2011M, TCH, N
04/11/2012R, W, TGen.
06/11/2012TJ, W, N
08/11/2012TSC, CH, W, N
11/03/2013S, M, U, TSG, CH, W, N
13/03/2013S, M, U, TGen.
19/03/2013RSS
01/04/2013R, F, TSC, SG, CH, W, N
Table 2. Distribution of incidences by typologies.
MagnitudeTypologyNumber
Lower magnitude
Very shallow
Gullies 46
Undercut in road embankments 30
Slides in road cuts38
Collapses in road cuts9
Higher magnitude
Shallow
Slides21
Flows26
Creep16
Table 3. Distribution of incidences by year in which the civil work started.
YearNumberYearNumber
1998220062
1999520071
2000320082
2001320093
20022201061
20031201118
2004320123
20054201370
Table 4. Main rainfall events associated to incidences. Sector: SS, Sierra Sur; SM, Sierra Mágina; SC, Sierra Cazorla; SG, Sierra Segura; J, Jaén sector; CH, Central Hills; W, Western sector; N, Northern sector; Gen., General.
DateNumber of PointsMean E (mm)Modal D (Days)Mean I (mm/d)Modal T
(Years)
Sector
03/11/1997594.20247.1015.00SS, SM, W
31/12/19975411.25606.749.00SS, SC, SG
20/10/1999650.38150.3822.50SC, SG, W
28/03/2004675.67327.9211.25SS, W, N
08/04/2008550.50150.5015.00SS, CH, W
25/12/200918143.29528.6645.00Gen.
30/12/200926210.341514.0222.50Gen.
06/01/201010268.50308.957.50SS, SM, SC, SG
11/01/20107344.273011.4822.50SS, SC, W
13/01/201013324.083010.8015.00Gen.
15/02/20106435.90607.1522.50SS, SM, CH
22/02/201041568.15757.5815.00Gen.
02/03/201011662.56907.3615.00Gen.
30/10/2010636.75136.755.00SM, SG, CH
06/12/20101379.40239.706.43SS, SM, SG, N
31/12/20105362.00458.0411.25CH
14/02/20116451.37.506.43SS, SG, CH
27/09/20121559.20159.2011.25SS, CH, W
03/11/20125972.27236.1415.00Gen.
08/11/201251151.38721.639.00Gen.
11/03/201343119.42717.065.00Gen.
18/03/20136166.3015.11.096.43SS
Table 5. Mean values of rainfall amount (E), duration (D), and intensity (I) for the rainfall events.
TypologyMean E (mm)Mean D (days)Modal D (days)Mean I (mm/day)
Gullies147.3311.78128.11
Road embankment126.818.84132.55
Slides in road cuts171.8415.42726.66
Collapses209.0526.45120.49
Lower magnitude
(very shallow)
155.2913.40128.09
Slides234.7923.65121.77
Flows211.6819.75721.97
Creep227.8721.95722.79
Higher magnitude
(shallow)
223.4021.60722.11
Total178.9616.25726.01
Table 6. Equations for E–D (linear and power-law) and I–D thresholds.
TypologyE–D (Linear)E–D (Power-Law)I–D (Power-Law)
EquationR2EquationR2EquationR2
GulliesE = 6.294 D + 73.1870.90E = 47.283 D0.5430.90I = 47.283 D−0.4570.87
Road embankmentE = 5.985 D + 73.9090.90E = 51.155 D0.5160.87I = 51.155 D−0.4840.85
Slides in road cutsE = 6.586 D + 70.3010.92E = 46.313 D0.5540.89I = 46.313 D−0.4460.84
CollapsesE = 5.595 D + 61.0230.85E = 39.080 D0.5640.94I = 39.080 D−0.4360.90
Very shallowE = 6.222 D + 71.9080.90E = 47.481 D0.5400.89I = 47.481 D−0.4600.86
SlidesE = 6.793 D + 74.1060.95E = 47.089 D0.5430.94I = 47.089 D−0.4510.91
FlowsE = 6.293 D + 87.3660.94E = 51.721 D0.5230.93I = 51.722 D−0.4770.91
CreepingE = 6.488 D + 85.4640.93E = 50.537 D0.5460.94I = 50.537 D−0.4540.91
ShallowE = 6.527 D + 82.4240.94E = 49.752 D0.5380.93I = 49.752 D−0.4620.91
TotalE = 6.408 D + 74.8290.92E = 47.961 D0.5420.91I = 47.961 D−0.4580.88
Table 7. Comparison of the calculated thresholds with those obtained by other authors.
Threshold TypeThis StudyOther Studies 1
E–D linear E = 6.228 D + 69.716 (low)E = 6.21 D + 90.8 (low) [51]
(mm–days)E = 6.408 D + 74.829 (mean)E = 6.98 D + 181.3 (mean) [51]
E = 4.57 D + 133 [81]
E–D power-law E = 47.961 D0.542E = 73.33 D0,76 (Ecuador) [52]
(mm–days) E = 52.34 D0,42 (Spain) [52]
E–D linear
(mm–hours)
E = 0.267 D + 74.829E = 70.00 + 0.2625 D [83]
E–D power-lawE = 8.557 D0.542E = 7.7 D0.39 [46]
(mm–hours) E = 8.6 D0.41 [47]
E = 5.6 D0.40 [49]
E = 6.0 D0.47 [50]
E = 6.1 D0.52 [53]
I–D I = 47.961 D−0.458I = 88.005 D−0.69 [28]
power-law (mm/days–days) I = 68.645 D−0.593 [82]
I = 84.3 D−0.57 [40]
I–D I = 8.557 D−0.458I = 0.48 + 7.2 D−1 [15]
power-law (mm/hours–hours) I = 9.40 D−0.56 [42]
I = 2.20 D−0.44 [43]
I = 7.17 D−0.55 [44]
IMAP–D IMAP = 0.0187 D−0.484I MAP = 0.76 D−0.33 [19]
(%–hours) I MAP = 0.007 D−0.54 [42]
I MAP = 0.0016 D−0.40 [43]
1 Some thresholds are average values from the considered studies.
Table 8. Rainfall and intensity for the different durations considered in the thresholds of mean and lower values.
1 d2 d3 d5 d7 d10 d15 d30 d45 d60 d75 d90 d
E med818894107120139171267363459555652
E min768288101113132163257350443537630
I med8144312117141198877
I min7641292016131198777
Publisher’s Note: MDPI stays neutral with regard to jurisdictional claims in published maps and institutional affiliations.

