
Hydrological Connectivity in a Permafrost Tundra Landscape near Vorkuta, North-European Arctic Russia


Abstract
:1. Introduction
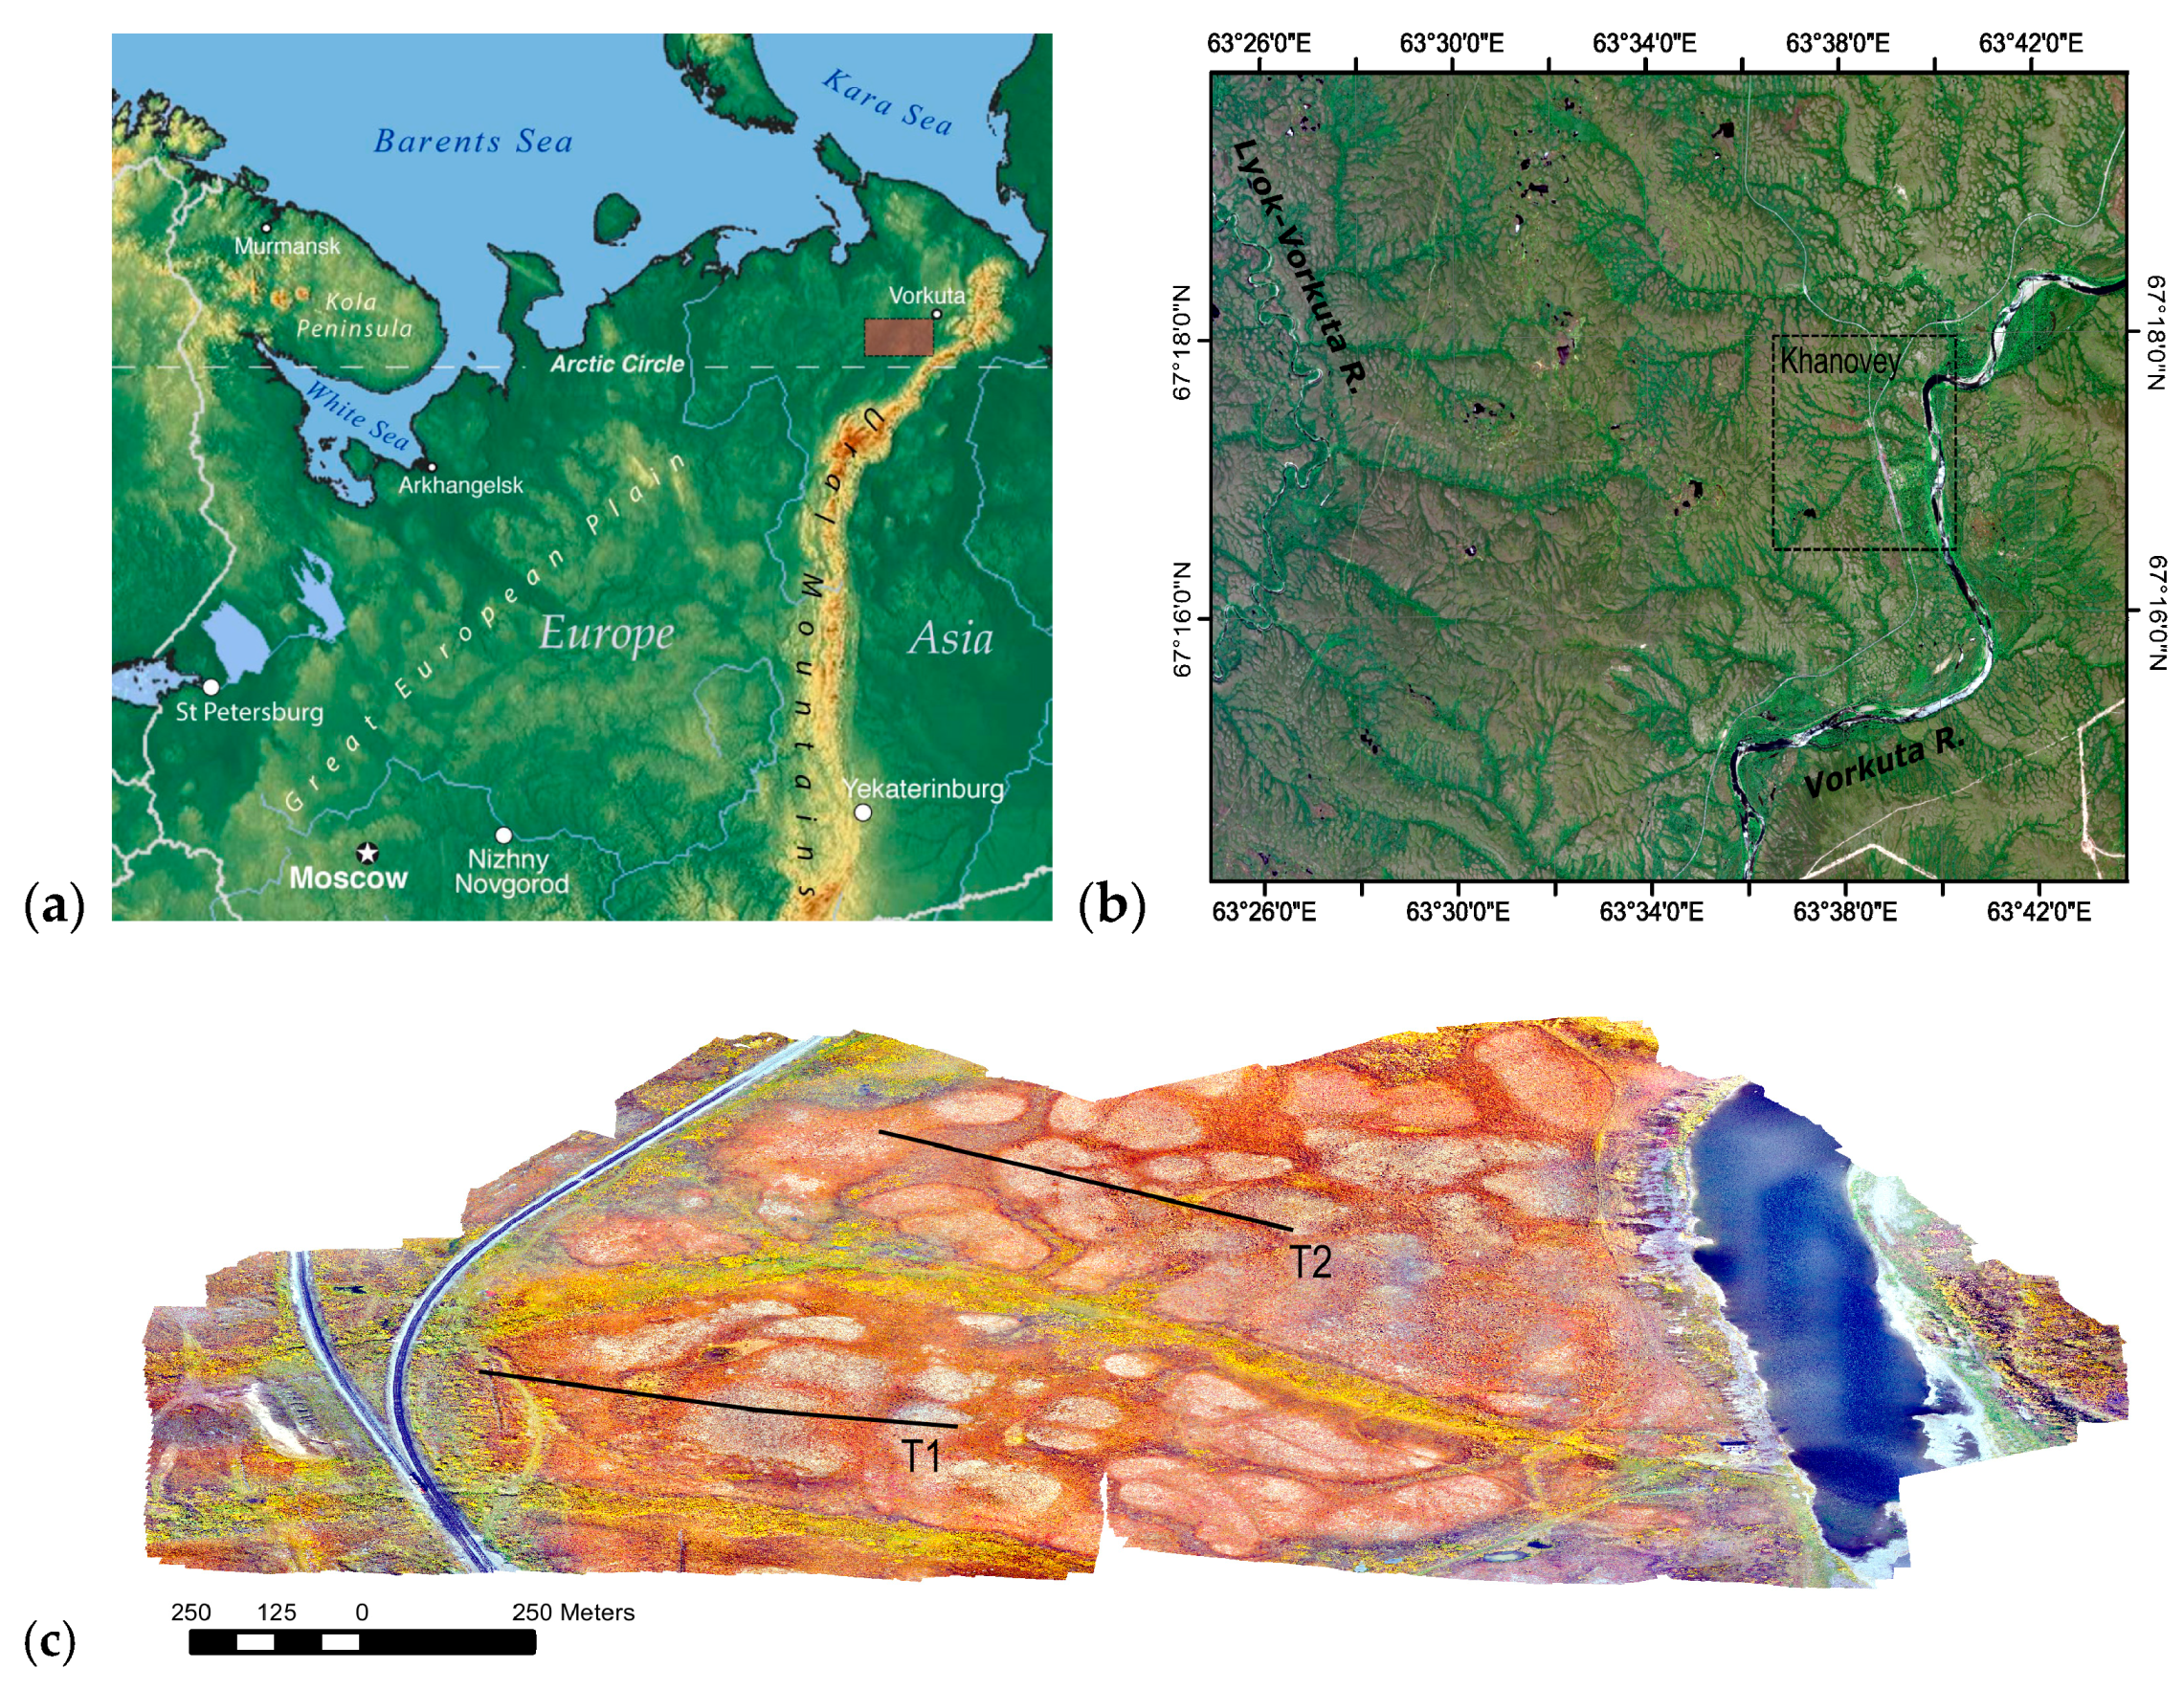
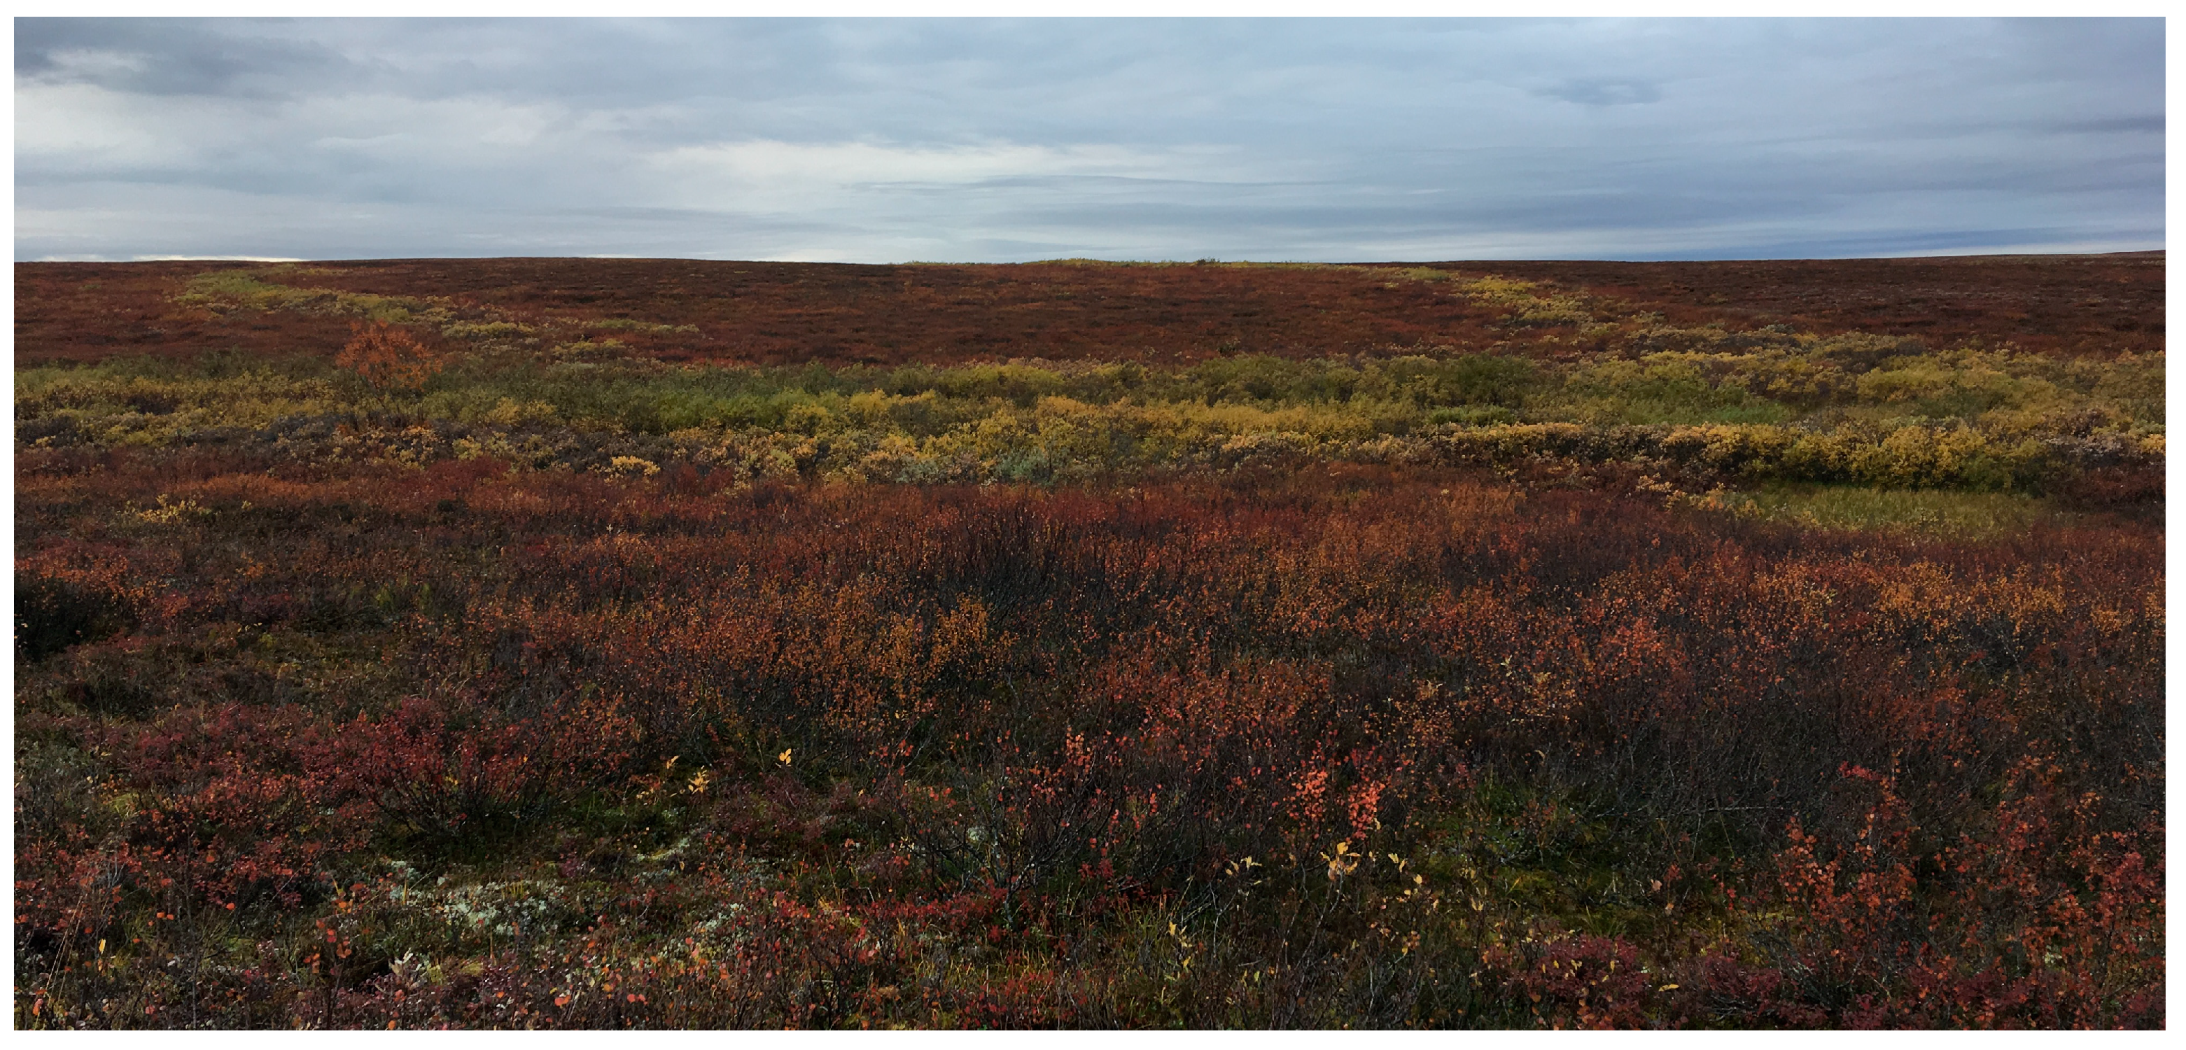
2. Study Area
3. Materials and Methods
4. Results
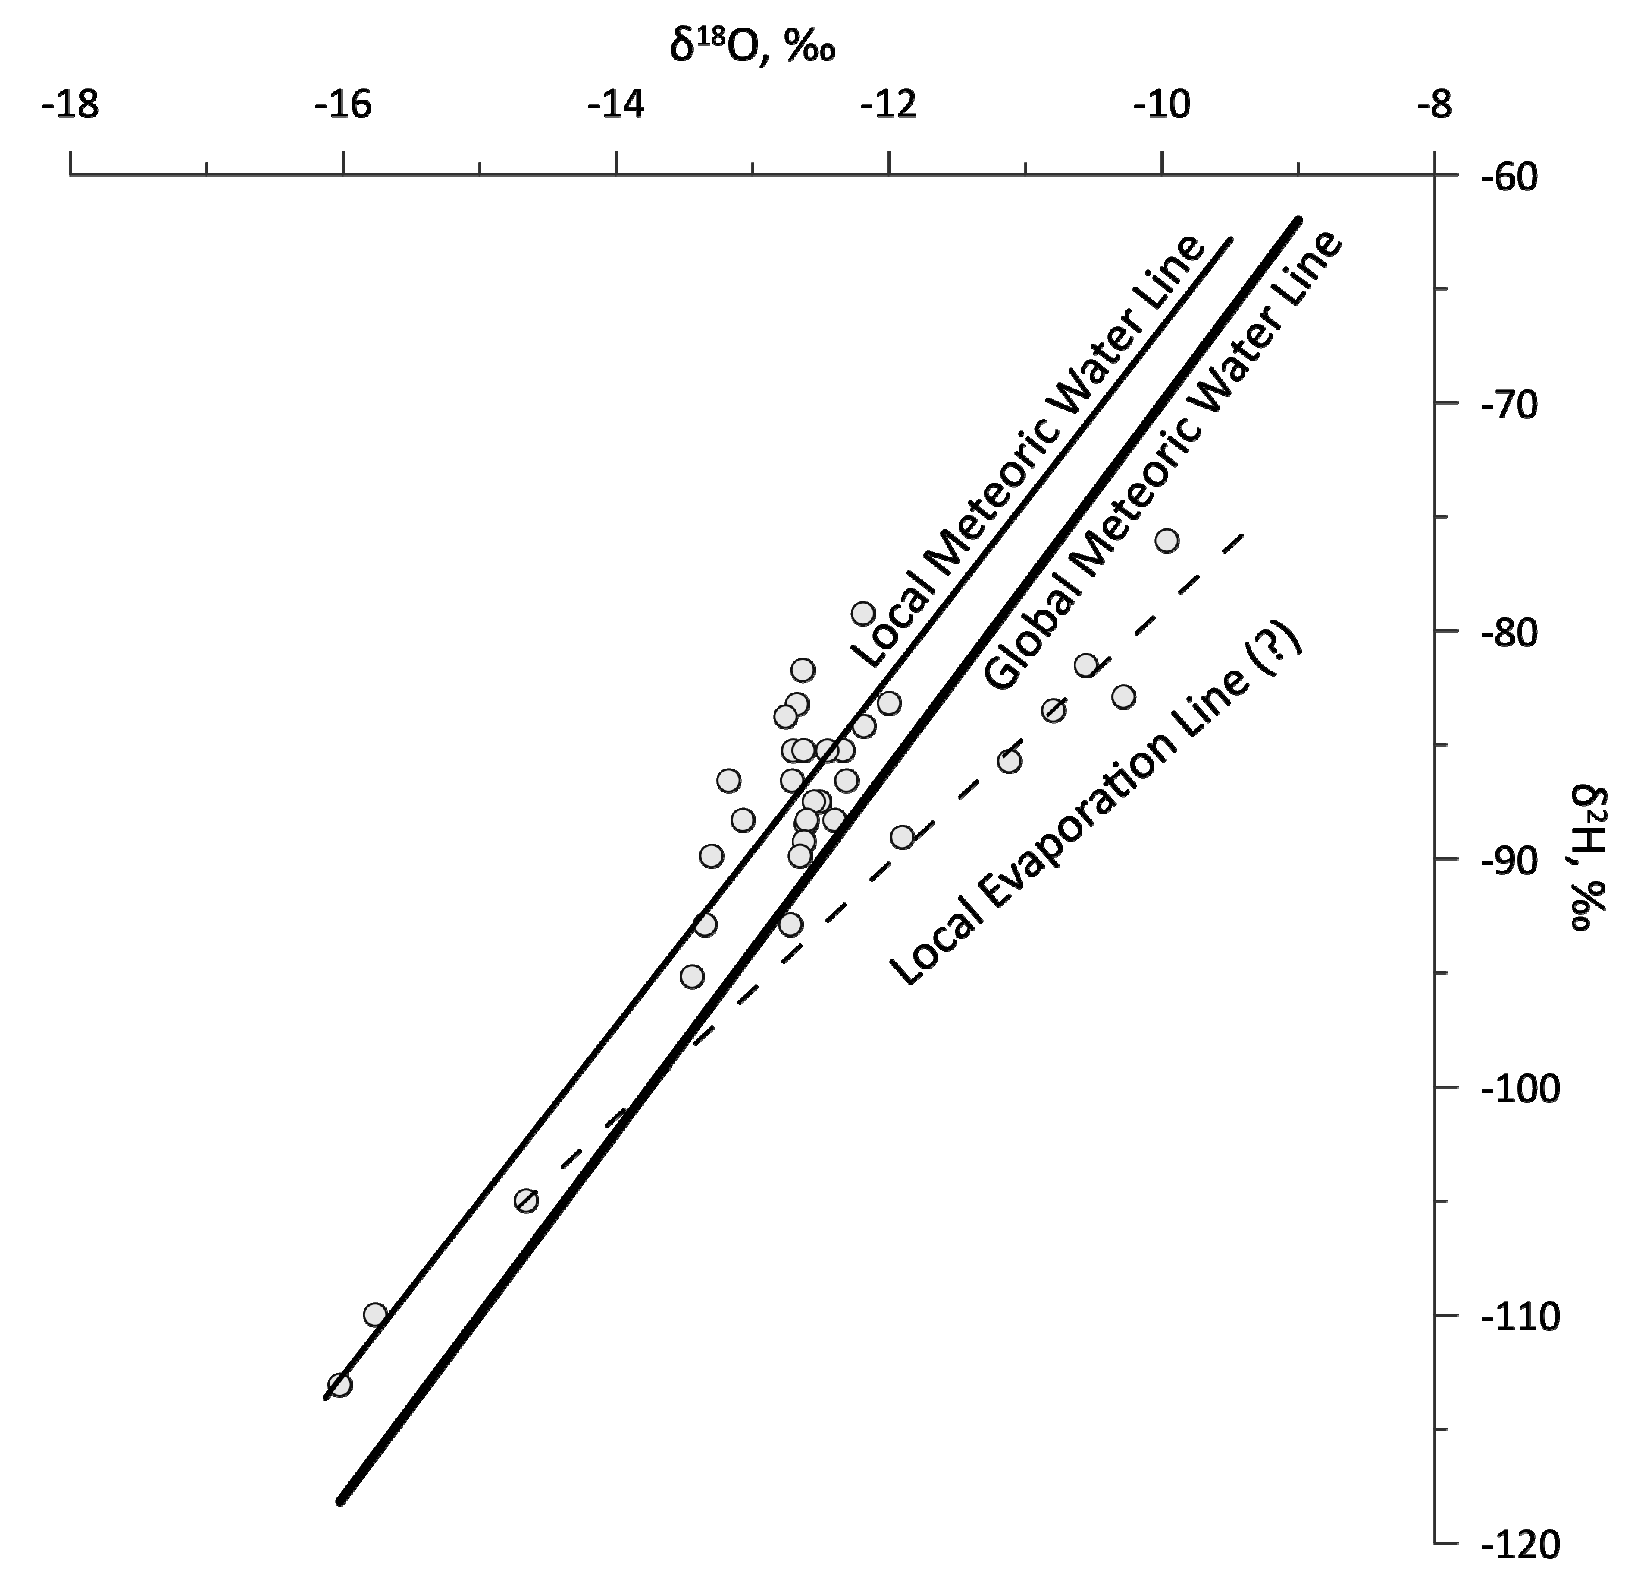
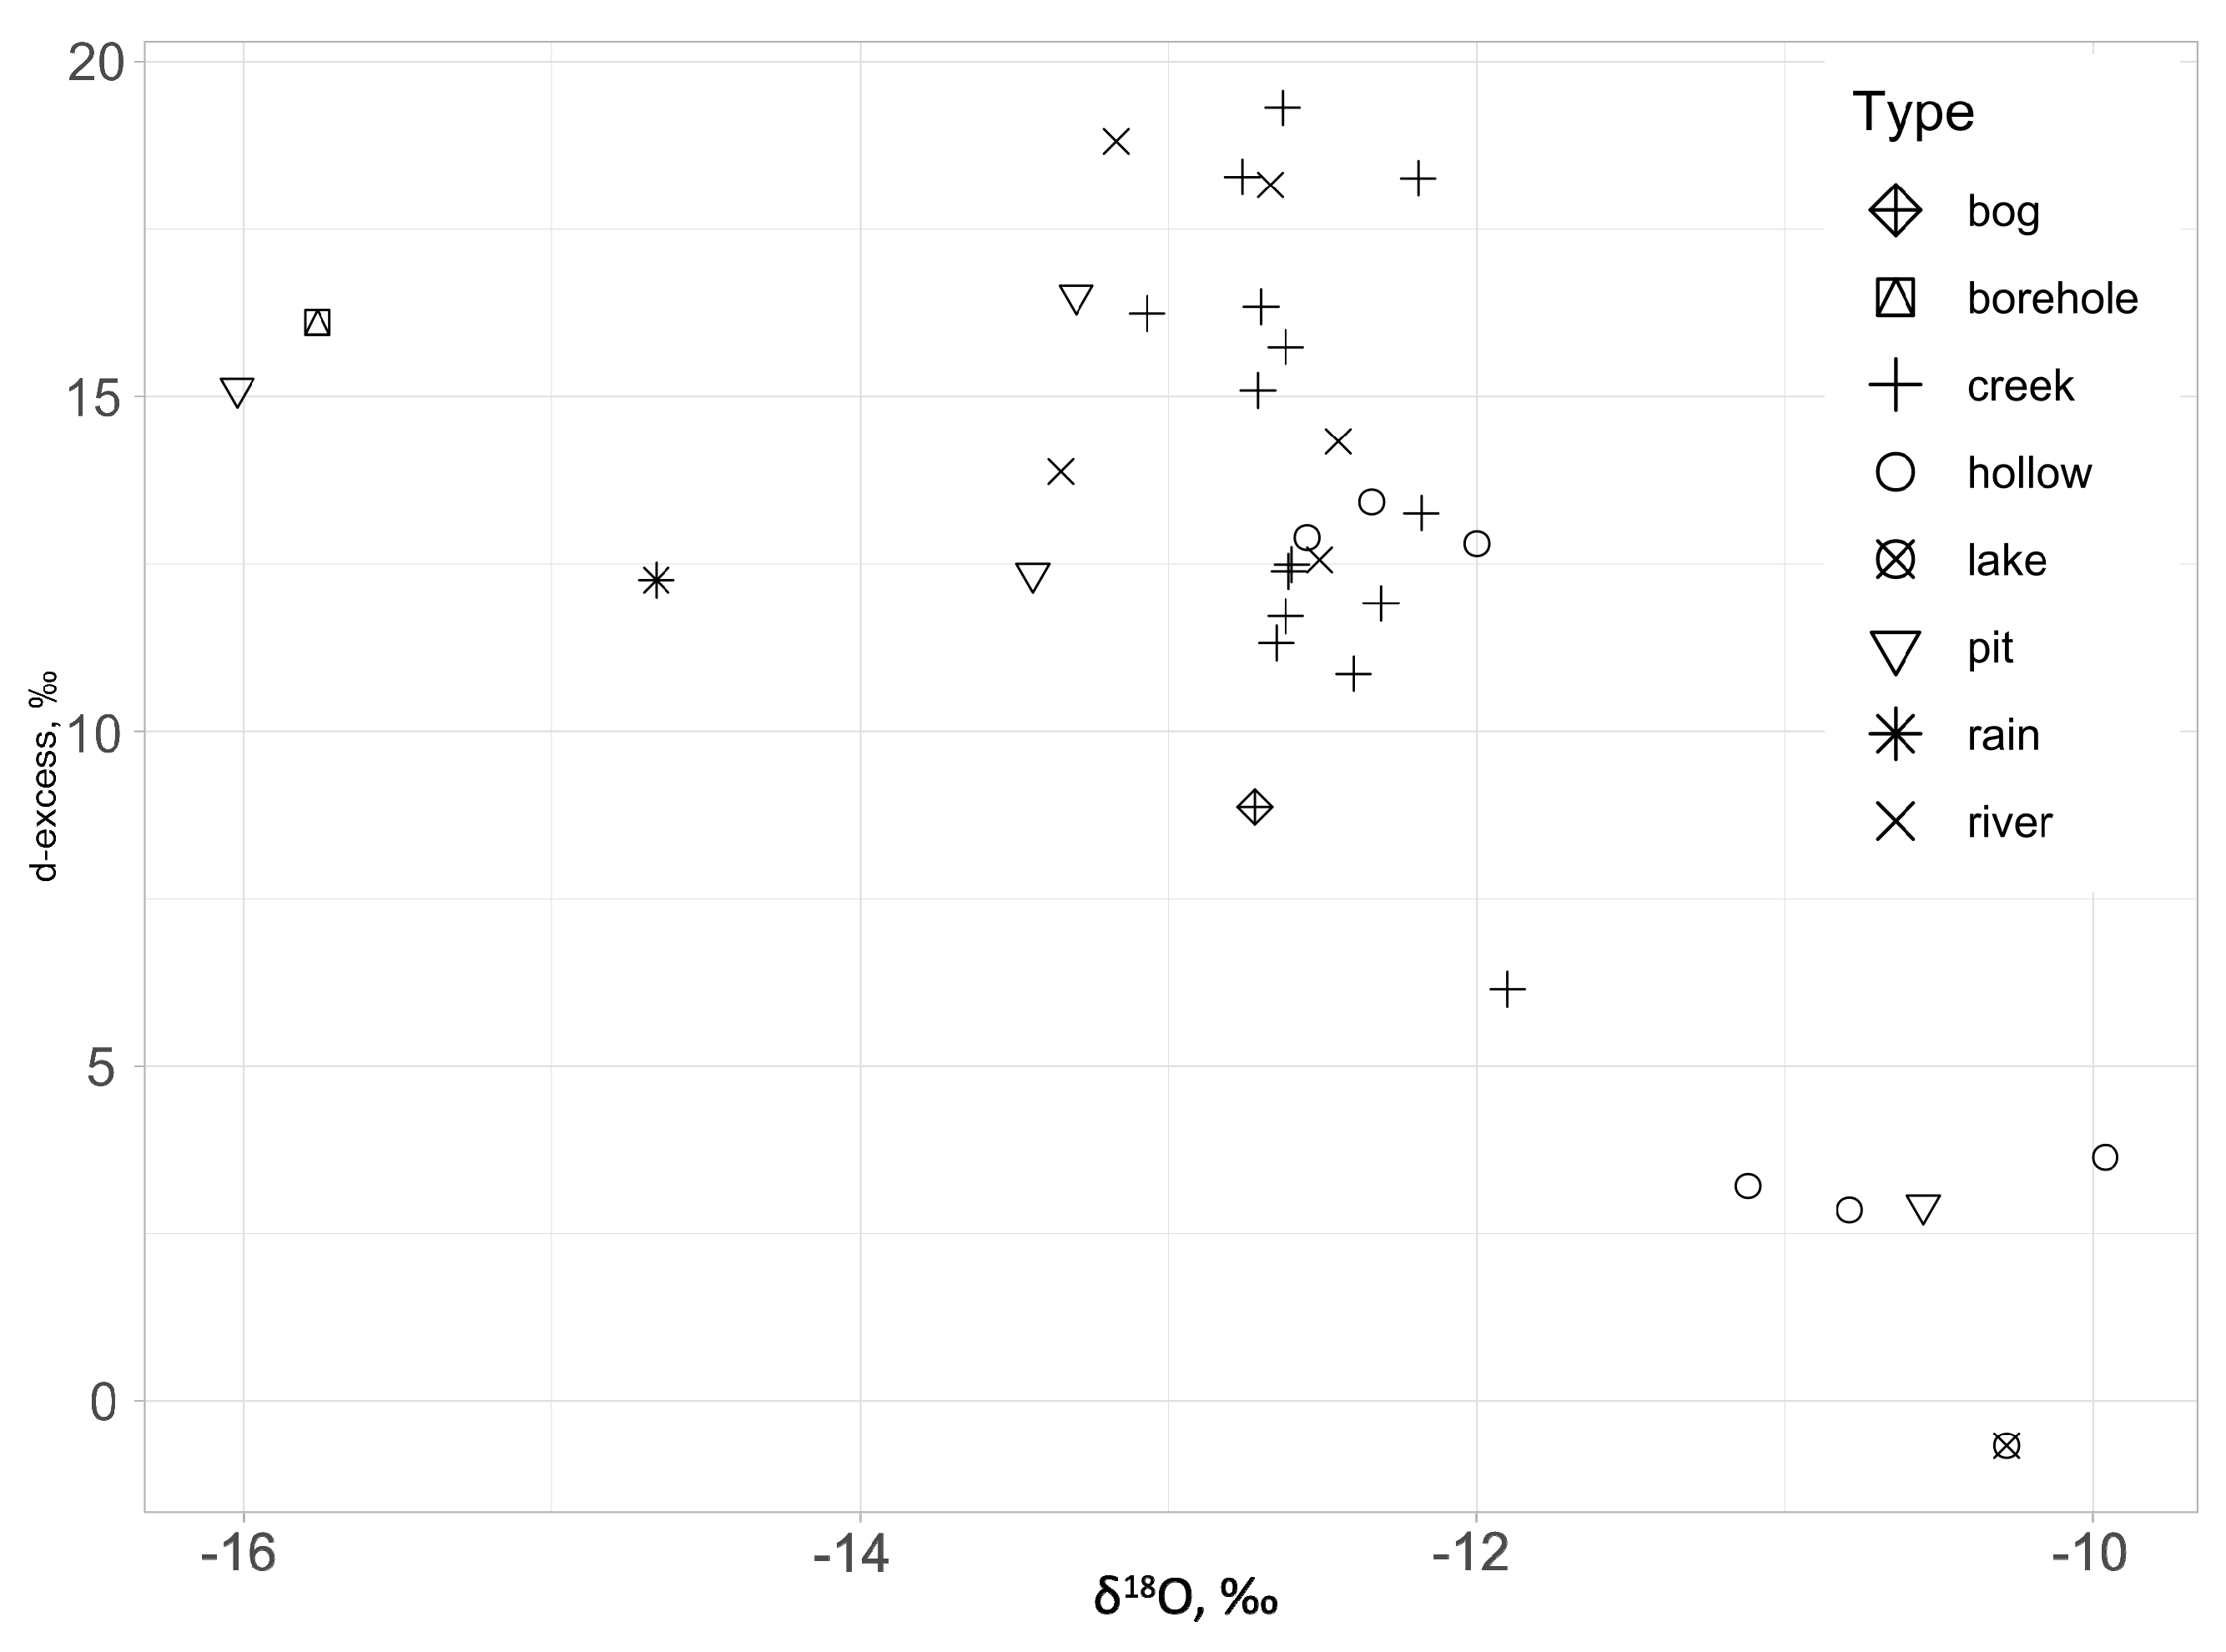
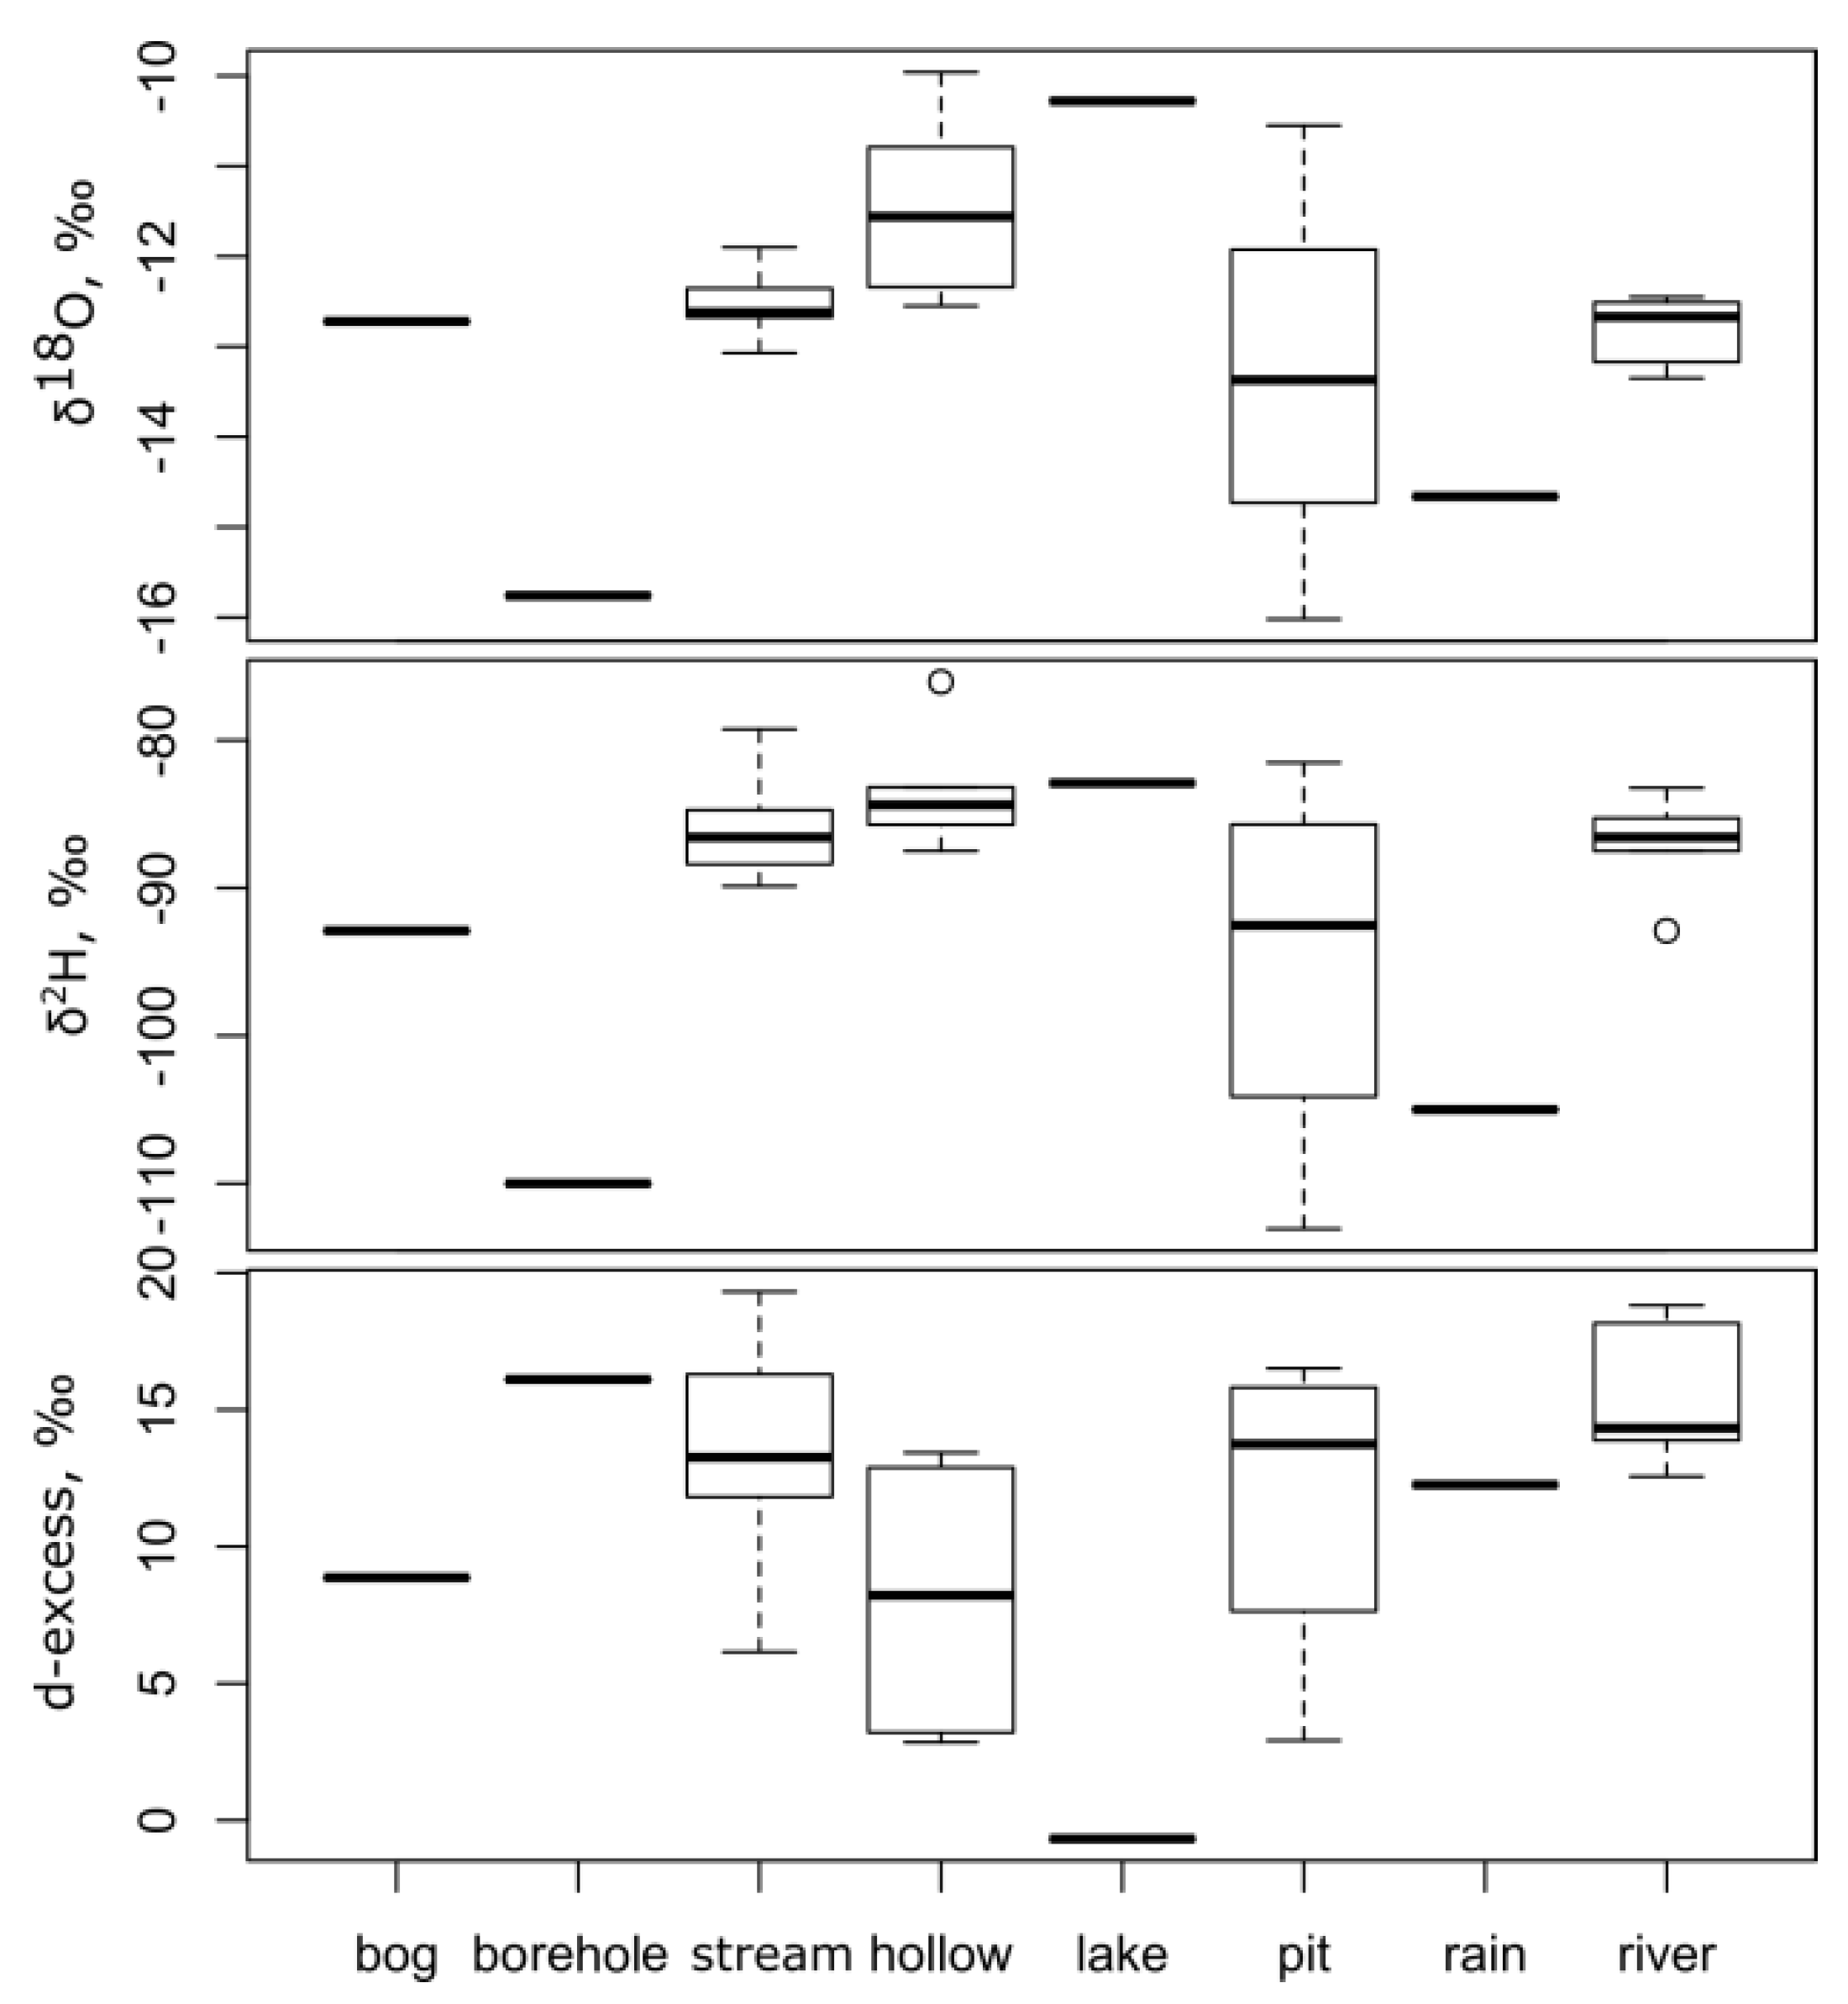
4.1. Water Stable Isotopes
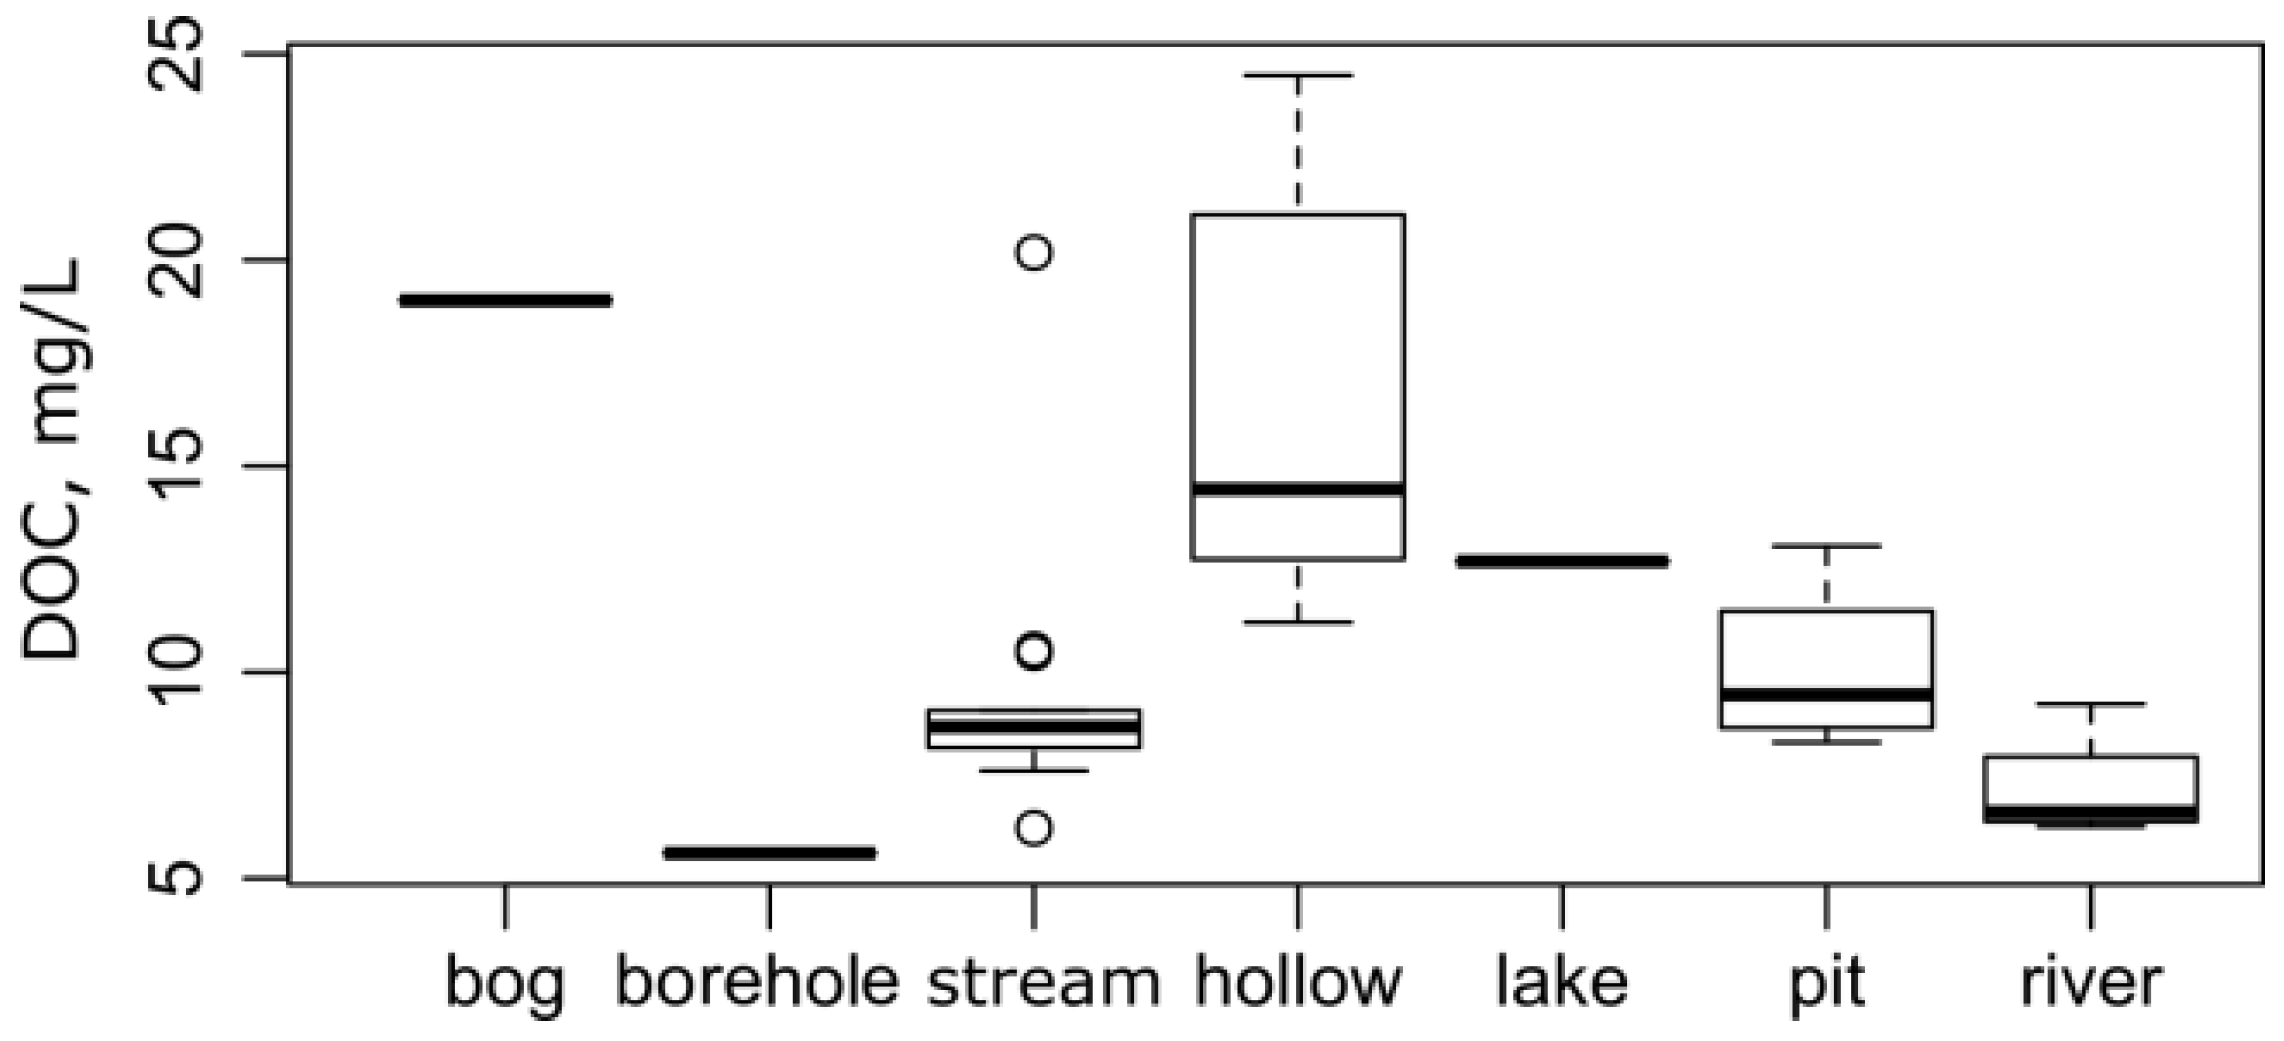
4.2. Dissolved Organic Carbon
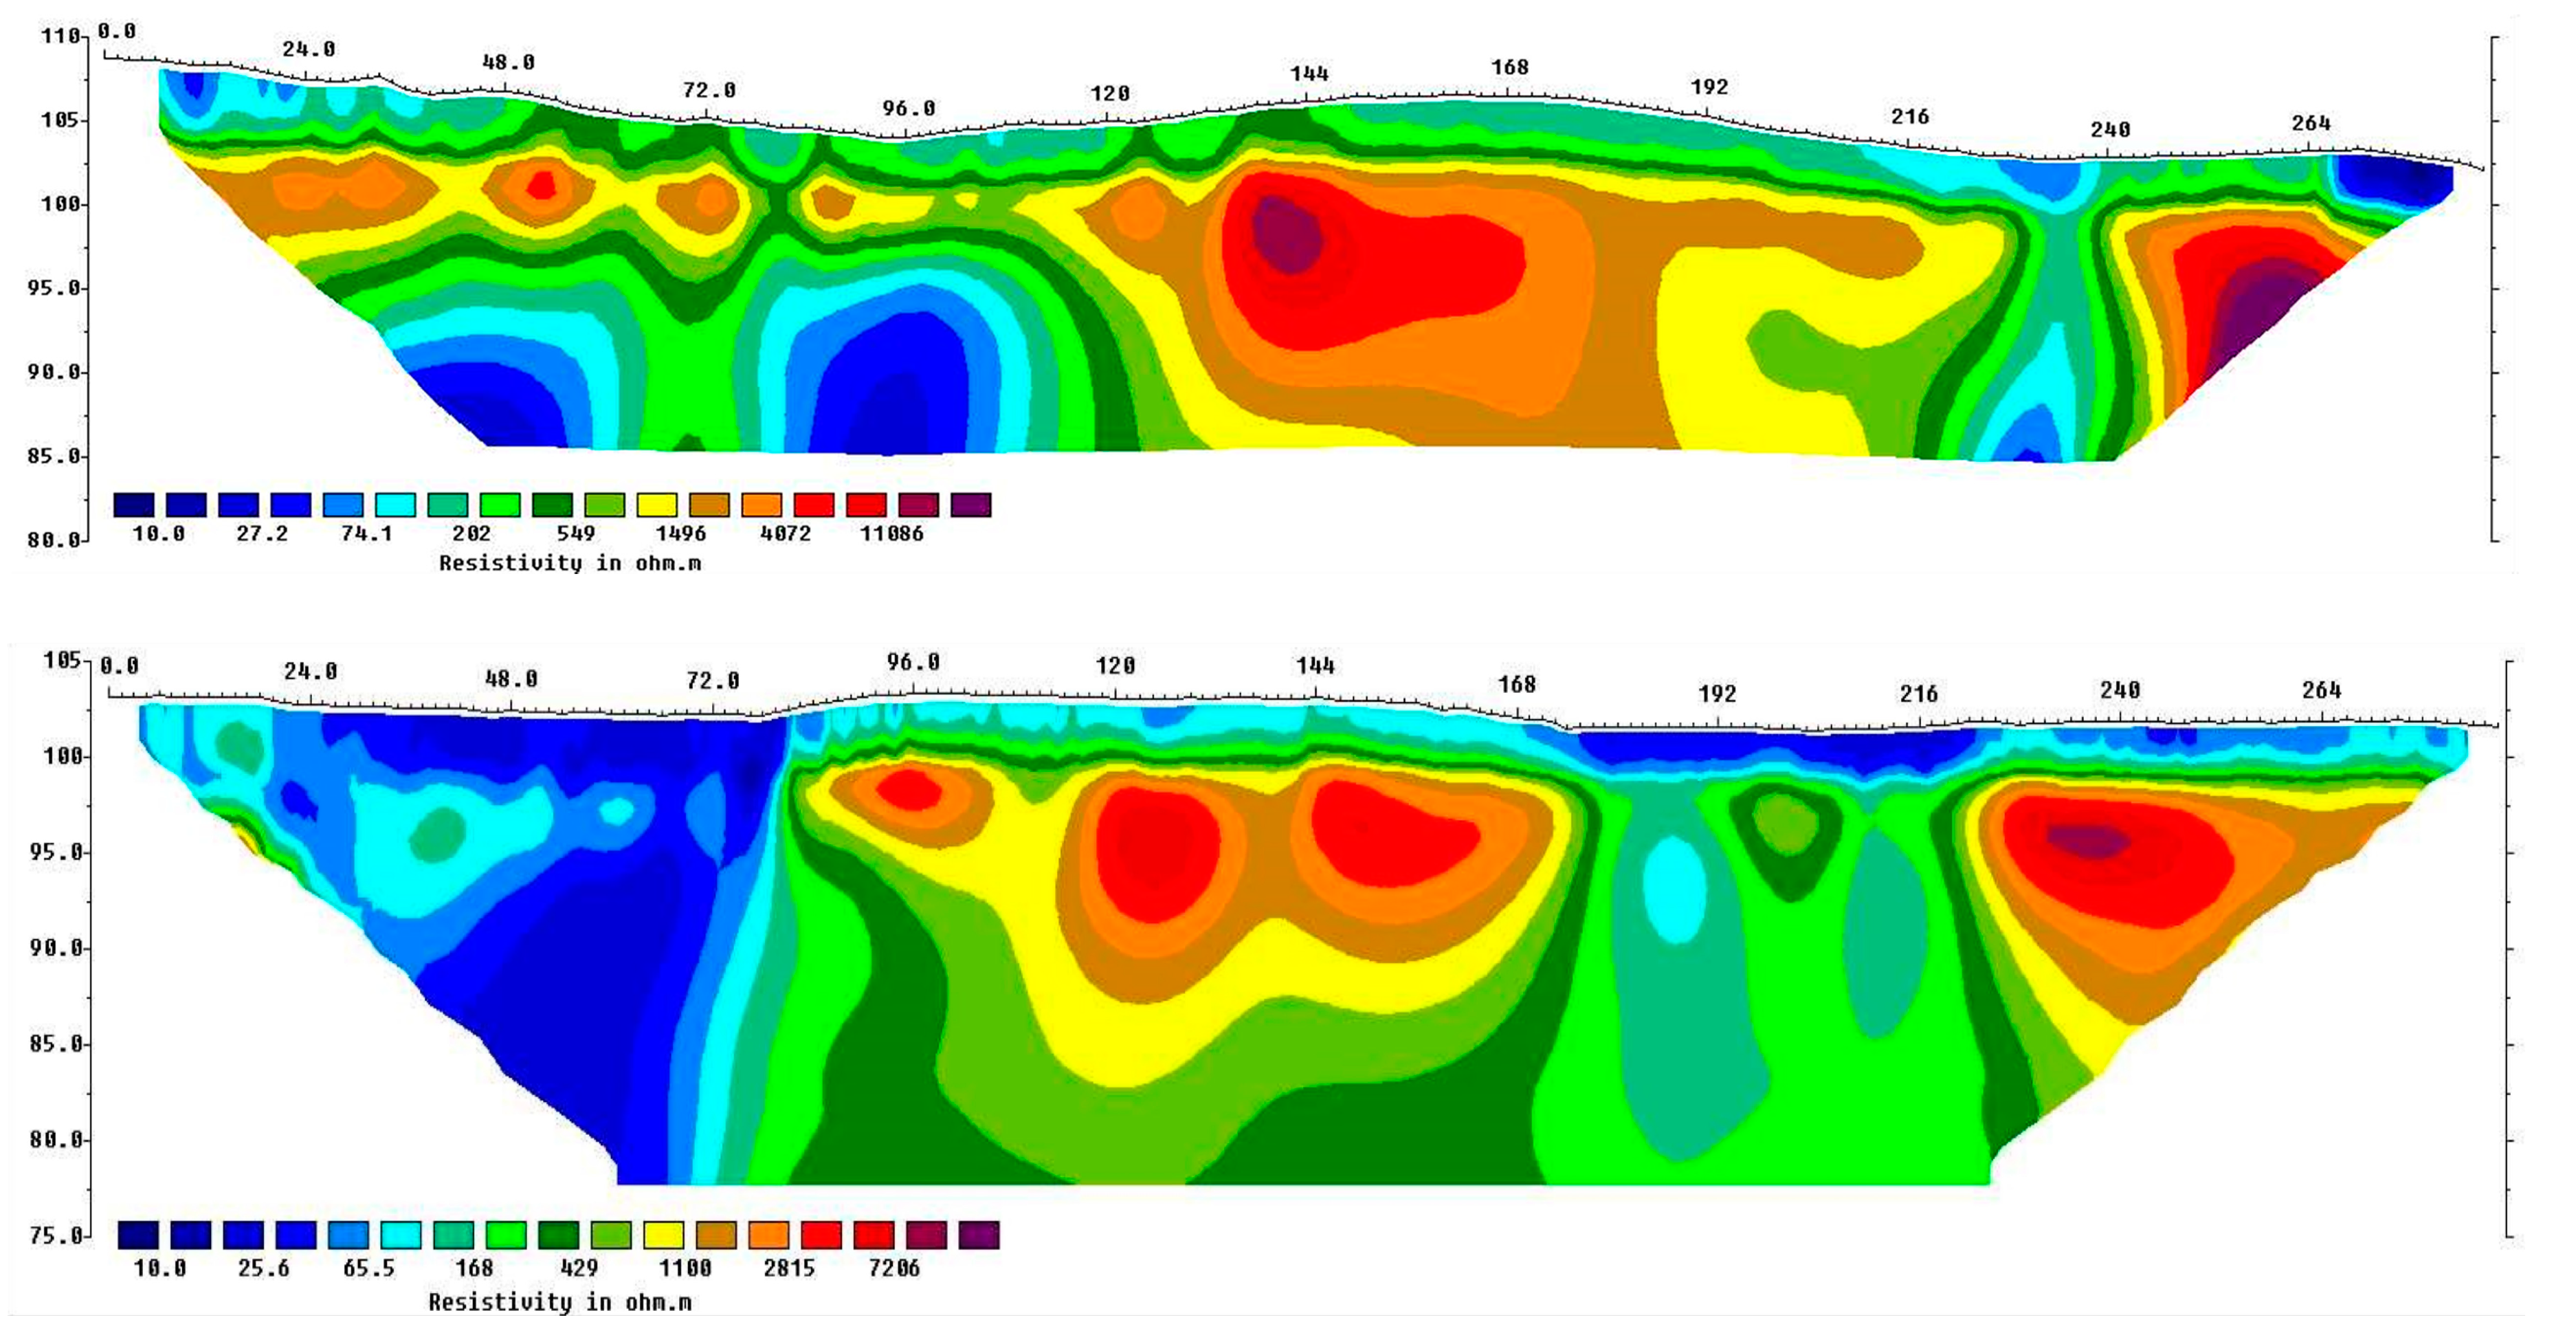
4.3. Electric Resistivity Tomography (ERT)
5. Discussion
5.1. Hydrological Connectivity at a Catchment Scale
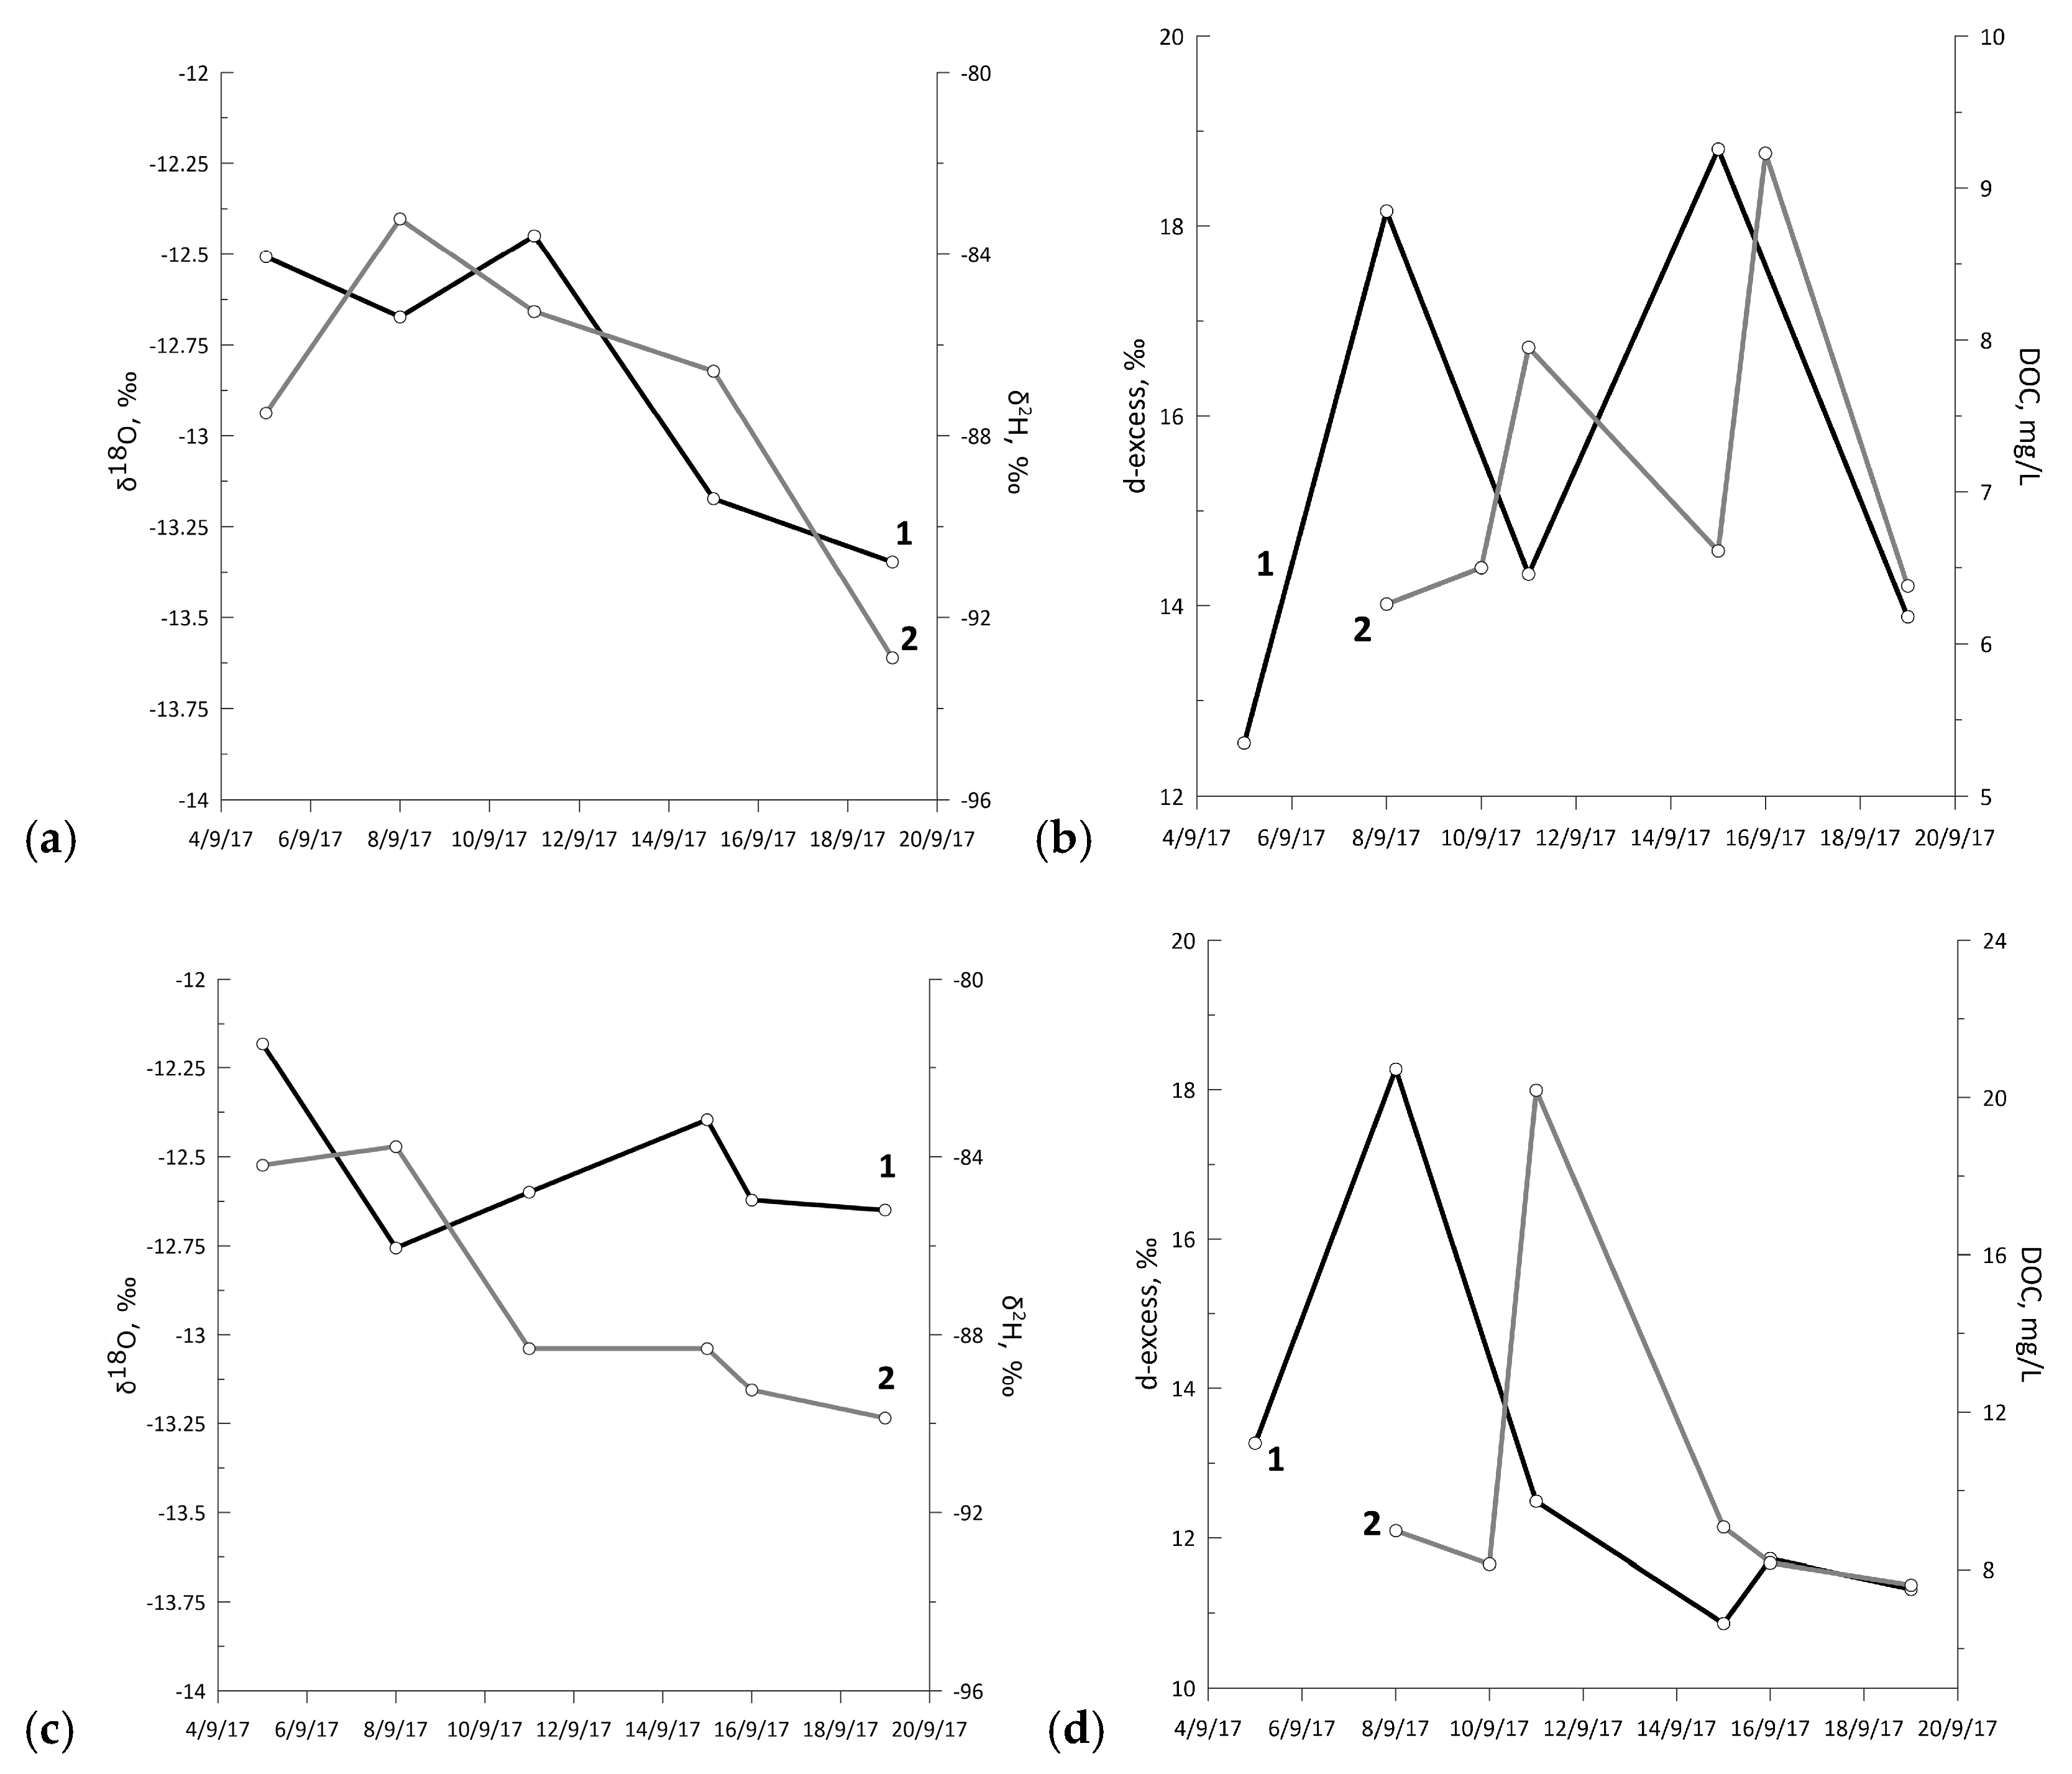
5.2. Temporal Evolution of Water Isotopic Composition
5.3. DOC Export from the Catchment
5.4. Subpermafrost Groundwater Input
5.5. Water Tracks: Current and Future Development
6. Conclusions
Author Contributions
Funding
Data Availability Statement
Acknowledgments
Conflicts of Interest
References
- Bracken, L.J.; Croke, J. The concept of hydrological connectivity and its contribution to understanding runoff-dominated geomorphic systems. Hydrol. Process. 2007, 21, 1749–1763. [Google Scholar] [CrossRef]
- Cammeraat, L.H. A review of two strongly contrasting geomorphological systems within the context of scale. Earth Surf. Process. Landf. 2002, 27, 1201–1222. [Google Scholar] [CrossRef]
- Pringle, C. What is hydrologic connectivity and why is it ecologically important? Hydrol. Process. 2003, 17, 2685–2689. [Google Scholar] [CrossRef]
- Bracken, L.J.; Wainwright, J.; Ali, G.A.; Tetzlaff, D.; Smith, M.W.; Reaney, S.M.; Roy, A.G. Concepts of hydrological connectivity: Research approaches, pathways and future agendas. Earth Sci. Rev. 2013, 119, 17–34. [Google Scholar] [CrossRef] [Green Version]
- Guzmán, P.; Anibas, C.; Batelaan, O.; Huysmans, M.; Wyseure, G. Hydrological connectivity of alluvial Andean valleys: A groundwater/surface-water interaction case study in Ecuador. Hydrogeol. J. 2016, 24, 955–969. [Google Scholar] [CrossRef] [Green Version]
- Woo, M.-K. Permafrost Hydrology; Springer: Berlin/Heidelberg, Germany, 2012; 575p. [Google Scholar]
- Tananaev, N.; Teisserenc, R.; Debolsky, M. Permafrost hydrology research domain: Process-based adjustment. Hydrology 2020, 7, 6. [Google Scholar] [CrossRef] [Green Version]
- Gao, H.; Wang, J.; Yang, Y.; Pan, X.; Ding, Y.; Duan, Z. Permafrost hydrology of the Qinghai-Tibet Plateau: A review of processes and modeling. Front. Earth Sci. 2021, 8, 576838. [Google Scholar] [CrossRef]
- Boike, J.; Roth, K.; Overduin, P.P. Thermal and hydrologic dynamics of the active layer at a continuous permafrost site (Taymyr Peninsula, Siberia). Water Resour. Res. 1998, 34, 355–363. [Google Scholar] [CrossRef]
- Shepelev, V.V. Suprapermafrost waters of the cryolithosphere and their classification. Geogr. Nat. Resour. 2009, 30, 151–155. [Google Scholar] [CrossRef]
- Fotiev, S.M. Underground waters of cryogenic areas of Russia (classification). Earth Cryosphere 2013, 17, 41–59. (In Russian) [Google Scholar]
- Gooseff, M.N.; Wlostowski, A.; McKnight, D.M.; Jaros, C. Hydrologic connectivity and implications for ecosystem processes—Lessons from naked watersheds. Geomorphology 2017, 277, 63–71. [Google Scholar] [CrossRef] [Green Version]
- Briggs, M.A.; Walvoord, M.A.; McKenzie, J.M.; Voss, C.I.; Day-Lewis, F.D.; Lane, J.W. New permafrost is forming around shrinking Arctic lakes, but will it last? Geophys. Res. Lett. 2014, 41, 1585–1592. [Google Scholar] [CrossRef]
- Ling, F.; Wu, Q.; Zhang, T.; Niu, F. Modelling open-talik formation and permafrost lateral thaw under a thermokarst lake, Beiluhe basin, Qinghai-Tibet Plateau. Permafr. Periglac. Process. 2012, 23, 312–321. [Google Scholar] [CrossRef]
- You, Y.; Yu, Q.; Pan, X.; Wang, X.; Guo, L. Geophysical imaging of permafrost and talik configuration beneath a thermokarst lake. Permafr. Periglac. Process. 2017, 28, 470–476. [Google Scholar] [CrossRef]
- Pavlova, N.; Lebedeva, L.; Efremov, V. Lake water and talik groundwater interaction in continuous permafrost, Central Yakutia. E3S Web Conf. 2019, 98, 7024. [Google Scholar] [CrossRef]
- Wellman, T.P.; Voss, C.I.; Walvoord, M.A. Impacts of climate, lake size, and supra- and sub-permafrost groundwater flow on lake-talik evolution, Yukon Flats, Alaska (USA). Hydrogeol. J. 2013, 21, 281–298. [Google Scholar] [CrossRef]
- Connon, R.F.; Quinton, W.L.; Craig, J.R.; Hayashi, M. Changing hydrologic connectivity due to permafrost thaw in the lower Liard River valley, NWT, Canada. Hydrol. Process. 2014, 28, 4163–4178. [Google Scholar] [CrossRef]
- Walvoord, M.A.; Kurylyk, B.L. Hydrologic impacts of thawing permafrost—A review. Vadoze Zone J. 2016, 15, 1–20. [Google Scholar] [CrossRef]
- Lamontagne-Hallé, P.; McKenzie, J.M.; Kurylyk, B.L.; Zipper, S.C. Changing groundwater discharge dynamics in permafrost regions. Environ. Res. Lett. 2018, 13, 084017. [Google Scholar] [CrossRef]
- Hayashi, M.; Quinton, W.L.; Pietroniro, A.; Gibson, J.J. Hydrologic functions of wetlands in a discontinuous permafrost basin indicated by isotopic and chemical signatures. J. Hydrol. 2004, 296, 81–97. [Google Scholar] [CrossRef]
- Tetzlaff, D.; Piovano, T.; Ala-Aho, P.; Smith, A.; Carey, S.K.; Marsh, P.; Wookey, P.A.; Street, L.E.; Soulsby, C. Using stable isotopes to estimate travel times in a data-sparse Arctic catchment: Challenges and possible solutions. Hydrol. Process. 2018, 32, 1936–1952. [Google Scholar] [CrossRef]
- Throckmorton, H.M.; Newman, B.D.; Heikoop, J.M.; Perkins, G.B.; Feng, X.; Graham, D.E.; O’Malley, D.; Vesselinov, V.V.; Young, J.; Wullschleger, S.D.; et al. Active layer hydrology in an arctic tundra ecosystem: Quantifying water sources and cycling using water stable isotopes. Hydrol. Process. 2016, 30, 4972–4986. [Google Scholar] [CrossRef]
- Wan, C.; Gibson, J.J.; Peters, D.L. Isotopic constraints on water balance of tundra lakes and watersheds affected by permafrost degradation, Mackenzie Delta region, Northwest Territories, Canada. Sci. Total Environ. 2020, 731, 139176. [Google Scholar] [CrossRef] [PubMed]
- Brooks, J.R.; Mushet, D.M.; Vanderhoof, M.K.; Leibowitz, S.G.; Christensen, J.R.; Neff, B.P.; Rosenberry, D.O.; Rugh, W.D.; Alexander, L.C. Estimating wetland connectivity to streams in the prairie pothole region: An isotopic and remote sensing approach. Water Resour. Res. 2018, 54, 955–977. [Google Scholar] [CrossRef] [PubMed]
- Gibson, J.J.; Yi, Y.; Birks, S.J. Isotopic tracing of hydrologic drivers including permafrost thaw status for lakes across Northeastern Alberta, Canada: A 16-year, 50- lake assessment. J. Hydrol. Reg. Stud. 2019, 26, 100643. [Google Scholar] [CrossRef]
- Welp, L.R.; Randerson, J.T.; Finlay, J.C.; Davydov, S.P.; Zimova, G.M.; Davydova, A.I.; Zimov, S.A. A high-resolution time series of oxygen isotopes from the Kolyma River: Implications for the seasonal dynamics of discharge and basin-scale water use. Geophys. Res. Lett. 2005, 32, L14401. [Google Scholar] [CrossRef] [Green Version]
- Gibson, J.J.; Birks, S.J.; Yi, Y. Stable isotope mass balance of lakes: A contemporary perspective. Quat. Sci. Rev. 2016, 131, 316–328. [Google Scholar] [CrossRef]
- Devoie, E.G.; Craig, G.R.; Connor, R.F.; Quinton, W.L. Taliks: A tipping point in discontinuous permafrost degradation in peatlands. Water Resour. Res. 2019, 55, 9838–9857. [Google Scholar] [CrossRef]
- Marchenko, S.S.; Gorbunov, A.P.; Romanovsky, V.E. Permafrost warming in the Tien Shan Mountains, Central Asia. Glob. Planet. Chang. 2007, 56, 311–327. [Google Scholar] [CrossRef]
- Streletsky, D.A.; Tananaev, N.I.; Opel, T.; Shiklomanov, N.I.; Nyland, K.; Streletskaya, I.D.; Tokarev, I.; Shiklomanov, A.I. Permafrost hydrology in changing climatic conditions: Seasonal variability of stable isotope composition in rivers in discontinuous permafrost. Environ. Res. Lett. 2015, 10, 095003. [Google Scholar] [CrossRef]
- Ala-aho, P.; Soulsby, C.; Pokrovsky, O.S.; Kirpotin, S.N.; Karlsson, J.; Serikova, S.; Vorobyev, S.N.; Manasypov, R.M.; Loiko, S.; Tetzlaff, D. Using stable isotopes to assess surface water source dynamics and hydrological connectivity in a high-latitude wetland and permafrost influenced landscape. J. Hydrol. 2018, 556, 279–293. [Google Scholar] [CrossRef]
- Roy-Leveillee, P.; Burn, C.R. Near-shore talik development beneath shallow water in expanding thermokarst lakes, Old Crow Flats, Yukon. J. Geophys. Res. Earth Surf. 2017, 122, 1070–1089. [Google Scholar] [CrossRef]
- Disher, B.S.; Connon, R.F.; Haynes, K.M.; Hopkinson, C.; Quinton, W.L. The hydrology of treed wetlands in thawing discontinuous permafrost regions. Ecohydrology 2021, 14, e2296. [Google Scholar] [CrossRef]
- Sjöberg, Y.; Marklund, P.; Pettersson, R.; Lyon, S.W. Geophysical mapping of palsa peatland permafrost. Cryosphere 2015, 9, 465–478. [Google Scholar] [CrossRef] [Green Version]
- Evans, S.G.; Ge, S. Contrasting hydrogeologic responses to warming in permafrost and seasonally frozen ground hillslopes. Geophys. Res. Lett. 2017, 44, 1803–1813. [Google Scholar] [CrossRef]
- Walvoord, M.A.; Striegl, R.G. Increased groundwater to stream discharge from permafrost thawing in the Yukon River basin: Potential impacts on lateral export of carbon and nitrogen. Geophys. Res. Lett. 2007, 34, L12402. [Google Scholar] [CrossRef] [Green Version]
- Goudie, A.S. Global warming and fluvial geomorphology. Geomorphology 2006, 79, 384–394. [Google Scholar] [CrossRef]
- McKenzie, J.M.; Kurylyk, B.L.; Walvoord, M.A.; Bense, V.F.; Fortier, D.; Spence, C.; Grenier, C. Invited perspective: What lies beneath a changing Arctic? Cryosphere 2021, 15, 479–484. [Google Scholar] [CrossRef]
- Neilson, B.T.; Cardenas, M.B.; O’Connor, M.T.; Rasmussen, M.T.; King, T.V.; Kling, G.W. Groundwater flow and exchange across the land surface explain carbon export patterns in continuous permafrost watersheds. Geophys. Res. Lett. 2018, 45, 7596–7605. [Google Scholar] [CrossRef] [Green Version]
- Isaev, V.; Kotov, P.; Sergeev, D. Technogenic hazards of Russian North Railway. In Transportation Soil Engineering in Cold Regions. Lecture Notes in Civil Engineering. Vol. 49; Petriaev, A., Konon, A., Eds.; Springer: Singapore, 2020; Volume 1, pp. 311–320. [Google Scholar] [CrossRef]
- Trochim, E.D.; Jorgenson, M.T.; Prakash, A.; Kane, D.L. Geomorphic and biophysical factors affecting water tracks in northern Alaska. Earth Space Sci. 2016, 3, 123–141. [Google Scholar] [CrossRef] [Green Version]
- IAEA. Reference Sheet for International Measurement Standards; VSMOW2/SLAP2. Rev. 1; IAEA: Vienna, Austria, 2017; Available online: https://nucleus.iaea.org/sites/ReferenceMaterials/Shared%20Documents/ReferenceMaterials/StableIsotopes/VSMOW2/VSMOV2_SLAP2.pdf (accessed on 13 July 2021).
- International Atomic Energy Agency/World Meteorological Organization (IAEA/WMO). Global Network of Isotopes in Precipitation (GNIP). Available online: https://nucleus.iaea.org/Pages/GNIPR.aspx (accessed on 18 April 2021).
- De Wet, R.F.; West, A.G.; Harris, C. Seasonal variation in tap water δ2H and δ18O isotopes reveals two tap water worlds. Sci. Rep. 2020, 10, 13544. [Google Scholar] [CrossRef]
- Kendall, K.A.; Shanley, J.B.; McDonnell, J.J. A hydrometric and geochemical approach to test the transmissivity feedback hypothesis during snowmelt. J. Hydrol. 1999, 219, 188–205. [Google Scholar] [CrossRef]
- Ren, Y.; Yang, S.; Andersen, K.H.; Yang, Q.; Wang, Y. Thixotropy of soft clay: A review. Eng. Geol. 2021, 287, 106097. [Google Scholar] [CrossRef]
- Veizaga, E.A.; Ocampo, C.J.; Rodríguez, L. Hydrological and hydrochemical behavior of a riparian zone in a high-order flatland stream. Environ. Monit. Assess. 2019, 191, 10. [Google Scholar] [CrossRef]
- Brown, V.A.; McDonnell, J.J.; Burns, D.A.; Kendall, C. The role of event water, a rapid shallow flow component, and catchment size in summer stormflow. J. Hydrol. 1999, 217, 171–190. [Google Scholar] [CrossRef]
- Cory, R.M.; Kling, G.W. Interactions between sunlight and microorganisms influence dissolved organic matter degradation along the aquatic continuum. Limnol. Oceanogr. Lett. 2018, 3, 102–116. [Google Scholar] [CrossRef]
- Perreault, N.; Lévesque, E.; Fortier, D.; Lamarque, L.J. Thermo-erosion gullies boost the transition from wet to mesic tundra vegetation. Biogeosciences 2016, 13, 1237–1253. [Google Scholar] [CrossRef] [Green Version]
- Douglas, T.A.; Hiemstra, C.A.; Anderson, J.E.; Barbato, R.A.; Bjella, K.L.; Deeb, E.J.; Gelvin, A.B.; Nelsen, P.E.; Newman, S.D.; Saari, S.P.; et al. Recent degradation of Interior Alaska permafrost mapped with ground surveys, geophysics, deep drilling, and repeat airborne LiDAR. Cryosphere Discuss. 2021, 1–39. [Google Scholar] [CrossRef]


| Jan | Feb | Mar | Apr | May | Jun | Jul | Aug | Sep | Oct | Nov | Dec | |
|---|---|---|---|---|---|---|---|---|---|---|---|---|
| T | −19.9 | −19.7 | −15.4 | −9.3 | −2.2 | 7.1 | 12.7 | 9.7 | 4.2 | −4.2 | −12.9 | −17.0 |
| P | 22 | 18 | 20 | 24 | 32 | 48 | 59 | 59 | 54 | 40 | 30 | 25 |
| Station | Sample Source | n1 | Data Source | δ18O, ‰SMOW | δ2H, ‰SMOW | dex, ‰ |
|---|---|---|---|---|---|---|
| Pechora | Rain (VIII) | 7/3 | [44] | −12.09 ± 1.76 | −80.3 ± 25.0 | 11.1 ± 8.6 |
| Rain (IX) | 7/3 | [44] | −12.97 ± 2.10 | −87.0 ± 20.0 | 8.7 ± 3.5 | |
| Salekhard | Rain (VIII) | 5 | [44] | −13.18 ± 0.68 | −100.1 ± 6.0 | 5.4 ± 3.0 |
| Rain (IX) | 5 | [44] | −13.35 ± 1.71 | −102.4 ± 11.1 | 4.5 ± 4.0 | |
| Khanovey | Rain (IX) | 1 | This work | −14.7 | −105 | 12.3 |
| Bog | 1 | “ | −12.72 | −92.89 | 8.9 | |
| Groundwater | 1 | “ | −15.8 | −110 | 16.1 | |
| Hollows | 6 | “ | −11.46 ± 0.84 | −83.53 ± 2.62 | 8.14 ± 4.9 | |
| Lake | 1 | “ | −10.3 | −82.9 | −0.7 | |
| River/stream | 20 | “ | −12.61 ± 0.33 | −86.48 ± 3.04 | 14.4 ± 3.3 | |
| Soil pits | 4 | “ | −13.33 ± 1.40 | −94.91 ± 9.21 | 11.7 ± 4.4 |
Publisher’s Note: MDPI stays neutral with regard to jurisdictional claims in published maps and institutional affiliations. |
© 2021 by the authors. Licensee MDPI, Basel, Switzerland. This article is an open access article distributed under the terms and conditions of the Creative Commons Attribution (CC BY) license (https://creativecommons.org/licenses/by/4.0/).
Share and Cite
Tananaev, N.; Isaev, V.; Sergeev, D.; Kotov, P.; Komarov, O. Hydrological Connectivity in a Permafrost Tundra Landscape near Vorkuta, North-European Arctic Russia. Hydrology 2021, 8, 106. https://0-doi-org.brum.beds.ac.uk/10.3390/hydrology8030106
Tananaev N, Isaev V, Sergeev D, Kotov P, Komarov O. Hydrological Connectivity in a Permafrost Tundra Landscape near Vorkuta, North-European Arctic Russia. Hydrology. 2021; 8(3):106. https://0-doi-org.brum.beds.ac.uk/10.3390/hydrology8030106
Chicago/Turabian StyleTananaev, Nikita, Vladislav Isaev, Dmitry Sergeev, Pavel Kotov, and Oleg Komarov. 2021. "Hydrological Connectivity in a Permafrost Tundra Landscape near Vorkuta, North-European Arctic Russia" Hydrology 8, no. 3: 106. https://0-doi-org.brum.beds.ac.uk/10.3390/hydrology8030106