
Climate Change Impacts on Inflows into Lake Eppalock Reservoir from Upper Campaspe Catchment


1
Department of Engineering, School of Engineering and Mathematical Sciences, La Trobe University, Melbourne, VIC 3086, Australia
2
Department of Civil Engineering, American University of Sharjah, Sharjah 27272, United Arab Emirates
3
Department of Civil and Construction Engineering, Swinburne University of Technology, Melbourne, VIC 3122, Australia
*
Author to whom correspondence should be addressed.
Hydrology 2021, 8(3), 108; https://0-doi-org.brum.beds.ac.uk/10.3390/hydrology8030108
Submission received: 22 June 2021
/
Revised: 19 July 2021
/
Accepted: 21 July 2021
/
Published: 24 July 2021
(This article belongs to the Special Issue Climate Change Effects on Water Resources Management)
Abstract
:Climate change has significant effects on societies and ecosystems. Due to the strong link between climate and the hydrological cycle, water resources is one of the most affected fields by climate change. It is of great importance to investigate climate change effects on streamflows by producing future streamflow projections under different scenarios to create adaptation measures and mitigate potential impacts of climate change. The Upper Campaspe Catchment (UCC), located at North Central Victoria in Australia, is a significant catchment as it provides a large portion of total inflow to the Lake Eppalock Reservoir, which supplies irrigation to the Campaspe Irrigation district and urban water to Bendigo, Heathcote, and Ballarat cities. In this study, climate change effects on monthly streamflows in the UCC was investigated using high resolution future climate data from CSIRO and MIROC climate models in calibrated IHACRES hydrological model. The IHACRES model was found to be very successful to simulate monthly streamflow in UCC. Remarkable streamflow reductions were projected based on the climate input from both models (CSIRO and MIROC). According to the most optimistic scenario (with the highest projected streamflows) by the MIROC-RCP4.5 model in near future (2035–2064), the Upper Campaspe River will completely dry out from January to May. The worst scenario (with the lowest streamflow projection) by the CSIRO-RCP8.5 model in the far future (2075–2104) showed that streamflows will be produced only for three months (July, August, and September) throughout the year. Findings from this study indicated that climate change will have significant adverse impacts on reservoir inflow, operation, water supply, and allocation in the study area.
1. Introduction
Climate change affects cities and the built environment, coasts, agriculture, water resources, and natural ecosystems in Australia and all over the world. Among those fields, water resources is one of the most affected ones due to the strong relationship between climate and water resources [1,2]. There is a scientific consensus stating that increasing temperatures due to global warming causes a change in quantity and timing of precipitation and other climate-related parameters such as evapotranspiration [3,4]. Variations in precipitation amount and timing along with alterations in other climate parameters result in changes in streamflow influencing downstream reservoir inflows and operations [5]. Therefore, it is of great importance to investigate climate change effects on streamflows by producing future streamflow projections under different scenarios to create adaptation measures and mitigate potential impacts of climate change.
There are several studies investigating climate change effects on streamflows across the world. Many of those studies reported decreases in streamflows in future. For example, D’Agostino et al. [6] reported a 16–23% decrease in streamflow in southern Italy by 2050. Yilmaz and Imteaz [7] found significant runoff reduction in summer and spring seasons for the period of 2070–2100 in the Euphrates basin, Turkey. Givati et al. [8] studied climate change effects at the Upper Jordan River for 2020–2049 (near future) and 2050–2079 (far future) periods under Representative Concentration Pathway (RCP)4.5 and RCP8.5 scenarios. They projected a significant decrease in streamflows for both periods under both RCPs with a higher reduction under RCP8.5 for the far future. Kanakoudis et al. [9] indicated that the water resources availability is expected to be adversely affected by climate change in the Adriatic region. Chen et al. [10] developed an index to evaluate water resources vulnerability in the Huang-Huai-Hai River Basin, China and reported that water resources will be more vulnerable in future under the effects of climate change.
There are also some studies in the literature projecting increases in future streamflow. For example, Azari et al. [11] studied climate change impacts on streamflow in the North of Iran using future climate data from three global climate models (GCMs) (i.e., CGCM2, HadCM3, and CSIRO2) in the SWAT model under A1F1, A2, and B1 emission scenarios over 2040–2069 period. They reported 5.8%, 2.8%, and 9.5% increases in annual streamflow for the A1F1, A2 and B1 emission scenarios, respectively. Su et al. [12] and Bian et al. [13] projected overall increases in annual average streamflows in the Yangtze River basin, China. Furthermore, Kamis et al. [14] reported that the peak flow is anticipated to increase by 69% and 139% from 5 to 100 years return periods in Saudi Arabia for RCP4.5 and RCP8.5 scenarios respectively due to to the increases in rainfall by an average of 27% and 49% for RCP4.5 and RCP8.5 models respectively. Arnbjerg-Nielsen [15] found that extreme rainfalls in Northern Europe will increase due to climate change.
Investigation of climate change effects on streamflows and water resources is particularly important in Australia as the driest continent on Earth apart from Antarctica. Only a small fraction of total precipitation turns into a runoff in Australia and Australia has the highest interannual streamflow variability in the world [16,17]. Climate change will very likely exacerbate the water availability challenge in Australia, hence a better understanding of climate change effects on streamflows is of high priority to the Australian government and water industry [17].
Below are the examples of the Australian studies on climate change and streamflow relationship. Vaze and Teng [17] investigated the likely changes in runoff around the year 2030 under A1B scenario in New South Wales and Australian Capital Territory. They reported future mean annual runoff decrease by 0–20% in the southern parts of the study area, not considerable change (decrease) in the eastern parts and an increase by 0–20% in the northwest portion of the study area. Al-Safi and Sarukkalige [18] used future rainfall and temperature projections from eight GCMs under RCP4.5 and RCP8.5 scenarios in calibrated HBV model during mid and late 21st century to generate future streamflow projections, and they found significant decreases in future streamflow in selected three catchments. CSIRO [19] developed future runoff projections for the entire Campaspe River Basin using multiple GCMs’ output in calibrated SMHYD model, and large decreases in streamflows were reported by that study.
The Campaspe River Basin is located in north-central Victoria, Australia. In this study, climate change effects on streamflows in the Upper Campaspe Catchment (UCC) were investigated. The UCC is a significant catchment as it provides a large portion of total inflow to the Lake Eppalock Reservoir. Lake Eppalock Reservoir supplies irrigation to the Campaspe Irrigation district and urban water to Bendigo, Heathcote, and Ballarat. It is vital to produce streamflow projections in this basin to understand climate change effects on reservoir inflow, operation, water supply, and allocation. High resolution corrected future climate data from CSIRO and MIROC GCMs were used in calibrated IHACRES hydrological model to generate monthly streamflow projections in the UCC. To the knowledge of the authors, this study presents the first monthly streamflow projection for both near (2035–2064) and far (2075–2104) future in the UCC using projected (future) climate data with a high spatial resolution (5 × 5 km) from the Victorian Climate Change Projections 2019 (VCP19). Also, this paper is one of the earlier studies presenting the use of VCP19 data in hydrological modelling. Therefore, this paper might shed light on the future hydrological studies adopting VCP19 data. In addition, the applicability of the IHACRES model in the UCC is examined in this study using observed climate and streamflow data.
2. Study Area and Data
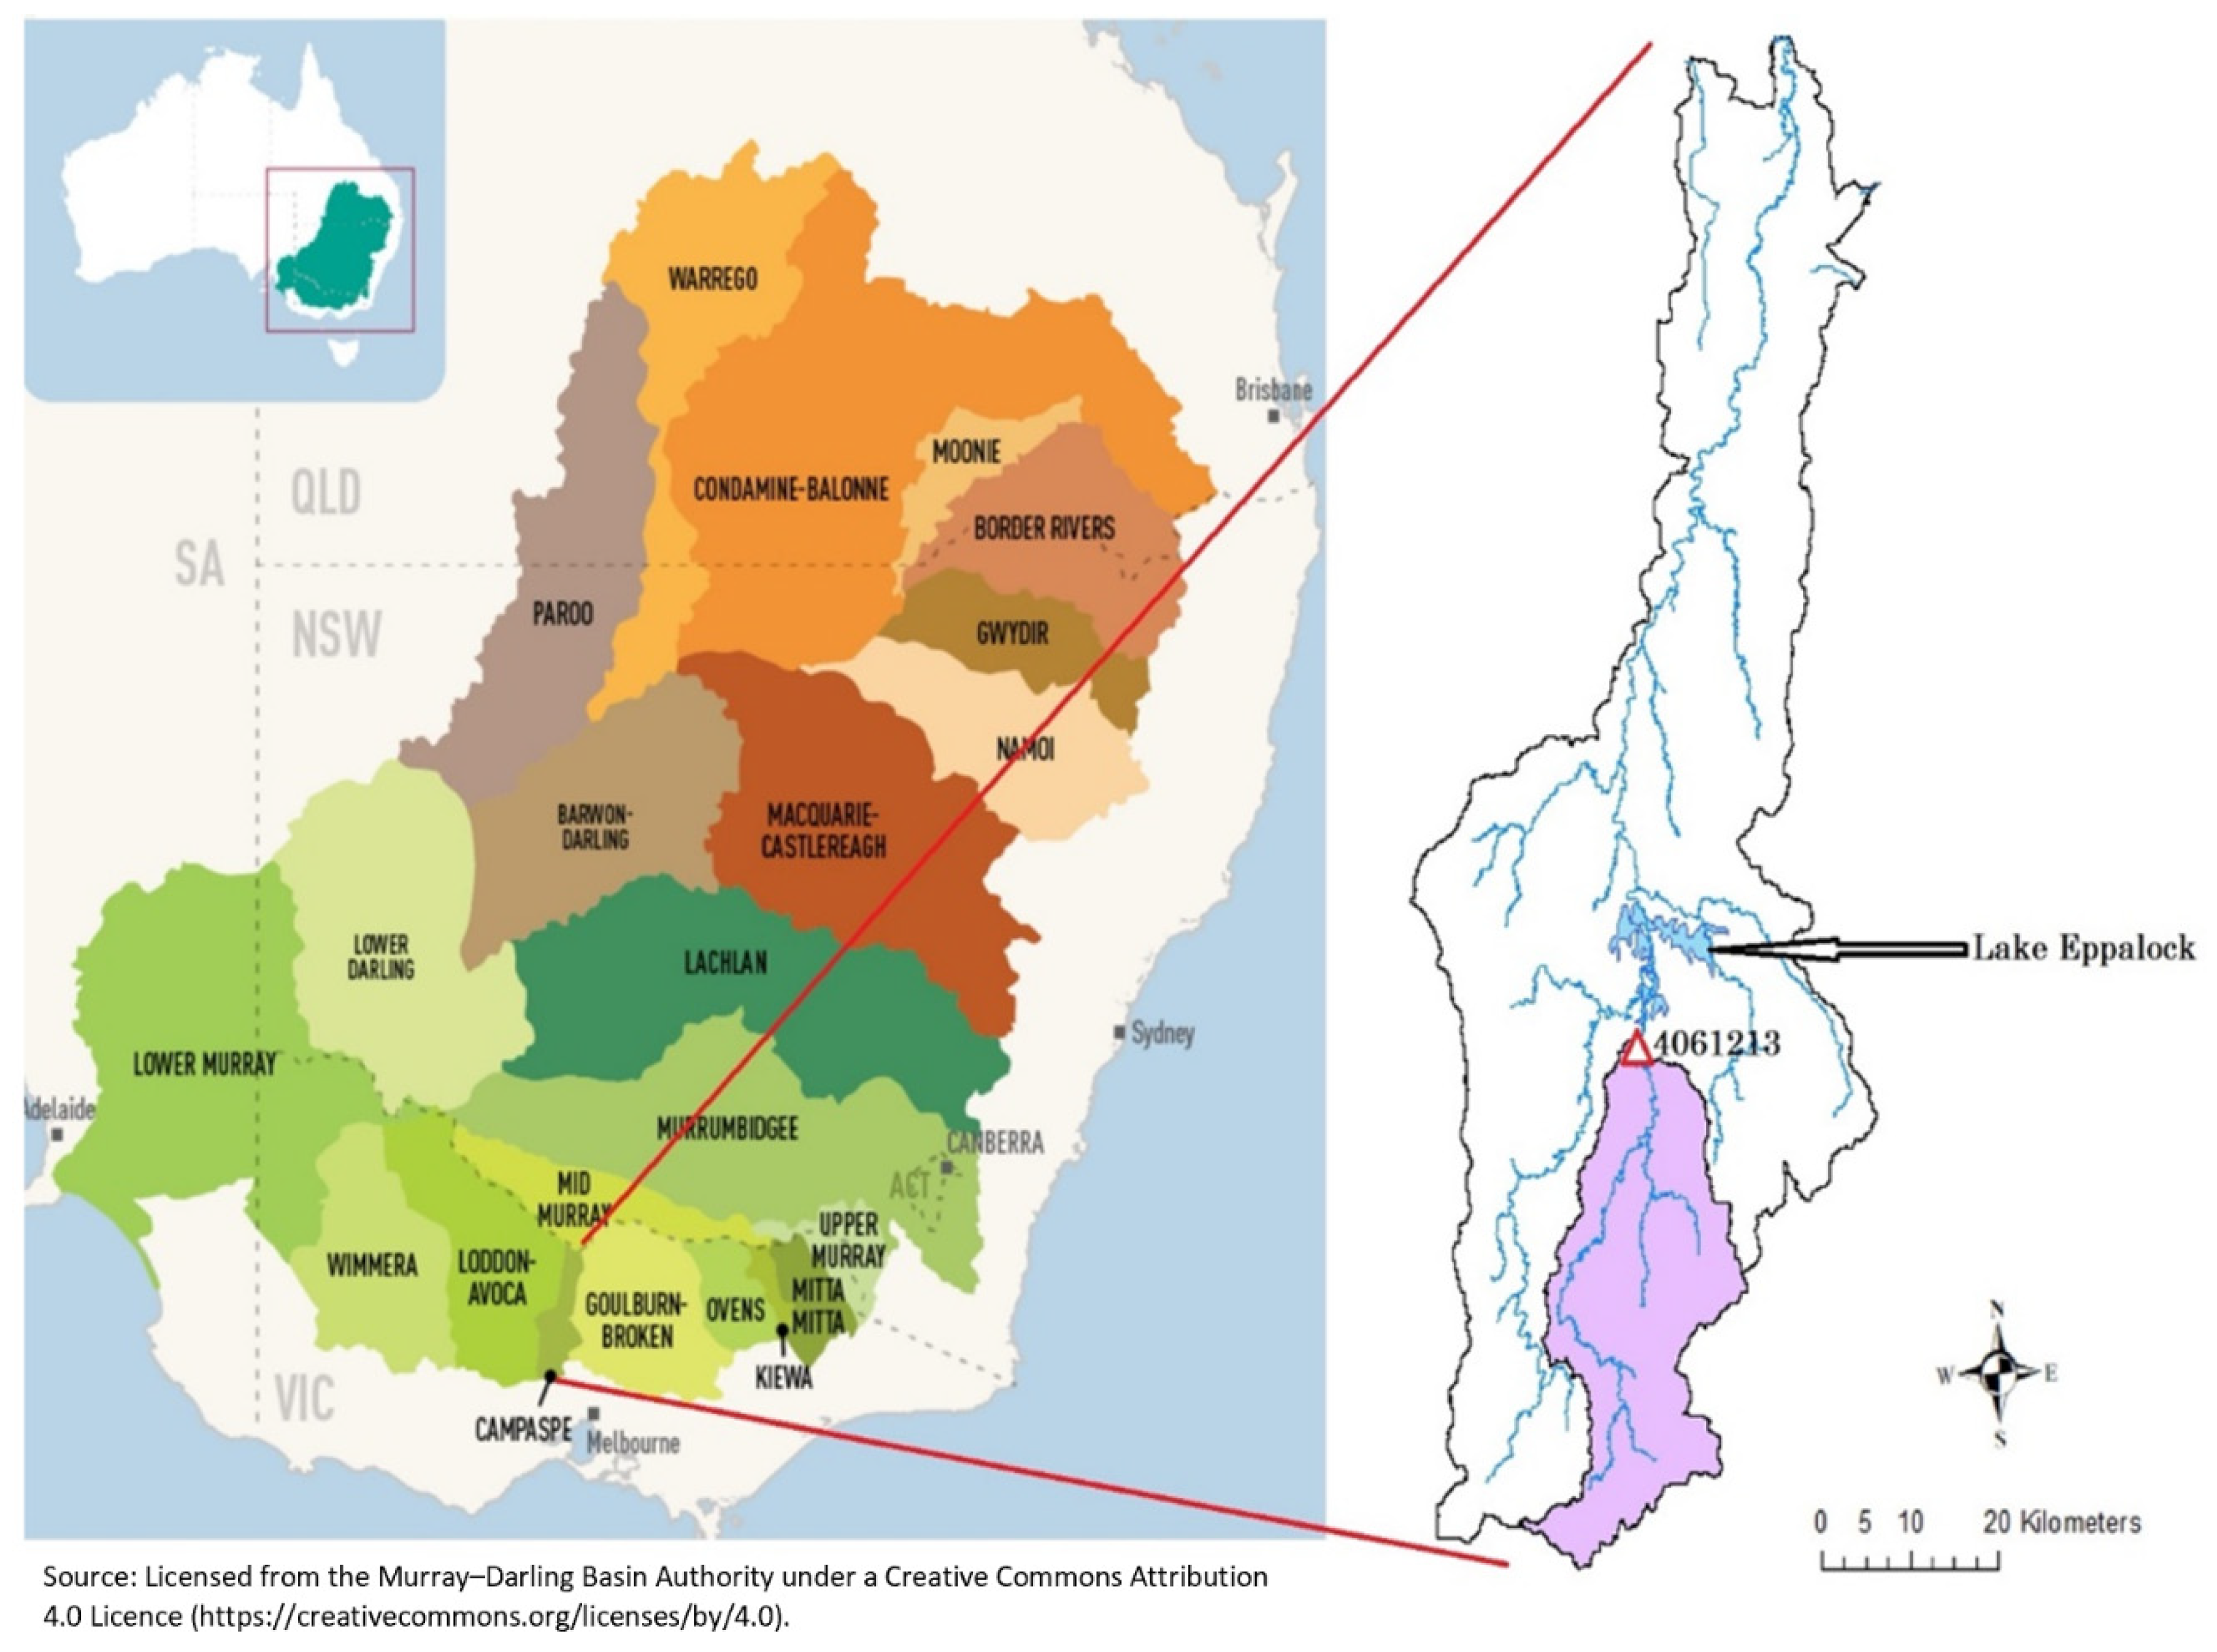
The UCC is one of the main sub-basins inflowing to the Lake Eppalock Reservoir in the Campaspe River Basin. The Lake Eppalock is the largest reservoir in the Campaspe River Basin with a storage capacity of 312 GL, and the mean annual inflow into the Lake Eppalock Reservoir is around 101 GL [19]. The surface area of the UCC is 634 km2 and around 60% of the total inflow into Lake Eppalock reservoir is from the UCC. The UCC (purple painted sub-catchment) and the Lake Eppalock is shown in Figure 1.
In this study, the monthly gridded observed and projected climate data including rainfall and average temperature were received from the VCP19, which was produced by the partnership between The Victorian Government, Australia and the Commonwealth Scientific and Industrial Research Organisation (CSIRO) to provide support to the Victorian communities for climate change adaptation. Details of the VCP19 project can be seen in Clarke et al. [21]. Both observed and future rainfall and temperature data have a spatial resolution of 5 km by 5 km providing very detailed information in comparison to information provided by GCMs with a general spatial resolution in the range of 100–300 km. The future (projected) data in this study were received from two GCMs including the Commonwealth Scientific and Industrial Research Organisation (CSIRO) and the Model for Interdisciplinary Research on Climate (MIROC) for two emission pathways, medium emission (RCP4.5) and high emission (RCP8.5). It is worth noting that future data sets have been dynamically downscaled by CSIRO Climate Science Center (to 5 × 5 km spatial resolution) and produced using a quantile-quantile scaling approach. In the quantile-quantile scaling, change ratios in percentiles are calculated from the GCMs’ historical and future time series data. Then, the GCM based percentile change ratios are implemented to all observation values in each quantile.
The observed and future monthly rainfall and temperature data span the period of 30 years. The observed period includes data over 1981–2010, whereas two future data periods were adopted in this study: (1) near future (2035–2064), and (2) far future (2075–2104). It should be noted that the data over 1981–2010 period refer to the real gridded observed data, not the GCMs’ historical simulations. Also, observed rainfall and temperature grid data were averaged over the catchment area (for each time step) to be used in the hydrological model.
In addition to rainfall and mean temperature data, observed streamflow data from station 4061213 (shown in Figure 1) over the period of 1981–2010 was used to calibrate and validate the hydrological model, which was later used for streamflow projections. Basic annual climate characteristics (i.e., average, maximum, and minimum values) of data sets are shown in Table 1.
3. Methodology
The identification of unit hydrographs and component flows from rainfall, evapotranspiration and streamflow (IHACRES) model was adopted in this study for simulation of observed streamflows and generation of future streamflow projections. The IHACRES model is a well-established hydrological model employed in several studies [22,23] in the literature.
The IHACRES model is a mixture of both metric and conceptual models. It implements the simplicity of the metric model to decrease the parametric error derived from the hydrological model as well as signifying the internal process of an ordinary metric model in more detail. The IHACRES model consists of linear and non-linear modules. The IHACRES produces effective rainfall using total rainfall and temperature input through the non-linear loss module, whereas effective rainfall is converted to the streamflow by the linear module [24].
Originally, the IHACRES model implemented an exponentially decaying soil moisture index to transform total rainfall into effective rainfall. The IHACRES model was modified by Ye et al. [25] to enhance its performance in regards to ephemeral catchments. This is an important point for the current study as the UCC is an ephemeral catchment. The IHACRES model uses Equation (1) to determine the soil moisture index (), Equation (2) to calculate the reference drying rate (), and Equation (3) to compute the effective rainfall ().
where is the observed rainfall, is the drying rate, τw is the reference drying rate, f is the temperature modulation, and Tr and Tk are the reference and observed temperature respectively. The linear module utilizes exponentially decaying stores to get the streamflow (Q) from the rainfall (U), as shown by Equation (4).
where δ represents the delay between rainfall and streamflow response, α denotes the recession rate of storage, and β is the fraction of effective rainfall [18]. More details regarding the model can be found in Croke and Jakeman [24].
The coefficient of efficiency (E) was used to evaluate IHACRES model performance as advised in Yilmaz and Imteaz [7] and Yilmaz and Muttil [26]. In addition to E, determination of coefficient (R2) and root-mean-square error (RMSE) were adopted for model performance assessment in this study. E, R2, and RMSE are defined in Equations (5)–(7).
In Equations (5)–(7), Qm and Qo refer to modelled and observed flows, whereas and correspond to mean modelled and observed flows, respectively. In Equation (7), i and N represent variable i and the number of non-missing data points respectively. E and R2 take values in the range of 0–1 and high values of E and R2 indicate the high performance of the models. The RMSE, ranging between 0–∞, is used as a measure of the spread of the observed values over the modelled values.
Observed climate and streamflow data between 17 October 1995 and 25 August 2009 was used for calibration of the model parameters, and the remaining data were used for model validation.
4. Results and Discussion
4.1. Performance of IHACRES Model
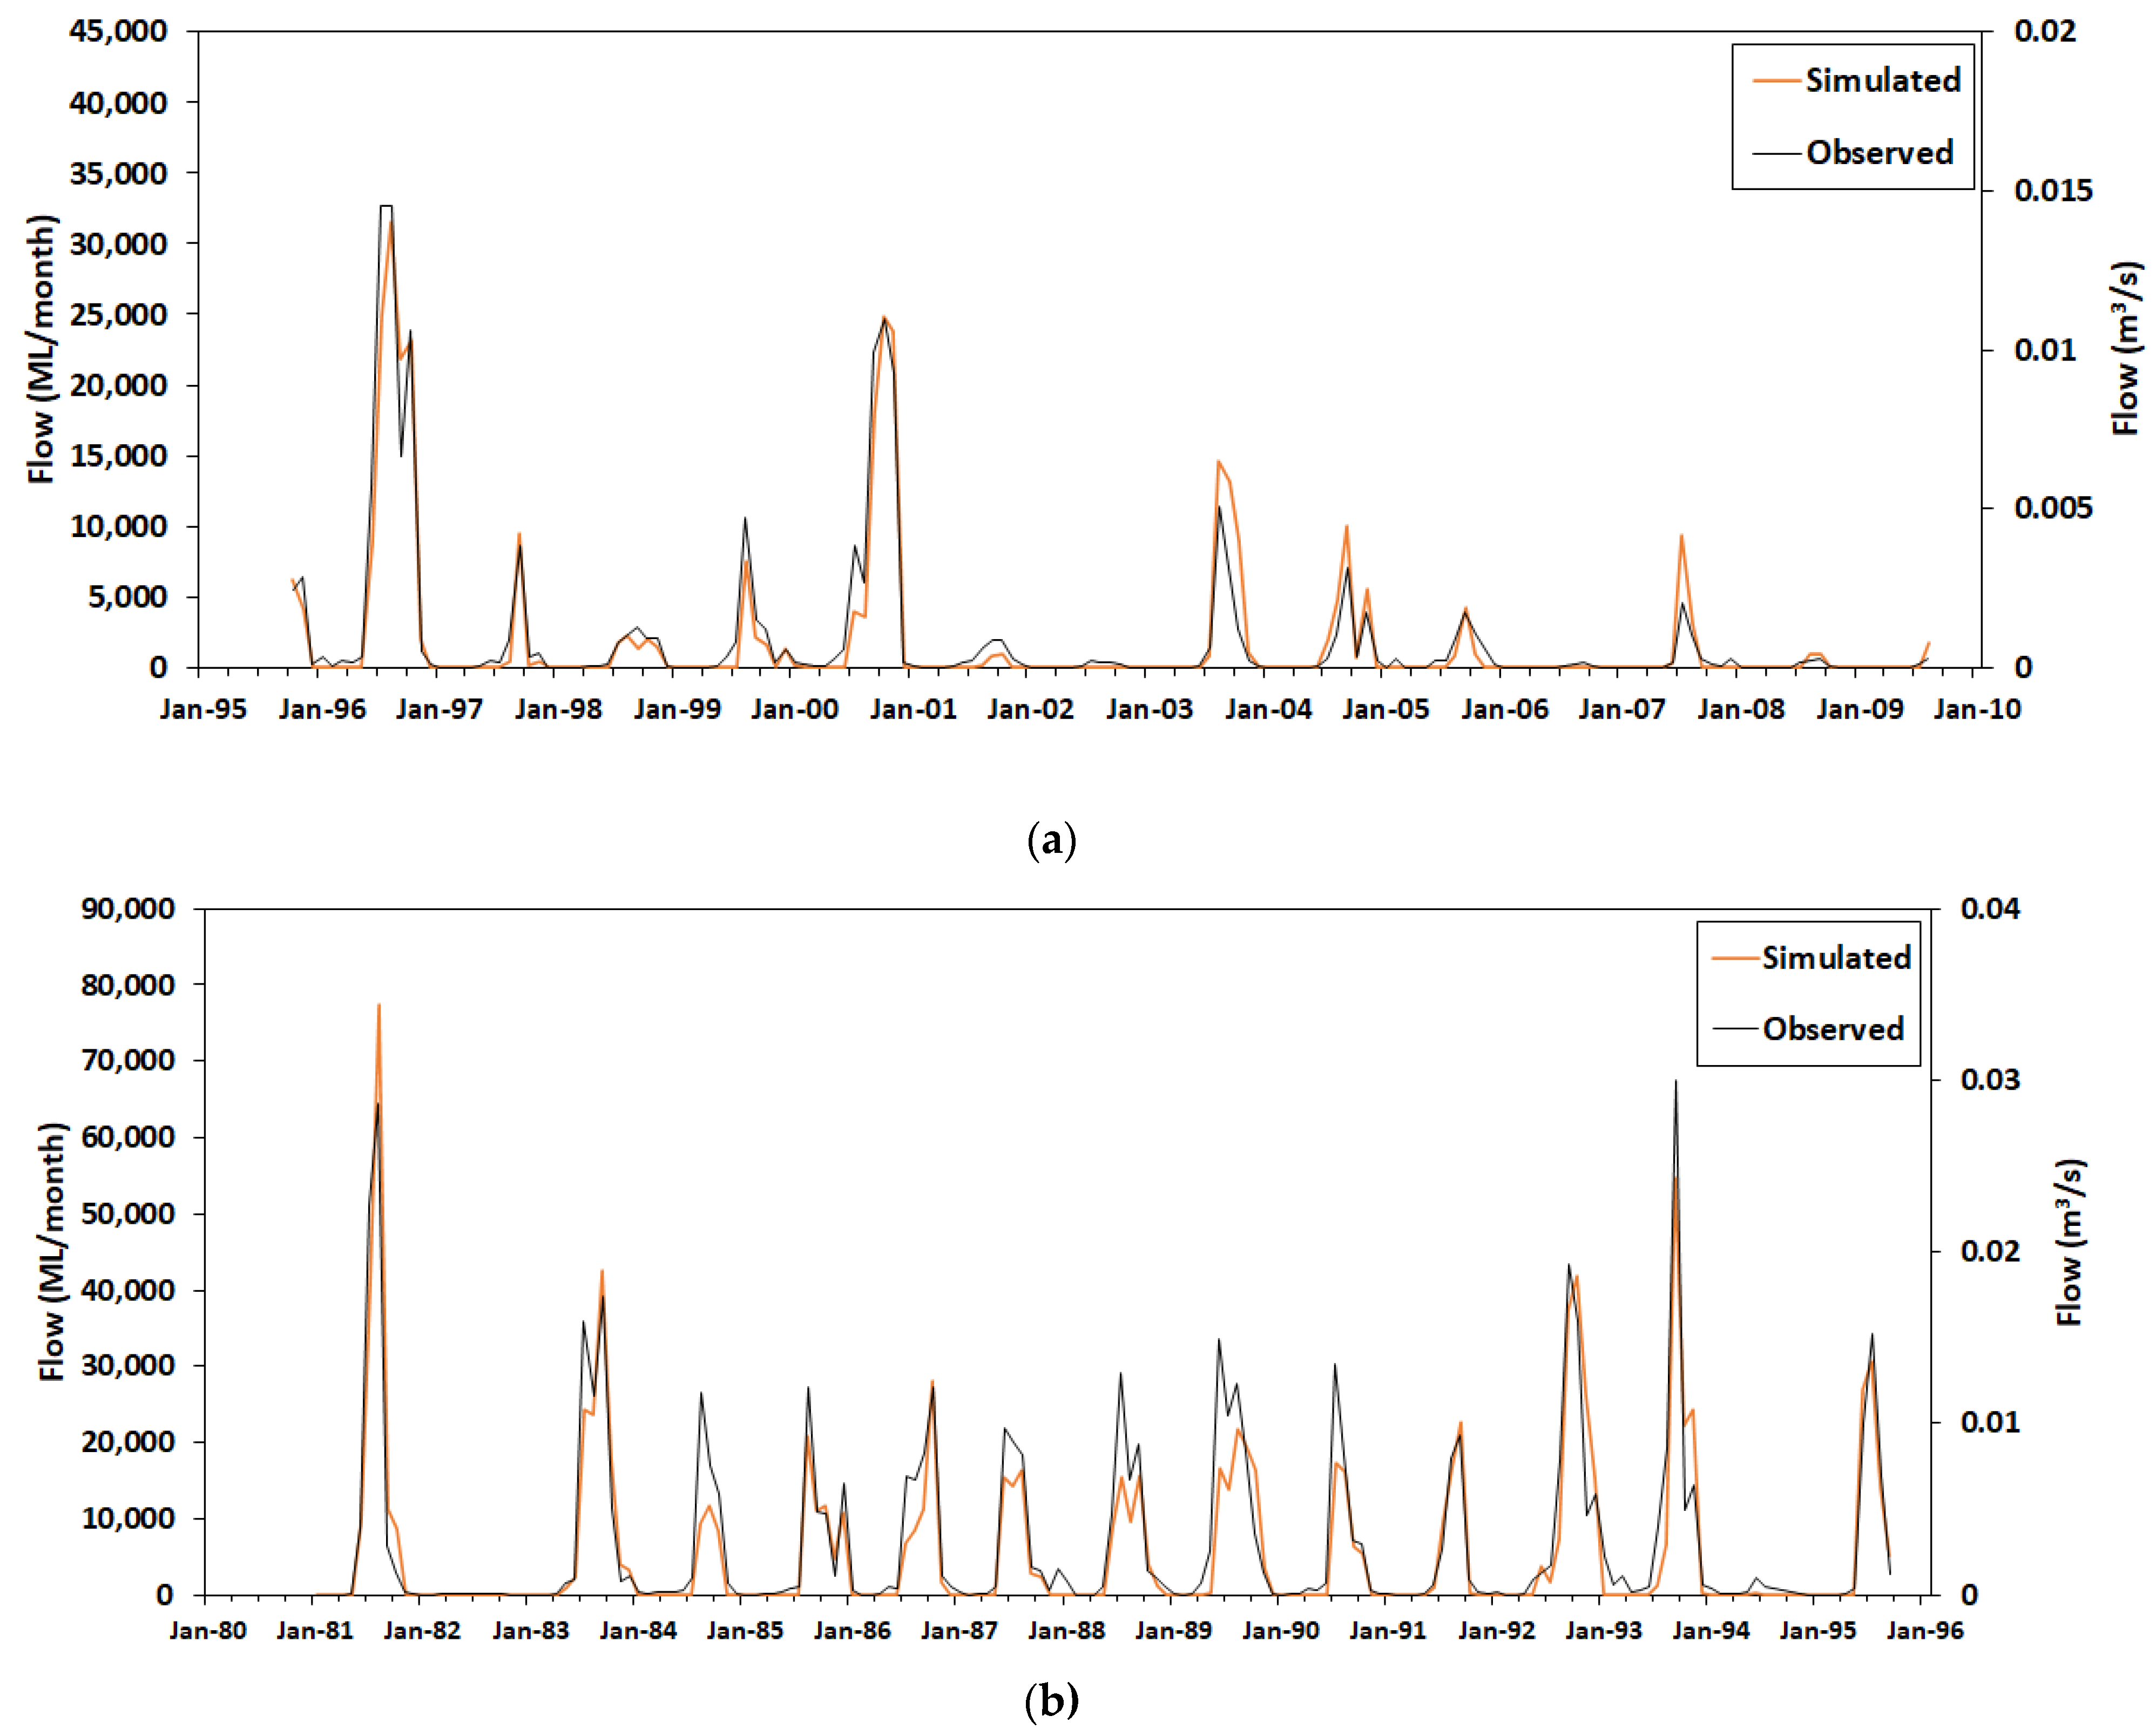
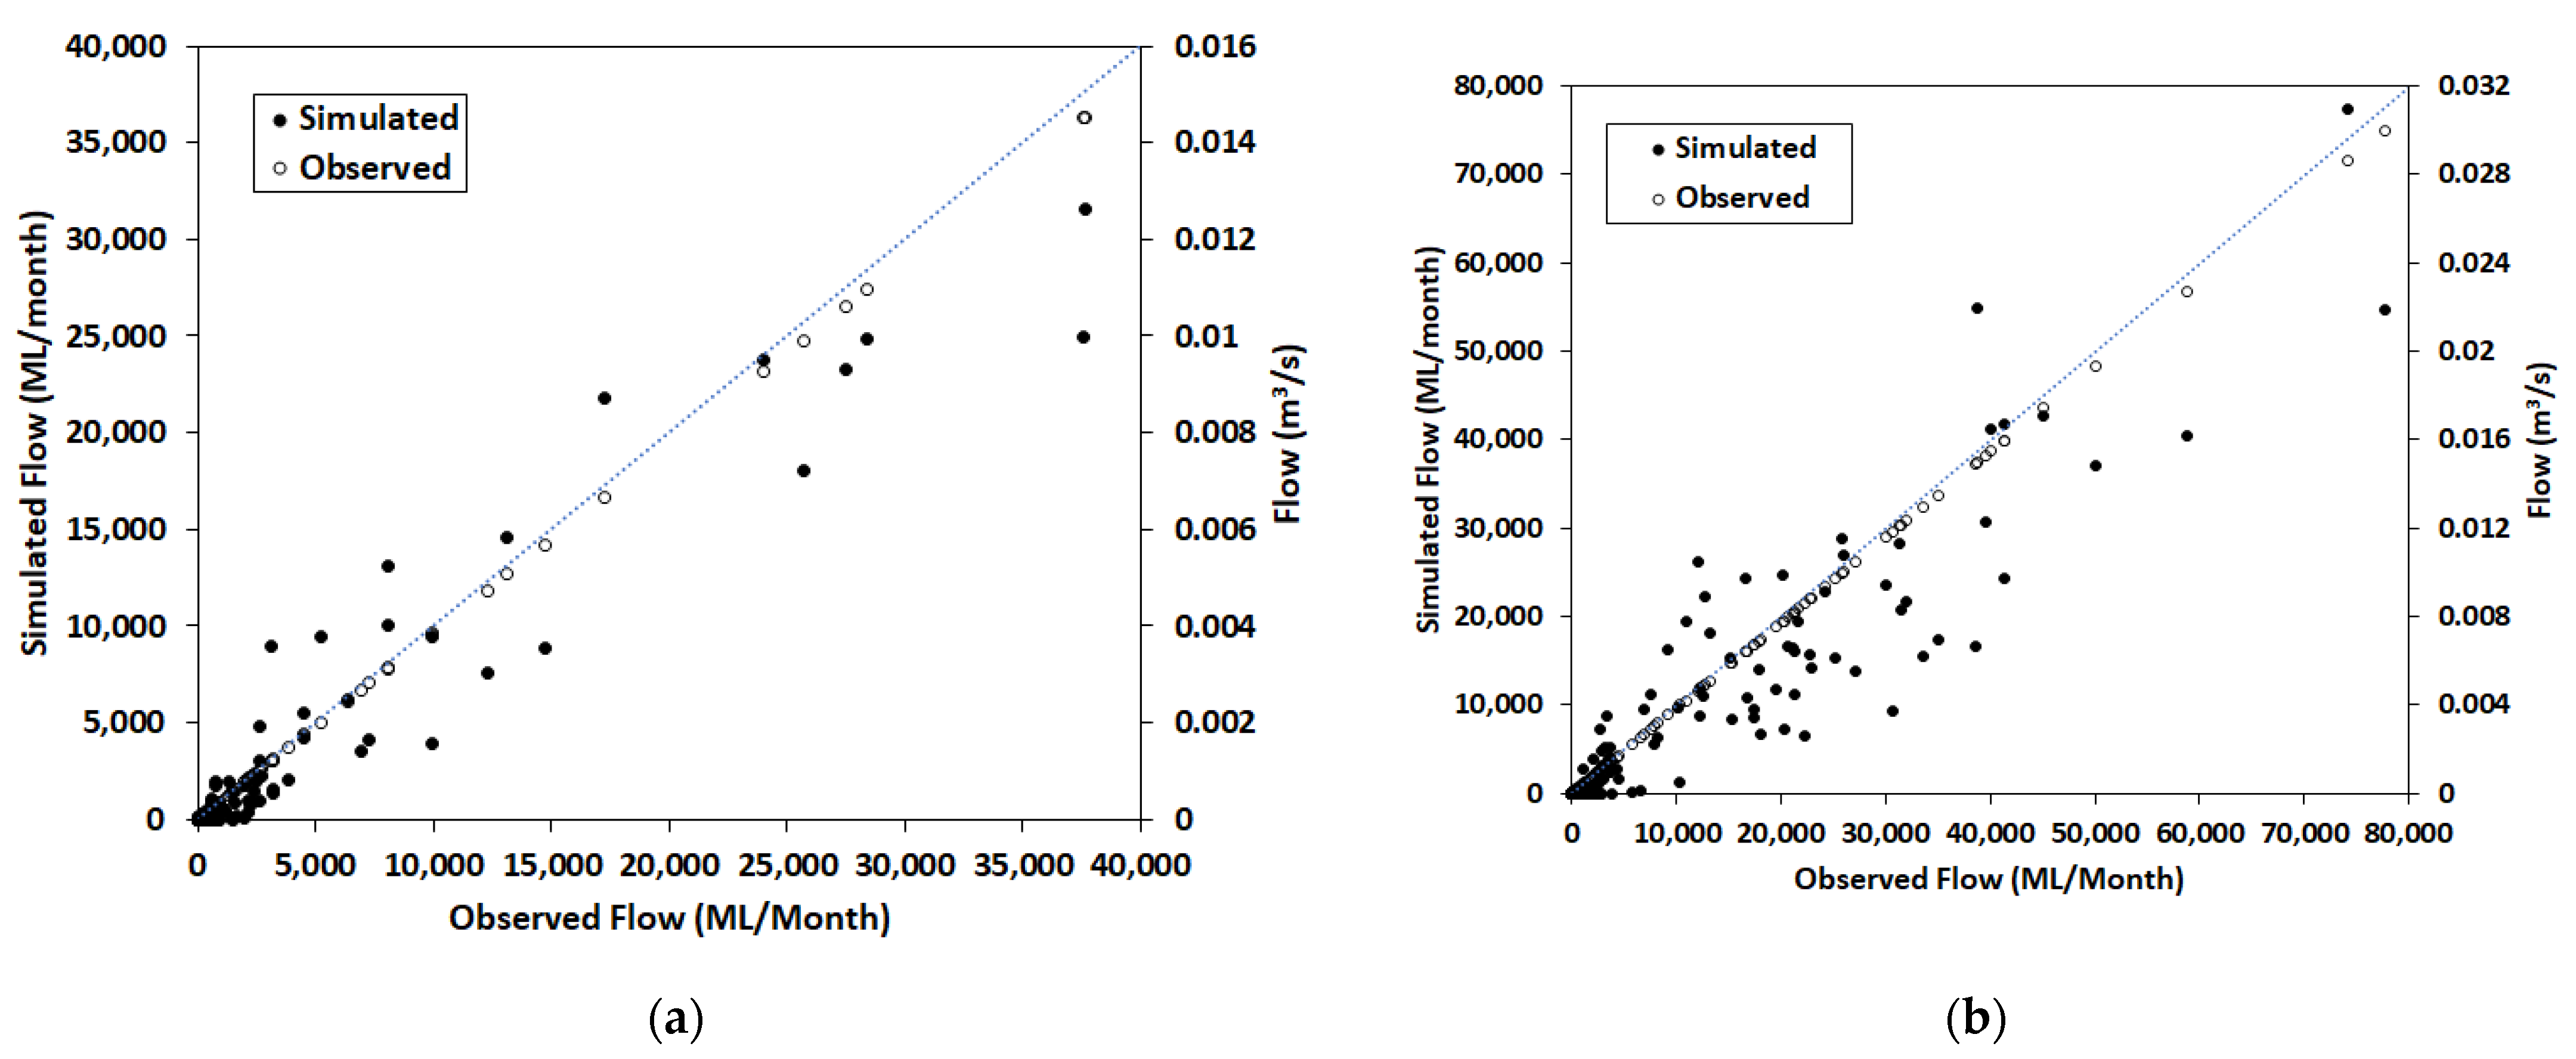
As explained in the Methodology section, the IHACRES model was used to simulate streamflows in the UCC. Figure 2 indicates time series plots of modelled and observed monthly streamflow over 1981–2010 for model calibration (a) and validation (b) periods, whereas Figure 3 shows scatter plots between observed and modelled monthly flows. As can be seen from Figure 2 and Figure 3, there is a strong agreement between modelled and simulated streamflows suggesting the high performance of models for both validation and calibration periods. Figure 2 shows that modelled streamflows are slightly less than observed flows for two peaks that occurred in July 1995 and October 2000 during the calibration period. Also, observed flow is underestimated for a few cases in the validation period.
E and R2 were used for IHACRES performance evaluation in addition to visual assessment through time series and scatter plots. E was 0.91 and 0.84 for calibration and validation periods, respectively, while R2 was 0.96 and 0.93 for calibration and validation periods respectively. Additionally, the RMSE was found to be 1829 ML/month for the calibration period and 5508 ML/month for the validation period. Performance evaluation parameters showed that calibrated IHACRES model was very successful to simulate monthly streamflows in the UCC.
4.2. Future Rainfall and Temperature Projections
4.2.1. Rainfall Projections
As mentioned before, the rainfall and temperature values for the near future (2035–2064) and the far future (2075–2104) were predicted using both high and medium emission scenarios. Observed and projected monthly rainfall values are tabulated in Table 2. Also, percentage increase (+%) and decrease (−%) of projected monthly rainfall in comparison to observed rainfall are shown in brackets in Table 2.
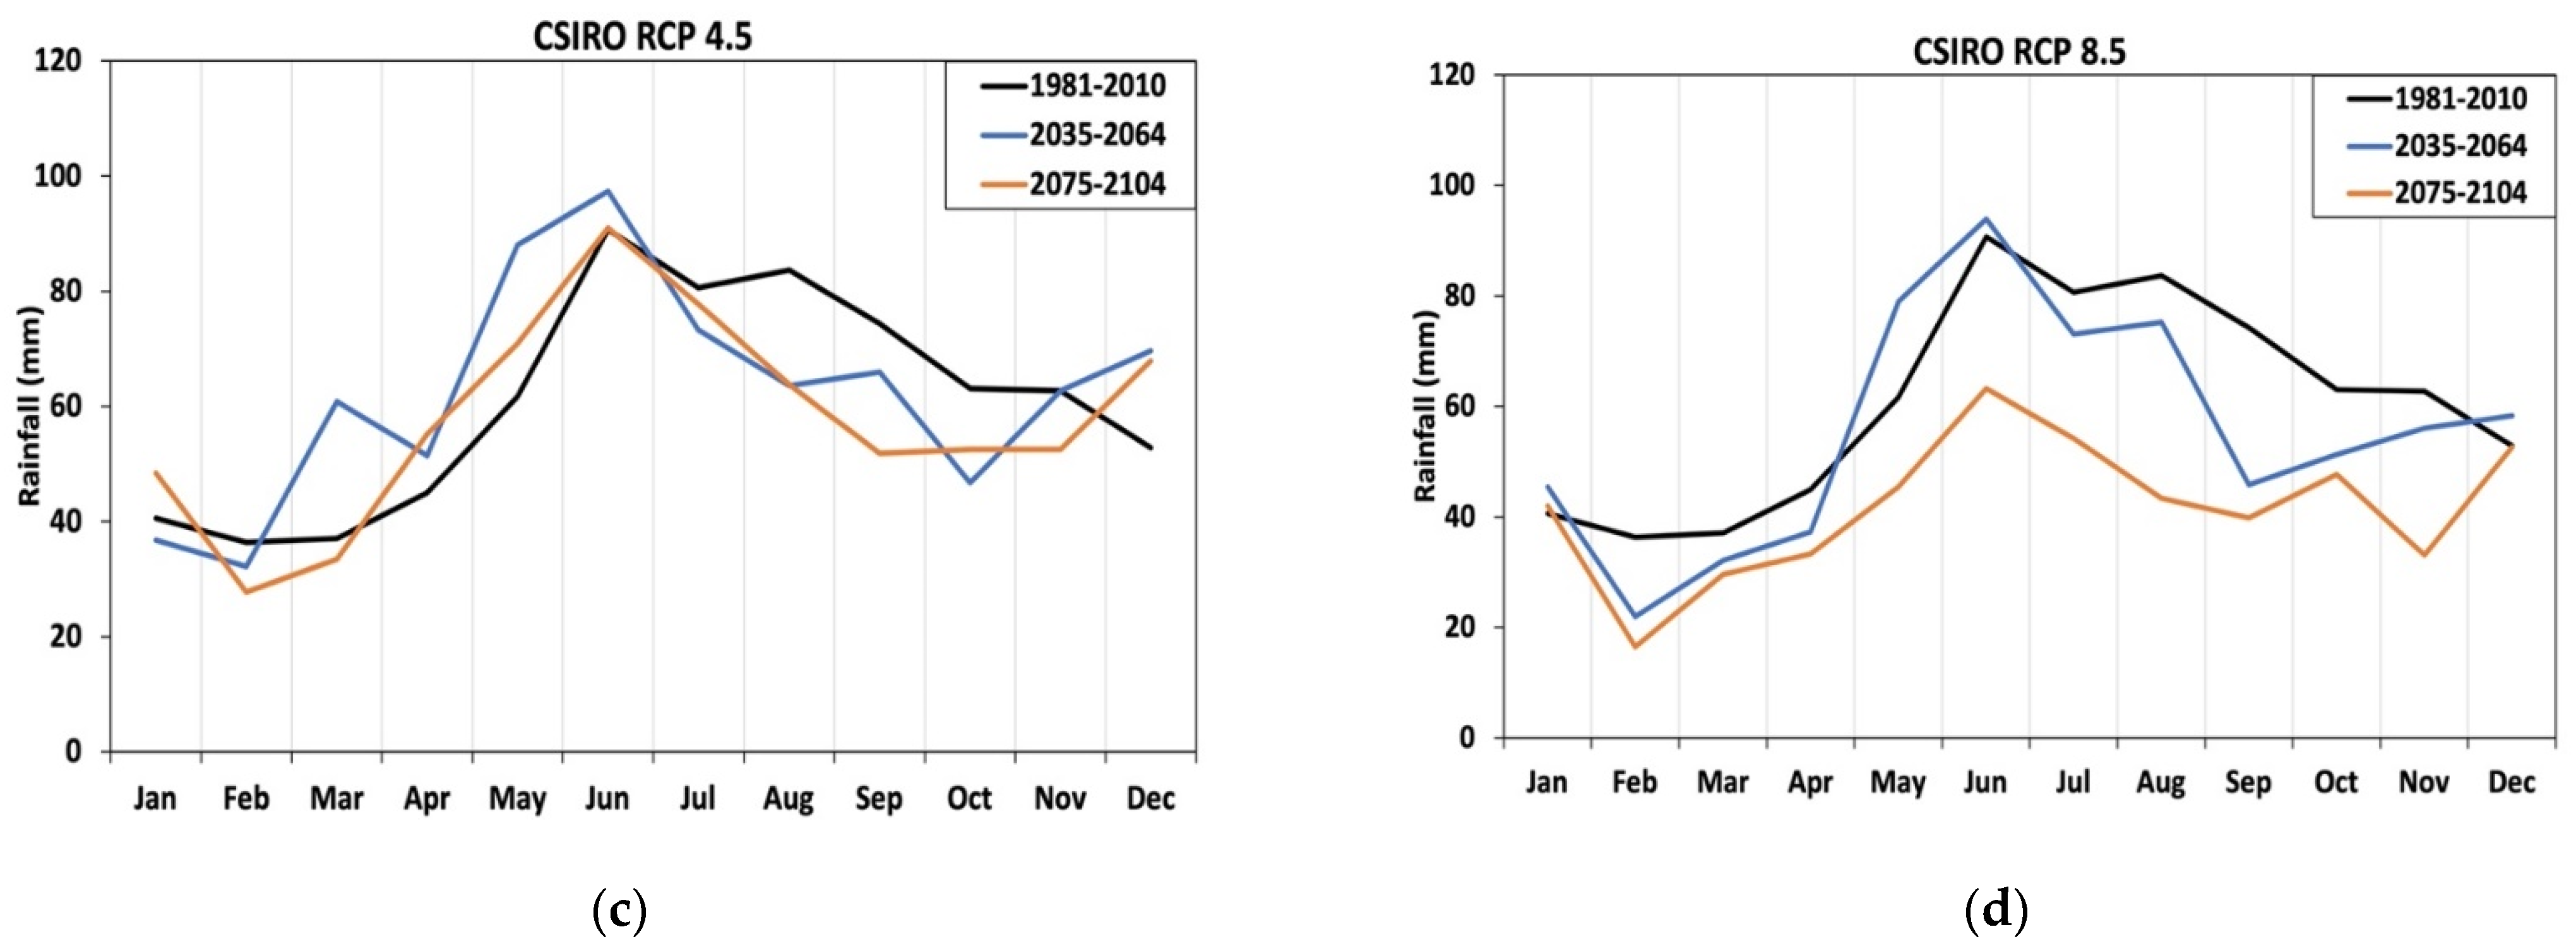
As can be seen from Table 2 and Figure 4, the projected rainfall in RCP8.5 is lower than that based on RCP4.5. In addition, the far future rainfall is generally lower than the near future rainfall. According to the MIROC model results for the near future, projected rainfall is less than observed rainfall in January, February, March, May, July, September, October, and November without a clear pattern except the spring season (September, October, and November) according to the RCP4.5 scenario. The RCP8.5 scenario results for near future rainfall projection show that projected rainfall is less than the observed rainfall for all months except December.
In near future, the percentage decrease in projected rainfall relative to the observed rainfall is the highest in March by 39% and September by 28% according to the MIROC-RCP4.5 and MIROC-RCP8.5 projections, respectively, whereas the percentage increase in projected rainfall is the highest in December by 64% and 40% for MIROC-RCP4.5 and RCP8.5, respectively as shown in Table 2.
In the far future, MIROC-RCP4.5 and MIROC-RCP8.5 projected rainfalls are less than observed rainfall in all months except December. The highest decrease in projected far future rainfall is found in March by 47% and in September by 54% based on MIROC-RCP4.5 and RCP8.5 projections, respectively. Also, the increase in far future rainfall is only in December by 10% and 53% in terms of MIROC-RCP4.5 and RCP8.5 projections, respectively.
Similar to MIROC model results, the CSIRO model rainfall projections for near and far futures are mostly less than the observed rainfall. According to the CSIRO-RCP4.5 model, monthly projected rainfall is higher than the observed rainfall from March to June and December for the near future, and from April to June, January, and December for the far future. Additionally, the CSIRO-RCP8.5 model projected higher rainfall values than the observed ones in January, May, June, and December for the near future. The CSIRO-RCP8.5 rainfall for the far future was projected to be lower than the observed rainfall in all months excluding January and December.
The highest decrease in projected far future rainfall is found in September by 30% and in February by 55% based on MIROC-RCP4.5 and RCP8.5 projections, respectively. Also, the increase in far future rainfall is in December by 29% and in January by 3% in terms of MIROC-RCP4.5 and RCP8.5 projections, respectively.
The projected annual rainfall for MIROC-RCP4.5 is found to decrease by 1% and 15% in comparison to the observed annual rainfall for near and far future periods respectively. The annual MIROC-RCP8.5 projected rainfall decrease is higher than MIROC-RCP4.5 with 14% and 19% for the near and far future, respectively. On the other hand, the annual total CSIRO-RCP4.5 projected rainfall increased by 6% and dropped by 3% with respect to the observed annual rainfall for near and far futures respectively. Similar to the MIROC-RCP8.5 forecasting, the CSIRO-RCP8.5 annual rainfall estimations are decreased by 9% in the near future and by 29% for the far future compared to observed annual rainfall. In addition to monthly and annual rainfall changes, seasonal projected rainfall variations were studied in this study. Seasonal rainfall variations are shown in Table 3. In Australia, the summer season consists of December, January, and February months, the autumn season includes the March, April, and May months, the winter season refers to June, July, and August months, and the spring season consists of September, October, and November months.
As can be seen in Table 3, rainfall decreases are projected by both models (with all scenarios and periods) in the spring season. The highest rainfall decrease in the spring season is predicted by CSIRO-RCP8.5 far future model at a rate of 40%. Also, there is a consensus between the models regarding the projected rainfall drop in the fall season except the CSIRO-RCP4.5 near future model. In the summer season, slight rainfall increase is projected in the near future (except MIROC-RCP8.5 model); however, all models except CSIRO-RCP4.5 projected summer rainfall decreases in far future with the highest decrease of 22% by CSIRO-RCP8.5 model. Similar to other seasons, mostly decreases in winter rainfall are projected by the models.
4.2.2. Temperature Projections
The projected monthly average temperature for near and far futures along with the observed monthly average temperatures are tabulated in Table 4. In addition, Table 4 includes the temperature changes based on the difference between the projected and observed average temperature values. The temperature differences with respect to the observed temperature are given in brackets. As can be seen in Table 4, projected average temperature values in future are always greater than observed temperature values. As expectedly, the far future temperatures are higher than the near future ones, and projected temperature values based on RCP8.5 is greater than that of based on RCP4.5 scenario.
The variation between observed and projected average temperature is also presented in Figure 5.
Based on the MIROC model, the highest temperature rise is expected in November in the far future for the RCP8.5 scenario. On the other hand, the lowest temperature rise is projected to happen in May in near future based on the MIROC-RCP4.5 model.
According to the MIROC-RCP4.5 model, the lowest increase (0.5 °C) in near future is projected to occur in May, whereas the highest temperature increase by 2.4 °C is projected to be in December in the near future. The MIROC-RCP8.5 model projected the highest near future temperature increase in November by 3.1 °C, while it predicted the lowest near future temperature increase in May by 0.8 °C. On the other hand, MIROC-RCP4.5 estimated the lowest far future temperature increase to be at 1.2 °C in May and the highest to occur in November by 3.0 °C. The MIROC-RCP8.5 model’s lowest far future increase estimation is 2.5 °C in February and the highest far future temperature increase projection is 4.8 °C in November.
The CSIRO-RCP4.5 model predicted a temperature increase in the near future in a range of 0.5 °C (in March) and 2.3 °C (in September and October). The CSIRO-RCP8.5 model temperature increase projection in near future is in a range of 1.3–3.5 °C. Moreover, the CSIRO-RCP4.5 model projected a temperature increase of 1.4 °C (in May) to 3.4 °C (in November) in the far future, whereas the temperature increase in a range of 3.1 °C (in May and July) to 5.7 °C (in October) is projected by the CSIRO-RCP8.5 model for far future. It is worth noting that in general the MIROC model tends to underestimate the temperature rise in comparison with the CSIRO model.
At the annual time scale, the MIROC-RCP4.5 and MIROC-RCP8.5 models projected temperature increase of 1.3 °C and 1.7 °C respectively in the near future, while temperature increases associated with the MIROC-RCP4.5 and MIROC-RCP8.5 models in the far future were found to be 2.0 °C and 3.5 °C, respectively. The CSIRO-RCP4.5 and CSIRO-RCP8.5 models’ predictions for annual average temperature increase are 1.4 °C and 2.1 °C in the near future, and 2.2 °C and 4.3 °C in the far future respectively.
Table 5 represents the seasonal variation of the temperature in the near and far futures for all the models. According to this table, temperature is projected to rise in all seasons for both the models and RCPs. Table 5 indicates that temperature increases are less in the fall and winter seasons in comparison with the spring and summer seasons. The highest temperature change is associated with the CSIRO-RCP8.5 model in the far future for the spring season by 5.5 °C, while the least temperature increase is projected to occur in near future during the fall season by 0.6 °C according to the CSIRO-RCP4.5 model. Similar to the monthly and annual time scales, the CSIRO model tends to project higher temperatures than the MIROC model at seasonal scale.
4.3. Streamflow Projections
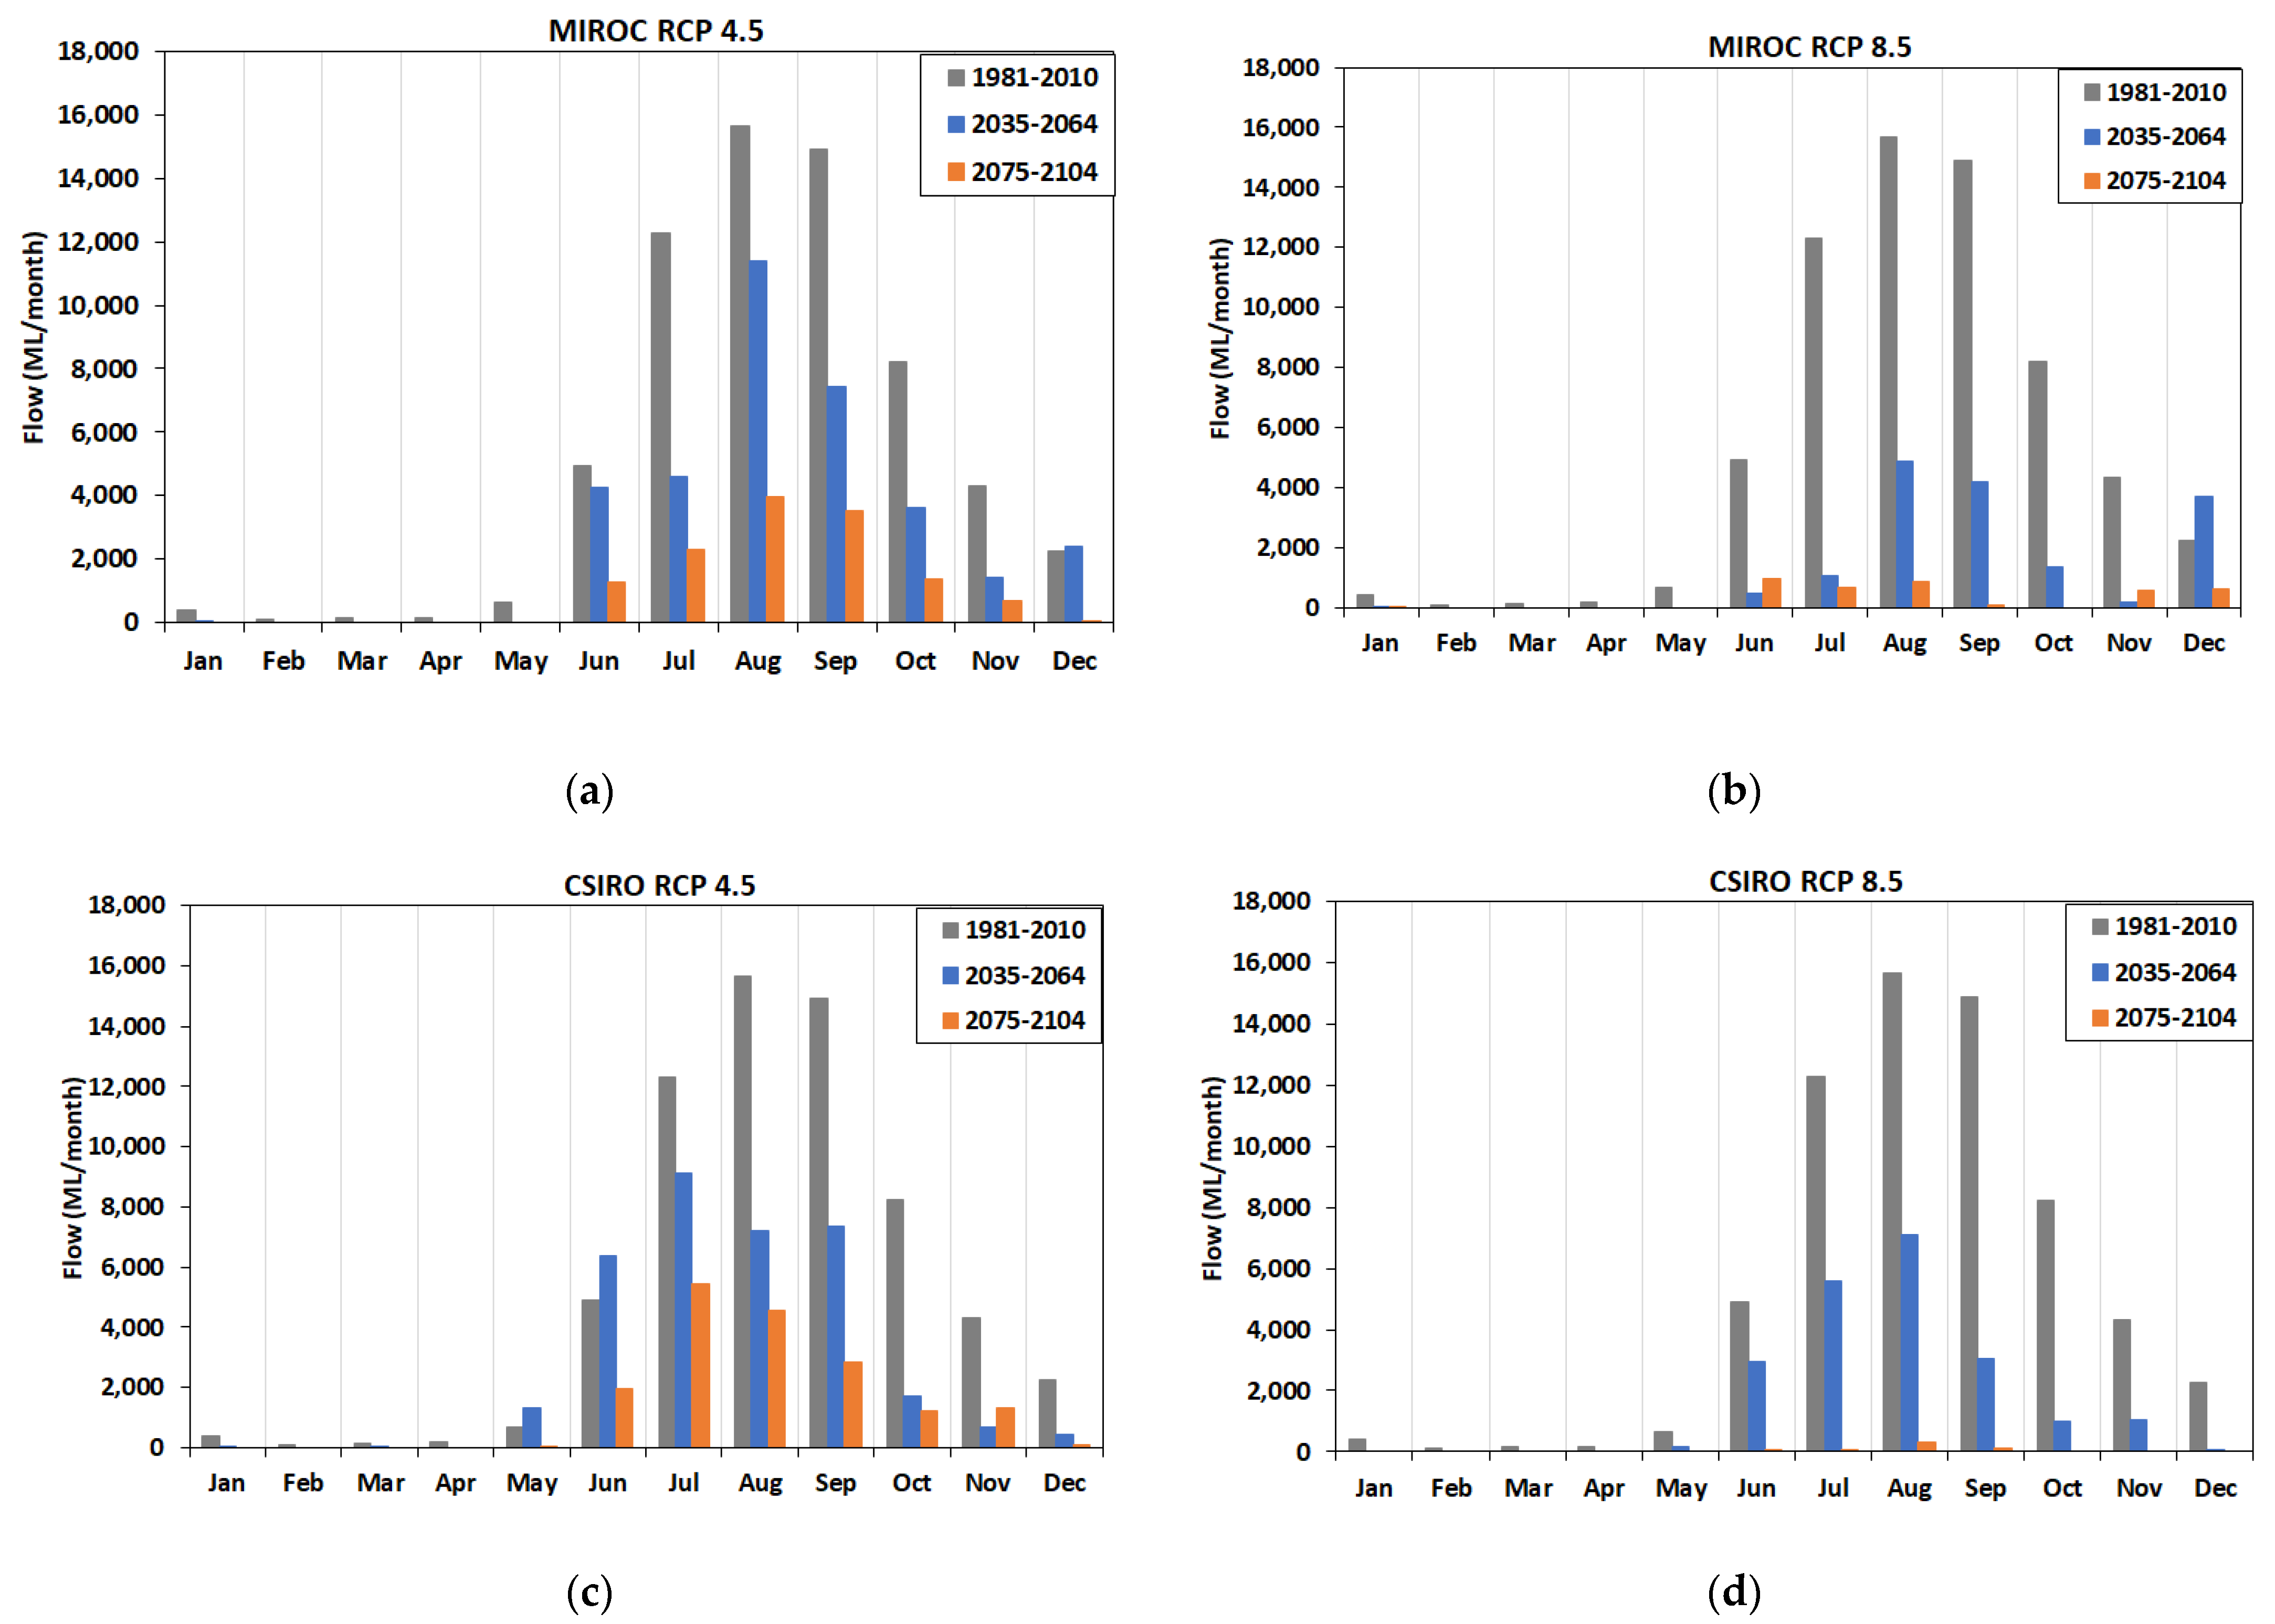
The streamflow values in the UCC were simulated for the 1981–2010 period using the observed rainfall and temperature data in the IHACRES model. Then, streamflow projections over near and far future periods were generated using rainfall and temperature outputs of MIROC and CSIRO models under RCP4.5 and RCP8.5 scenarios in calibrated IHACRES model. The observed and projected monthly streamflows as well as the percentage differences (in brackets) between observed and projected streamflow values are tabulated in Table 6. As can be seen in Table 6, monthly streamflow values were projected to decrease considerably in the future periods, with higher declines from the models using climate data under the RCP8.5 scenario. As discussed before, the rainfall reductions along with a remarkable increase in the temperature are the main reasons for decreases in the streamflows. Table 6 results are graphically presented in Figure 6.
Both Table 6 and Figure 6 indicate that streamflow is projected to decrease in future for all models in both future periods except the MIROC model for December in near future. This exception is due to projected rainfall increases in December as shown in Table 2. The CSIRO model streamflow projections are always greater than the MIROC model projections. The streamflow drop in future is more remarkable for the projections under the RCP8.5 scenario. The MIROC-RCP4.5 model results in the most optimistic scenario (with the highest monthly streamflow projections) in near future. Even with the most optimistic projection (MIROC-RCP4.5 model in near future), the river will completely dry out from January to May. The highest streamflow was projected in August in near future by the MIROC-RCP4.5 model with 11403 ML that is 27% less than the August streamflow of the observed period (1981–2010). The worst scenario with the lowest streamflow values was generated by the CSIRO-RCP8.5 model in the far future. According to this scenario, streamflow will occur only three months (July, August, and September) throughout the year with the highest streamflow in August with 315 ML, which is 98% less than August streamflow in the observed period.
When the streamflow values for the future periods were compared with the observed period at the annual scale, it was found that the MIROC-RCP4.5 scenario leads to average annual decreases of 64% and 89% for the near and far futures respectively. As anticipated, the MIROC-RCP8.5 scenario resulted in a sharper annual drop in streamflows for the future periods with 78% and 94%. Likewise, the CSIRO-RCP4.5 model produced streamflow values to drop by 53% and 84% for near and far futures respectively with respect to the streamflow values in the observed period, whereas the CSIRO-RCP8.5 model resulted in streamflow values, which are 81% and 100% less than observed streamflow values at the annual scale.
Furthermore, streamflow variation in the UCC was investigated at a seasonal scale in this study. Table 7 shows the seasonal streamflow differences between future and observed periods in the UCC.
As shown in Table 7, the highest overall streamflow decrease is found to occur in the fall season, whereas the lowest streamflow decrease is estimated for the winter season. Near and far futures are showing almost the same pattern (highest decrease in fall and lowest in winter).
As mentioned in the introduction section, CSIRO [19] projected streamflows in future in the Campaspe River Basin and reported an annual streamflow drop in a range of 8–28% according to CSIRO and MIROC models under low and high emission scenarios. The current study projected lower streamflow values in future for the study area in comparison to the study by CSIRO [19]. It would not be wrong to expect more reliable streamflow projections from this study (in comparison to CSIRO [19]) since better climate data set with a higher spatial resolution under the most current emission scenarios (RCPs) are employed in this study. Moreover, the future period studied in CSIRO [19] is around the year 2030, whereas this study provides projections for both near and far future periods.
As explained earlier, UCC provides inflow to the Lake Eppalock reservoir, which supplies irrigation, stock and domestic water to Campaspe irrigation district as well as urban water to Bendigo, Heathcote, and Ballarat [27]. The Lake Eppalock reservoir is fed by three basins: Upper Campaspe, Coliban, and Wild Duck Creek. Among these three, UCC was studied in this paper as it provides a significant portion of the total inflow to Lake Eppalock with an annual average flow of 59.8 GL [28]. UCC is an ephemeral catchment and there are very low (even zero flows in some years) from January to April. In the low flow months, irrigation withdrawals are restricted according to the license provided by the government authority, which limits the irrigation withdrawal in dry months according to the available water in the reservoir. Water is mainly used for residential supply in low flow months using the water stored in the wet months (from June to December).
The above-explained decreases in streamflow from the UCC indicated a significant reduction in the security of water supply from Lake Eppalock. Also, operation rules for Lake Eppalock reservoir will be influenced substantially by the reduction in streamflows in future. In this study, inflows only from UCC to Lake Eppalock were investigated. There is a need for further studies investigating the same for the other sub-basins inflowing to the Lake Eppalock reservoir to analyze climate change effects on the reservoir operation and water allocation to the end-users. It is also important to note that lowered streamflows will lead to water quality problems and will affect the ecosystems significantly in the study area.
5. Conclusions
In this study, climate change impacts on streamflows in the near (2035–2064) and far (2075–2104) future were examined in the Upper Campaspe Catchment (UCC) using future climate projections from CSIRO and MIROC models (derived under RCP4.5 and RCP8.5 scenarios) in calibrated IHACRES model. Also, the capability of the IHACRES model to simulate streamflows at UCC was studied in this paper. The followings are the main conclusions from this study:
- The IHACRES model was found to be very successful to simulate monthly streamflows in the UCC.
- The MIROC model projected annual rainfall decrease in a range of 1–19% while the CSIRO model predicted annual rainfall change with respect to the observed rainfall from +6% to −29%.
- In general, monthly rainfall decreases were projected by both MIROC and CSIRO models except December. Both models resulted in increases in December rainfall.
- Expectedly, both MIROC and CSIRO models (under both RCP4.5 and RCP8.5 scenario) projected temperature increases at all time scales (monthly, seasonal, and annual).
- Annual temperature increase in the UCC is projected to be in a range of 1.3–2.1 °C for the near future, and 2–4.3 °C for the far future.
- Higher temperature increases were projected in spring and summer seasons in comparison to fall and winter seasons.
- Remarkable streamflow reductions were projected by both models. The highest streamflow values were projected by the MIROC-RCP4.5 model in near future. According to this most optimistic scenario, the river will completely dry out from January to May. The CSIRO-RCP8.5 model in the far future resulted in the lowest streamflows occuring only for three months (July, August, and September) throughout the year. The annual streamflow drop projection varies between 53–81% for the near future and 84–100% for the far future.
- Significant decreases in streamflow will have substantial adverse effects on agricultural and residential water supply in the study area.
This paper aims to pioneer further studies about climate change effects on water security in Campaspe River Basin. Lake Eppalock is a critical reservoir in the Campaspe River Basin, and it is vital to understand climate change impacts on reservoir inflow, operation and water allocation in the area. In future, this study will be expanded to the other sub-catchments feeding the Lake Eppalock for a better understanding of climate change effects on water supply from the Lake Eppalock reservoir. It is recommended to employ more climate models’ (in addition to two models adopted in this study) data for more reliable streamflow projections. Also, studies investigating the relationship between climate change and water demand (urban and agricultural) in Campaspe River Basin is required to develop sustainable water management and climate change adaptation policies.
Author Contributions
Conceptualization, A.G.Y. and S.A.; Methodology, A.G.Y., S.A. and M.A.I.; Software, A.G.Y. and K.H.A.A.; Validation, A.G.Y. and K.H.A.A.; Formal analysis, A.G.Y. and S.A.; Writing—original draft preparation, A.G.Y., K.H.A.A. and S.A.; Writing—review and editing, A.G.Y., S.A. and M.A.I.; Supervision, A.G.Y., S.A. and M.A.I.; Project administration, A.G.Y. All authors have read and agreed to the published version of the manuscript.
Funding
This research received no external funding.
Data Availability Statement
Some or all data of this study are available from the corresponding author upon reasonable request.
Acknowledgments
Authors would like to thank The Victorian Government, Australia and the Commonwealth Scientific and Industrial Research Organisation (CSIRO) for climate change data sets.
Conflicts of Interest
The authors declare no conflict of interest.
References
- Yilmaz, A.G. The effects of Climate Change on Historical and Future Extreme Rainfall in Antalya, Turkey. Hydrol. Sci. J. 2015, 60, 2148–2162. [Google Scholar] [CrossRef] [Green Version]
- Yilmaz, A.G. Climate change effects and extreme rainfall non-stationarity. ICE-Water Manag. 2017, 170, 57–65. [Google Scholar] [CrossRef]
- Muhammad, A.; Evenson, G.R.; Unduche, F.; Stadnyk, T.A. Climate Change Impacts on Reservoir Inflow in the Prairie Pothole Region: A Watershed Model Analysis. Water 2020, 12, 271. [Google Scholar] [CrossRef] [Green Version]
- Yilmaz, A.G.; Shabib, A.G. Rainfall and air temperature projections for Sharjah City, United Arab Emirates. Int. J. Water 2019, 13, 60–79. [Google Scholar] [CrossRef]
- Naz, B.S.; Kao, S.C.; Ashfaq, M.; Gao, H.; Rastogi, D.; Gangrade, S. Effects of climate change on streamflow extremes and implications for reservoir inflow in the United States. J. Hydrol. 2018, 556, 359–370. [Google Scholar] [CrossRef]
- D’Agostino, D.R.; Trisorio, L.G.; Lamaddalena, N.; Ragab, R. Assessing the results of scenarios of climate and land use changes on the hydrology of an Italian catchment: Modelling study. Hydrol. Process. 2010, 24, 2693–2704. [Google Scholar] [CrossRef]
- Yilmaz, A.G.; Imteaz, M.A. Impact of climate change on runoff in the upper part of the Euphrates basin. Hydrol. Sci. J. 2011, 56, 1265–1279. [Google Scholar] [CrossRef]
- Givati, A.; Thirel, G.; Rosenfeld, D.; Paz, D. Climate change impacts on streamflow at the upper Jordan river based on an ensemble of regional climate models. J. Hydrol. Reg. Stud. 2019, 21, 92–109. [Google Scholar] [CrossRef]
- Kanakoudis, V.; Tsitsifli, S.; Papadopoulou, A.; Cencur Curk, B.; Karleusa, B. Water resources vulnerability assessment in the Adriatic Sea region: The case of Corfu Island. Environ. Sci. Pollut. Res. Int. 2017, 24, 20173–20186. [Google Scholar] [CrossRef]
- Chen, Y.; Feng, Y.; Zhang, F.; Yang, F.; Wang, L. Assessing and Predicting the Water Resources Vulnerability under Various Climate-Change Scenarios: A Case Study of Huang-Huai-Hai River Basin, China. Entropy 2020, 22, 333. [Google Scholar] [CrossRef] [Green Version]
- Azari, M.; Moradi, H.R.; Saghafian, B.; Faramarzi, M. Climate change impacts on streamflow and sediment yield in the North of Iran. Hydrol. Sci. J. 2016, 61, 123–133. [Google Scholar] [CrossRef]
- Su, B.D.; Huang, J.L.; Zeng, X.F.; Gao, C.; Jiang, T. Impacts of climate change on streamflow in upper Yangtze River basin. Clim. Chang. 2017, 141, 533–546. [Google Scholar] [CrossRef]
- Bian, H.Q.; Lü, H.S.; Sadeghi, A.; Zhu, Y.H.; Yu, Z.B.; Ouyang, F.; Su, J.B.; Chen, R.S. Assessment on the Effect of Climate Change on Streamflow in the Source Region of the Yangtze River, China. Water 2017, 9, 70. [Google Scholar] [CrossRef] [Green Version]
- Kamis, A.S.; Al-Wagdany, A.; Bahrawi, J.; Latif, M.; Elfeki, A.; Hannachi, A. Effect of reservoir models and climate change on flood analysis in arid regions. Arab. J. Geosci. 2020, 13, 818. [Google Scholar] [CrossRef]
- Arnbjerg-Nielsen, K. Quantification of climate change effects on extreme precipitation used for high resolution hydrologic design. Urban Water J. 2012, 9, 57–65. [Google Scholar] [CrossRef]
- Peel, M.C.; Chiew, F.H.S.; Western, A.W.; McMahon, T.A. Extension of Unimpaired Monthly Streamflow Data and Regionalisation of Parameter Values to Estimate Streamflow in Ungauged Catchments; National Land and Water Resources Audit: Melbourne, Australia, 2000. [Google Scholar]
- Vaze, J.; Teng, J. Future climate and runoff projections across New South Wales, Australia: Results and practical applications. Hydrol. Process. 2011, 25, 18–35. [Google Scholar] [CrossRef]
- Al-Safi, H.I.J.; Sarukkalige, P.R. The application of conceptual modelling approach to evaluate the impacts of climate change on the future streamflow in three unregulated catchments of the Australian hydrologic reference stations. Int. J. Hydrol. Sci. Technol. 2019, 9, 494. [Google Scholar] [CrossRef]
- CSIRO. Water Availability in the Campaspe. A Report to the Australian Government from the CSIRO Murray-Darling Basin Sustainable Yields Project; CSIRO: Canberra, Australia, 2008; pp. 30–120.
- Murray-Darling Basin Authority (MDBA). Available online: https://www.mdba.gov.au/water-management/catchments (accessed on 20 April 2021).
- Clarke, J.M.; Grose, M.; Thatcher, M.; Hernaman, V.; Heady, C.; Round, V.; Rafter, T.; Trenham, C.; Wilson, L. Victorian Climate Projections 2019 Technical Report; CSIRO: Melbourne, Australia, 2019.
- Abushandi, E.; Merkel, B. Modelling rainfall runoff relations using HEC-HMS and IHACRES for a single rain event in an arid region of Jordan. Water Resour. Manag. 2013, 27, 2391–2409. [Google Scholar] [CrossRef]
- Nikakhtar, M.; Rahmati, S.H.; Bavani, A.R.M. Impact of climate change on the future quality of surface waters: Case study of the Ardak River, northeast of Iran. J. Water Clim. Chang. 2020, 11, 685–702. [Google Scholar] [CrossRef] [Green Version]
- Croke, B.F.W.; Jakeman, A.J. Use of the IHACRES rainfall-runoff model in arid and semi arid regions. In Hydrological Modelling in Arid and Semi-Arid Areas; Wheater, H.S., Sorooshian, S., Sharma, K.D., Eds.; Cambridge University Press: Cambridge, UK, 2008; pp. 41–48. [Google Scholar]
- Ye, W.; Bates, B.C.; Viney, N.R.; Sivapalan, M.; Jakeman, A.J. Performance of conceptual rainfall runoff models in low-yielding ephemeral catchments. Water Resour. Res. 1997, 33, 153–166. [Google Scholar] [CrossRef]
- Yilmaz, A.G.; Muttil, N. Runoff estimation by machine learning methods and application to the Euphrates basin in Turkey. J. Hydrol. Eng. 2013, 19, 1015–1025. [Google Scholar] [CrossRef]
- Goulburn-Murray Water. Available online: https://www.g-mwater.com.au/water-resources/catchments/storages/campaspe/lakeeppalock (accessed on 26 April 2021).
- Bureau of Meteorology (BoM), Australia. Hydrologic Reference Stations. Available online: http://www.bom.gov.au/water/hrs/Last (accessed on 27 April 2021).
Figure 1.
Location of the study area (adopted from MDBA [20]).
Figure 1.
Location of the study area (adopted from MDBA [20]).

Figure 2.
Time series plots of modelled and observed streamflow: (a) calibration period; (b) validation period.
Figure 2.
Time series plots of modelled and observed streamflow: (a) calibration period; (b) validation period.

Figure 3.
Scatter plot of modelled and observed streamflow: (a) calibration period; (b) validation period.
Figure 3.
Scatter plot of modelled and observed streamflow: (a) calibration period; (b) validation period.

Figure 4.
Observed and projected monthly total rainfall: (a) MIROC-RCP4.5 model; (b) MIROC-RCP8.5 model; (c) CSIRO-RCP4.5 model; (d) CSIRO-RCP8.5 model.
Figure 4.
Observed and projected monthly total rainfall: (a) MIROC-RCP4.5 model; (b) MIROC-RCP8.5 model; (c) CSIRO-RCP4.5 model; (d) CSIRO-RCP8.5 model.


Figure 5.
Observed and projected monthly average temperatures: (a) MIROC-RCP4.5 model; (b) MIROC-RCP8.5 model; (c) CSIRO-RCP4.5 model; (d) CSIRO-RCP8.5 model.
Figure 5.
Observed and projected monthly average temperatures: (a) MIROC-RCP4.5 model; (b) MIROC-RCP8.5 model; (c) CSIRO-RCP4.5 model; (d) CSIRO-RCP8.5 model.

Figure 6.
Observed and projected monthly streamflow: (a) MIROC-RCP4.5 model; (b) MIROC-RCP8.5 model; (c) CSIRO-RCP4.5 model; (d) CSIRO-RCP8.5 model.
Figure 6.
Observed and projected monthly streamflow: (a) MIROC-RCP4.5 model; (b) MIROC-RCP8.5 model; (c) CSIRO-RCP4.5 model; (d) CSIRO-RCP8.5 model.


Table 1.
Annual rainfall and temperature characteristics.
| Period | Temperature (°C) | Rainfall (mm) | ||||||
|---|---|---|---|---|---|---|---|---|
| Mean | Max | Min | Mean | Max | Min | |||
| Observed Data | 1981–2010 | 12.5 | 13.6 | 11.6 | 728 | 1139 | 378 | |
| MIROC near future | RCP4.5 | 2035–2064 | 13.8 | 15.0 | 12.8 | 726 | 1139 | 351 |
| RCP8.5 | 2035–2064 | 14.3 | 15.5 | 13.2 | 613 | 1097 | 284 | |
| MIROC late future | RCP4.5 | 2075–2104 | 14.5 | 15.7 | 13.4 | 619 | 1019 | 270 |
| RCP8.5 | 2075–2104 | 16.0 | 17.3 | 14.8 | 575 | 1010 | 259 | |
Table 2.
Observed and projected monthly total rainfall (mm).
| MIROC Projected Rainfall | CSIRO Projected Rainfall | ||||||||
|---|---|---|---|---|---|---|---|---|---|
| Near Future Rainfall (mm) | Far Future Rainfall (mm) | Near Future Rainfall (mm) | Far Future Rainfall (mm) | ||||||
| Month | Observed Monthly Rainfall (mm) | RCP4.5 | RCP8.5 | RCP4.5 | RCP8.5 | RCP4.5 | RCP8.5 | RCP4.5 | RCP8.5 |
| Jan | 41 | 40 (0%) | 34 (−16%) | 37 (−8%) | 34 (−16%) | 37 (−10%) | 45 (12%) | 48 (19%) | 42 (3%) |
| Feb | 36 | 29 (−20%) | 36 (−1%) | 33 (−9%) | 35 (−4%) | 32 (−11%) | 22 (−40%) | 28 (−24%) | 16 (−55%) |
| Mar | 37 | 22 (−39%) | 30 (−20%) | 20 (−47%) | 24 (−35%) | 61 (64%) | 32 (−13%) | 33 (−10%) | 30 (−20%) |
| Apr | 45 | 48 (7%) | 42 (−6%) | 35 (−22%) | 31 (−31%) | 51 (15%) | 37 (−17%) | 55 (23%) | 33 (−26%) |
| May | 62 | 59 (−4%) | 46 (−26%) | 55 (−12%) | 55 (−11%) | 88 (43%) | 79 (28%) | 71 (15%) | 45 (−26%) |
| Jun | 91 | 100 (10%) | 66 (−27%) | 79 (−13%) | 64 (−30%) | 97 (7%) | 94 (4%) | 91 (0%) | 63 (−30%) |
| Jul | 81 | 63 (−21%) | 60 (−26%) | 67 (−17%) | 56 (−30%) | 73 (−9%) | 73 (−9%) | 78 (−3%) | 54 (−33%) |
| Aug | 84 | 97 (16%) | 70 (−16%) | 72 (−14%) | 57 (−32%) | 64 (−24%) | 75 (−10%) | 64 (−24%) | 43 (−48%) |
| Sep | 74 | 60 (−19%) | 53 (−28%) | 59 (−20%) | 34 (−54%) | 66 (−11%) | 46 (−38%) | 52 (−30%) | 40 (−46%) |
| Oct | 63 | 59 (−6%) | 54 (−14%) | 50 (−20%) | 50 (−21%) | 47 (−26%) | 51 (−19%) | 53 (−17%) | 48 (−24%) |
| Nov | 63 | 61 (−3%) | 48 (−24%) | 54 (−14%) | 55 (−13%) | 63 (0%) | 56 (−11%) | 53 (−16%) | 33 (−47%) |
| Dec | 53 | 87 (64%) | 74 (40%) | 58(10%) | 81 (53%) | 70 (32%) | 58 (10%) | 68 (29%) | 53 (0%) |
Table 3.
Seasonal rainfall changes.
| Season | Near Future (2035–2064) | Far Future (2075–2104) | ||||||
|---|---|---|---|---|---|---|---|---|
| RCP 4.5 | RCP 8.5 | RCP 4.5 | RCP 8.5 | |||||
| CSIRO | MIROC | CSIRO | MIROC | CSIRO | MIROC | CSIRO | MIROC | |
| Spring | −12% | −10% | −22% | −20% | −24% | −18% | −40% | −36% |
| Summer | 4% | 15% | 1% | −20% | 1% | −11% | −22% | −14% |
| Fall | 40% | −12% | −23% | −9% | −4% | −26% | −34% | −23% |
| Winter | −9% | 1% | 7% | −26% | 4% | −14% | −30% | −24% |
Table 4.
Observed and projected monthly average temperature (°C).
| MIROC Projected Temperature | CSIRO Projected Temperature | ||||||||
|---|---|---|---|---|---|---|---|---|---|
| Near Future | Far Future | Near Future | Far Future | ||||||
| Month | Observed Monthly Temperature (°C) | RCP4.5 | RCP8.5 | RCP4.5 | RCP8.5 | RCP4.5 | RCP8.5 | RCP4.5 | RCP8.5 |
| Jan | 18.9 | 20.3 (1.4) | 21.1 (2.2) | 20.8 (1.9) | 22.5 (3.6) | 20.8 (1.9) | 21.2 (2.3) | 21.2 (2.3) | 23.6 (4.7) |
| Feb | 19.0 | 20.0 (1.0) | 20.4 (1.4) | 20.8 (1.8) | 21.5 (2.5) | 20.7 (1.7) | 20.7 (1.7) | 20.9 (1.9) | 22.9 (3.9) |
| Mar | 16.7 | 17.8 (1.0) | 18.0 (1.2) | 18.7 (2.0) | 20.1 (3.4) | 17.2 (0.5) | 18.0 (1.3) | 18.2 (1.5) | 20.5 (3.7) |
| Apr | 12.8 | 13.6 (0.7) | 13.7 (0.9) | 14.3 (1.4) | 16.1 (3.3) | 13.5 (.07) | 14.5 (1.7) | 14.5 (1.7) | 16.8 (4.0) |
| May | 9.8 | 10.3 (0.5) | 10.6 (0.8) | 11.0 (1.2) | 12.6 (2.8) | 10.4 (0.6) | 11.1 (1.3) | 11.2 (1.4) | 12.9 (3.1) |
| Jun | 7.1 | 8.1 (1.0) | 8.5 (1.4) | 8.5 (1.4) | 9.8 (2.7) | 7.8 (0.7) | 8.4 (1.3) | 8.7 (1.6) | 10.3 (3.2) |
| Jul | 6.3 | 7.1 (0.8) | 7.5 (1.2) | 7.6 (1.3) | 9.0 (2.6) | 7.6 (1.2) | 7.9 (1.5) | 8.1 (1.7) | 9.5 (3.1) |
| Aug | 7.3 | 8.5 (1.1) | 8.5 (1.2) | 8.9 (1.6) | 10.3 (3.0) | 8.7 (1.4) | 9.4 (2.1) | 9.4 (2.1) | 11.2 (3.9) |
| Sep | 9.3 | 10.9 (1.6) | 11.5 (2.3) | 11.7 (2.4) | 13.5 (4.3) | 11.6 (2.3) | 11.6 (2.4) | 12.0 (2.8) | 14.5 (5.2) |
| Oct | 11.8 | 13.5 (1.7) | 14.3 (2.5) | 14.2 (2.4) | 16.0 (4.3) | 14.1 (2.3) | 15.0 (3.3) | 15.1 (3.3) | 17.5 (5.7) |
| Nov | 14.7 | 16.6 (1.9) | 17.8 (3.1) | 17.8 (3.0) | 19.5 (4.8) | 16.9 (2.2) | 18.2 (3.5) | 18.1 (3.4) | 20.2 (5.5) |
| Dec | 16.8 | 19.2 (2.4) | 19.6 (2.8) | 19.7 (2.9) | 21.2 (4.4) | 18.5 (1.7) | 19.7 (2.9) | 19.6 (2.8) | 22.0 (5.2) |
Table 5.
Projected seasonal temperature increases.
| Season | Near Future (2035–2064) | Far Future (2075–2104) | ||||||
|---|---|---|---|---|---|---|---|---|
| RCP 4.5 | RCP 8.5 | RCP 4.5 | RCP 8.5 | |||||
| CSIRO | MIROC | CSIRO | MIROC | CSIRO | MIROC | CSIRO | MIROC | |
| Spring | 2.3 | 1.7 | 3.0 | 2.6 | 2.7 | 2.6 | 5.5 | 4.4 |
| Summer | 1.8 | 1.6 | 2.3 | 2.1 | 2.9 | 2.2 | 4.6 | 3.5 |
| Fall | 0.6 | 0.8 | 1.4 | 1.0 | 1.7 | 1.5 | 3.6 | 3.2 |
| Winter | 1.1 | 1.0 | 1.6 | 1.3 | 1.6 | 1.4 | 3.4 | 2.7 |
Table 6.
Observed and projected monthly total streamflow (ML/month).
| MIROC Projected Streamflow | CSIRO Projected Streamflow | ||||||||
|---|---|---|---|---|---|---|---|---|---|
| Near Future | Far Future | Near Future | Far Future | ||||||
| Month | Observed Monthly Streamflow (ML/Month) | RCP4.5 | RCP8.5 | RCP4.5 | RCP8.5 | RCP4.5 | RCP8.5 | RCP4.5 | RCP8.5 |
| Jan | 413 | 7 (−98%) | 15 (−96%) | 0 (−100%) | 0 (−100%) | 0 (−100%) | 0 (−100%) | 0 (−100%) | 0 (−100%) |
| Feb | 102 | 0 (−100%) | 0 (−100%) | 0 (−100%) | 0 (−100%) | 0 (−100%) | 0 (−100%) | 0 (−100%) | 0 (−100%) |
| Mar | 156 | 0 (−100%) | 0 (−100%) | 0 (−100%) | 0 (−100%) | 18 (−89%) | 0 (−100%) | 0 (−100%) | 0 (−100%) |
| Apr | 177 | 0 (−100%) | 0 (−100%) | 0 (−100%) | 0 (−100%) | 0 (−100%) | 0 (−100%) | 0 (−100%) | 0 (−100%) |
| May | 663 | 0 (−100%) | 0( −100%) | 0 (−100%) | 0 (−100%) | 1303 (97%) | 161 (−76%) | 32 (−95%) | 0 (−100%) |
| Jun | 4924 | 4281 (−13%) | 476 (−90%) | 1293 (74%) | 957 (−81%) | 6356 (29%) | 2949 (−40%) | 1978( −60%) | 1 (−100%) |
| Jul | 12297 | 4600 (−63%) | 1043 (−92%) | 2319 (81%) | 684 (−94%) | 9121 (−26%) | 5587 (−55%) | 5453 (−56%) | 68 (−99%) |
| Aug | 15663 | 11403 (−27%) | 4891 (−69%) | 3969 (75%) | 875 (−94%) | 7207 (−54%) | 7113 (−55%) | 4539 (−71%) | 315 (−98%) |
| Sep | 14893 | 7458 (−50%) | 4219 (−72%) | 3538 (76%) | 71 (−100%) | 7372 (−51%) | 3065 (−79%) | 2821 (−81%) | 137 (−99%) |
| Oct | 8224 | 3648 (−56%) | 1352 (−84%) | 1364 (83%) | 0 (−100%) | 1718 (−79%) | 991 (−88%) | 1241 (−85%) | 0 (−100%) |
| Nov | 4321 | 1419 (−67%) | 201 (−95%) | 704 (84%) | 563 (87%) | 699 (−84%) | 1026 (−76%) | 1302 (−70%) | 0 (−100%) |
| Dec | 2261 | 2381 (6%) | 3690 (63%) | 41 (98%) | 6423 (72%) | 424 (−81%) | 10 (−100%) | 88 (−96%) | 0 (−100%) |
Table 7.
Seasonal streamflow changes in future with reference to observed streamflow.
| Season | Near Future (2035–2064) | Far Future (2075–2104) | ||||||
|---|---|---|---|---|---|---|---|---|
| RCP 4.5 | RCP 8.5 | RCP 4.5 | RCP 8.5 | |||||
| CSIRO | MIROC | CSIRO | MIROC | CSIRO | MIROC | CSIRO | MIROC | |
| Spring | −71% | −58% | −74% | −75% | −79% | −78% | −99% | −98% |
| Summer | −94% | −64% | −88% | −96% | −85% | −92% | −100% | −93% |
| Fall | −31% | −100% | −100% | −100% | −100% | −100% | −100% | −100% |
| Winter | −17% | −34% | −57% | −94% | −70% | −85% | −100% | −92% |
Publisher’s Note: MDPI stays neutral with regard to jurisdictional claims in published maps and institutional affiliations. |
© 2021 by the authors. Licensee MDPI, Basel, Switzerland. This article is an open access article distributed under the terms and conditions of the Creative Commons Attribution (CC BY) license (https://creativecommons.org/licenses/by/4.0/).
Share and Cite
MDPI and ACS Style
Yilmaz, A.G.; Atabay, S.; Amou Assar, K.H.; Imteaz, M.A. Climate Change Impacts on Inflows into Lake Eppalock Reservoir from Upper Campaspe Catchment. Hydrology 2021, 8, 108. https://0-doi-org.brum.beds.ac.uk/10.3390/hydrology8030108
AMA Style
Yilmaz AG, Atabay S, Amou Assar KH, Imteaz MA. Climate Change Impacts on Inflows into Lake Eppalock Reservoir from Upper Campaspe Catchment. Hydrology. 2021; 8(3):108. https://0-doi-org.brum.beds.ac.uk/10.3390/hydrology8030108
Chicago/Turabian StyleYilmaz, Abdullah Gokhan, Serter Atabay, Kimia Haji Amou Assar, and Monzur Alam Imteaz. 2021. "Climate Change Impacts on Inflows into Lake Eppalock Reservoir from Upper Campaspe Catchment" Hydrology 8, no. 3: 108. https://0-doi-org.brum.beds.ac.uk/10.3390/hydrology8030108
Note that from the first issue of 2016, this journal uses article numbers instead of page numbers. See further details here.