
Water Quality Assessment of Urban Ponds and Remediation Proposals


1
Instituto Superior Técnico, Universidade de Lisboa, Av. Rovisco Pais, 1049-001 Lisboa, Portugal
2
Interdisciplinary Centre of Marine and Environmental Research (CIIMAR/CIMAR), University of Porto, Novo Edifício do Terminal de Cruzeiros do Porto de Leixões, Avenida General Norton de Matos, S/N, 4450-208 Matosinhos, Portugal
3
Direção Municipal do Ambiente, Estrutura Verde, Clima e Energia, Câmara Municipal de Lisboa, Praça do Município, 1100-038 Lisboa, Portugal
4
CESAM—Centro de Estudos do Ambiente e do Mar, Faculdade de Ciências, Departamento de Biologia Animal, Universidade de Lisboa, Campo Grande, 1749-016 Lisboa, Portugal
5
CERIS, Instituto Superior Técnico, Universidade de Lisboa, Av. Rovisco Pais, 1049-001 Lisboa, Portugal
*
Author to whom correspondence should be addressed.
Hydrology 2022, 9(7), 114; https://0-doi-org.brum.beds.ac.uk/10.3390/hydrology9070114
Submission received: 3 June 2022
/
Revised: 16 June 2022
/
Accepted: 17 June 2022
/
Published: 24 June 2022
Abstract
:Ponds are a common feature in urban parks to provide aesthetic and recreational functions, but also deliver a wide range of ecosystem services. The objective of this study was to assess the water quality of six urban ponds in the city of Lisbon, Portugal, to determine the factors that influence it and consider remediation measures for them. Besides that, our study aims to deliver data in order to support the best approach for a future monitoring program, toward more strategic and sustainable management. Floating treatment wetlands (FTW) were installed in three of the ponds during the study, where nutrient levels were higher. Water sampling was performed since 2016, with more intensive campaigns in 2020 and 2021. Average pH ranged from 7.9 to 9.0, average Chemical Oxygen Demand ranged from 36 mg/L to 90 mg/L and average Total Suspended Solids ranged from 7 to 93 mg/L. The main factors that contribute to these values were identified as the presence of waterbirds, vegetative debris that falls in ponds, and contamination with sewage. The FTW that were installed in some of the ponds could help to improve the water quality, but additional measures such as removal of bottom sediments and leaves in the fall, may be necessary. It is expected that the assessment of water quality carried out in the urban ponds can contribute to the overall improvement of urban water management.
1. Introduction
Lakes and ponds are one of the landscape features that significantly contribute to promoting the quality of life in urban centers, by increasing amenities, providing recreational and educational activities, and even contributing to urban climate regulation [1,2]. In addition to cultural and recreational values, in urban areas, lakes and ponds contribute to biodiversity, provide social benefits, rainwater drainage, and several other ecosystem services [3,4,5,6]. They also play a pivotal role in response to the effects of climate change [7]. However, they are extremely vulnerable landscape elements, sensitive to anthropogenic pressures since their watershed is part of the urban fabric and, therefore, tend to emphasize the environmental problems that affect metropolitan areas, by accumulating large amounts of nutrients and pollutants, including microbial contaminants [8,9]. Fecal contamination and the proliferation of toxic cyanobacteria can deteriorate the ecological value of these environments and turn them into a potential health risk [10,11].
In the urban landscape, excessive concentrations of nutrients have different origins, being partly attributed to feeding waterbirds, and other types of urban wildlife [12,13,14], and the use of land, such as runoff from construction sites [15], buildings, impervious paved surfaces [16], recreational areas (e.g., golf courses) [17], parks and gardens [18]. These are examples of external sources of nutrients. Another source of nutrients is the pond itself since sediments from the bottom of lakes have also been recognized as a potential source of phosphorus in surface waters [19,20,21,22]. Besides that, the phosphorus content in a lake that corresponds to the release of phosphorus from sediments, from the lake bottom into the water, is an important factor in regulating eutrophication in shallow lakes [19,20,23]. These nutrients in the water column are utilized by the rapidly developing phytoplankton creating algal blooms, which in addition to reducing the lake’s aesthetic value, cause turbidity in the water and can be harmful to other aquatic organisms or even ducks and fish [24].
There are remediation techniques aiming to reduce nutrient concentrations in lakes [25,26]. For instance, the main measures to remove phosphorus from the water column are the removal of bottom sediments or phosphorus inactivation. The first acts by removing the bottom sediments which can be contaminated with phosphorus, preventing it from dissolving and re-entering the water column again. The second is achieved by the addition of precipitants that bind the phosphorus in the sediments preventing it from dissolving and re-entering the water column [27]. Biomanipulation, the addition of piscivorous fish or removal of zooplankton-eating fish, is also a common measure to improve water quality in lakes. Zooplankton feeds on phytoplankton, so reducing the population of fish species that feed on zooplankton is an effective way to prevent algal blooms [28]. The introduction of vegetation into the lake, through macrophytes (floating, submerged, or emerging) or floating treatment wetlands (FTW) will act as competition to phytoplankton since the vegetation feeds on the same nutrients, making them unavailable to phytoplankton. They can also contribute to the sedimentation of particles improving water clarity, as well as removing certain contaminants from the water column or sediments [29]. Other remediation measures have also been applied, such as herbicide applications to control unwanted aquatic plants [30,31], algaecides [32], mixing and aeration of the water column [33,34], and bioremediation [35].
The aim of this study is to evaluate the water quality of six ponds in the city of Lisbon and analyze their performance during a period of time, in order to support the best approach for a future monitoring program, as a sustainable urban pond management strategy. The study included data collected by Lisbon Municipality as part of a monitoring program between 2016 and 2021, complemented with more intensive campaigns in 2020 and 2021. The parameters analyzed included organic matter, nutrients, sulfate, and chloride.
2. Methods
2.1. Study Sites
The case study includes six artificial ponds located in Lisbon, Portugal: Quinta das Conchas (QC), two ponds in Parque Oeste (PO3 and PO5), Doca da Caldeirinha (DC), Jardim da Estrela (JE) and Estufa Fria (EF) (Figure 1). All ponds are inserted in urban public parks except for DC, which is located close to the historic center of the city, near the river Tagus. The pond’s surface area ranges from 465 m2 (JE) to 3685 m2 (EF) and water sources include groundwater, brackish water (DC), and public water supply (Table 1). All the ponds are artificial, shallow in depth (less than 1 m, and for DC 1.4 m), surrounded by grassed areas and trees, except DC.
QC pond is integrated into a 25 ha garden (Figure 1a). It is a complex system of channels and a pond surrounded by grass areas with trees. In autumn, leaf debris fall in the water and accumulate in the bottom of the pond and channels. There is a large waterbird population that gathers in the pond and disturbs the bottom sediments, registered by observation. The water level in the pond was variable during the sampling period, increasing in the winter (maximum height of the pond, 1 m) and being very shallow in the summer (less than 0.5 m).
In Parque Oeste, pond PO3 is the smallest (Figure 1b) and PO5 is the biggest of the six ponds evaluated (Figure 1c). They provide an important function as a retention basin that collects and stores stormwater that can be used to irrigate the gardens surrounding the ponds, therefore, the water level also varied during the sampling period. Both ponds exhibit green water, fish, and large waterbird populations. According to Lisbon Municipality, pond PO5 was designed as a detention basin, and therefore stormwater flow is its main water source. However, in order to maintain a minimum water level groundwater is also pumped into the pond during dryer periods, when precipitation is not enough. It was also reported by the Municipality that there are occasional uncontrolled wastewater discharges from unknown origins into PO5. JE is the smallest pond in the case study and is part of a 4.6 ha mature urban garden with shade trees that contribute with leaf litter to the water in the colder months (Figure 1d). Visitors feed the waterbirds on a regular basis. In this pond, the water level remained stable during the sample period. Concerning EF pond, is also surrounded by grass areas and trees, has a large waterbird population and the water level can also vary throughout the year (Figure 1e). The DC pond differs from the others since it is surrounded by buildings and a road with impervious pavement (Figure 1f). According to information provided by Lisbon Municipality, this pond was created in 2014 and included a set of pipes connecting with the river Tagus that allowed brackish water from the estuary to enter the pond following the tide’s cycle. However, this system got clogged in 2017, preventing the renovation of the pond water. After clogging, the pipes’ incoming water from river Tagus only comes sporadically when tide levels in the river exceed very high levels. Waterbirds gather in this pond as well.
Precipitation data in Lisbon was obtained from a weather station located at Instituto Superior Técnico (coordinates 38.73626, −9.13842). Due to several equipment malfunctions data was only available from November 2020 to July 2021.
2.2. Water Sampling
All samples were collected with a bucket near the margin of each pond and stored in plastic bottles to be immediately transported to the laboratory inside a cooler for further analysis.
On-site measurements, at the time of water sampling, were taken for water temperature and pH (HACH Sension+ 5051T), Electric Conductivity (EC) (HACH Sension+ 5060), and Dissolved Oxygen (DO) (YSI ProODO). Parameters analyzed in the laboratory were determined according to Standard Methods [36] and included: Biochemical Oxygen Demand (BOD5), Chemical Oxygen Demand (COD), Total Suspended Solids (TSS), Nitrates (NO3-N), Ammonia (NH3-N), Kjeldahl Nitrogen (KN), Total Phosphorus (TP), Sulfate (SO42−) and Chloride (CL). Organic nitrogen was calculated by subtracting ammonia-N from KN.
The frequency of sampling varied, with some of the ponds having a wider availability of data, like DC with data ranging from 2016 to 2020, and other ponds like QC only having data between July 2020 and October 2021. Since a more consistent and frequent sampling took place from 2020 onwards, the data presented will refer to this period unless otherwise stated.
2.3. Remediation Measures
For the purpose of water quality improvement ponds JE, EF and DC had FTW (Cork Floating Island®, Supplier: Bluemater, S.A., Porto, Portugal) installed in November 2019, December 2019, and March 2020, respectively. The area covered with the FTW was 9 to 12% of the total surface area of the ponds. The floating platforms were made of cork agglomerate (density of 0.2), frustoconical holes of two different sizes (8 cm and 16 cm diameter), size of 100 × 50 × 10 cm (l × w × h), with cutouts for cork connector fittings, which allows configuring larger platforms and adapting their shape as desired, with an anchoring system, according to the manufacturer [37]. The plants were fixed with rock wool, a porous material that allows the fixation of the plants and their free growth, with the roots immersed in water and without any soil.
At the JE and EF ponds, the FTW were initially installed mainly with Iris pseudacorus, Phragmites sp., and Alisma plantago-aquatica. In DC, due to the higher salinity level plant species were selected as two native plants of Tagus estuary, Halimione portulacoides, and Sarcocornia fruticosa.
Before the installation of FTW, the only remediation measure that took place was in DC, which had the water drained and bottom sediments removed, at the end of 2018.
3. Results and Discussion
3.1. On-Site Water Quality Measurements and Sulfate Analysis
Table 2 presents maximum, minimum, and average values for water parameters measured in each pond, considering temperature, pH, DO, and EC, in 2020 and 2021.
Average pH was similar between ponds, with values slightly alkaline. Urban ponds have been previously reported as having higher pH values than natural ponds [11]. Concerning DO concentrations, these were consistently above 4 mg/L in all ponds during the study period, with the exception of pond DC. In this pond, a drop in DO was observed from 15.2 mg/L in April 2021 to 1.3 mg/L in July 2021. During this time period, algae bloom covered the surface of the pond, which could have affected oxygen exchange at the water/air interface (Figure 2). The supersaturation in April 2021 was most likely resulting from the initial algae development that ultimately covered the surface of the pond and prevented further oxygenation of lower depths.
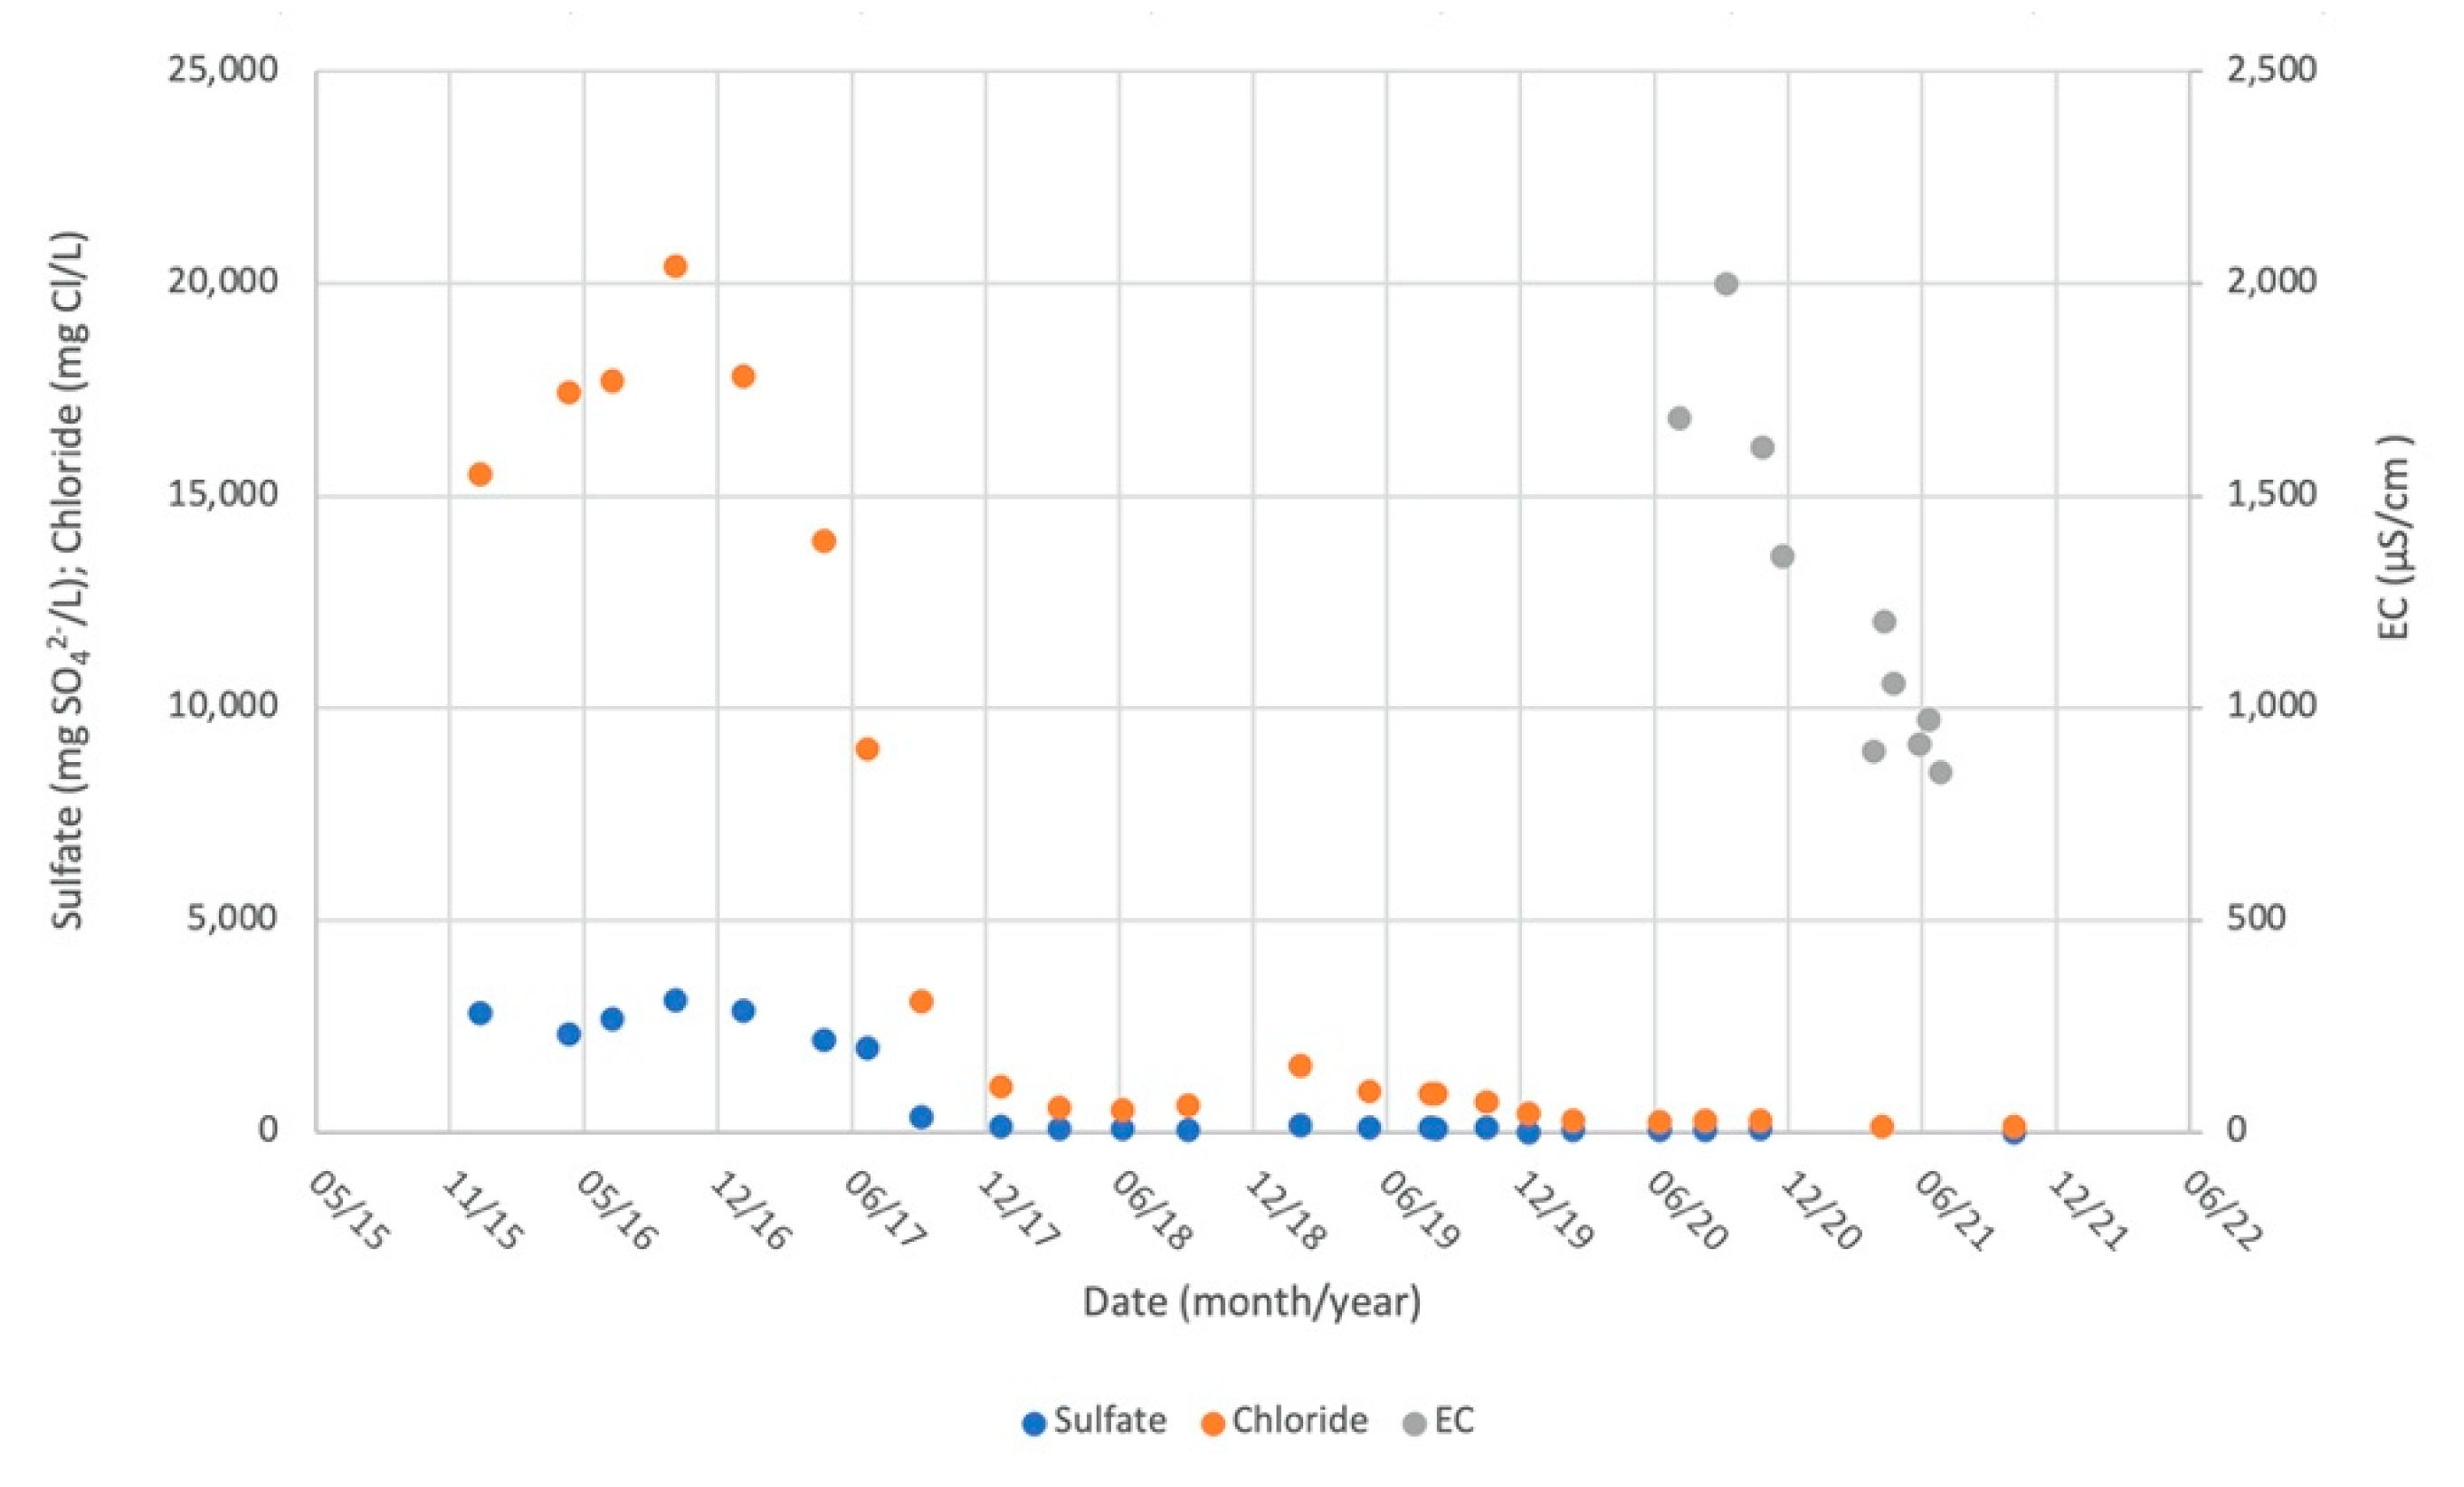
Between 2020 and 2021, average EC values ranged from 300 µS/cm to 600 µS/cm in all ponds, being considered class II, medium salinity water [38]. Pond DC was an exception that exhibited the highest average values with 1255 µS/cm, most likely as a result of the sporadic hydraulic connection with river Tagus. This type of water is classified as class III, high salinity water [38]. Although there were no EC measurements in pond DC prior to 2020, the average values of EC in Tagus Estuary between 1999 and 2005 varied between 28,000 and 45,000 µS/cm [39]. It is worth noting that the water exchange with the river was significantly reduced in 2018, as can be observed by the chloride concentration shown in Figure 3.
High conductivity in urban lakes has been reported previously with values ranging from 1200 to 1700 µS/cm, even without the influence of sea water [40].
To complement the analysis undertaken, sulfate analysis was performed occasionally. Sulfate was sampled in pond DC in 2016, with values above 2000 SO42− mg/L until mid 2017, dropping to values lower than 100 mg SO42−/L in 2018 (Figure 3). This drop in sulfates coincided with the drop in chloride concentration which occurred at the same time, and most likely resulted from the reduced exchange with river (saline) water. This also indicated that the sulfate source was from the river. Average sulfate concentrations in 2020–2021 in ponds EF and JE reached 33.6 and 27.3 mg SO42−/L (n = 5, n = 4), respectively, similar to the value of 48.2 mg SO42−/L observed in pond DC in the same period. Evidence of sulfate, provided by high concentrations of sulfide (>25 mg/L), has been reported previously by Bhat et al. [40], in ponds where water quality was attributed to sewage discharge, agriculture, and urban runoff.
3.2. Assessment of Water Organics and Total Suspended Solids Content
Table 3 presents the maximum, minimum, and average values of BOD5, COD, and TSS in 2020 and 2021. BOD5 was only determined for pond EF, JE, and DC and in all of them, concentrations averaged around 10 mg/L.
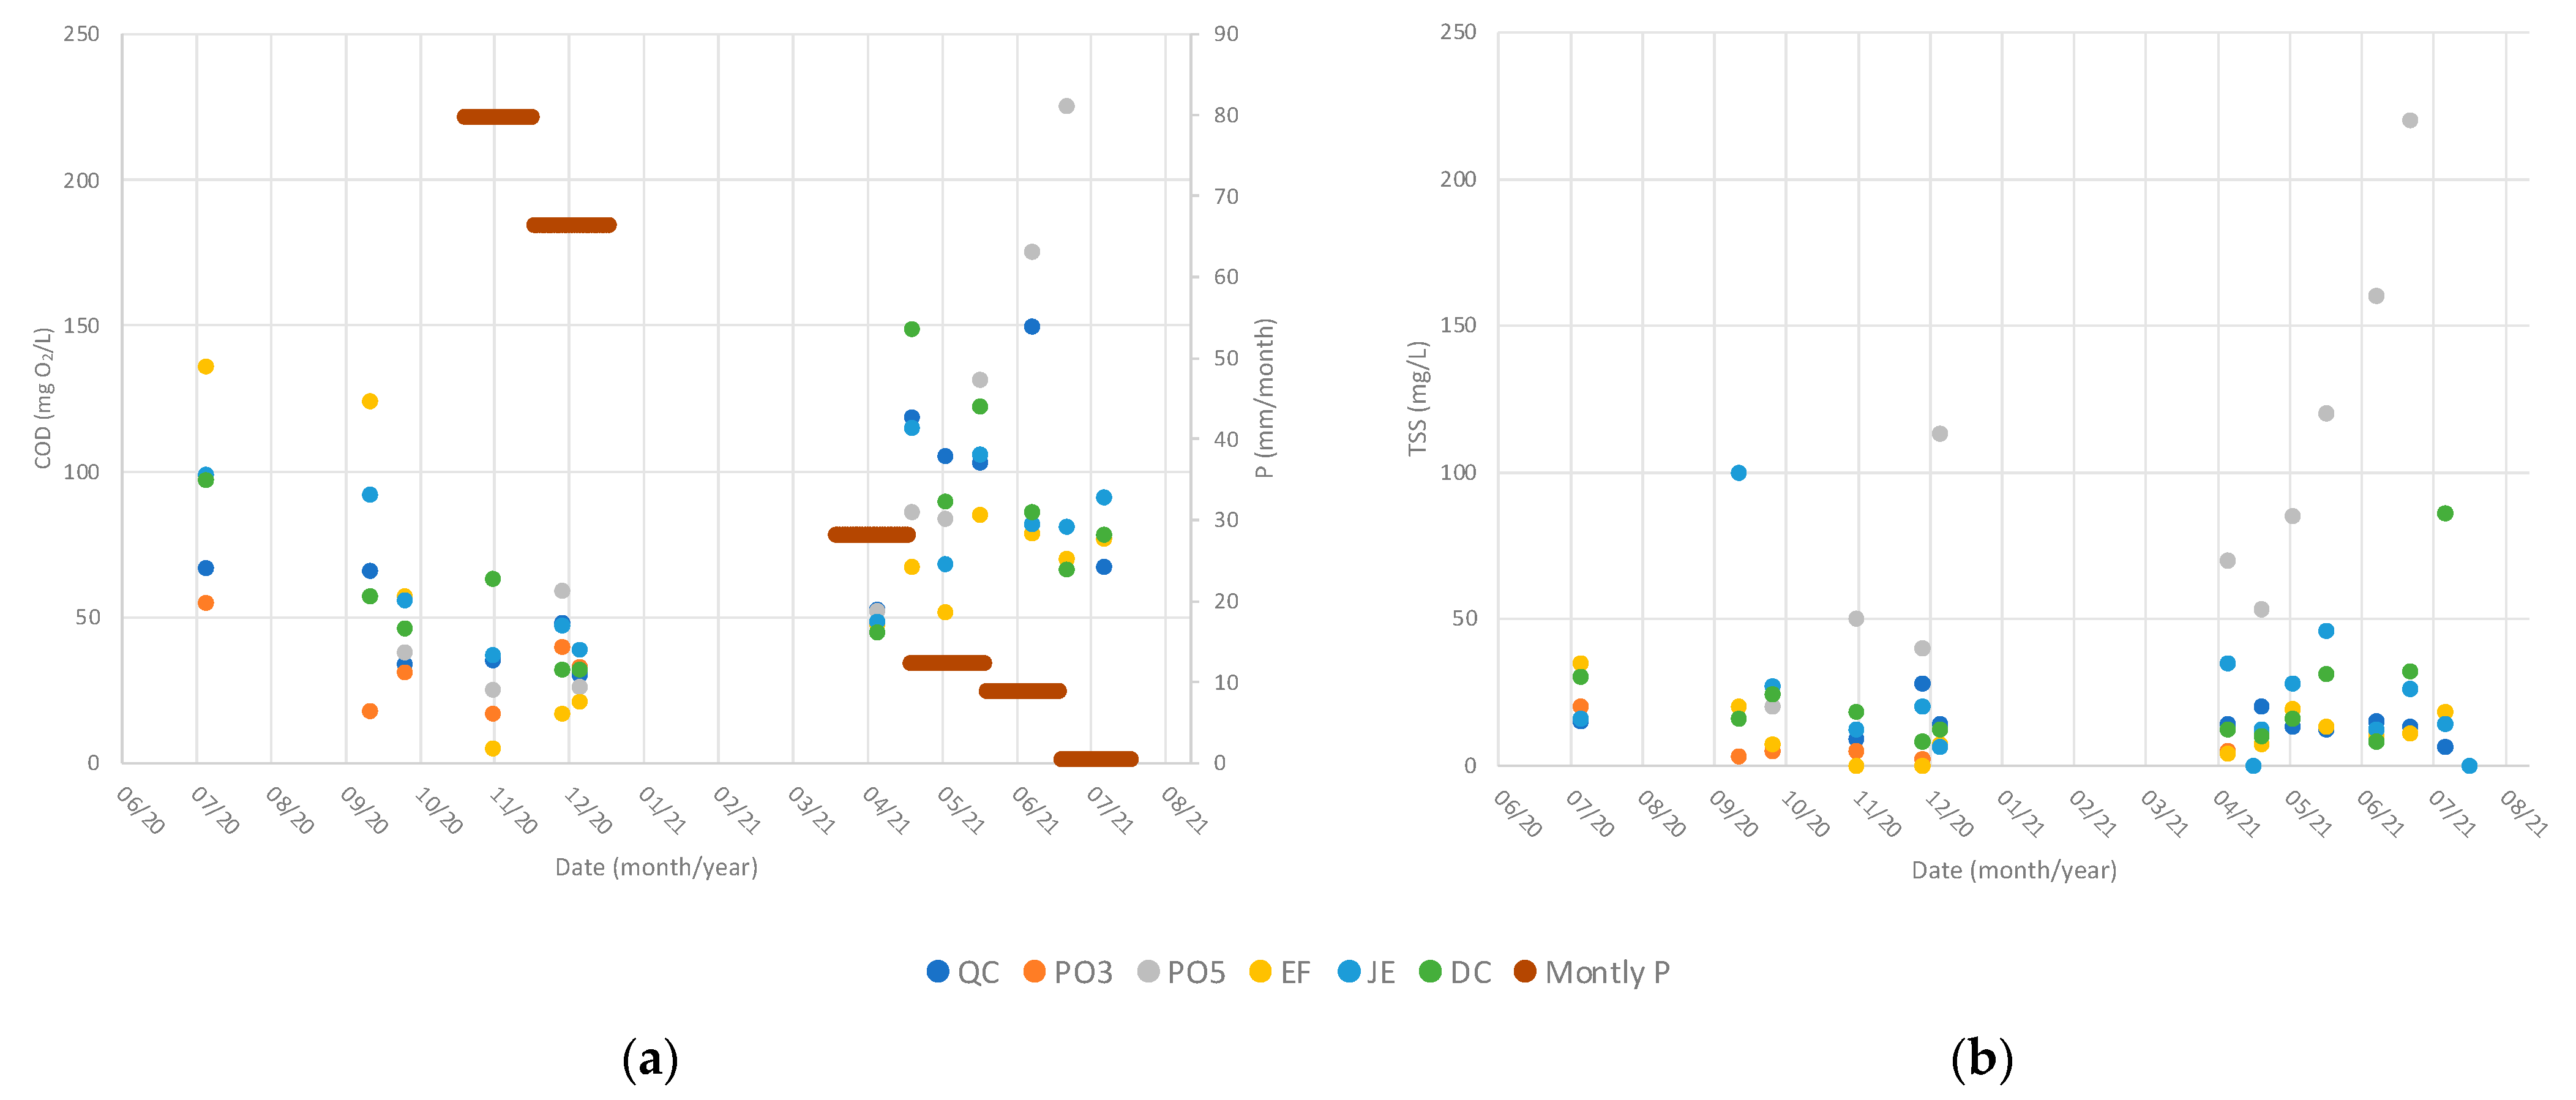
Average COD concentrations were similar between ponds, but concentrations seemed to decrease towards the winter and increase towards the summer, as can be observed in Figure 4a). Precipitation data was only available from November 2020 onwards, as such analysis was only made for the last year of sampling. In this period the higher precipitation levels in November and December 2020 are in line with the lower COD concentrations (5–63 mg O2/L) observed in all ponds. The presence of animals that were observed in the area, such as ducks and birds, and the feeding by the visitors may also influence to some extent the organic loadings of the ponds [11].
Regarding TSS the large majority of the samples in all ponds had concentrations below 50 mg/L (Figure 4b) and average between 7 and 27 mg/L (Table 3). Pond PO5 was an exception, with an average TSS concentration of 93 mg/L. A steady increase in TSS was observed from 53 mg/L in May 2021 to 220 mg/L in 3 July 2021 (Figure 4b). This pond serves as a stormwater detention basin and its water is used for irrigation during the summer months. A decrease in the water level of the lake towards the summer of 2021 was observed, most likely due to irrigation. The last TSS sampling on 18 July could not be done since the water level was too low, with fish being visible at the surface. Sampling during low water levels would have probably drawn in bed sediments from the bottom of the pond, which might have increased suspended solids concentration.
3.3. Nutrients Analysis
Table 4 presents maximum, minimum, and average values of nitrate, ammonia, KN, and TP for ponds EF, JE, and DC in 2020 and 2021. Overall, pond DC showed average concentrations much higher than EF and JE. Ammonia was negligible in EF and JE but reached values up to 3 mg N/L in DC.
The higher concentrations of nitrogen forms in pond DC had already occurred in past years. In fact, the sampling of nitrate parameters in DC started in 2016 and showed an increase in organic N and ammonia between 2017 and 2019 (Figure 5). From 2017 to 2019 ammonia concentration varied with values above 10 mg N/L observed mostly in cooler months (October to March). From 2020 onwards the ammonia concentration dropped below 1 mg N/L, except for October 2021 where 2.94 mg N/L was observed.
Nitrate levels in pond DC remained below 1 mg N/L until the end of 2019, but a peak around 4.0 mg N/L was observed in February and June 2020 campaigns. After that concentration dropped below 2 mg N/L. It has been stated that major sources of N in urban lakes may be attributed to artificial impervious surfaces [41]. In the present study, other sources of N may also be considered, such as wastewater, as was reported in pond PO5, or groundwater.
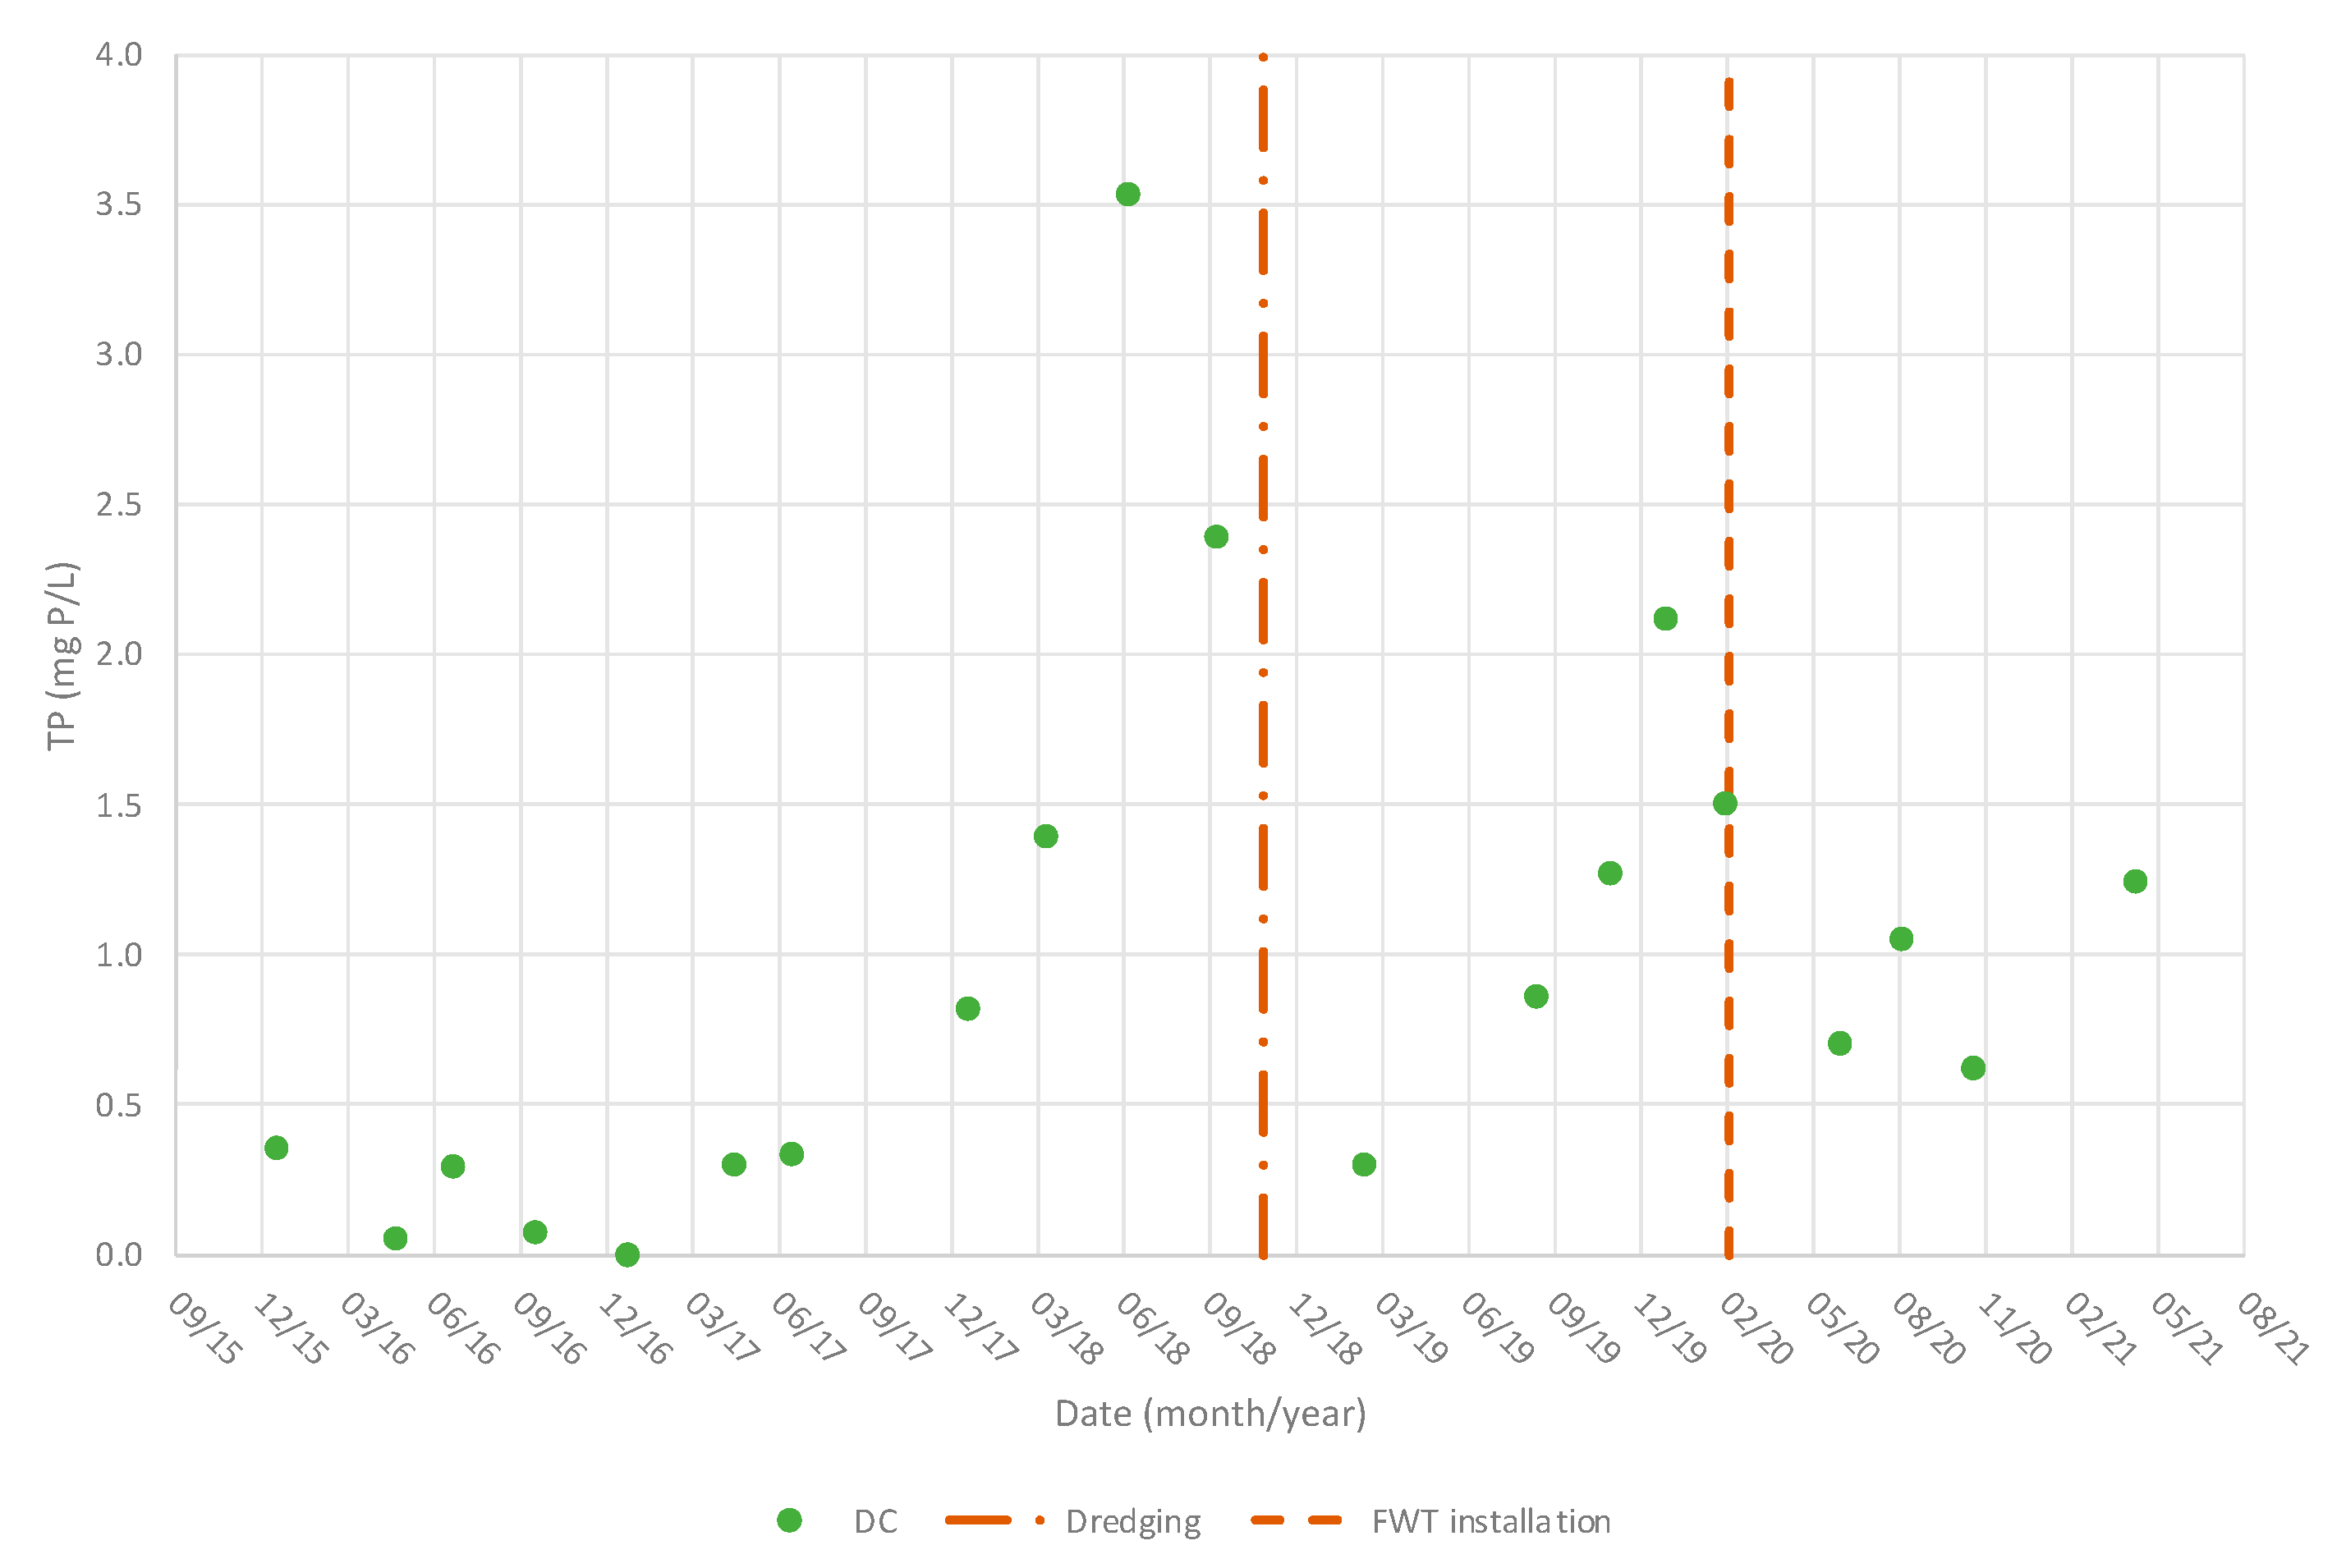
Between 2020 and 2021 TP had an average value in pond DC of 1.09 mg P/L, which was higher than the average values of 0.14 and 0.2 mg P/L obtained in ponds EF and JE, respectively. TSS and TP non-point source pollution in lakes may be attributed in part to green space [41]. Total phosphorus sampling in pond DC started in 2016 with values lower than 0.5 mg P/L. From December 2017 onwards TP concentrations in pond DC were higher than 0.5 mg P/L. Dredging in this pond in November 2018 was followed by a reduction in TP concentrations, which remained below 2.5 mg P/L after that (Figure 6).
The overall concentration variations observed in Figure 5 and Figure 6 seem to suggest that the introduction of FTW in March 2020 could have contributed to the reduction in nutrients in pond DC. However, the activities surrounding pond DC, namely people’s presence changed in the second trimester of 2020 with the lockdown imposed by the Portuguese government in March 2020 to counteract the COVID-19 pandemic. Therefore, a more frequent sampling would be necessary to assess the effect of FTW on water quality.
It is also worth noting that the algae bloom observed in June-July 2021 in pond DC (Figure 2) was not accompanied by relevant nutrient concentrations in the sampling that took place on April 2021 (<0.1 mg N/L for NH3-N, 0.86 mg N/L for NO3−-N, 3.78 mg N/L for KN and 1.24 mg P/L for TP).
All ponds had evidence of waterbird presence (visual confirmation during sampling and feces evidence), and in JE feeding the ducks is common practice among visitors with children. This is consistent with the nutrient presence in the ponds since waterbirds and their feeding are known to be sources of nutrients for waterbodies [14]. Nevertheless, ponds EF and JE had limited sampling (n = 3), as well as pond DC in the period before and after the algae bloom, and as such nutrient variations could have been missed.
3.4. Relevance of FTW for Water Quality Management
The FTW are considered a valuable phytoremediation tool and a nature-based solution that delivers a range of ecosystem services, such as biodiversity promotion and water quality enhancement, among others. They can be applied in different contexts dealing with fresh and saline water, and wastewater [42,43,44].
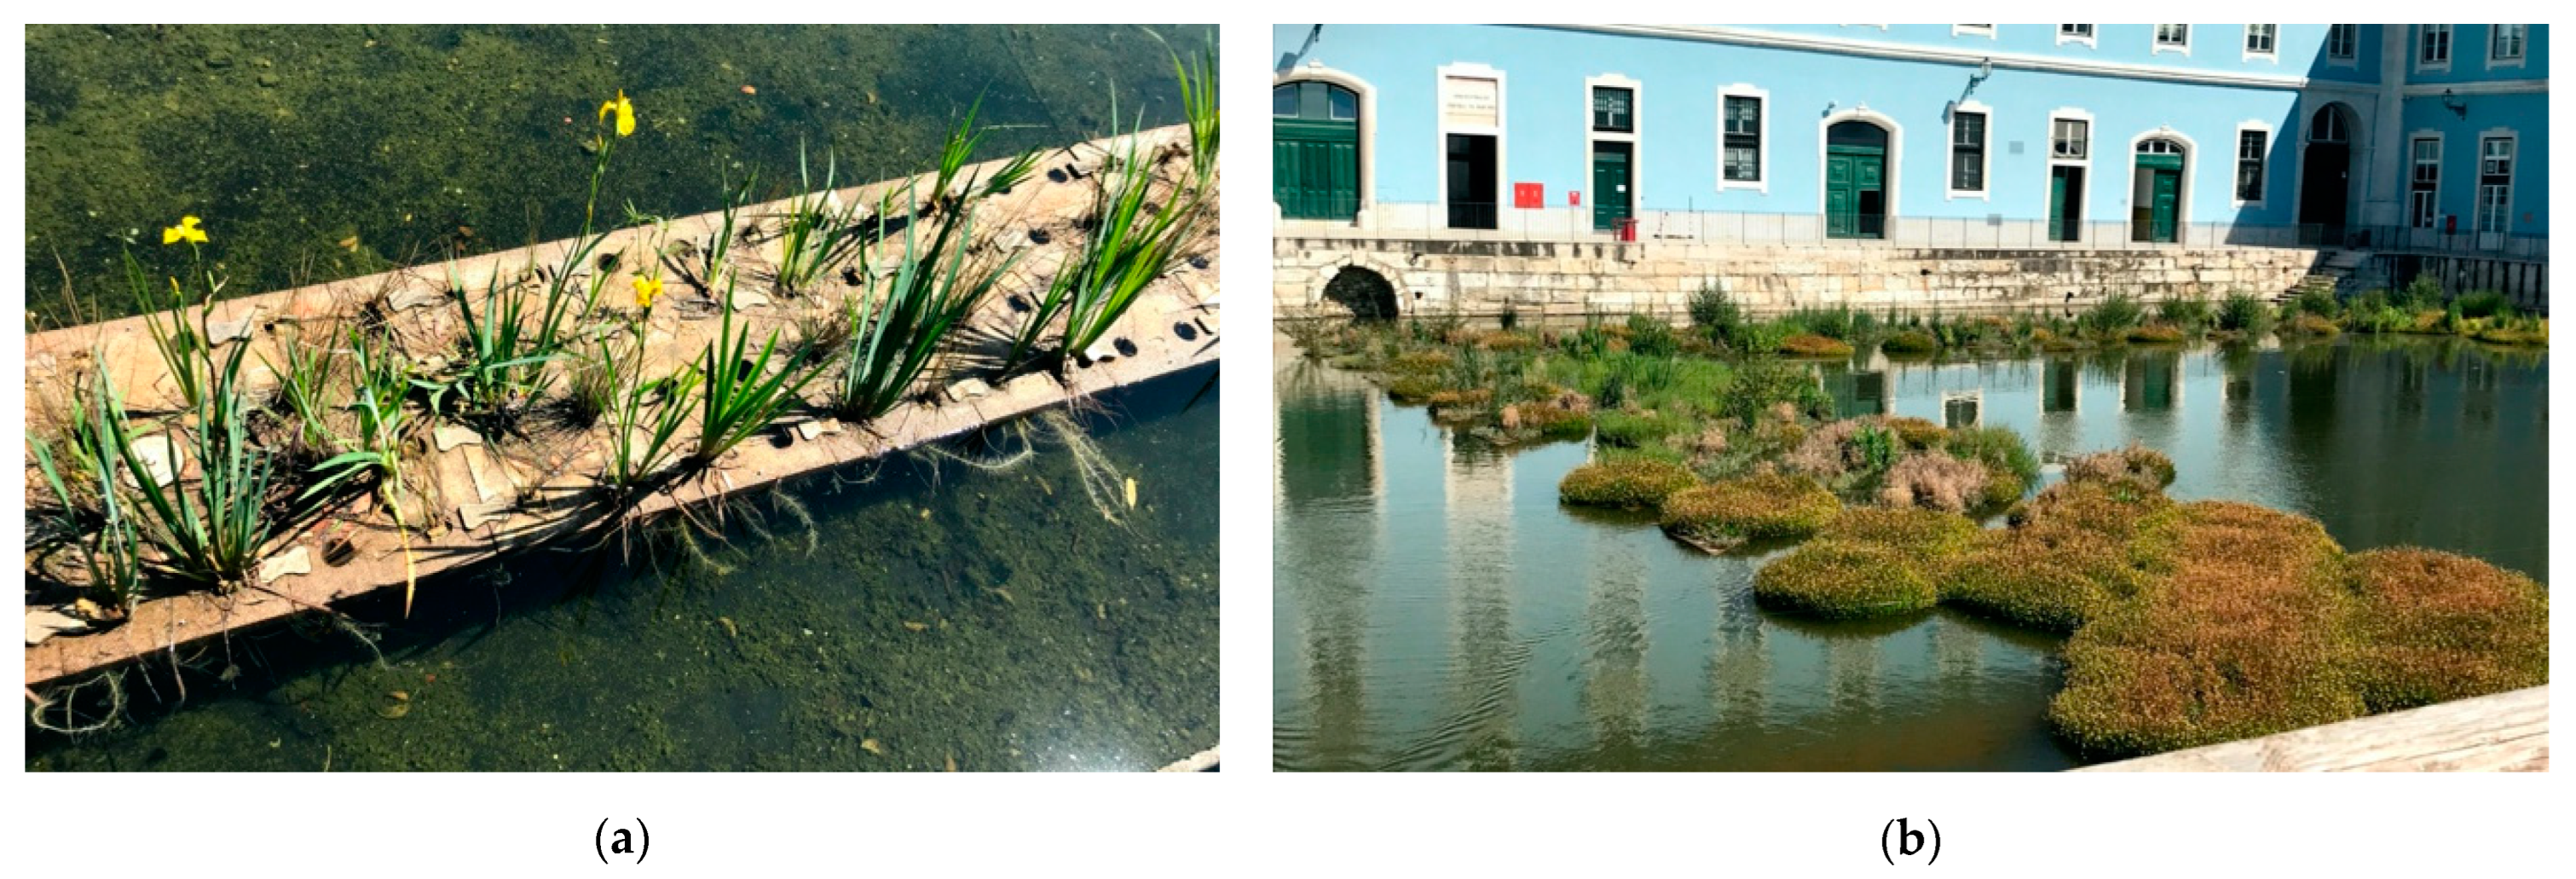
In the present paper, three of the ponds under study had FTW installed at the end of 2019/beginning of 2020. Ponds JE and EF had different plants from pond DC, since the later had higher salinity and therefore received native plants from the river Tagus estuary. Based on visual assessment, different growth rates were observed, with the FTW in pond DC growing significantly more from July to December 2020 when compared to the other 2 ponds, where little to no changes were observed in the same time period (Figure 7). In accordance with Lisbon Municipality’s FTW maintenance staff, waterbirds in ponds EF and JE kept feeding on plants from the cork platforms and so the plants had to be replaced multiple times, preventing their full development. If from one side FTW provide the creation of habitat for birds [43,44] they can also be damaged by them, especially new plantings, in certain circumstances [45].
Given the reduced sampling at ponds EF and JE prior to FTW installation, it is not possible to fully assess the contribution of FTW to water quality improvement. Nevertheless, it is clear that if plant development is achieved the overall aesthetics of the area can improve. An adequate plant selection is therefore essential so that the system is adapted to the local environmental conditions and fauna. For example, the plants used in DC are halophytes, typically from saline and brackish environments, and have also been applied in FTW in port marina environment, although the establishment of H. portucaloides was not so successful as Sarcocornia spp. [42]. Another application of S. fruticosa, with phytoremediation purposes, was considered for highly saline wastewater treatment with constructed wetlands, where it has shown high resilience [46]. Concerning the plants used in JE and EF, these are commonly used in FTW applied to urban surface waters, eutrophic waters, and different typologies of wastewater, although not so common is the use of Alisma [45,47,48]. Dredging and sediment removal from the bottom of the lakes can be implemented to control nutrient accumulation in sediments [49]. This action performed in pond DC could have contributed to a reduction in total phosphorus concentrations, but an increase after that was also observed (Figure 6). Therefore, further measures are required, and control of waterbird populations could be relevant to assess in the future, given the contribution that these species can bring to increase nutrients in water bodies [12]. In addition, feeding waterbirds in parks should be discouraged, through adequate signaling, where nutrients in ponds need control.
Concerning the overall pond management, there are already some guidelines to support different approaches, although raising awareness will be always necessary [50]. Management actions may include planned unmanaged areas to maintain biodiversity and heterogenous communities within the landscape [51].
4. Conclusions
Monitoring of six urban ponds revealed that concentrations of nutrients and organic matter were present in the water most likely resulting from leaf litter that decomposes in water, surface runoff, bird populations that gather in these places where they are fed by visitors, and in one case also from unknown sewage discharge. Nevertheless, the limitations of our study include a limited number of sampling events.
The pond DC, located near river Tagus and surrounded by impervious areas, exhibited a different behavior, with nutrient contents higher than the remaining ponds. Nevertheless, the lower sampling frequency of nutrients in the remaining ponds prevented a more extensive analysis. The installation of FTW might have contributed to improving water quality in pond DC, but was inconclusive in the two other ponds where they were installed (JE and EF), not only due to the lower sampling frequency but also since a full development of the plants was not possible. Dredging of pond DC was followed by nutrient concentration reduction, suggesting that dredging and sediment removal might be necessary as a complementary measure to improve water quality in urban ponds. The nutrient content reduction should be the priority action for all the ponds before pursuing other remediation techniques. Being these ponds integrated into leisure areas it would be important to assess the water quality on a regular basis, through a monitoring program, for a more strategic and sustainable management. Also, it would be important to infer the real benefits of the FTW in this context, in order to consider them to be replicated in other urban ponds.
Author Contributions
Conceptualization, A.G.; Methodology, A.G., A.R.; Formal Analysis, A.G., A.R.; Investigation, A.G., A.R.; Data Curation, A.G., A.R; Writing—Original Draft Preparation, A.G., A.R., C.S.C.C., P.T.; Writing—Review & Editing, A.G., A.R., C.S.C.C., P.T.; Supervision, A.G.; Project Administration, A.G.; Funding Acquisition, A.G. All authors have read and agreed to the published version of the manuscript.
Funding
This research was supported by TWIST Project, funded by Interreg SUDOE Programme (Grant number SOE2/P1/E0506).
Institutional Review Board Statement
Not applicable.
Informed Consent Statement
Not applicable.
Acknowledgments
Calheiros C. is thankful to FCT—Fundação para Ciência e Tecnologia within the scope of UIDB/04423/2020 and UIDP/04423/2020. The authors also acknowledge the support of Eng. Fernando Santos from Lisbon Municipality with information regarding pond maintenance.
Conflicts of Interest
The authors declare no conflict of interest.
References
- Martínez-Arroyo, A.; Jáuregui, E. On the environmental role of urban lakes in Mexico City. Urban Ecosyst. 2000, 4, 145–166. [Google Scholar] [CrossRef]
- Persson, J. Urban Lakes And Ponds. In Encyclopedia of Lakes and Reservoirs; Bengtsson, L., Herschy, R.W., Fairbridge, R.W., Eds.; Springer: Dordrecht, The Netherlands, 2012. [Google Scholar] [CrossRef]
- Bolund, P.; Hunhammar, S. Ecosystem services in urban areas. Ecol. Econ. 1999, 29, 293–301. [Google Scholar] [CrossRef]
- Robitu, M.; Musy, M.; Inard, C.; Groleau, D. Modeling the influence of vegetation and water pond on urban microclimate. Sol. Energy 2006, 80, 435–447. [Google Scholar] [CrossRef]
- Gledhill, D.G.; James, P. Socio-economic variables as indicators of pond conservation value in an urban landscape. Urban Ecosyst. 2012, 15, 849–861. [Google Scholar] [CrossRef]
- Oertli, B.; Parris, K.M. Review: Toward management of urban ponds for freshwater biodiversity. Ecosphere 2019, 10, e02810. [Google Scholar] [CrossRef] [Green Version]
- Céréghino, R.; Boix, D.; Cauchie, H.-M.; Martens, K.; Oertli, B. The ecological role of ponds in a changing world. Hydrobiologia 2013, 723, 1–6. [Google Scholar] [CrossRef] [Green Version]
- Bennion, H.; Smith, M.A. Variability in the water chemistry of shallow ponds in southeast England, with special reference to the seasonality of nutrients and implications for modelling trophic status. Hydrobiologia 2000, 436, 145–158. [Google Scholar] [CrossRef]
- Sharip, Z.; Mohamad, M.F. Microbial Contamination in Urban Tropical Lentic Waterbodies and Ponds along an Urbanization Gradient, Pertanika. J. Trop. Agric. Sci. 2019, 42, 165–184. [Google Scholar]
- World Health Organization. Guidelines for Safe Recreational Water Environments. Volume 1: Coastal and fresh Waters; World Health Organization: Geneve, Switzerland, 2003. [Google Scholar]
- Ferreira, V.; Magalh, R.; Teixeira, P.; Maria, P.; Castro, L.; Sousa, C.; Calheiros, C. Occurrence of Fecal Bacteria and Zoonotic Pathogens in Different Water Bodies: Supporting Water Quality Management. Water 2022, 14, 780. [Google Scholar] [CrossRef]
- Waajen, G.; van Oosterhout, F.; Douglas, G.; Lürling, M. Geo-engineering experiments in two urban ponds to control eutrophication. Water Res. 2016, 97, 69–82. [Google Scholar] [CrossRef]
- Turner, A.M.; Ruhl, N. Phosphorus Loadings Associated with a Park Tourist Attraction: Limnological Consequences of Feeding the Fish. Environ. Manag. 2007, 39, 526–533. [Google Scholar] [CrossRef]
- Scherer, N.M.; Gibbons, H.L.; Stoops, K.B.; Muller, M. Phosphorus Loading of an Urban Lake by Bird Droppings. Lake Reserv. Manag. 1995, 11, 317–327. [Google Scholar] [CrossRef]
- Daniel, T.C.; Wendt, R.C.; McGuire, P.E.; Stoffel, D. Nonpoint Source Loading Rates From Selected Land Uses. J. Am. Water Resour. Assoc. 1982, 18, 117–120. [Google Scholar] [CrossRef]
- Zhao, J.-W.; Shan, B.-Q.; Yin, C.-Q. Pollutant loads of surface runoff in Wuhan City Zoo, an urban tourist area. J. Environ. Sci. 2007, 19, 464–468. [Google Scholar] [CrossRef]
- Kunimatsu, T.; Sudo, M.; Kawachi, T. Loading rates of nutrients discharging from a golf course and a neighboring forested basin. Water Sci. Technol. 1999, 39, 99–107. [Google Scholar] [CrossRef]
- Toor, G.S.; Occhipinti, M.L.; Yang, Y.-Y.; Majcherek, T.; Haver, D.; Oki, L. Managing urban runoff in residential neighborhoods: Nitrogen and phosphorus in lawn irrigation driven runoff. PLoS ONE 2017, 12, e0179151. [Google Scholar] [CrossRef] [Green Version]
- Reddy, K.R.; Fisher, M.M.; Wang, Y.; White, J.R.; James, R.T. Potential Effects of Sediment Dredging on Internal Phosphorus Loading in a Shallow, Subtropical Lake. Lake Reserv. Manag. 2007, 23, 27–38. [Google Scholar] [CrossRef] [Green Version]
- Ramm, K.; Scheps, V. Phosphorus balance of a polytrophic shallow lake with the consideration of phosphorus release. Hydrobiologia 1997, 342, 43–53. [Google Scholar] [CrossRef]
- James, W.F.; Barko, J.W.; Eakin, H.L.; Sorge, P.W. Phosphorus Budget and Management Strategies for an Urban Wisconsin Lake. Lake Reserv. Manag. 2002, 18, 149–163. [Google Scholar] [CrossRef] [Green Version]
- Søndergaard, M.; Jensen, J.P.; Jeppesen, E. Internal phosphorus loading in shallow Danish lakes. In Developments in Hydrobiologia; Walz, N., Nixdorf, B., Eds.; Springer: Dordrecht, The Netherlands, 1999; Volume 143, pp. 408–409. [Google Scholar] [CrossRef]
- Reddy, K.R.; Fisher, M.M.; Ivanoff, D. Resuspension and Diffusive Flux of Nitrogen and Phosphorus in a Hypereutrophic Lake. J. Environ. Qual. 1996, 25, 363–371. [Google Scholar] [CrossRef]
- Christensen, V.G.; Maki, R.P.; Stelzer, E.A.; Norland, J.E.; Khan, E. Phytoplankton community and algal toxicity at a recurring bloom in Sullivan Bay, Kabetogama Lake, Minnesota, USA. Sci. Rep. 2019, 9, 16129. [Google Scholar] [CrossRef]
- Stoianov, I.; Chapra, S.; Maksimovic, C. A framework linking urban park land use with pond water quality. Urban Water 2000, 2, 47–62. [Google Scholar] [CrossRef]
- Lijklema, L. Nutrient dynamics in shallow lakes: Effects of changes in loading and role of sediment-water interactions. Hydrobiologia 1994, 275-276, 335–348. [Google Scholar] [CrossRef]
- Welch, E.B.; Cooke, G.D. Internal Phosphorus Loading in Shallow Lakes: Importance and Control. Lake Reserv. Manag. 2005, 21, 209–217. [Google Scholar] [CrossRef] [Green Version]
- Wetzel, R.G. Limnology, 3rd ed.; Academic Press: San Diego, CA, USA, 2001; pp. 395–488. [Google Scholar] [CrossRef]
- Dodkins, I.; Mendzil, A.F.; O’Dea, L. Enterprise Assist: Floating Treatment Wetlands (FTWs) in Water Treatment: Treatment Efficiency and Potential Benefits of Activated Carbon; Swansea University: Swansea, UK, 2014. [Google Scholar]
- O’Dell, K.M.; VanArman, J.; Welch, B.H.; Hill, S.D. Changes in Water Chemistry in a Macrophyte-Dominated Lake Before and After Herbicide Treatment. Lake Reserv. Manag. 1995, 11, 311–316. [Google Scholar] [CrossRef]
- Wagner, K.I.; Hauxwell, J.; Rasmussen, P.W.; Koshere, F.; Toshner, P.; Aron, K.; Helsel, D.R.; Provost, S.; Gansberg, M.; Masterson, J.; et al. Whole-lake Herbicide Treatments for Eurasian Watermilfoil in Four Wisconsin Lakes: Effects on Vegetation and Water Clarity. Lake Reserv. Manag. 2007, 23, 83–94. [Google Scholar] [CrossRef] [Green Version]
- Brookes, J.; Burch, M.; Gruützmacher, G.; Klitzke, S. Chapter 9. Remedial Measures. In Toxic Cyanobacteria in Water: A Guide to Their Public Health Consequences, Monitoring and Management; Chorus, I., Bartram, J., Eds.; CRC Press: London, UK, 1999. [Google Scholar]
- Oberholster, P.J.; Botha, A.; Cloete, T.E. Toxic cyanobacterial blooms in a shallow, artificially mixed urban lake in Colorado, USA. Lakes Reserv. Sci. Policy Manag. Sustain. Use 2006, 11, 111–123. [Google Scholar] [CrossRef]
- Rosińska, J.; Kozak, A.; Dondajewska, R.; Gołdyn, R. Cyanobacteria blooms before and during the restoration process of a shallow urban lake. J. Environ. Manag. 2017, 198, 340–347. [Google Scholar] [CrossRef]
- Shan, M.; Wang, Y.; Xue, S. Study on bioremediation of eutrophic lake. J. Environ. Sci. 2009, 21, S16–S18. [Google Scholar] [CrossRef]
- APHA-AWWA-WPCF. Standard Methods for the Examination of Water and Wastewater, 19th ed.; American Public Health Association/American Water Works Association/Water Pollution Control Federation: Washington, DC, USA, 1995. [Google Scholar]
- Composites, A.C. Technical bulletin Cork Floating Island®, 2018. ACC.851. 2018. Available online: https://amorimcorkcomposites.com/media/5627/tb-cork-floating-island.pdf (accessed on 1 June 2022).
- Ravikumar, P.; Prakash, K.L.; Somashekar, R.K. Evaluation of water quality using geochemical modeling in the Bellary Nala Command area, Belgaum district, Karnataka State, India. Carbonates Evaporites 2013, 28, 365–381. [Google Scholar] [CrossRef]
- Figueiredo, A.; Amaral, L.; Pacheco, J. Assessment for which tide level occurs saltwater intrusion in a sewer network. Case study: Barreiro/Moita WWTP, Portugal. Water Pract. Technol. 2020, 15, 723–733. [Google Scholar] [CrossRef]
- Bhat, M.M.; Yazdani, T.; Narain, K.; Yunus, M.; Shukla, R.N. Water Quality Status of Some Urban Ponds of Lucknow, Uttar Pradesh. J. Wetl. Ecol. 1970, 2, 67–73. [Google Scholar] [CrossRef] [Green Version]
- Jia, Z.; Chang, X.; Duan, T.; Wang, X.; Wei, T.; Li, Y. Water quality responses to rainfall and surrounding land uses in urban lakes. J. Environ. Manag. 2021, 298, 113514. [Google Scholar] [CrossRef]
- Calheiros, C.S.C.; Carecho, J.; Tomasino, M.P.; Almeida, C.M.R.; Mucha, A.P. Floating Wetland Islands Implementation and Biodiversity Assessment in a Port Marina. Water 2020, 12, 3273. [Google Scholar] [CrossRef]
- Pavlineri, N.; Skoulikidis, N.T.; Tsihrintzis, V.A. Constructed Floating Wetlands: A review of research, design, operation and management aspects, and data meta-analysis. Chem. Eng. J. 2017, 308, 1120–1132. [Google Scholar] [CrossRef]
- Colares, G.; Dell’Osbel, N.; Wiesel, P.G.; Oliveira, G.A.; Lemos, P.H.Z.; da Silva, F.P.; Lutterbeck, C.A.; Kist, L.T.; Machado, L. Floating treatment wetlands: A review and bibliometric analysis. Sci. Total Environ. 2020, 714, 136776. [Google Scholar] [CrossRef]
- Headley, T.; Tanner, C. Application of Floating Wetlands for Enhanced Stormwater Treatment: A Review; National Institute of Water & Atmospheric Research Ltd: Hamilton, New Zealand, 2006. [Google Scholar]
- Calheiros, C.S.C.; Silva, G.; Quitério, P.V.B.; Crispim, L.F.C.; Brix, H.; Moura, S.C.; Castro, P.M.L. Toxicity of High Salinity Tannery Wastewater and Effects on Constructed Wetland Plants. Int. J. Phytoremediation 2012, 14, 669–680. [Google Scholar] [CrossRef]
- Barco, A.; Bona, S.; Borin, M. Plant species for floating treatment wetlands: A decade of experiments in North Italy. Sci. Total Environ. 2021, 751, 141666. [Google Scholar] [CrossRef] [PubMed]
- Kadlec, R.H.; Wallace, S.D. Treatment Wetlands, 2nd ed.; CRC Press: Boca Raton, FL, USA, 2009. [Google Scholar]
- Zhang, S.; Zhou, Q.; Xu, D.; Lin, J.; Cheng, S.; Wu, Z. Effects of sediment dredging on water quality and zooplankton community structure in a shallow of eutrophic lake. J. Environ. Sci. 2010, 22, 218–224. [Google Scholar] [CrossRef]
- Lloyd, P.; Alexander, P. Wetlands Watch. A Field Guide for Monitoring Wetlands in the Southern Section of the Murray-Darling Basin; Speciality Press: Albury, NSW, Australia, 2002. [Google Scholar]
- Suski, J.G.; Swan, C.M.; Salice, C.J.; Wahl, C.F. Effects of pond management on biodiversity patterns and community structure of zooplankton in urban environments. Sci. Total Environ. 2018, 619–620, 1441–1450. [Google Scholar] [CrossRef]
Figure 1.
Urban ponds monitored in Lisbon: (a) Quinta das Conchas (QC), (b) Parque Oeste 3 (PO3), (c) Parque Oeste 5 (PO5), (d) Jardim da Estrela (JE), (e) Estufa Fria (EF) and (f) Doca da Caldeirinha (DC).
Figure 1.
Urban ponds monitored in Lisbon: (a) Quinta das Conchas (QC), (b) Parque Oeste 3 (PO3), (c) Parque Oeste 5 (PO5), (d) Jardim da Estrela (JE), (e) Estufa Fria (EF) and (f) Doca da Caldeirinha (DC).

Figure 2.
Algal bloom in the pond Doca da Caldeirinha (DC) (3 July 2021).

Figure 3.
Chloride and sulfate concentration in the water pond sampled in Doca da Caldeirinha (DC), from January 2016 to October 2021.
Figure 3.
Chloride and sulfate concentration in the water pond sampled in Doca da Caldeirinha (DC), from January 2016 to October 2021.

Figure 4.
(a) Chemical oxygen demand (COD) and (b) Total suspended solids (TSS) concentrations in each pond water sampled and monthly precipitation (P) in Lisbon.
Figure 4.
(a) Chemical oxygen demand (COD) and (b) Total suspended solids (TSS) concentrations in each pond water sampled and monthly precipitation (P) in Lisbon.

Figure 5.
Nitrogen forms in water sampled in pond Doca da Caldeirinha (DC) from 2016 to 2021. (FTW: Floating treatment wetland).
Figure 5.
Nitrogen forms in water sampled in pond Doca da Caldeirinha (DC) from 2016 to 2021. (FTW: Floating treatment wetland).

Figure 6.
Total Phosphorus in water sampled in pond Doca da Caldeirinha (DC) from 2016 to 2021. Values below detection limit (0.13 mg P/L, n = 2) are not shown. (FTW: Floating treatment wetland).
Figure 6.
Total Phosphorus in water sampled in pond Doca da Caldeirinha (DC) from 2016 to 2021. Values below detection limit (0.13 mg P/L, n = 2) are not shown. (FTW: Floating treatment wetland).

Figure 7.
Photo taken in April 2021 showing plant growth differences in the floating treatment wetlands: (a) Estufa Fria (EF) and (b) Doca da Caldeirinha (DC).
Figure 7.
Photo taken in April 2021 showing plant growth differences in the floating treatment wetlands: (a) Estufa Fria (EF) and (b) Doca da Caldeirinha (DC).


Table 1.
Characteristics of six urban ponds under study.
| Pond | Surface Area (m2) | Volume (m3) | Water Sources | Coordinates |
|---|---|---|---|---|
| QC | 2500 | 1262 | GW | (38.76985, −9.15837) |
| PO3 | 565 | 450 | GW + PWS | (38.77816, −9.15005) |
| PO5 | 17000 | 17443 | SW + GW * | (38.78023, −9.15486) |
| JE | 465 | 252 | PWS | (38.71494, −9.15837) |
| EF | 3685 | 2011 | PWS | (38.72884, −9.15477) |
| DC | 2607 | 3650 | river Tagus (BW) | (38.70668, −9.13811) |
Note: Ponds: QC: Quinta das Conchas; PO3 and PO5: two ponds at Parque Oeste; JE: Jardim da Estrela; EF: Estufa Fria; DC: Doca da Caldeirinha. BW: brackish water; GW: groundwater; PWS: public water supply; SW: stormwater. * this pond receives occasional uncontrolled wastewater discharges from unknow origins.
Table 2.
Maximum, minimum and average values of temperature (T), pH, dissolved oxygen (DO) and electric conductivity (EC) in the sampled water from the ponds QC, PO3, PO5, JE, EF and DC in 2020 and 2021. (n = number of samples).
Table 2.
Maximum, minimum and average values of temperature (T), pH, dissolved oxygen (DO) and electric conductivity (EC) in the sampled water from the ponds QC, PO3, PO5, JE, EF and DC in 2020 and 2021. (n = number of samples).
| Parameter | QC | PO3 | PO5 | JE | EF | DC | |
|---|---|---|---|---|---|---|---|
| T | max | 23.7 | 19.4 | 22.8 | 24.5 | 26.4 | 23.7 |
| (°C) | min | 13.8 | 14.3 | 13.5 | 13.4 | 15.5 | 15.4 |
| average | 18.9 | 17.4 | 18.6 | 18.3 | 20.6 | 20.2 | |
| n | 13 | 6 | 10 | 12 | 13 | 13 | |
| pH | max | 9.2 | 8.9 | 9.3 | 8.4 | 9.8 | 9.4 |
| min | 8.0 | 8.0 | 8.0 | 7.4 | 8.0 | 7.0 | |
| average | 8.6 | 8.4 | 8.5 | 7.9 | 9.0 | 8.1 | |
| n | 14 | 7 | 10 | 13 | 14 | 16 | |
| DO | max | 10.1 | 12.0 | 12.3 | 10.6 | 12.5 | 15.2 |
| (mg/L) | min | 4.3 | 7.2 | 7.4 | 4.9 | 9.1 | 1.3 |
| average | 8.5 | 9.5 | 9.7 | 8.2 | 10.7 | 6.8 | |
| n | 13 | 7 | 10 | 13 | 13 | 13 | |
| EC | max | 1160 | 1058 | 610 | 407 | 459 | 2000 |
| (µS/cm) | min | 301 | 355 | 373 | 286 | 269 | 847 |
| average | 584 | 610 | 482 | 334 | 332 | 1255 | |
| n | 10 | 5 | 7 | 10 | 9 | 10 |
Note: QC: Quinta das Conchas; PO3 and PO5: two ponds at Parque Oeste; JE: Jardim da Estrela; EF: Estufa Fria; DC: Doca da Caldeirinha.
Table 3.
Maximum, minimum, and average values of biochemical oxygen demand (BOD5), chemical oxygen demand (COD), and total suspended solids (TSS) in the sampled water from the ponds QC, PO3, PO5, JE, EF and DC, in 2020 and 2021. (n = number of samples).
Table 3.
Maximum, minimum, and average values of biochemical oxygen demand (BOD5), chemical oxygen demand (COD), and total suspended solids (TSS) in the sampled water from the ponds QC, PO3, PO5, JE, EF and DC, in 2020 and 2021. (n = number of samples).
| Parameter | QC | PO3 | PO5 | JE | EF | DC | |
|---|---|---|---|---|---|---|---|
| BOD5 (mg O2/L) | max | nd | nd | nd | 14 | 20 | 24 |
| min | nd | nd | nd | 4 | 2 | 4 | |
| average | nd | nd | nd | 8 | 9 | 11 | |
| n | nd | nd | nd | 5 | 5 | 6 | |
| COD (mg O2/L) | max | 150 | 56 | 225 | 115 | 136 | 149 |
| min | 30 | 17 | 25 | 37 | 5 | 32 | |
| average | 73 | 36 | 90 | 74 | 64 | 74 | |
| n | 13 | 7 | 10 | 13 | 13 | 13 | |
| TSS (mg/L) | max | 28 | 20 | 220 | 100 | 35 | 86 |
| min | 6 | 2 | 20 | 6 | 4 | 8 | |
| average | 15 | 7 | 93 | 27 | 14 | 23 | |
| n | 13 | 7 | 10 | 13 | 11 | 13 |
Note: QC: Quinta das Conchas; PO3 and PO5: two ponds at Parque Oeste; JE: Jardim da Estrela; EF: Estufa Fria; DC: Doca da Caldeirinha. nd: not determined.
Table 4.
Maximum, minimum and average values of nitrate (NO3−-N), ammonia (NH3-N), Kjeldahl nitrogen (KN) and total phosphorus (TP) in the sampled water from the ponds EF, JE and DC. (n = number of samples).
Table 4.
Maximum, minimum and average values of nitrate (NO3−-N), ammonia (NH3-N), Kjeldahl nitrogen (KN) and total phosphorus (TP) in the sampled water from the ponds EF, JE and DC. (n = number of samples).
| Parameter | JE | EF | DC | |
|---|---|---|---|---|
| NO3−-N (mg N/L) | max | 1.24 | 1.35 | 4.20 |
| min | 0.33 | 0.33 | 0.86 | |
| average | 0.65 | 0.70 | 2.46 | |
| n | 4 | 4 | 5 | |
| NH3-N (mg N/L) | max | <dl (0.1) | 0.1 | 2.94 |
| min | <dl (0.1) | 0.1 | 0.12 | |
| average | - | 0.10 | 1.32 | |
| n | 5 | 5 | 6 | |
| KN (mg N/L) | max | 2.82 | 3.49 | 9.40 |
| min | 0.98 | 0.45 | 1.78 | |
| average | 1.50 | 1.69 | 4.46 | |
| n | 5 | 5 | 6 | |
| TP (mg P/L) | max | 0.34 | nd | 1.50 |
| min | 0.125 | nd | 0.62 | |
| average | 0.20 | nd | 1.09 | |
| n | 3 | nd | 6 |
Note: JE: Jardim da Estrela; EF: Estufa Fria; DC: Doca da Caldeirinha. dl: detection limit. nd: not determined.
Publisher’s Note: MDPI stays neutral with regard to jurisdictional claims in published maps and institutional affiliations. |
© 2022 by the authors. Licensee MDPI, Basel, Switzerland. This article is an open access article distributed under the terms and conditions of the Creative Commons Attribution (CC BY) license (https://creativecommons.org/licenses/by/4.0/).
Share and Cite
MDPI and ACS Style
Rodrigues, A.; Calheiros, C.S.C.; Teixeira, P.; Galvão, A. Water Quality Assessment of Urban Ponds and Remediation Proposals. Hydrology 2022, 9, 114. https://0-doi-org.brum.beds.ac.uk/10.3390/hydrology9070114
AMA Style
Rodrigues A, Calheiros CSC, Teixeira P, Galvão A. Water Quality Assessment of Urban Ponds and Remediation Proposals. Hydrology. 2022; 9(7):114. https://0-doi-org.brum.beds.ac.uk/10.3390/hydrology9070114
Chicago/Turabian StyleRodrigues, Andreia, Cristina Sousa Coutinho Calheiros, Pedro Teixeira, and Ana Galvão. 2022. "Water Quality Assessment of Urban Ponds and Remediation Proposals" Hydrology 9, no. 7: 114. https://0-doi-org.brum.beds.ac.uk/10.3390/hydrology9070114
Note that from the first issue of 2016, this journal uses article numbers instead of page numbers. See further details here.