
Drought Forecasting: A Review and Assessment of the Hybrid Techniques and Data Pre-Processing

 ,
,  ,
,  ,
,  and
and
Abstract
:1. Introduction
2. Drought
- Hydrological (water supplies are dwindling);
- Meteorological (shortage of rainfall);
- Agricultural (soil moisture deficiency);
- Groundwater (decreased levels, discharge, and recharge of groundwater); and
- Socio-economic (an excess demand for commodities due to water scarcity), which is driven by several variables.
3. Data-Driven Modelling Strategies
4. Machine Learning Algorithms
5. Data Pre-Processing
5.1. Normalisation
5.2. Cleaning
5.3. A Selecting Appropriate Descriptors
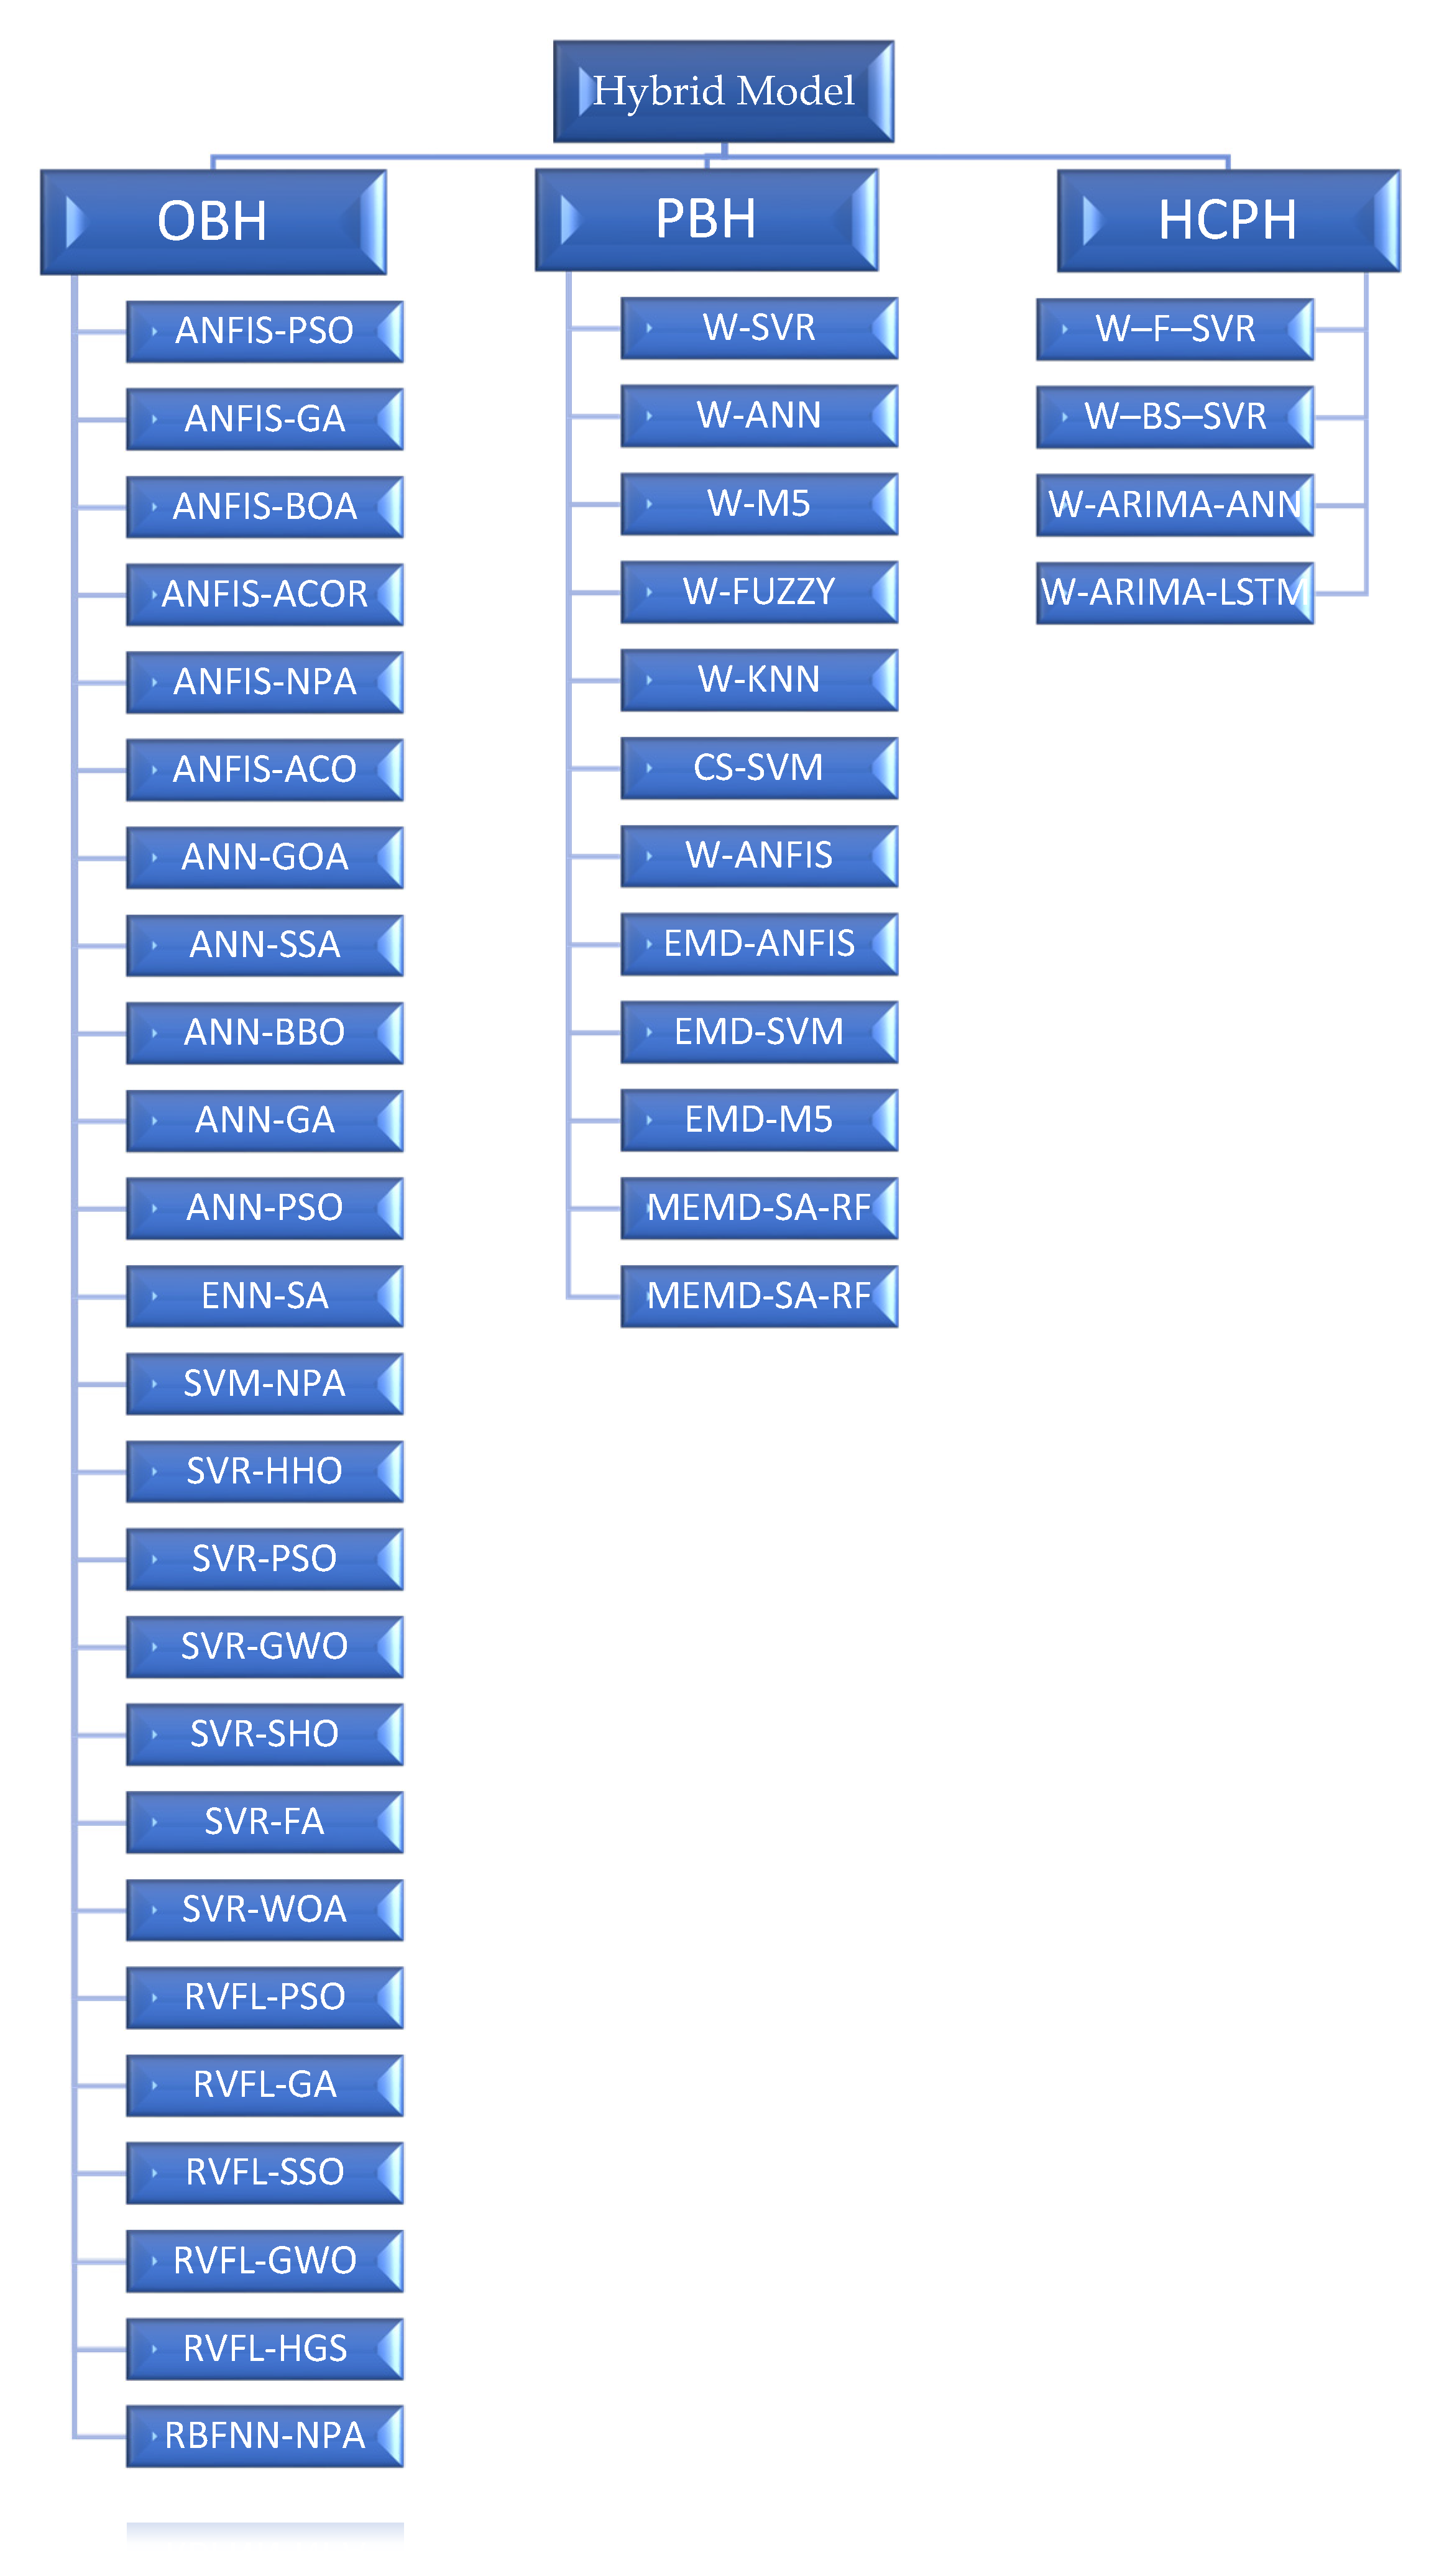
6. Hybrid Models
6.1. Pre-Processing-Based Hybrid Models (PBH)
6.2. Parameter Optimisation-Based Hybrid Models (OBH)
6.3. Hybridisation of Components Combination-Based with Preprocessing-Based Hybrid Models (HCPH)
- Numerous studies have demonstrated that combined metaheuristics with ML models outperform single-model approaches.
- Combining decomposition techniques with machine learning (ML) models may be used to increase the performance of ML models.
- The wavelet method has been proven to be successful in denoising raw data, increasing the results’ accuracy.

| Authors | Region | Size of Data | Model | Best Model | Performance Metric |
|---|---|---|---|---|---|
| Malik et al. [66] | India | 1901–2015 | SVR-HHO, SVR-PSO | SVR-HHO | RMSE, MAE, COC, NSE, WI |
| Taylan et al. [105] | Turkey | 1975–2010 | ANFIS, SVM, ANN, W-ANFIS, W-SVM, W-ANN | W-ANFIS | R2, RMSE, K–S test |
| Adnan et al. [32] | Bangladesh | 30 years | RVFL, RVFL- (PSO, GA, GWO, SSO, SSA, HGS) | RVFL-HGS | RMSE, MAE, NSE, R² |
| Aghelpour et al. [58] | Iran | 1960–2018 | SVM-DA, ARMA, RBFNN, SVM | SVM-DA | RMSE, NRMSE, WI, R, MAE |
| Pham et al. [35] | Taiwan | 1975–2015 | LSSVM1, SSA-LSSVM2, SSA-LSSVM3 | SSA-LSSVM3 | RMSE, MAE, R |
| Ahmadi et al. [54] | Iran | 1974–2018 | SVR, SVR-FA, SVR-WOA, W-SVR | W-SVR | RMSE, MAE, WI, NSE |
| Altunkaynak and Jalilzadnezamabad [25] | Turkey | 1960–2016 | Fuzzy, kNN SVM, W-Fuzzy, W-kNN, W-SVM | W-Fuzzy | MSE, CE, R2 |
| Wu et al. [40] | China | 1967–2017 | wavelet-ARIMA-LSTM, ARIMA, LSTM | wavelet-ARIMA-LSTM | RMSE, MAE, R2 |
| Malik et al. [65] | India | 1901–2015 | SVR–GWO, SVR–SHO | SVR–GWO | MAE, RMSE, NSE, WI, R |
| Danandeh Mehr et al. [106] | Turkey | 1971–2016 | WPGP, AR1, GP, RF | WPGP | NSE, RMSE |
| Banadkooki et al. [38] | Iran | 15 years | ANN–SSA, ANN–PSO, ANN-GA | ANN–SSA | NSE, RMSE, MAE |
| Xu et al. [107] | China | 1951–2017 | ARIMA, SVR, LSTM, ARIMA-SVR, LS-SVR, ARIMA-LSTM | ARIMA-LSTM | NSE, MSE, MAE, RMSE |
| Alquraish et al. [108] | Saudi Arabia | 1968- 2019 | ARIMA, ARIMA–GA, HMM HMM-GA, ARIMA–GA–ANN | ARIMA–GA–ANN | RMSE, R2, NSE, MAD |
| Nabipour et al. [20] | Iran | 1963–2017 | ANN-GOA, ANN-SSA, ANN-BBO, ANN-PSO, ANN | ANN-PSO | RMSE, R2 |
| Das et al. [62] | India | 1985–2013 | ANN, SVR, WPT -ANN, WPT-SVR | WPT -ANN | R2, RMSE, MAE |
| Xu et al. [109] | China | 1951–2017 | ARIMA, ARIMA–SVR | ARIMA–SVR | RMSE, MAE, R2, NSE |
| Danandeh Mehr et al. [99] | Turkey | 1971–2016 | ENN, ENN-SA | ENN-SA | NSE, MXL, RMSE, BIC |
| Khan et al. [31] | Malaysia | 1986–2016 | ANN, wavelet-ANN, Wavelet-ARIMA-ANN | Wavelet- ARIMA-ANN | R, RMSE, R2 |
| Mohamadi et al. [68] | Iran | 1980–2014 | ANFIS, ANFIS-NPA, MLP–NPA, RBFNN-NPA, SVM–NPA | ANFIS-NPA | NSE, RMSE, MAE, PBIAS, R2 |
| Özger et al. [67] | Turkey | 116 years | M5, ANFIS, SVM, W-ANFIS, W-SVM, W-M5, EMD-ANFIS, EMD-SVM, EMD-M5 | W-ANFIS | MSE, NSE, R2 |
| Aghelpour et al. [63] | Iran | 59 years | ANFIS, ANFIS-ACO, ANFIS-GA, ANFIS-PSO | ANFIS-ACO | RMSE, MAE, WI |
| Başakın et al. [27] | Turkey | 1900–2016 | ANFIS, EMD-ANFIS | EMD-ANFIS | MSE, NSE |
| Fung et al. [100] | Malaysia | 1976–2015 | W–BS–SVR, multi-input-W–F–SVR, weighted-W-F–SVR | Weighted-W–F–SVR | RMSE, R2, MAE |
| Kisi et al. [39] | Iran | 1985–2015 | ANFIS, ANFIS-PSO, ANFIS-GA, ANFIS-BOA, ANFIS-ACOR | ANFIS-PSO | RMSE, MAE, IA |
| Ali et al. [61] | Pakistan | 1981–2015 | MEMD-SA-RF, KRR, RF MEMD-SA-KRR | MEMD-SA-RF | MSE, R, RMSE |
| Zhang et al. [101] | China | 1979–2016 | ARIMA, W-ANN, SVM | ARIMA | R2, MSE, NSE, K–S |
| Khan et al. [53] | Malaysia | 1986–2016 | ANN, W-ANN | W-ANN | R, RMSE |
| Safavi et al. [64] | Iran | 1969–2009 | W-SVM, CS-SVM, SVM | W-SVM | R2, RMSE |
| Soh et al. [52] | Malaysia | 1976–2015 | Wavelet-ARIMA-ANN, W-ANFIS | Wavelet-ARIMA-ANN | R2adj, RMSE, MAE, NSE |
| Zhang et al. [22] | China | 1960–2010 | ARIMA, ANN, W-ANN | W-ANN | K–S, R2, Kendall rank correlation |
| Djerbouai and Souag-Gamane [37] | Algeria | 1936–2008 | ANN, W-ANN, ARIMA, SARIMA | W-ANN | NSE, RMSE, MAE |
| Deo et al. [110] | Australia | 1916–2012 | ELM, ANN, LSSVR, W-ANN, W-LSSVR, W-ELM | W-ELM | R2, WI, NSE, RMSE, MAE, Pdv |
| Belayneh et al. [23] | Ethiopia | 1970–2005 | ARIMA, ANN, SVR, W-SVR, W-ANN | W-ANN | RMSE, MAE, R2 |
7. Performance Metrics
- Root mean square error (RMSE) [112];
- Mean absolute error (MAE) [113];
- Determination coefficient (R2) [114];
- The correlation coefficient (R) [115];
- Nash-Sutcliffe-efficiency (NSE) [116];
- Mean percentage error (MPE) [117];
- Scatter index (SI) [118];
- Bayesian information criterion (BIC) and Akaike information criterion (AIC) [119];
- Absolute average deviation (AAD) [120].
7.1. Mean Absolute Error
7.2. Root Mean Squared Error
7.3. Determination Coefficient
7.4. Nash-Sutcliffe Efficiency
7.5. Mean Percentage Error (MPE)
7.6. Scatter Index (SI)
7.7. Bayesian Information Criterion (BIC) and Akaike Information Criterion (AIC)
7.8. Absolute Average Deviation (AAD)
8. Future Research
- Using various data pre-treatment techniques, such as singular spectrum analysis (SSA) and empirical mode decomposition (EMD).
- It is suggested to employ a multivariate strategy.
- The selection of input variables is critical and influences the performance and accuracy of a model’s output. As a result, it is recommended that more efforts should be put into determining the optimal input variable combination scenario. Hence, it is also recommended that other methods should be used to determine the inputs, such as feature selection methods, feature extraction methods, and dimensionality reduction methods.
- The use of hybrid metaheuristic algorithms and machine learning techniques in drought predicting has grown considerably in recent years. Nevertheless, there is still room for enhancement concerning drought prediction.
- Applying the hybridisation of pre-processing-based with parameter optimisation-based hybrid models (i.e., including both PBH and OBH).
9. Conclusions
Author Contributions
Funding
Conflicts of Interest
Abbreviations
| AAD | Absolute Average Deviation |
| ACO | Ant Colony Optimization |
| AIC | Akaike Information Criterion |
| ANFIS | Adaptive Neuro-Fuzzy Inference System |
| ANN | Artificial neural network |
| AR1 | Autoregressive |
| ARIMA | Autoregressive integrated moving average |
| ARMA | Autoregressive Moving Average |
| ARIMA–GA | Auto-regressive integrated moving average–genetic algorithm |
| BBO | Biogeography-Based Optimisation. |
| BIC | Bayesian Information Criterion |
| BOA | Butterfly Optimization Algorithm |
| BS | Boosting |
| CANFIS | Co-active neuro fuzzy inference system |
| CE | Coefficient of Efficiency |
| CS | Cuckoo Search |
| DA | Dragonfly Algorithm |
| EDI | Effective Drought Index |
| ELM | Extreme learning machine |
| EMD | Empirical Mode Decomposition |
| ENN | Elman Neural Network |
| F | Fuzzy |
| FA | Firefly Algorithm |
| GA | Genetic Algorithm |
| GOA | Grasshopper Optimisation Algorithm. |
| GP | Genetic programming |
| GRI | Groundwater Resource Index |
| GWO | Grey Wolf Optimizer |
| HGS | Hunger Games Search algorithm |
| HHO | Harris Hawks Optimization |
| HMM–GA | Hidden Markov model–genetic algorithm |
| IA | Index of Agreement |
| KA | Krill Algorithm |
| kNN | k- Nearest Neighbour |
| KRR | Kernel Ridge Regression |
| K–S | Kolmogorov–Smirnov |
| LSSVM | Least Square Support Vector Machine |
| LSSVM1 | LSSVM based model using antecedent SPI as input |
| LSSVR | Least squares support vector regression |
| LSTM | Long Short-Term Memory |
| LS-SVR | Least square- Support Vector Regression |
| M5 | Model Tree |
| MAE | Mean Absolute Error |
| MAD | Mean absolute deviation |
| MEMD | Multivariate Empirical Mode Decomposition |
| MLP | Multilayer Perceptron |
| MLR | Multiple linear regression |
| MPE | Mean Percentage Error |
| MSPI | Multivariate Standardized Precipitation Index |
| MXL | Maximum Likelihood |
| NPA | Nomadic People Algorithm |
| NRMSE | Normalized Root Mean Squared Error |
| NSE | Nash-Sutcliffe coefficient of efficiency |
| Pdv | Percentage peak deviation |
| PBIAS | Percent Bias |
| PDSI | Palmer Drought Severity Index |
| PSO | Particle Swarm Optimisation |
| R | Correlation Coefficient |
| R2 | Coefficient of Determination |
| R2adj | Adjusted Coefficient of Determination |
| RBFNN | Radial Basis Function Neural Network |
| RDI | Reconnaissance drought index |
| RF | Random Forest |
| RMSE | Root Mean Square Error |
| RVFL | Random Vector Functional Link |
| SA | Simulated Annealing optimization algorithm. |
| SARIMA | Seasonal Autoregressive Integrated Moving Average |
| sc-PDSI | Self-calibrated Palmer Drought Severity Index |
| SHDI | Standardised Hydrological Drought Index. |
| SHO | Spotted Hyena Optimizer |
| SI | Scatter Index |
| SIAP | Standard Index of Annual Precipitation |
| SPEI | Standardized Precipitation Evapotranspiration Index |
| SPI | Standardized Precipitation Index |
| SSA | Singular spectrum analysis |
| SSA | Salp swarm algorithm |
| SSA-LSSVM2 | The LSSVM-based model coupling with SSA using antecedent SPI as input. |
| SSA-LSSVM3 | The SSA-LSSVM-based model using antecedent accumulated monthly rainfall as input was developed and compared to SSALSSVM2. |
| SSO | Social Spider Optimization |
| SVM | Support Vector Machine |
| SVR | Support Vector Regression |
| SWSI | Standardized Water Storage Index |
| W | Wavelet |
| WANN | Wavelet Artificial Neural Network |
| W–BS–SVR | Wavelet–Boosting–Support Vector Regression |
| W–F–SVR | Wavelet–Fuzzy–Support Vector Regression |
| WI | Willmott’s Index |
| WOA | Whale Optimization Algorithm |
| WPGP | Wavelet packet-genetic programming |
| WPT | Wavelet Packet Transform |
| WSVM | Wavelet-Support Vector Machine |
References
- Jasim, A.I.; Awchi, T.A. Regional meteorological drought assessment in Iraq. Arab. J. Geosci. 2020, 13, 284. [Google Scholar] [CrossRef]
- Zhang, Q.; Li, Q.; Singh, V.P.; Shi, P.; Huang, Q.; Sun, P. Nonparametric Integrated Agrometeorological Drought Monitoring: Model Development and Application. J. Geophys. Res. Atmos. 2018, 123, 73–88. [Google Scholar] [CrossRef]
- Yan, N.; Wu, B.; Boken, V.K.; Chang, S.; Yang, L. A drought monitoring operational system for China using satellite data: Design and evaluation. Geomat. Nat. Hazards Risk 2014, 7, 264–277. [Google Scholar] [CrossRef]
- Wanders, N.; Van Lanen, H.A.J. Future discharge drought across climate regions around the world modelled with a synthetic hydrological modelling approach forced by three general circulation models. Nat. Hazards Earth Syst. Sci. 2015, 15, 487–504. [Google Scholar] [CrossRef] [Green Version]
- Mulualem, G.M.; Liou, Y.-A. Application of Artificial Neural Networks in Forecasting a Standardized Precipitation Evapotranspiration Index for the Upper Blue Nile Basin. Water 2020, 12, 643. [Google Scholar] [CrossRef] [Green Version]
- Dorjsuren, M.; Liou, Y.-A.; Cheng, C.-H. Time Series MODIS and in Situ Data Analysis for Mongolia Drought. Remote Sens. 2016, 8, 509. [Google Scholar] [CrossRef] [Green Version]
- Luo, L.; Apps, D.; Arcand, S.; Xu, H.; Pan, M.; Hoerling, M. Contribution of temperature and precipitation anomalies to the California drought during 2012–2015. Geophys. Res. Lett. 2017, 44, 3184–3192. [Google Scholar] [CrossRef]
- Sundararajan, K.; Garg, L.; Srinivasan, K.; Kashif Bashir, A.; Kaliappan, J.; Pattukandan Ganapathy, G.; Kumaran Selvaraj, S.; Meena, T. A Contemporary Review on Drought Modeling Using Machine Learning Approaches. Comput. Modeling Eng. Sci. 2021, 128, 447–487. [Google Scholar] [CrossRef]
- Park, S.; Im, J.; Han, D.; Rhee, J. Short-Term Forecasting of Satellite-Based Drought Indices Using Their Temporal Patterns and Numerical Model Output. Remote Sens. 2020, 12, 3499. [Google Scholar] [CrossRef]
- Yuan, X.-C.; Sun, X.; Lall, U.; Mi, Z.-F.; He, J.; Wei, Y.-M. China’s socioeconomic risk from extreme events in a changing climate: A hierarchical Bayesian model. Clim. Change 2016, 139, 169–181. [Google Scholar] [CrossRef]
- Tsutsui, H.; Sawada, Y.; Onuma, K.; Ito, H.; Koike, T. Drought Monitoring over West Africa Based on an Ecohydrological Simulation (2003–2018). Hydrology 2021, 8, 155. [Google Scholar] [CrossRef]
- Trenberth, K.E.; Dai, A.; van der Schrier, G.; Jones, P.D.; Barichivich, J.; Briffa, K.R.; Sheffield, J. Global warming and changes in drought. Nat. Clim. Change 2013, 4, 17–22. [Google Scholar] [CrossRef]
- Alsumaiei, A.A.; Alrashidi, M.S. Hydrometeorological Drought Forecasting in Hyper-Arid Climates Using Nonlinear Autoregressive Neural Networks. Water 2020, 12, 2611. [Google Scholar] [CrossRef]
- Zubaidi, S.L.; Dooley, J.; Alkhaddar, R.M.; Abdellatif, M.; Al-Bugharbee, H.; Ortega-Martorell, S. A Novel approach for predicting monthly water demand by combining singular spectrum analysis with neural networks. J. Hydrol. 2018, 561, 136–145. [Google Scholar] [CrossRef]
- Zubaidi, S.L.; Kot, P.; Alkhaddar, R.M.; Abdellatif, M.; Al-Bugharbee, H. Short-Term Water Demand Prediction in Residential Complexes: Case Study in Columbia City, USA. In Proceedings of the 2018 11th International Conference on Developments in eSystems Engineering (DeSE), Cambridge, UK, 2–5 September 2018; pp. 31–35. [Google Scholar] [CrossRef]
- Malik, A.; Kumar, A. Meteorological drought prediction using heuristic approaches based on effective drought index: A case study in Uttarakhand. Arab. J. Geosci. 2020, 13, 276. [Google Scholar] [CrossRef]
- Han, J.; Singh, V.P. Forecasting of droughts and tree mortality under global warming: A review of causative mechanisms and modeling methods. J. Water Clim. Change 2020, 11, 600–632. [Google Scholar] [CrossRef] [Green Version]
- Fung, K.F.; Huang, Y.F.; Koo, C.H.; Soh, Y.W. Drought forecasting: A review of modelling approaches 2007–2017. J. Water Clim. Change 2020, 11, 771–799. [Google Scholar] [CrossRef]
- Anshuka, A.; van Ogtrop, F.F.; Willem Vervoort, R. Drought forecasting through statistical models using standardised precipitation index: A systematic review and meta-regression analysis. Nat. Hazards 2019, 97, 955–977. [Google Scholar] [CrossRef]
- Nabipour, N.; Dehghani, M.; Mosavi, A.; Shamshirband, S. Short-Term Hydrological Drought Forecasting Based on Different Nature-Inspired Optimization Algorithms Hybridized With Artificial Neural Networks. IEEE Access 2020, 8, 15210–15222. [Google Scholar] [CrossRef]
- Agana, N.A.; Homaifar, A. EMD-Based Predictive Deep Belief Network for Time Series Prediction: An Application to Drought Forecasting. Hydrology 2018, 5, 18. [Google Scholar] [CrossRef] [Green Version]
- Zhang, Y.; Li, W.; Chen, Q.; Pu, X.; Xiang, L. Multi-models for SPI drought forecasting in the north of Haihe River Basin, China. Stoch. Environ. Res. Risk Assess. 2017, 31, 2471–2481. [Google Scholar] [CrossRef]
- Belayneh, A.; Adamowski, J.; Khalil, B. Short-term SPI drought forecasting in the Awash River Basin in Ethiopia using wavelet transforms and machine learning methods. Sustain. Water Resour. Manag. 2015, 2, 87–101. [Google Scholar] [CrossRef]
- Belayneh, A.; Adamowski, J. Standard Precipitation Index Drought Forecasting Using Neural Networks, Wavelet Neural Networks, and Support Vector Regression. Appl. Comput. Intell. Soft Comput. 2012, 2012, 1–13. [Google Scholar] [CrossRef]
- Altunkaynak, A.; Jalilzadnezamabad, A. Extended lead time accurate forecasting of palmer drought severity index using hybrid wavelet-fuzzy and machine learning techniques. J. Hydrol. 2021, 601, 126619. [Google Scholar] [CrossRef]
- Dikshit, A.; Pradhan, B.; Alamri, A.M. Short-Term Spatio-Temporal Drought Forecasting Using Random Forests Model at New South Wales, Australia. Appl. Sci. 2020, 10, 4254. [Google Scholar] [CrossRef]
- Başakın, E.E.; Ekmekcioğlu, Ö.; Özger, M. Drought prediction using hybrid soft-computing methods for semi-arid region. Modeling Earth Syst. Environ. 2020, 7, 2363–2371. [Google Scholar] [CrossRef]
- Rozos, E.; Dimitriadis, P.; Bellos, V. Machine Learning in Assessing the Performance of Hydrological Models. Hydrology 2021, 9, 5. [Google Scholar] [CrossRef]
- Koutsoyiannis, D. Hydrologic persistence and the Hurst phenomenon. In Water Encyclopedia, Vol. 4, Surface and Agricultural Water; Lehr, J.H., Keeley, J.W., Lehr, J.K., Kingery, T.B., Eds.; John Wiley & Sons: Hoboken, NJ, USA, 2005; Chapter 1. [Google Scholar]
- Zubaidi, S.L.; Ortega-Martorell, S.; Kot, P.; Alkhaddar, R.M.; Abdellatif, M.; Gharghan, S.K.; Ahmed, M.S.; Hashim, K. A Method for Predicting Long-Term Municipal Water Demands Under Climate Change. Water Resour. Manag. 2020, 34, 1265–1279. [Google Scholar] [CrossRef]
- Khan, M.M.H.; Muhammad, N.S.; El-Shafie, A. Wavelet based hybrid ANN-ARIMA models for meteorological drought forecasting. J. Hydrol. 2020, 590, 125380. [Google Scholar] [CrossRef]
- Adnan, R.M.; Mostafa, R.R.; Islam, A.R.M.T.; Gorgij, A.D.; Kuriqi, A.; Kisi, O. Improving Drought Modeling Using Hybrid Random Vector Functional Link Methods. Water 2021, 13, 3379. [Google Scholar] [CrossRef]
- Hajirahimi, Z.; Khashei, M. Hybrid structures in time series modeling and forecasting: A review. Eng. Appl. Artif. Intell. 2019, 86, 83–106. [Google Scholar] [CrossRef]
- Hajirahimi, Z.; Khashei, M. Hybridization of hybrid structures for time series forecasting: A review. Artif. Intell. Rev. 2022. [Google Scholar] [CrossRef]
- Pham, Q.B.; Yang, T.-C.; Kuo, C.-M.; Tseng, H.-W.; Yu, P.-S. Coupling Singular Spectrum Analysis with Least Square Support Vector Machine to Improve Accuracy of SPI Drought Forecasting. Water Resour. Manag. 2021, 35, 847–868. [Google Scholar] [CrossRef]
- Mathivha, F.; Sigauke, C.; Chikoore, H.; Odiyo, J. Short-Term and Medium-Term Drought Forecasting Using Generalized Additive Models. Sustainability 2020, 12, 4006. [Google Scholar] [CrossRef]
- Djerbouai, S.; Souag-Gamane, D. Drought Forecasting Using Neural Networks, Wavelet Neural Networks, and Stochastic Models: Case of the Algerois Basin in North Algeria. Water Resour. Manag. 2016, 30, 2445–2464. [Google Scholar] [CrossRef]
- Banadkooki, F.B.; Singh, V.P.; Ehteram, M. Multi-timescale drought prediction using new hybrid artificial neural network models. Nat. Hazards 2021, 106, 2461–2478. [Google Scholar] [CrossRef]
- Kisi, O.; Docheshmeh Gorgij, A.; Zounemat-Kermani, M.; Mahdavi-Meymand, A.; Kim, S. Drought forecasting using novel heuristic methods in a semi-arid environment. J. Hydrol. 2019, 578, 124053. [Google Scholar] [CrossRef]
- Wu, X.; Zhou, J.; Yu, H.; Liu, D.; Xie, K.; Chen, Y.; Hu, J.; Sun, H.; Xing, F. The Development of a Hybrid Wavelet-ARIMA-LSTM Model for Precipitation Amounts and Drought Analysis. Atmosphere 2021, 12, 74. [Google Scholar] [CrossRef]
- Mishra, D.; Goswami, S.; Matin, S.; Sarup, J. Analyzing the extent of drought in the Rajasthan state of India using vegetation condition index and standardized precipitation index. Modeling Earth Syst. Environ. 2021, 8, 601–610. [Google Scholar] [CrossRef]
- Erhardt, T.M.; Czado, C. Standardized drought indices: A novel univariate and multivariate approach. J. R. Stat. Soc. Ser. C Appl. Stat. 2017, 67, 643–664. [Google Scholar] [CrossRef] [Green Version]
- Emadodin, I.; Reinsch, T.; Taube, F. Drought and Desertification in Iran. Hydrology 2019, 6, 66. [Google Scholar] [CrossRef] [Green Version]
- Nnaji, G.A.; Clark, C.J.; Chan-Hilton, A.B.; Huang, W. Drought prediction in Apalachicola–Chattahoochee–Flint River Basin using a semi-Markov model. Nat. Hazards 2016, 82, 267–297. [Google Scholar] [CrossRef]
- Zhang, R.; Chen, Z.Y.; Xu, L.J.; Ou, C.Q. Meteorological drought forecasting based on a statistical model with machine learning techniques in Shaanxi province, China. Sci. Total Environ. 2019, 665, 338–346. [Google Scholar] [CrossRef]
- Yihdego, Y.; Vaheddoost, B.; Al-Weshah, R.A. Drought indices and indicators revisited. Arab. J. Geosci. 2019, 12, 69. [Google Scholar] [CrossRef]
- Ali, M.; Deo, R.C.; Downs, N.J.; Maraseni, T. Multi-stage committee based extreme learning machine model incorporating the influence of climate parameters and seasonality on drought forecasting. Comput. Electron. Agric. 2018, 152, 149–165. [Google Scholar] [CrossRef]
- Ali, Z.; Hussain, I.; Faisal, M.; Nazir, H.M.; Hussain, T.; Shad, M.Y.; Mohamd Shoukry, A.; Hussain Gani, S. Forecasting Drought Using Multilayer Perceptron Artificial Neural Network Model. Adv. Meteorol. 2017, 2017, 5681308. [Google Scholar] [CrossRef]
- Kaur, A.; Sood, S.K. Cloud-Fog based framework for drought prediction and forecasting using artificial neural network and genetic algorithm. J. Exp. Theor. Artif. Intell. 2019, 32, 273–289. [Google Scholar] [CrossRef]
- Kaur, A.; Sood, S.K. Artificial Intelligence-Based Model For Drought Prediction and Forecasting. Comput. J. 2020, 63, 1704–1712. [Google Scholar] [CrossRef]
- Poornima, S.; Pushpalatha, M. Drought prediction based on SPI and SPEI with varying timescales using LSTM recurrent neural network. Soft Comput. 2019, 23, 8399–8412. [Google Scholar] [CrossRef]
- Soh, Y.W.; Koo, C.H.; Huang, Y.F.; Fung, K.F. Application of artificial intelligence models for the prediction of standardized precipitation evapotranspiration index (SPEI) at Langat River Basin, Malaysia. Comput. Electron. Agric. 2018, 144, 164–173. [Google Scholar] [CrossRef]
- Khan, M.; Muhammad, N.; El-Shafie, A. Wavelet-ANN versus ANN-Based Model for Hydrometeorological Drought Forecasting. Water 2018, 10, 998. [Google Scholar] [CrossRef] [Green Version]
- Ahmadi, F.; Mehdizadeh, S.; Mohammadi, B. Development of Bio-Inspired- and Wavelet-Based Hybrid Models for Reconnaissance Drought Index Modeling. Water Resour. Manag. 2021, 35, 4127–4147. [Google Scholar] [CrossRef]
- Shamshirband, S.; Hashemi, S.; Salimi, H.; Samadianfard, S.; Asadi, E.; Shadkani, S.; Kargar, K.; Mosavi, A.; Nabipour, N.; Chau, K.-W. Predicting Standardized Streamflow index for hydrological drought using machine learning models. Eng. Appl. Comput. Fluid Mech. 2020, 14, 339–350. [Google Scholar] [CrossRef]
- Tufaner, F.; Ozbeyaz, A. Estimation and easy calculation of the Palmer Drought Severity Index from the meteorological data by using the advanced machine learning algorithms. Environ. Monit. Assess. 2020, 192, 576. [Google Scholar] [CrossRef] [PubMed]
- Freitas, A.A.; Drumond, A.; Carvalho, V.S.B.; Reboita, M.S.; Silva, B.C.; Uvo, C.B. Drought Assessment in São Francisco River Basin, Brazil: Characterization through SPI and Associated Anomalous Climate Patterns. Atmosphere 2021, 13, 41. [Google Scholar] [CrossRef]
- Sun, X.; Lai, P.; Wang, S.; Song, L.; Ma, M.; Han, X. Monitoring of Extreme Agricultural Drought of the Past 20 Years in Southwest China Using GLDAS Soil Moisture. Remote Sens. 2022, 14, 1323. [Google Scholar] [CrossRef]
- Zhang, Z.; Zhang, Q.; Singh, V.P. Univariate streamflow forecasting using commonly used data-driven models: Literature review and case study. Hydrol. Sci. J. 2018, 63, 1091–1111. [Google Scholar] [CrossRef]
- O’Reilly, C.; Moessner, K.; Nati, M. Univariate and Multivariate Time Series Manifold Learning. Knowl.-Based Syst. 2017, 133, 1–16. [Google Scholar] [CrossRef]
- Ali, M.; Deo, R.C.; Maraseni, T.; Downs, N.J. Improving SPI-derived drought forecasts incorporating synoptic-scale climate indices in multi-phase multivariate empirical mode decomposition model hybridized with simulated annealing and kernel ridge regression algorithms. J. Hydrol. 2019, 576, 164–184. [Google Scholar] [CrossRef]
- Das, P.; Naganna, S.R.; Deka, P.C.; Pushparaj, J. Hybrid wavelet packet machine learning approaches for drought modeling. Environ. Earth Sci. 2020, 79, 221. [Google Scholar] [CrossRef]
- Aghelpour, P.; Bahrami-Pichaghchi, H.; Kisi, O. Comparison of three different bio-inspired algorithms to improve ability of neuro fuzzy approach in prediction of agricultural drought, based on three different indexes. Comput. Electron. Agric. 2020, 170, 105279. [Google Scholar] [CrossRef]
- Safavi, H.R.; Sharghi, S.; Komasi, M. Wavelet and cuckoo search-support vector machine conjugation for drought forecasting using Standardized Precipitation Index (case study: Urmia Lake, Iran). J. Hydroinform. 2018, 20, 975–988. [Google Scholar] [CrossRef] [Green Version]
- Malik, A.; Tikhamarine, Y.; Souag-Gamane, D.; Rai, P.; Sammen, S.S.; Kisi, O. Support vector regression integrated with novel meta-heuristic algorithms for meteorological drought prediction. Meteorol. Atmos. Phys. 2021, 133, 891–909. [Google Scholar] [CrossRef]
- Malik, A.; Tikhamarine, Y.; Sammen, S.S.; Abba, S.I.; Shahid, S. Prediction of meteorological drought by using hybrid support vector regression optimized with HHO versus PSO algorithms. Environ. Sci. Pollut. Res. Int. 2021, 28, 39139–39158. [Google Scholar] [CrossRef] [PubMed]
- Özger, M.; Başakın, E.E.; Ekmekcioğlu, Ö.; Hacısüleyman, V. Comparison of wavelet and empirical mode decomposition hybrid models in drought prediction. Comput. Electron. Agric. 2020, 179, 105851. [Google Scholar] [CrossRef]
- Mohamadi, S.; Sammen, S.S.; Panahi, F.; Ehteram, M.; Kisi, O.; Mosavi, A.; Ahmed, A.N.; El-Shafie, A.; Al-Ansari, N. Zoning map for drought prediction using integrated machine learning models with a nomadic people optimization algorithm. Nat. Hazards 2020, 104, 537–579. [Google Scholar] [CrossRef]
- Mokhtarzad, M.; Eskandari, F.; Jamshidi Vanjani, N.; Arabasadi, A. Drought forecasting by ANN, ANFIS, and SVM and comparison of the models. Environ. Earth Sci. 2017, 76, 729. [Google Scholar] [CrossRef]
- Sofos, F.; Stavrogiannis, C.; Exarchou-Kouveli, K.K.; Akabua, D.; Charilas, G.; Karakasidis, T.E. Current Trends in Fluid Research in the Era of Artificial Intelligence: A Review. Fluids 2022, 7, 116. [Google Scholar] [CrossRef]
- Lee, T.R.; Wood, W.T.; Phrampus, B.J. A Machine Learning (kNN) Approach to Predicting Global Seafloor Total Organic Carbon. Glob. Biogeochem. Cycles 2019, 33, 37–46. [Google Scholar] [CrossRef]
- Winkler, D.; Haltmeier, M.; Kleidorfer, M.; Rauch, W.; Tscheikner-Gratl, F. Pipe failure modelling for water distribution networks using boosted decision trees. Struct. Infrastruct. Eng. 2018, 14, 1402–1411. [Google Scholar] [CrossRef] [Green Version]
- Bayatvarkeshi, M.; Mohammadi, K.; Kisi, O.; Fasihi, R. A new wavelet conjunction approach for estimation of relative humidity: Wavelet principal component analysis combined with ANN. Neural Comput. Appl. 2018, 32, 4989–5000. [Google Scholar] [CrossRef]
- Maiti, S.; Tiwari, R.K. A comparative study of artificial neural networks, Bayesian neural networks and adaptive neuro-fuzzy inference system in groundwater level prediction. Environ. Earth Sci. 2013, 71, 3147–3160. [Google Scholar] [CrossRef]
- Ibrahim, K.S.M.H.; Huang, Y.F.; Ahmed, A.N.; Koo, C.H.; El-Shafie, A. A review of the hybrid artificial intelligence and optimization modelling of hydrological streamflow forecasting. Alex. Eng. J. 2022, 61, 279–303. [Google Scholar] [CrossRef]
- Parveen, N.; Zaidi, S.; Danish, M. Support vector regression (SVR)-based adsorption model for Ni (II) ions removal. Groundw. Sustain. Dev. 2019, 9, 100232. [Google Scholar] [CrossRef]
- Nourani, V.; Molajou, A.; Uzelaltinbulat, S.; Sadikoglu, F. Emotional artificial neural networks (EANNs) for multi-step ahead prediction of monthly precipitation; case study: Northern Cyprus. Theor. Appl. Climatol. 2019, 138, 1419–1434. [Google Scholar] [CrossRef]
- Maier, H.R.; Dandy, G.C. Neural networks for the prediction and forecasting of water resources variables: A review of modelling issues and applications. Environ. Model. Softw. 2000, 15, 101–124. [Google Scholar] [CrossRef]
- Unnikrishnan, P.; Jothiprakash, V. Daily rainfall forecasting for one year in a single run using Singular Spectrum Analysis. J. Hydrol. 2018, 561, 609–621. [Google Scholar] [CrossRef]
- Ouyang, Q.; Lu, W. Monthly Rainfall Forecasting Using Echo State Networks Coupled with Data Preprocessing Methods. Water Resour. Manag. 2017, 32, 659–674. [Google Scholar] [CrossRef]
- Seo, Y.; Kwon, S.; Choi, Y. Short-Term Water Demand Forecasting Model Combining Variational Mode Decomposition and Extreme Learning Machine. Hydrology 2018, 5, 54. [Google Scholar] [CrossRef] [Green Version]
- Zhang, J.; Li, H.; Shi, X.; Hong, Y. Wavelet-Nonlinear Cointegration Prediction of Irrigation Water in the Irrigation District. Water Resour. Manag. 2019, 33, 2941–2954. [Google Scholar] [CrossRef]
- So, J.-M.; Lee, J.-H.; Bae, D.-H. Development of a Hydrological Drought Forecasting Model Using Weather Forecasting Data from GloSea5. Water 2020, 12, 2785. [Google Scholar] [CrossRef]
- Zubaidi, S.; Al-Bugharbee, H.; Ortega-Martorell, S.; Gharghan, S.; Olier, I.; Hashim, K.; Al-Bdairi, N.; Kot, P. A Novel Methodology for Prediction Urban Water Demand by Wavelet Denoising and Adaptive Neuro-Fuzzy Inference System Approach. Water 2020, 12, 1628. [Google Scholar] [CrossRef]
- Tabachnick, B.G.; Fidell, L.S. Using Multivariate Statistics; Pearson: Boston, MA, USA, 2013. [Google Scholar]
- Sofos, F.; Karakasidis, T.E. Nanoscale slip length prediction with machine learning tools. Sci. Rep. 2021, 11, 12520. [Google Scholar] [CrossRef]
- Zubaidi, S.L.; Gharghan, S.K.; Dooley, J.; Alkhaddar, R.M.; Abdellatif, M. Short-Term Urban Water Demand Prediction Considering Weather Factors. Water Resour. Manag. 2018, 32, 4527–4542. [Google Scholar] [CrossRef]
- Zubaidi, S.L.; Ortega-Martorell, S.; Al-Bugharbee, H.; Olier, I.; Hashim, K.S.; Gharghan, S.K.; Kot, P.; Al-Khaddar, R. Urban Water Demand Prediction for a City That Suffers from Climate Change and Population Growth: Gauteng Province Case Study. Water 2020, 12, 1885. [Google Scholar] [CrossRef]
- Behboudian, S.; Tabesh, M.; Falahnezhad, M.; Ghavanini, F.A. A long-term prediction of domestic water demand using preprocessing in artificial neural network. J. Water Supply: Res. Technol.—AQUA 2014, 63, 31–42. [Google Scholar] [CrossRef]
- Malek, N.H.A.; Wan Yaacob, W.F.; Md Nasir, S.A.; Shaadan, N. Prediction of Water Quality Classification of the Kelantan River Basin, Malaysia, Using Machine Learning Techniques. Water 2022, 14, 1067. [Google Scholar] [CrossRef]
- Jain, S.; Shukla, S.; Wadhvani, R. Dynamic selection of normalization techniques using data complexity measures. Expert Syst. Appl. 2018, 106, 252–262. [Google Scholar] [CrossRef]
- Akilli, A.; Atil, H. Evaluation of Normalization Techniques on Neural Networks for the Prediction of 305-Day Milk Yield. Turk. J. Agric. Eng. Res. 2020, 1, 354–367. [Google Scholar] [CrossRef]
- Zubaidi, S.L.; Hashim, K.; Ethaib, S.; Al-Bdairi, N.S.S.; Al-Bugharbee, H.; Gharghan, S.K. A novel methodology to predict monthly municipal water demand based on weather variables scenario. J. King Saud Univ.-Eng. Sci. 2022, 34, 163–169. [Google Scholar] [CrossRef]
- Zhu, S.; Lu, H.; Ptak, M.; Dai, J.; Ji, Q. Lake water-level fluctuation forecasting using machine learning models: A systematic review. Environ. Sci. Pollut. Res. Int. 2020, 27, 44807–44819. [Google Scholar] [CrossRef] [PubMed]
- Le, J.A.; El-Askary, H.M.; Allali, M.; Sayed, E.; Sweliem, H.; Piechota, T.C.; Struppa, D.C. Characterizing El Niño-Southern Oscillation Effects on the Blue Nile Yield and the Nile River Basin Precipitation using Empirical Mode Decomposition. Earth Syst. Environ. 2020, 4, 699–711. [Google Scholar] [CrossRef]
- Le, H.D.; Le, T.N.; Wang, J.W.; Liang, Y.S. Singular Spectrum Analysis for Background Initialization with Spatio-Temporal RGB Color Channel Data. Entropy 2021, 23, 1644. [Google Scholar] [CrossRef]
- Malik, A.; Kumar, A.; Singh, R.P. Application of Heuristic Approaches for Prediction of Hydrological Drought Using Multi-scalar Streamflow Drought Index. Water Resour. Manag. 2019, 33, 3985–4006. [Google Scholar] [CrossRef]
- Paulson, N.H.; Zomorodpoosh, S.; Roslyakova, I.; Stan, M. Comparison of statistically-based methods for automated weighting of experimental data in CALPHAD-type assessment. Calphad 2020, 68, 101728. [Google Scholar] [CrossRef]
- Danandeh Mehr, A.; Vaheddoost, B.; Mohammadi, B. ENN-SA: A novel neuro-annealing model for multi-station drought prediction. Comput. Geosci. 2020, 145, 104622. [Google Scholar] [CrossRef]
- Fung, K.F.; Huang, Y.F.; Koo, C.H. Coupling fuzzy–SVR and boosting–SVR models with wavelet decomposition for meteorological drought prediction. Environ. Earth Sci. 2019, 78, 693. [Google Scholar] [CrossRef]
- Zhang, Y.; Yang, H.; Cui, H.; Chen, Q. Comparison of the Ability of ARIMA, WNN and SVM Models for Drought Forecasting in the Sanjiang Plain, China. Nat. Resour. Res. 2019, 29, 1447–1464. [Google Scholar] [CrossRef]
- Belayneh, A.; Adamowski, J.; Khalil, B.; Ozga-Zielinski, B. Long-term SPI drought forecasting in the Awash River Basin in Ethiopia using wavelet neural network and wavelet support vector regression models. J. Hydrol. 2014, 508, 418–429. [Google Scholar] [CrossRef]
- Lee, K.S.; Geem, Z.W. A new meta-heuristic algorithm for continuous engineering optimization: Harmony search theory and practice. Comput. Methods Appl. Mech. Eng. 2005, 194, 3902–3933. [Google Scholar] [CrossRef]
- Khashei, M.; Hajirahimi, Z. A comparative study of series arima/mlp hybrid models for stock price forecasting. Commun. Stat.-Simul. Comput. 2018, 48, 2625–2640. [Google Scholar] [CrossRef]
- Taylan, E.D.; Terzi, Ö.; Baykal, T. Hybrid wavelet–artificial intelligence models in meteorological drought estimation. J. Earth Syst. Sci. 2021, 130, 38. [Google Scholar] [CrossRef]
- Danandeh Mehr, A.; Safari, M.j.S.; Nourani, V. Wavelet Packet-Genetic Programming: A New Model for Meteorological Drought Hindcasting. Tek. Dergi 2021, 32, 11029–11050. [Google Scholar] [CrossRef]
- Xu, D.; Zhang, Q.; Ding, Y.; Zhang, D. Application of a hybrid ARIMA-LSTM model based on the SPEI for drought forecasting. Environ. Sci. Pollut. Res. Int. 2022, 29, 4128–4144. [Google Scholar] [CrossRef] [PubMed]
- Alquraish, M.; Abuhasel, K.A.; Alqahtani, A.S.; Khadr, M. SPI-Based Hybrid Hidden Markov–GA, ARIMA–GA, and ARIMA–GA–ANN Models for Meteorological Drought Forecasting. Sustainability 2021, 13, 12576. [Google Scholar] [CrossRef]
- Xu, D.; Zhang, Q.; Ding, Y.; Huang, H. Application of a Hybrid ARIMA–SVR Model Based on the SPI for the Forecast of Drought—A Case Study in Henan Province, China. J. Appl. Meteorol. Climatol. 2020, 59, 1239–1259. [Google Scholar] [CrossRef] [Green Version]
- Deo, R.C.; Tiwari, M.K.; Adamowski, J.F.; Quilty, J.M. Forecasting effective drought index using a wavelet extreme learning machine (W-ELM) model. Stoch. Environ. Res. Risk Assess. 2016, 31, 1211–1240. [Google Scholar] [CrossRef]
- Elavarasan, D.; Vincent, D.R.; Sharma, V.; Zomaya, A.Y.; Srinivasan, K. Forecasting yield by integrating agrarian factors and machine learning models: A survey. Comput. Electron. Agric. 2018, 155, 257–282. [Google Scholar] [CrossRef]
- Dikshit, A.; Pradhan, B.; Alamri, A.M. Long lead time drought forecasting using lagged climate variables and a stacked long short-term memory model. Sci. Total Environ. 2021, 755, 142638. [Google Scholar] [CrossRef]
- Tian, Y.; Xu, Y.P.; Wang, G. Agricultural drought prediction using climate indices based on Support Vector Regression in Xiangjiang River basin. Sci. Total Environ. 2018, 622–623, 710–720. [Google Scholar] [CrossRef]
- Park, H.; Kim, K.; Lee, D.k. Prediction of Severe Drought Area Based on Random Forest: Using Satellite Image and Topography Data. Water 2019, 11, 705. [Google Scholar] [CrossRef] [Green Version]
- Abbasi, A.; Khalili, K.; Behmanesh, J.; Shirzad, A. Drought monitoring and prediction using SPEI index and gene expression programming model in the west of Urmia Lake. Theor. Appl. Climatol. 2019, 138, 553–567. [Google Scholar] [CrossRef]
- Mouatadid, S.; Raj, N.; Deo, R.C.; Adamowski, J.F. Input selection and data-driven model performance optimization to predict the Standardized Precipitation and Evaporation Index in a drought-prone region. Atmos. Res. 2018, 212, 130–149. [Google Scholar] [CrossRef]
- Li, M.-F.; Tang, X.-P.; Wu, W.; Liu, H.-B. General models for estimating daily global solar radiation for different solar radiation zones in mainland China. Energy Convers. Manag. 2013, 70, 139–148. [Google Scholar] [CrossRef]
- Shiri, J.; Kişi, Ö. Comparison of genetic programming with neuro-fuzzy systems for predicting short-term water table depth fluctuations. Comput. Geosci. 2011, 37, 1692–1701. [Google Scholar] [CrossRef]
- Dawson, C.W.; Abrahart, R.J.; See, L.M. HydroTest: A web-based toolbox of evaluation metrics for the standardised assessment of hydrological forecasts. Environ. Model. Softw. 2007, 22, 1034–1052. [Google Scholar] [CrossRef] [Green Version]
- Mazaheri, H.; Ghaedi, M.; Ahmadi Azqhandi, M.H.; Asfaram, A. Application of machine/statistical learning, artificial intelligence and statistical experimental design for the modeling and optimization of methylene blue and Cd(ii) removal from a binary aqueous solution by natural walnut carbon. Phys. Chem. Chem. Phys. 2017, 19, 11299–11317. [Google Scholar] [CrossRef]
- Achour, K.; Meddi, M.; Zeroual, A.; Bouabdelli, S.; Maccioni, P.; Moramarco, T. Spatio-temporal analysis and forecasting of drought in the plains of northwestern Algeria using the standardized precipitation index. J. Earth Syst. Sci. 2020, 129, 42. [Google Scholar] [CrossRef]
- Adamowski, J.; Fung Chan, H.; Prasher, S.O.; Ozga-Zielinski, B.; Sliusarieva, A. Comparison of multiple linear and nonlinear regression, autoregressive integrated moving average, artificial neural network, and wavelet artificial neural network methods for urban water demand forecasting in Montreal, Canada. Water Resour. Res. 2012, 48, 1–14. [Google Scholar] [CrossRef]
- Ait Belale, R.; M’Hamdi Alaoui, F.E.; Chhiti, Y.; Sahibeddine, A.; Munoz Rujas, N.; Aguilar, F. Study on the thermophysical properties of waste cooking oil biodiesel fuel blends with 1-butanol. Fuel 2021, 287, 119540. [Google Scholar] [CrossRef]


| SPI Values | Class |
|---|---|
| >2 | Extremely wet |
| 1.5 to 1.99 | Very wet |
| 1.0 to 1.49 | Moderately wet |
| −0.99 to 0.99 | Near normal |
| −1.0 to −1.49 | Moderately dry |
| −1.5 to −1.99 | Severely dry |
| <−2 | Extremely dry |
| PI Values | Drought Description |
|---|---|
| >1.0 | Extremely wet |
| 0.75 to 1.0 | Very wet |
| 0.5 to 0.75 | Moderately wet |
| 0.5 to −0.5 | Normal |
| −0.5 to −0.75 | Moderate drought |
| −0.75 to −1.0 | Severe drought |
| <−1.0 | Extreme drought |
| SIAP Values | Classes of Drought Intensity |
|---|---|
| >0.84 | Extremely wet |
| 0.52 to 0.84 | Wet |
| −0.52 to 0.52 | Normal |
| −0.52 to −0.84 | Drought |
| <−0.84 | Extreme drought |
| PDSI Values | Category |
|---|---|
| PDSI ≤ −4 | Extreme drought |
| −4 < PDSI ≤ −3 | Severe drought |
| −3 < PDSI ≤ −2 | Moderate drought |
| −2 < PDSI ≤ −1 | Mild drought |
| PDSI ≥ −1 | No drought |
| Ref. | Type | Input Data Parameter | Output Parameter |
|---|---|---|---|
| [61] | Multivariate | Twelve multivariate datasets (derived from statistically significant lagged combinations of precipitation, temperature, and humidity) | SPI1, SPI 3, SPI 6, SPI 12 |
| [31] | Multivariate | Rainfall data series with SPI Lag | SPI (t + 1) |
| [35] | Multivariate | antecedent SPIs and antecedent accumulated monthly rainfall | SPI 3, SPI 6 |
| [20] | Multivariate | SHDI Lag, SPI Lag, and precipitation. | SHDI 1, SHDI 3, SHDI 6. |
| [53] | Multivariate | Rainfall and SIAP Lag Water level and SWSI Lag | SIAP SWSI |
| [62] | Univariate | SPI Lag | SPI 6, SPI 12 |
| [58] | Univariate | PDSI Lag | PDSI (t + 1) |
| [63] | Univariate | MSPI Lag | MSPI (t + 1) |
| [64] | Univariate | SPI Lag | SPI (t + 1) |
| [65] | Univariate | EDI Lag | EDI (t + 1) |
| [39] | Univariate | SPI Lag | SPI 3, SPI 6, SPI 9, SPI 12 |
| [66] | Univariate | EDI Lag | EDI (t + 1) |
| [67] | Univariate | sc-PDSI Lag | sc-PDSI (t + 1), (t + 3), (t + 6) |
| [38] | Univariate | GRI Lag | GRI 6, GRI 12, GRI 24 |
| [32] | Univariate | SPI Lag | SPI 3, SPI 6, SPI 9, SPI12 |
| [25] | Univariate | PDSI Lag | PDSI (t) |
| [68] | Univariate | SPI Lag | SPI 3 |
| [37] | Univariate | SPI Lag | SPI 3, SPI 6, SPI 12 |
| [54] | Univariate | RDI Lag | RDI 6, RDI 9, RDI 12 |
| [52] | Univariate | SPEI Lag | SPEI 1, SPEI 3, SPEI 6 |
| [27] | Univariate | sc-PDSI Lag | sc-PDSI 1, sc-PDSI 3, sc-PDSI 6 |
| Model Type | Advantages | Disadvantages | Ref. |
|---|---|---|---|
| ANN | -Ability to simulate and predict non-stationary and non-linear time series. | -Sometimes, ANNs have issues forecasting unstable and non-stationary time series. If data pre-processing does not apply, the ANN will be unable to forecast and solve issues. | [48,73] |
| ANFIS | -Use the fuzzy logic and neural network in a single model to increase efficiency. | -It needs a lot of training data to create a precise model, and these data may not be available every time. | [27,74] |
| RF | -Accuracy in modelling improves as the number of trees increases. -Ability to process large datasets involving several features | -Applying the model with a large number of trees causes a slow training process. | [26,75] |
| SVR | -It has flexibility for multiple options due to the availability of different kernel functions. | -It needs effective parameter optimisation to provide more accurate predictions. | [75,76] |
| Authors | Normalisation | Cleaning | Best Model Input |
|---|---|---|---|
| Danandeh Mehr et al. [99] | Yes | No | Yes |
| Ali et al. [61] | Yes | Yes | Yes |
| Aghelpour et al. [58] | Yes | No | No |
| Aghelpour et al. [63] | Yes | No | No |
| Safavi et al. [64] | Yes | Yes | No |
| Fung et al. [100] | Yes | Yes | No |
| Zhang et al. [101] | No | Yes | Yes |
| Khan et al. [31] | No | Yes | No |
| Pham et al. [35] | Yes | Yes | Yes |
| Banadkooki et al. [38] | Yes | No | Yes |
| Adnan et al. [32] | Yes | No | No |
| Nabipour et al. [20] | Yes | No | No |
| Mohamadi et al. [68] | Yes | No | Yes |
| Djerbouai and Souag-Gamane [37] | Yes | Yes | No |
| Wu et al. [40] | Yes | Yes | No |
| Soh et al. [52] | Yes | Yes | No |
| Başakın et al. [27] | Yes | Yes | No |
| Das et al. [62] | Yes | Yes | No |
| Belayneh et al. [23] | Yes | Yes | No |
| Kisi et al. [39] | Yes | No | Yes |
Publisher’s Note: MDPI stays neutral with regard to jurisdictional claims in published maps and institutional affiliations. |
© 2022 by the authors. Licensee MDPI, Basel, Switzerland. This article is an open access article distributed under the terms and conditions of the Creative Commons Attribution (CC BY) license (https://creativecommons.org/licenses/by/4.0/).
Share and Cite
Alawsi, M.A.; Zubaidi, S.L.; Al-Bdairi, N.S.S.; Al-Ansari, N.; Hashim, K. Drought Forecasting: A Review and Assessment of the Hybrid Techniques and Data Pre-Processing. Hydrology 2022, 9, 115. https://0-doi-org.brum.beds.ac.uk/10.3390/hydrology9070115
Alawsi MA, Zubaidi SL, Al-Bdairi NSS, Al-Ansari N, Hashim K. Drought Forecasting: A Review and Assessment of the Hybrid Techniques and Data Pre-Processing. Hydrology. 2022; 9(7):115. https://0-doi-org.brum.beds.ac.uk/10.3390/hydrology9070115
Chicago/Turabian StyleAlawsi, Mustafa A., Salah L. Zubaidi, Nabeel Saleem Saad Al-Bdairi, Nadhir Al-Ansari, and Khalid Hashim. 2022. "Drought Forecasting: A Review and Assessment of the Hybrid Techniques and Data Pre-Processing" Hydrology 9, no. 7: 115. https://0-doi-org.brum.beds.ac.uk/10.3390/hydrology9070115