Article

Modeling of Filtration Processes—Microfiltration and Depth Filtration for Harvest of a Therapeutic Protein Expressed in Pichia pastoris at Constant Pressure

by
Muthukumar Sampath
,
Anupam Shukla
and
Anurag S. Rathore
*
Department of Chemical Engineering, Indian Institute of Technology, Hauz Khas, New Delhi, 110016, India
*
Author to whom correspondence should be addressed.
Submission received: 20 October 2014 / Revised: 28 November 2014 / Accepted: 3 December 2014 / Published: 8 December 2014
(This article belongs to the Special Issue Biopharmaceutical Process Development)

Abstract

:
Filtration steps are ubiquitous in biotech processes due to the simplicity of operation, ease of scalability and the myriad of operations that they can be used for. Microfiltration, depth filtration, ultrafiltration and diafiltration are some of the most commonly used biotech unit operations. For clean feed streams, when fouling is minimal, scaling of these unit operations is performed linearly based on the filter area per unit volume of feed stream. However, for cases when considerable fouling occurs, such as the case of harvesting a therapeutic product expressed in Pichia pastoris, linear scaling may not be possible and current industrial practices involve use of 20–30% excess filter area over and above the calculated filter area to account for the uncertainty in scaling. In view of the fact that filters used for harvest are likely to have a very limited lifetime, this oversizing of the filters can add considerable cost of goods for the manufacturer. Modeling offers a way out of this conundrum. In this paper, we examine feasibility of using the various proposed models for filtration of a therapeutic product expressed in Pichia pastoris at constant pressure. It is observed that none of the individual models yield a satisfactory fit of the data, thus indicating that more than one fouling mechanism is at work. Filters with smaller pores were found to undergo fouling via complete pore blocking followed by cake filtration. On the other hand, filters with larger pores were found to undergo fouling via intermediate pore blocking followed by cake filtration. The proposed approach can be used for more accurate sizing of microfilters and depth filters.

Graphical Abstract

1. Introduction

Pichia pastoris is frequently used as an expression system for the production of therapeutic proteins because it offers high growth rate and is able to grow on a relatively simple and inexpensive medium. A major advantage that Pichia offers over another popular microbial host, E. coli, is that Pichia is capable of inducing correct formation of disulfide bonds (thus reducing the need to refold protein) and to some extent glycosylation [1,2,3,4,5]. After the protein has been expressed, clarifying the cell culture broth is the first task that needs to be undertaken as part of downstream processing of a biological therapeutic protein. The main purpose of clarification is to efficiently separate cells, cell debris, and other colloidal matter and deliver a particle-free feed to downstream process steps such as ion exchange and/or protein A chromatography. This is typically achieved by performing centrifugation or filtration based operations such as microfiltration or depth filtration or a combination of these [6,7,8,9,10].
Membrane fouling can occur due to deposition of suspended particles on the external surfaces of the filter or within the filter’s pores. This results in higher membrane resistance and affects quality of the permeate [11,12,13,14]. Many different models have been proposed in the literature to explain the flux decline. Prominent amongst these are the standard blocking model, intermediate blocking model, cake filtration model, and complete blocking model [15]. In the standard blocking model, particles get accumulated inside the membrane on the pore walls and the resulting constrictions of pores reduce the membrane’s permeability. Intermediate blocking model assumes that a portion of particles seal some of the pores while the rest accumulate on the top of the deposited particles. The complete blocking model is based on the premise that the particles are larger than the pore size of the membrane and this results in the particles sealing off the membrane and preventing the flow. Finally, cake filtration model assumes particle accumulation on the membrane surface in a permeable cake of increasing thickness. These mechanisms have been used individually as well as in combination to explain experimental observations [15].
Hale et al. have investigated use of asbestos based filter-pads for cold sterilization of a tissue culture medium in constant flow rate mode [16]. They found that the transition to a slower plugging rate occurs during filtration at constant rate. Guell et al. have studied the effect of yeast cells on membrane fouling for different protein mixtures in dead-end filtration [17]. They observed that the yeast cake on top of the primary membrane acts as a secondary membrane and retains protein aggregates, thereby reducing protein fouling of the primary membrane. Ho et al. developed a mathematical model for the filtrate flux where pore blockage accounted for initial fouling and subsequent fouling was due to growth of a protein cake or deposit over the initially blocked regions [18]. The model showed excellent agreement with the experimental data obtained during the stirred cell filtration of bovine serum albumin solutions operated at constant pressure through polycarbonate track-etched microfiltration membranes. Velasco et al. studied the fouling mechanism for filtration of bovine serum albumin via dead-end micro filtration at different pH and pressures [19]. They showed the important role of applied pressure on fouling and found that the cake forms only at high pressure, when there is an electrostatic interaction between the protein and membrane. Schick et al. have used a novel automated liquid handling approach in the dead-end filtration [20]. The fluid was pumped at constant flow rate till the maximum pressure is reached and then the fluid handling system was automatically switched to constant pressure. The author found that the yield was increased by 35% when the same filter was operated at constant pressure. Kim et al. have developed models for predicting the performance of low pressure membranes. The developed models could explain the importance of membrane design parameters and explain the experimental observations with respect to membrane performance [21]. Ochirkhuyag et al. have compared the filtration behavior of flocculated and dispersed slurries of alumina particles in gravity filtration [22]. They investigated the effects of the filter diameter, filtration pressure and rotation speed on the filtration flux and found that the filtration flux increased with increase in rotation. At low rotation speeds the filtration flux was independent of pressure, whereas at higher speeds the filtration flux increased along with pressure. Hong et al. [23] have studied the effect of feed water quality and operational parameters on the efficiency of backwashing. They found that backwash efficiency is related to the structure of the cake layer formed. Pegel et al. [24] have screened different depth filters for cell separation and harvest clarification in 200 L scale. Based on the results they calculated optimal filtration set up to the lowest total filter area for 1000 L scale.
Human serum albumin (HSA) is one of the most widely used proteins in the pharmaceutical industry. Traditionally used as a therapeutic agent, the primary function of HSA is restoration and maintenance of blood volumes in situations such as surgery, blood loss and treatment of burns. This article focuses on modeling of filtration based harvest of human serum albumin expressed in Pichia pastoris. Figure 1 illustrates the different approaches that can be used for clarification and product capture. Option 1 involves using microfiltration for clarification of the feed stream. Option 2 uses a combination of centrifugation followed by microfiltration and Option 3 utilizes direct loading of the harvest on the various depth filters. Options 4 and 5 involve direct capture of the fermentation harvest using expanded bed and radial bed. In this paper, we have explored the possibility for clarification of the feed streams using microfiltration and depth filtration. The four models that have been mentioned above were fitted to the experimental data and based on the outcome, a model that can describe the entire data was proposed.
Figure 1. Different options for harvest of a therapeutic protein from Pichia pastoris fermentation.
Bioengineering 01 00260 g001

1.1. Theory

Flux decline for a constant pressure dead-end filtration can be described by the following mathematical expression [25]
d 2 t d V 2 = k ( d t d V ) n
where, t is the filtration time, V is the total filtered volume and n is an exponent that depends on the fouling model (n= 0 for cake filtration, n = 1 for intermediate blockage, n = 3/2 for pore constriction, and n = 2 for complete pore blockage).

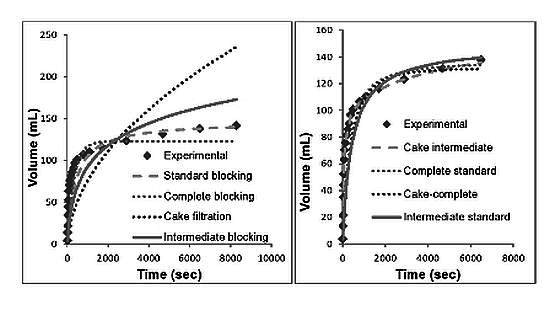
1.2. Standard Blocking Model

When the particle size is smaller than the pore size of the membrane, the particles tend to enter the membrane surface and deposit on the pore walls. This results in a decrease in the pore volume. This decrease is directly proportional to time as per the following expression [25]
V = ( 1 J 0 t + K s 2 ) 1
where, J0 is the initial flux and Ks is the standard blocking constant (m−1).

1.3. Complete Blocking Model

This model assumes that each particle arriving at the membrane surface plays an important role in blocking some pores without any superposition of particles. Thus, the effective number of pores decreases during filtration but the area of each pore is assumed to be constant. The total filtrate volume (V) with time (t) is given by
V = J 0 K b ( 1 exp ( K b t ) )
where, Kb has the unit of (s−1).

1.4. Intermediate Blocking Model

This model assumes that each particle can block a membrane pore or settle on other particles that are blocking the pores. The relation between filtrate volume and time is given by the equation
V = 1 K i ln ( 1 + K i J 0 t )
where, Ki has the unit of (m−1).

1.5. Cake Filtration

The pores in this model are assumed to be clogged by the particles and the particles deposit over the membrane surface and form a cake which leads to a decrease in the filtrate volume. This model can be described as
V = 1 K c J 0 ( 1 + 2 K c J o 2 t 1 )
where, Kc has a unit of (sm−2).

1.6. Combined Models for Membrane Fouling

The above mentioned models have also been combined to describe fouling observed in micro filters [26]. Researchers have proposed five fouling models that accounted for the combined effects of the different individual fouling mechanisms mentioned above. These models use two fitted parameters and reduce to the individual models when one mechanism dominates. The author examined the applicability of these models towards sterile filtration of IgG and viral filtration of BSA and concluded that combined caking and complete blockage model yielded the best fit for both data sets.

2. Experimental Section

2.1. Materials

High cell density P. pastoris fermentation broth was cultivated in a 3 L Applikon bioreactor. The fermentation broth had approximately 60% solids and the target protein was expressed extracellularly. For most cases, the broth was centrifuged at 8000 rpm for 30 min. After centrifugation, the supernatant was stored in the cold room (4 °C) prior to microfiltration.

2.2. Experimental Setup

A dead end filtration feed vessel (stainless steel pressure holder, 200 mL capacity) was used in this investigation. Different membrane modules, each having are of 23 cm2 area, were attached to the feed vessel as needed and the supernatant was introduced in the feed vessel. Different micro filters and depth filters used in the investigation are shown in Table 1. Experiments were performed in batch mode using a laboratory-scale setup. Pressure was maintained at 1.5 bar throughout the experiment. After processing, the permeate flowed to a permeate vessel and its weight was measured as a function of time. The weights were converted to volumes using density correlations. Once the initial flux value had declined to about 90%, the microfiltration or depth filtration membrane that was used was discarded and the filtration feed vessel was emptied. The initial flux was calculated based on the initial permeate volume per time during the initial stage of the filtration. Solute concentrations of the filtrate and feed were measured using reversed phase high performance liquid chromatography (RP HPLC). All experiments were conducted at ambient temperature.

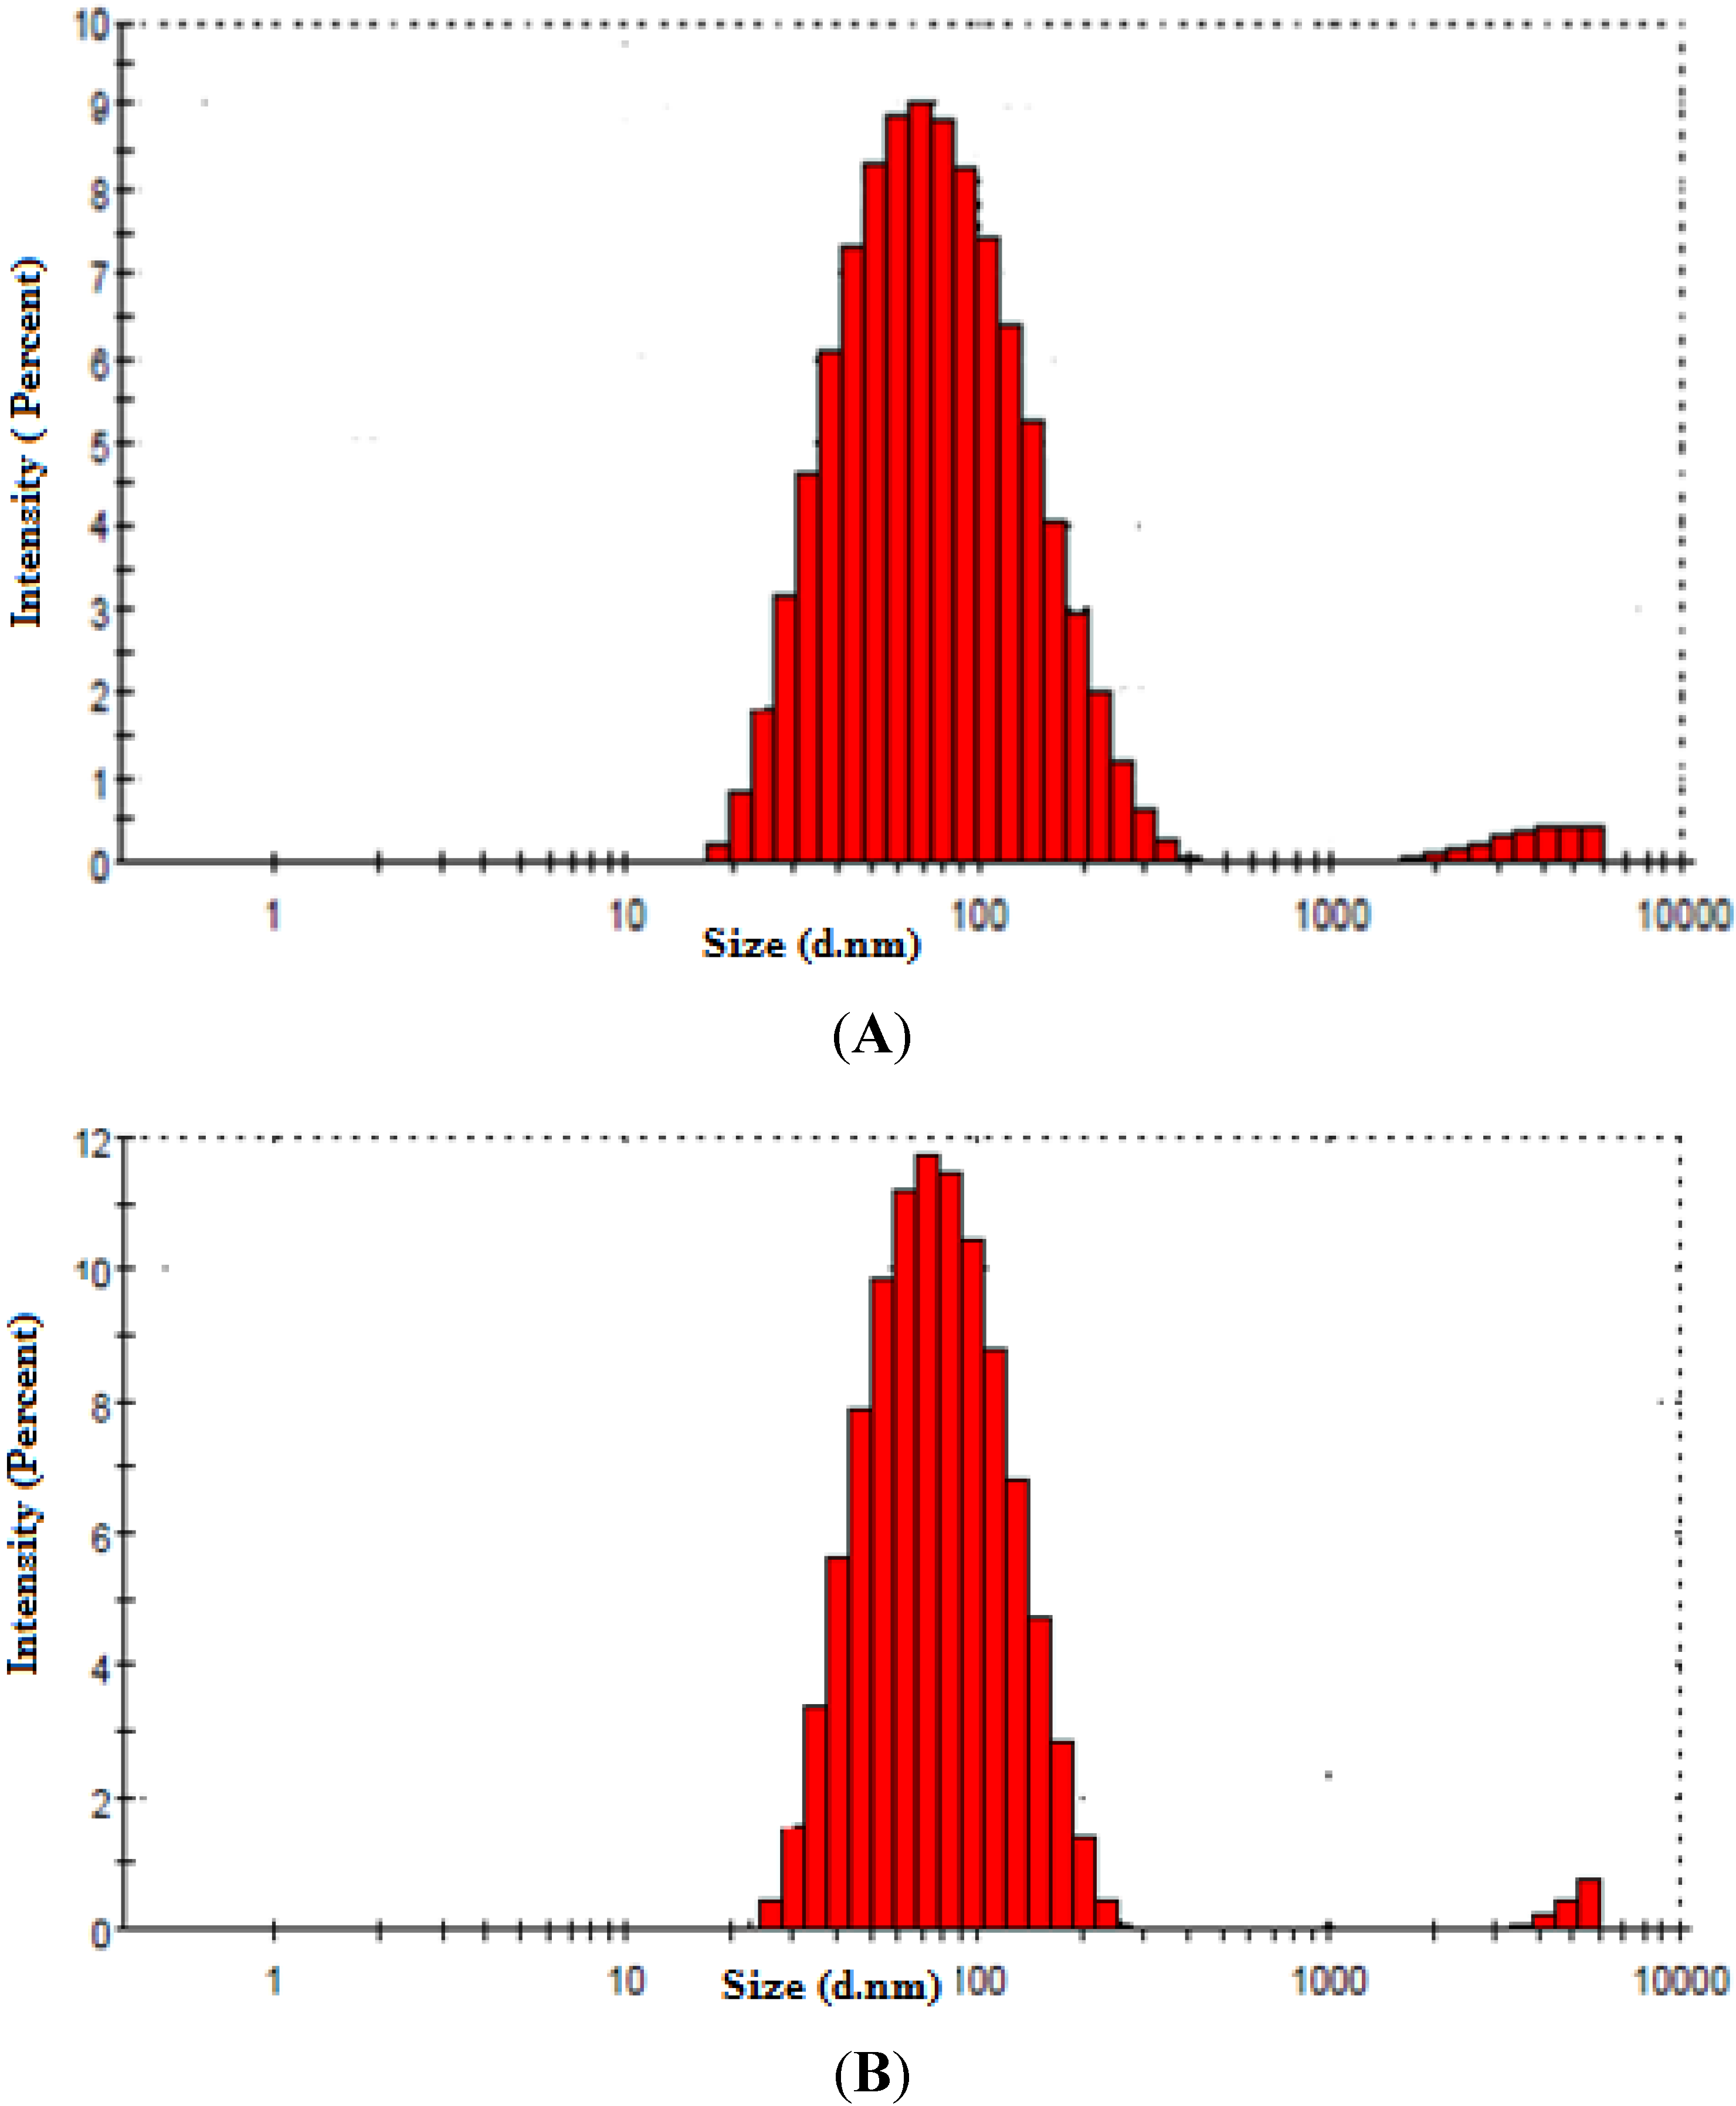
2.3. Particle Size Distribution Measurement
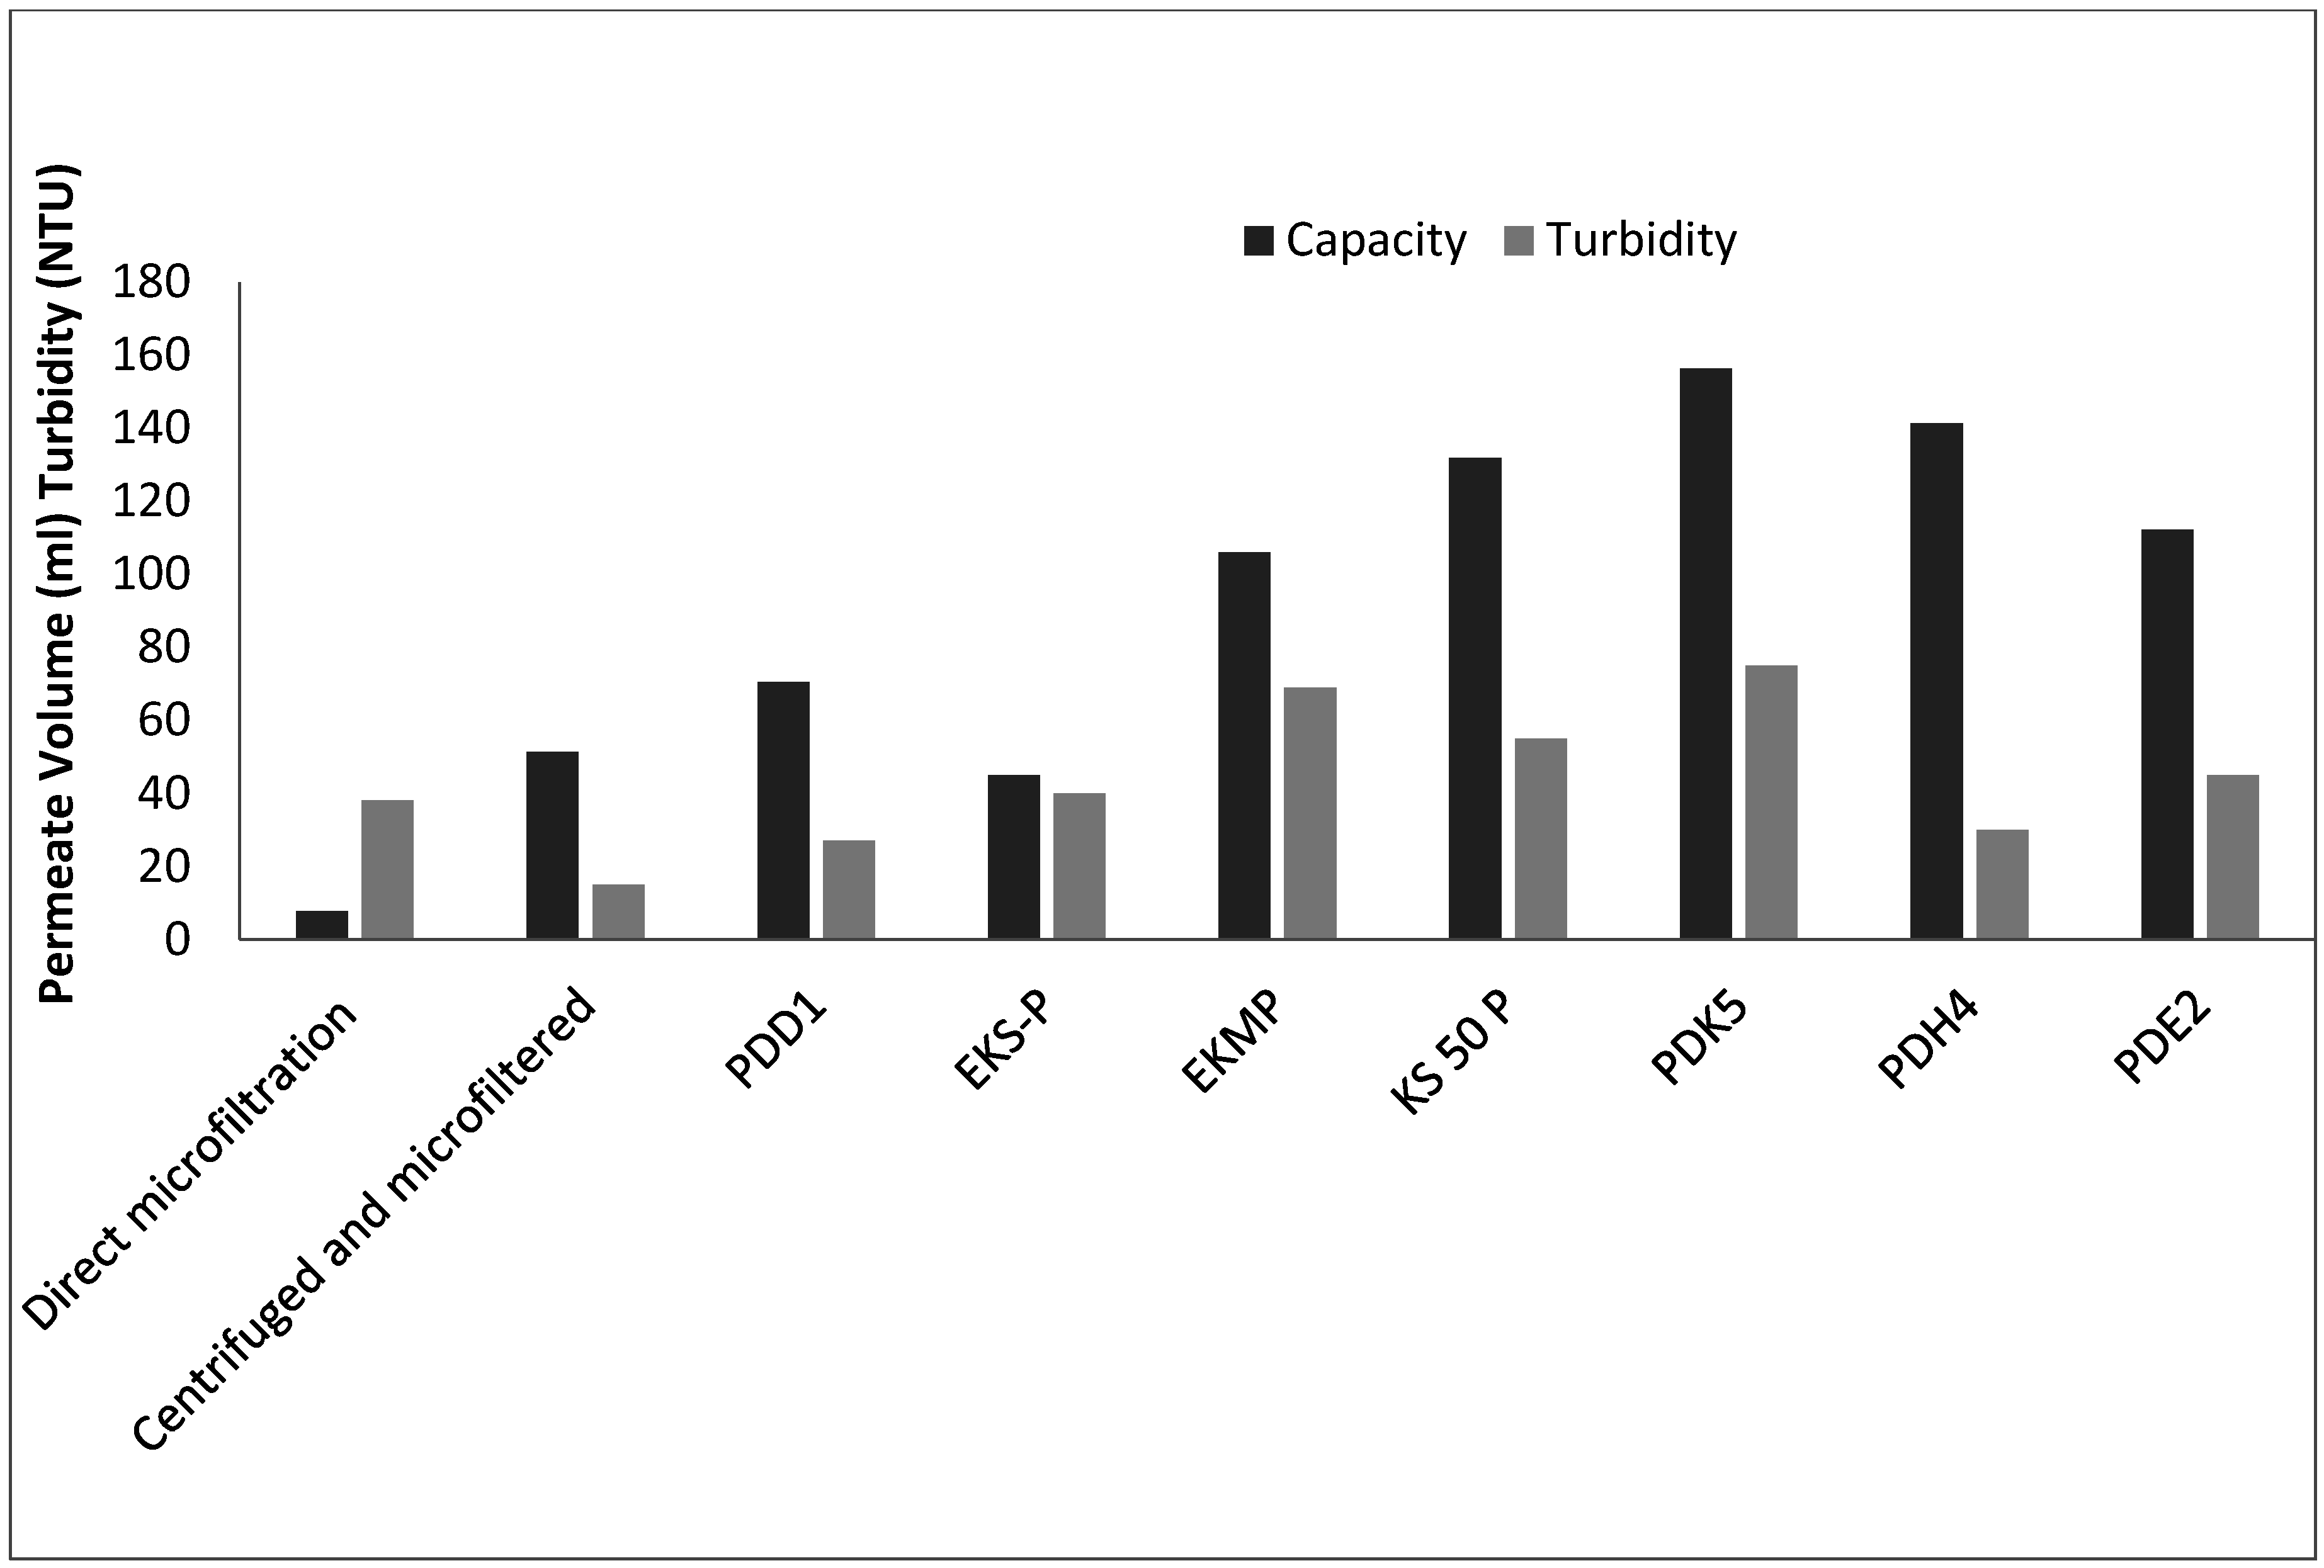
Particle size distribution of the fermentation broth and the centrifuged streams were measured using a Zetasizer NanoSeries-S90 instrument (Malvern Instrument Limited, Worcestershire, UK).
Table 1. Different types of micro filters and depth filters used in the investigation.
S.No.Filter TypeFilter NameNominal Retention Rating (µm)Description
1.Micro filters SuporGrade (Micro filter) EKV0.2Filter Media is Supor EKV membrane (hydrophilic polyethersulfone)
2.Supra Cap 60 HP (Depth filter)PDK51.5–20.0The HP-series depth filter sheets are comprised of two full thickness, graded, high-efficiency P-Series depth filter sheets in combination
PDH40.4–15.0
PDE20.2–3.5
PDD10.1–0.85
3.Supra Cap P Series (Depth filter)KS 50P0.4–0.8P series depth filter, combination of cellulose fibers, DE and perlite, pyrogen removal capability
EKS-P0.1–0.3
EKMP0.2–0.5

2.4. Turbidity Measurement

In all cases, turbidity of the feed solution was measured by light scattering using Hach Ratio Turbidimeter (Hach, Loveland, CO, USA).Turbidity was also monitored during all microfiltration and depth filtration experiments. A sample of feed was placed in the cuvette and its turbidity examined. Similarly, the permeate samples from different depth filters and micro filters were also examined.

2.5. RP-HPLC

Protein concentration was determined using RP–HPLC using a 4.6 mm × 150 mm Zorbax Eclipse XDB C4 column (Agilent Technologies, Palo Alto, CA, USA).Mobile phase consisted of solvents A and B where solvent A was 0.1% (v/v) TFA in water and solvent B was 0.1% (v/v) TFA in 98% of acetonitrile. Flow rate was maintained at 1 mL/min using a linear gradient of A to B at a wavelength of 214 nm.

3. Results and Discussion

Particle size distributions of the fermentation broth and the centrifuged streams are shown in Figure 2A,B, respectively. It is seen that the particle size distribution of the fermentation broth includes a substantial population of particles greater than 200 nm (mean particle size) and therefore a significant portion of these particles would be expected to be retained by the membranes, most of which have the pore size ranging from 100–500 nm (Table 1). The centrifuged process stream on the other hand shows a mean particle size less than 100 nm and so it is very likely that most of these particles would penetrate the filters.
As seen in Figure 3, for the case of direct microfiltration (Option 1), the permeate volume was much lower than when centrifugation was followed by microfiltration (Option 2). This is likely due to the larger particles in the fermentation broth. But when the broth was centrifuged at 8000 rpm for 30 min and then micro-filtered, the capacity of the filter increased by 10%. This indicates that centrifugation step is essential for removal of the solids in the broth in case of microfiltration. For the case of depth filtration (Option 3), PDK5 andPDH4 depth filters gave the highest capacity at the defined differential pressure of 1.5 bar and gave acceptable filtrate quality with turbidity (<75 NTU for PDK 5 and <40 NTU for PDH4).With PDD1, while lower turbidity values (<30 NTU) were obtained, the filter capacity was lower. EKS-P, EKMP, KS 50 P and PDE2 depth filters provide the turbidity values (<70 NTU) and if used would require a centrifugation step prior to depth filtration. All the filters gave acceptable product recovery (>95%) as analyzed by HPLC. Based on these results, PDK5 and PDH4 depth filters were identified for further evaluation.
Both micro-filters and depth filters exhibited exponential decrease in permeate volume with time, typical of a filtration process operated at constant pressure (Figure 4).The individual and combined models were applied to all cases and the best fit for the experimental data for each of these filters was identified based on sum of squared residuals (SSR) values.
Figure 2. (A) Average mean particle size distribution of the fermentation broth. (B) Average mean particle size distribution of the centrifuged process stream.
Bioengineering 01 00260 g002
Figure 3. Comparison of capacity and turbidity of the micro filter and depth filters.
Bioengineering 01 00260 g003
Figure 4. Volume vs. time data for individual models fit against the filter data for EKV. (A) Individual models. (B) Combined models.
Bioengineering 01 00260 g004

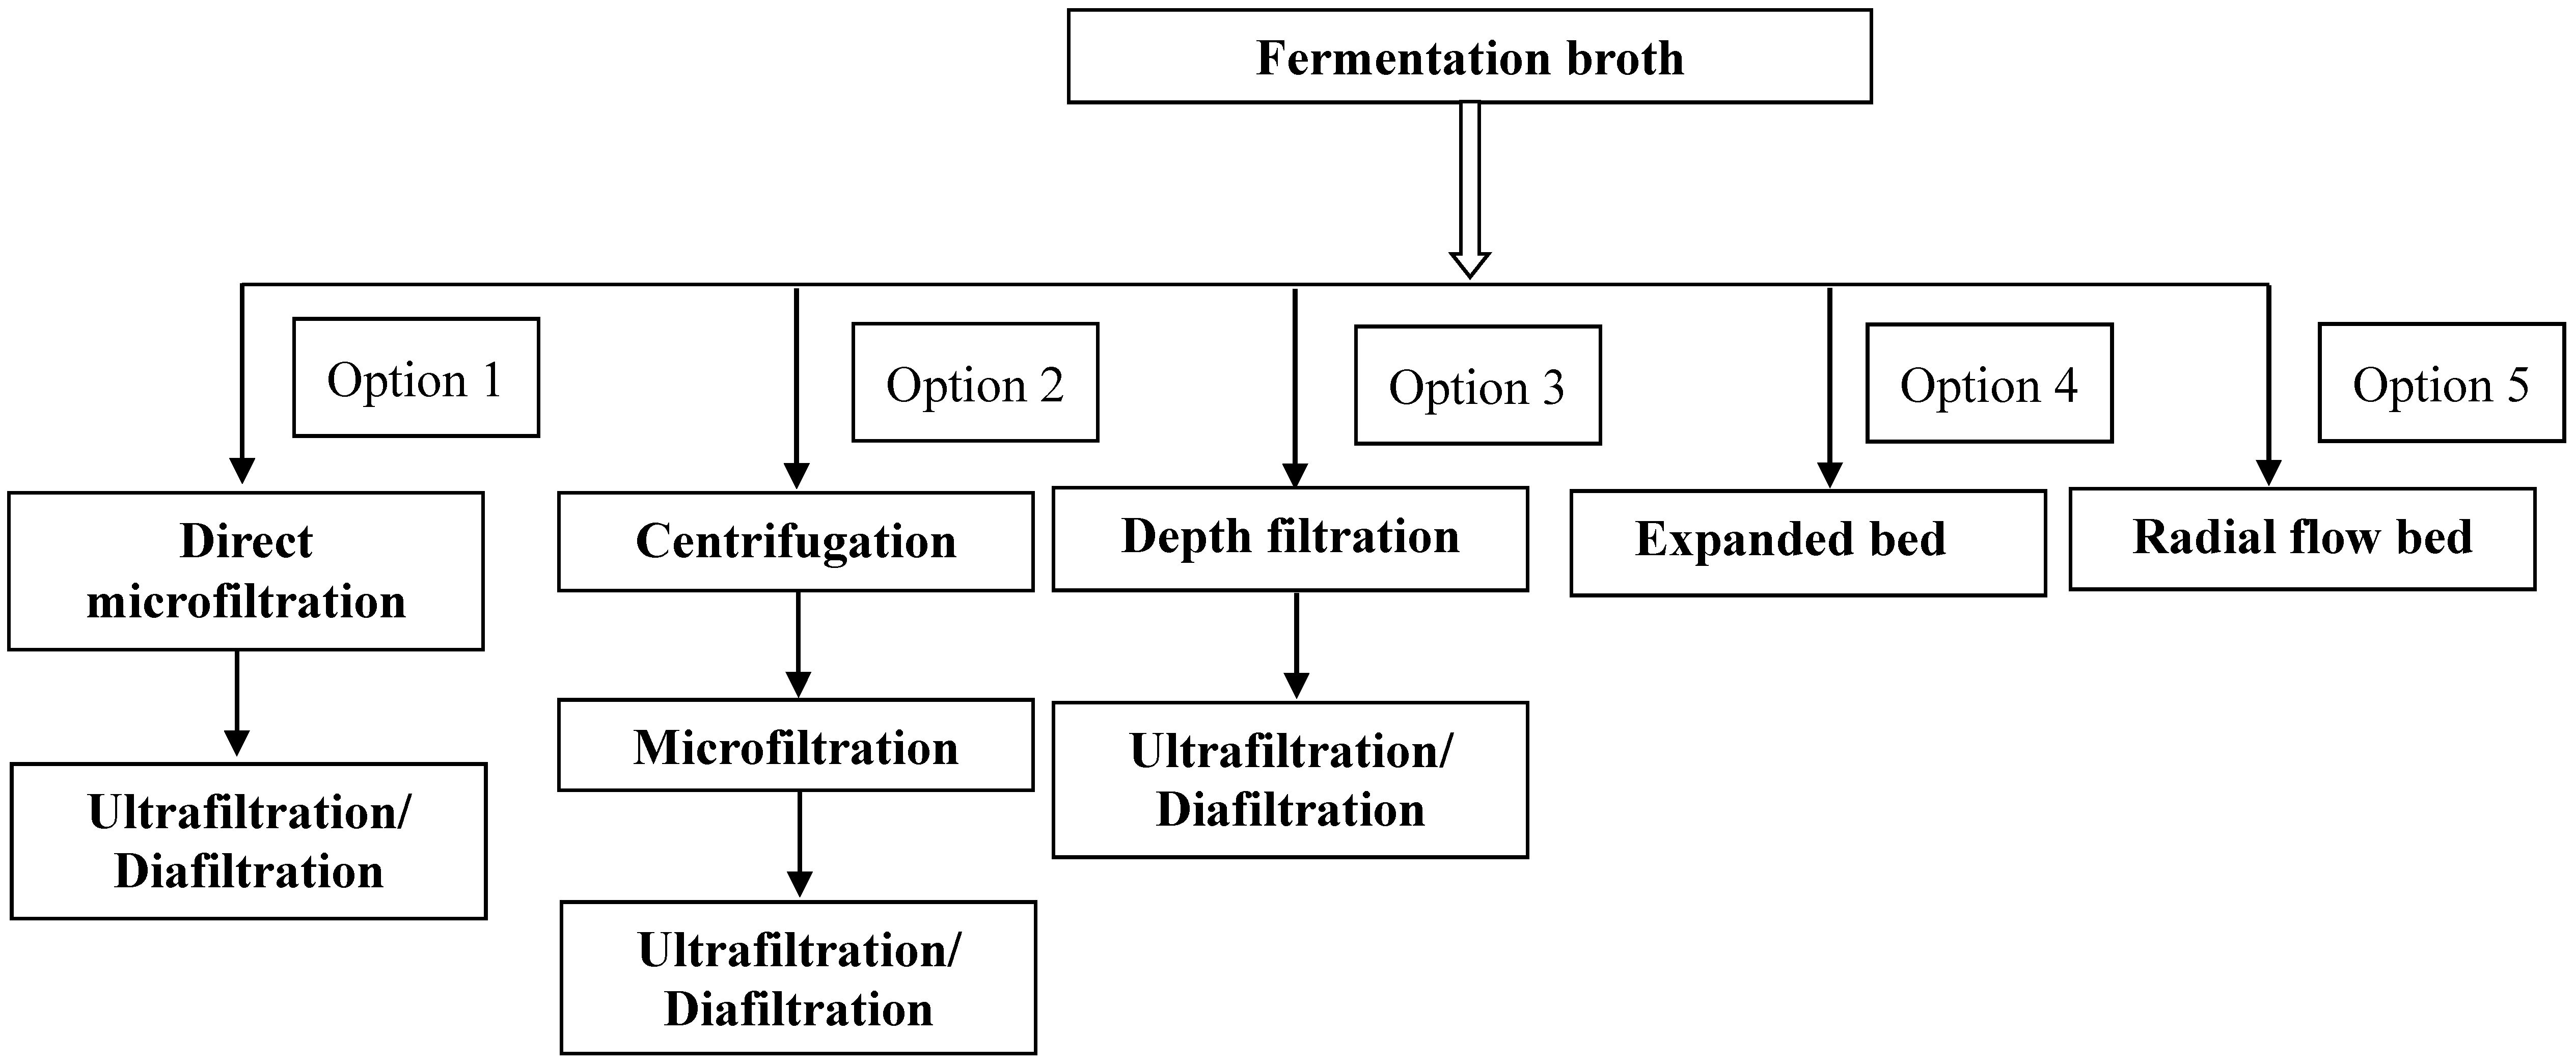
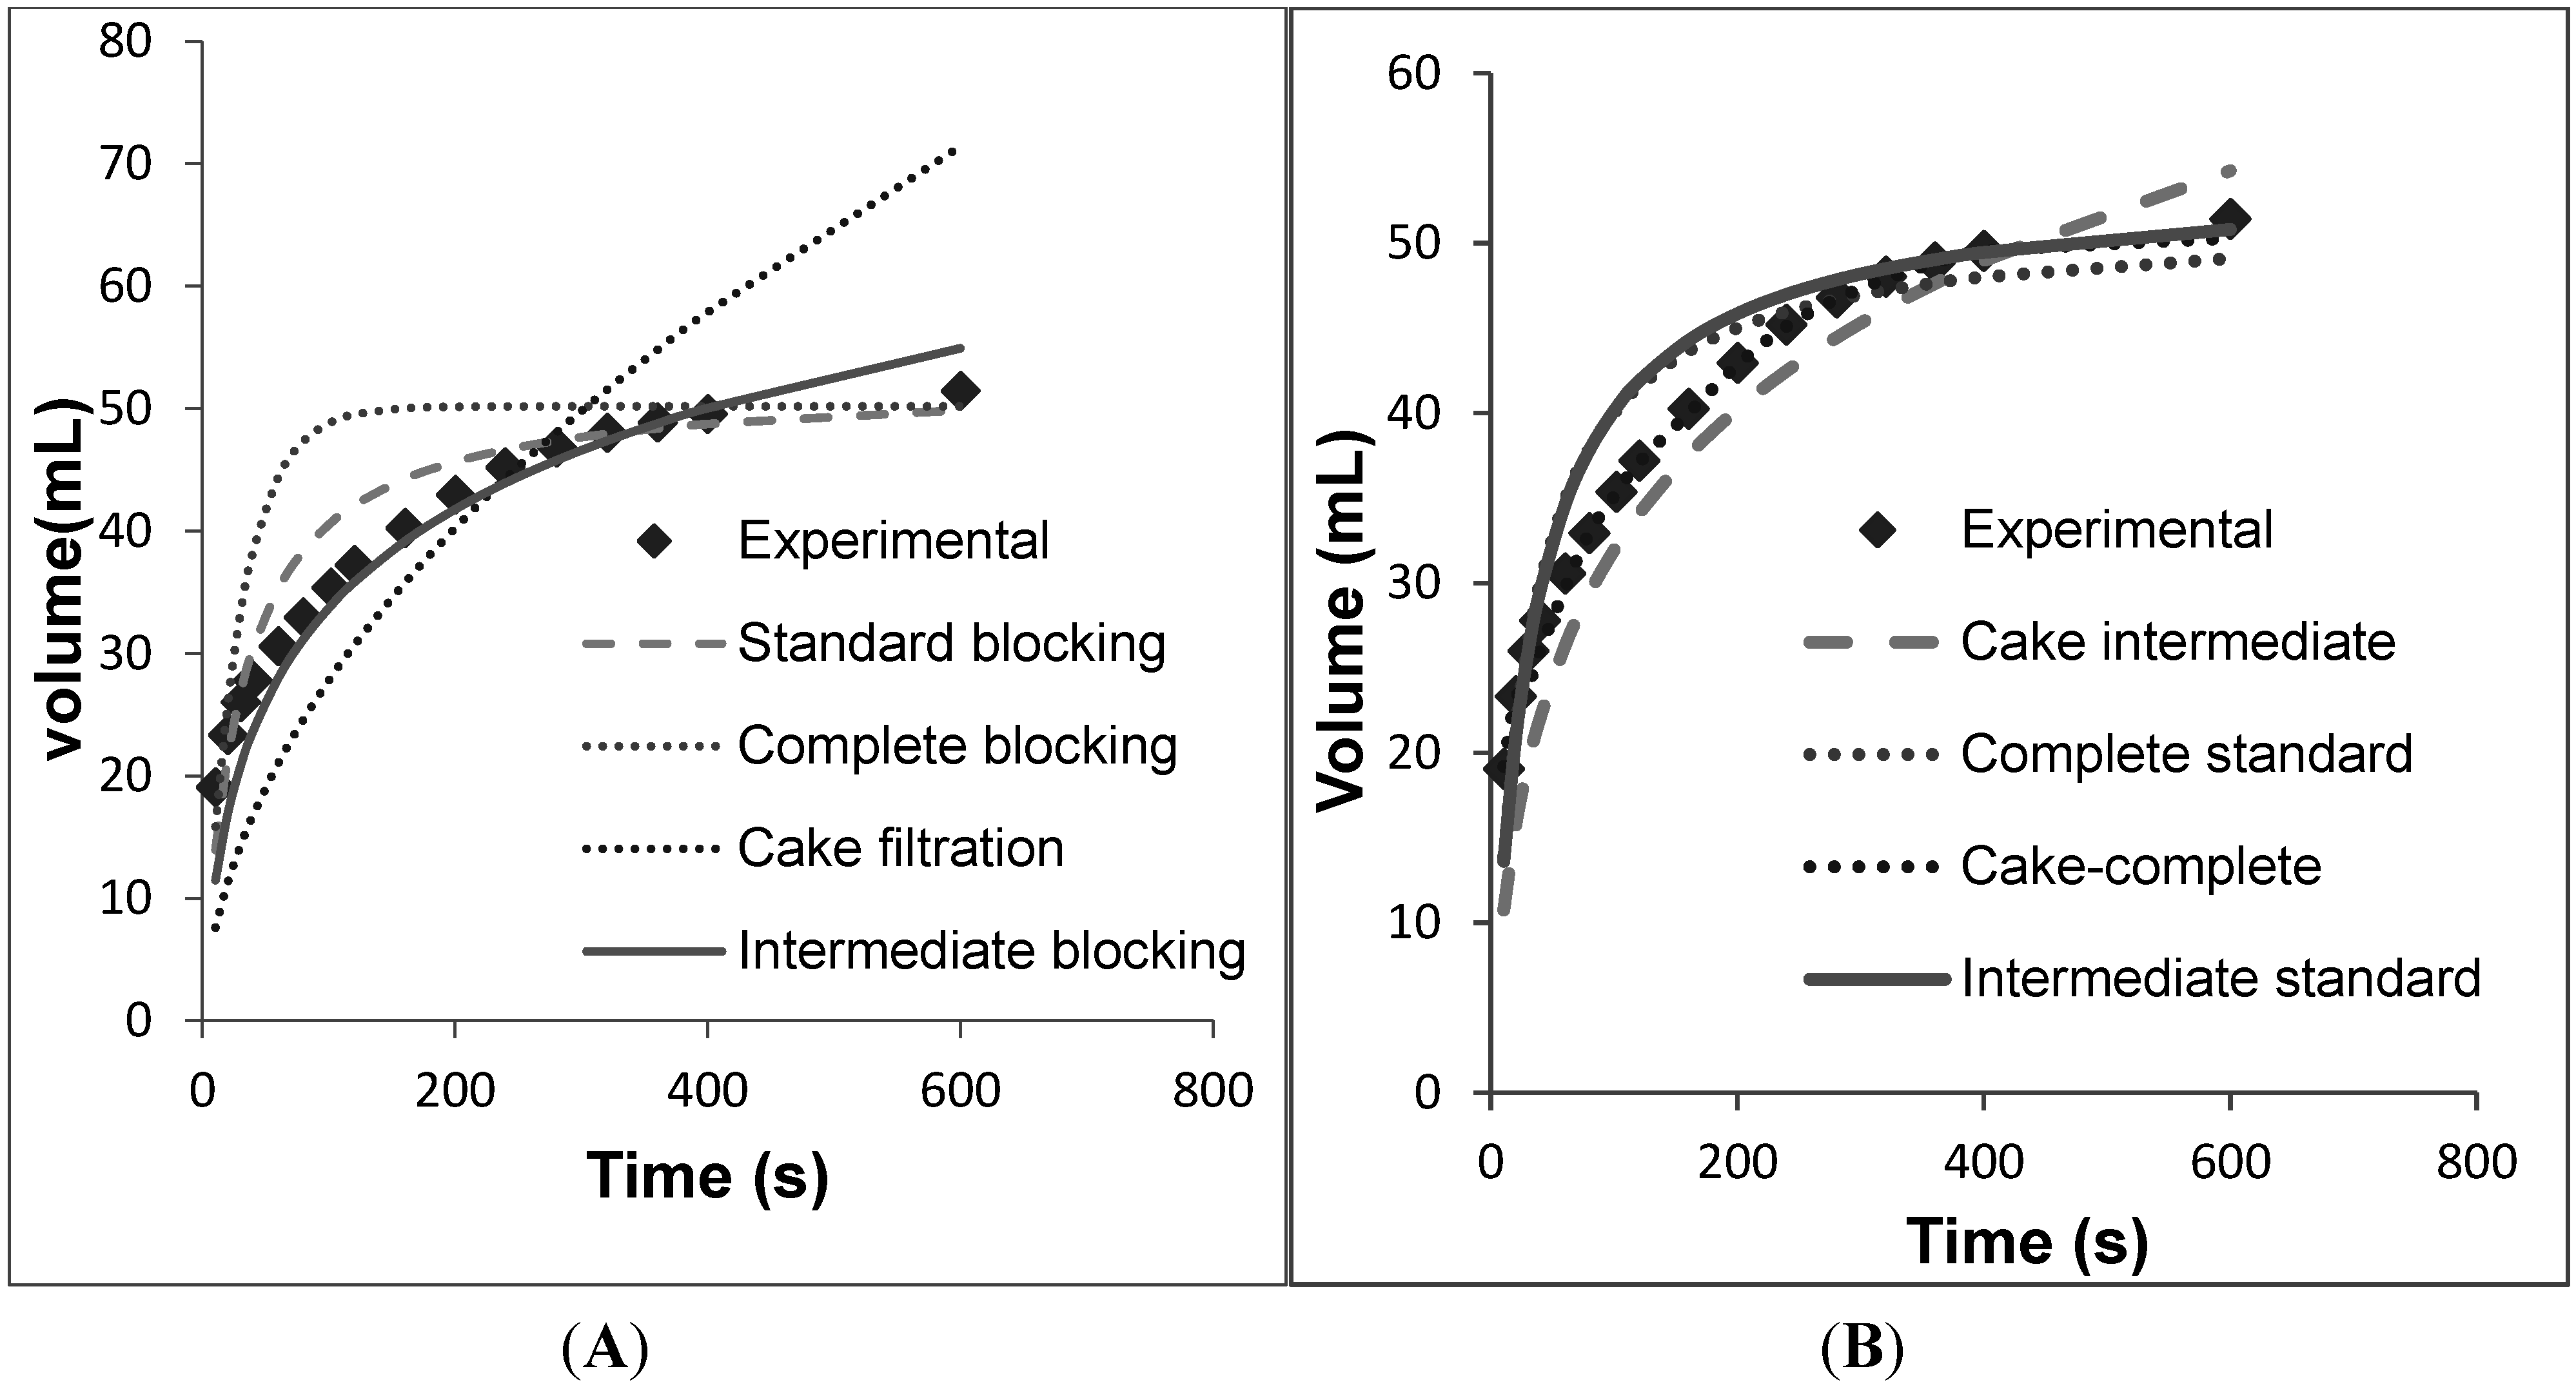
3.1. Direct Microfiltration (Option 1)

For this case, the fermentation broth was directly added to the feed vessel and constant pressure of 1.5 bars was applied. The mean particle diameter (0.24 µm) was approximately equal to the pore diameter of the membrane (0.2 µm). Hence, complete blocking occurred and the complete blocking model was able to explain the fouling that occurred (data not shown). As per this model, the particles completely seal off the pore and prevent the flow. Hence the permeate volume obtained was small (approximately 7 mL) compared to the other cases discussed below.

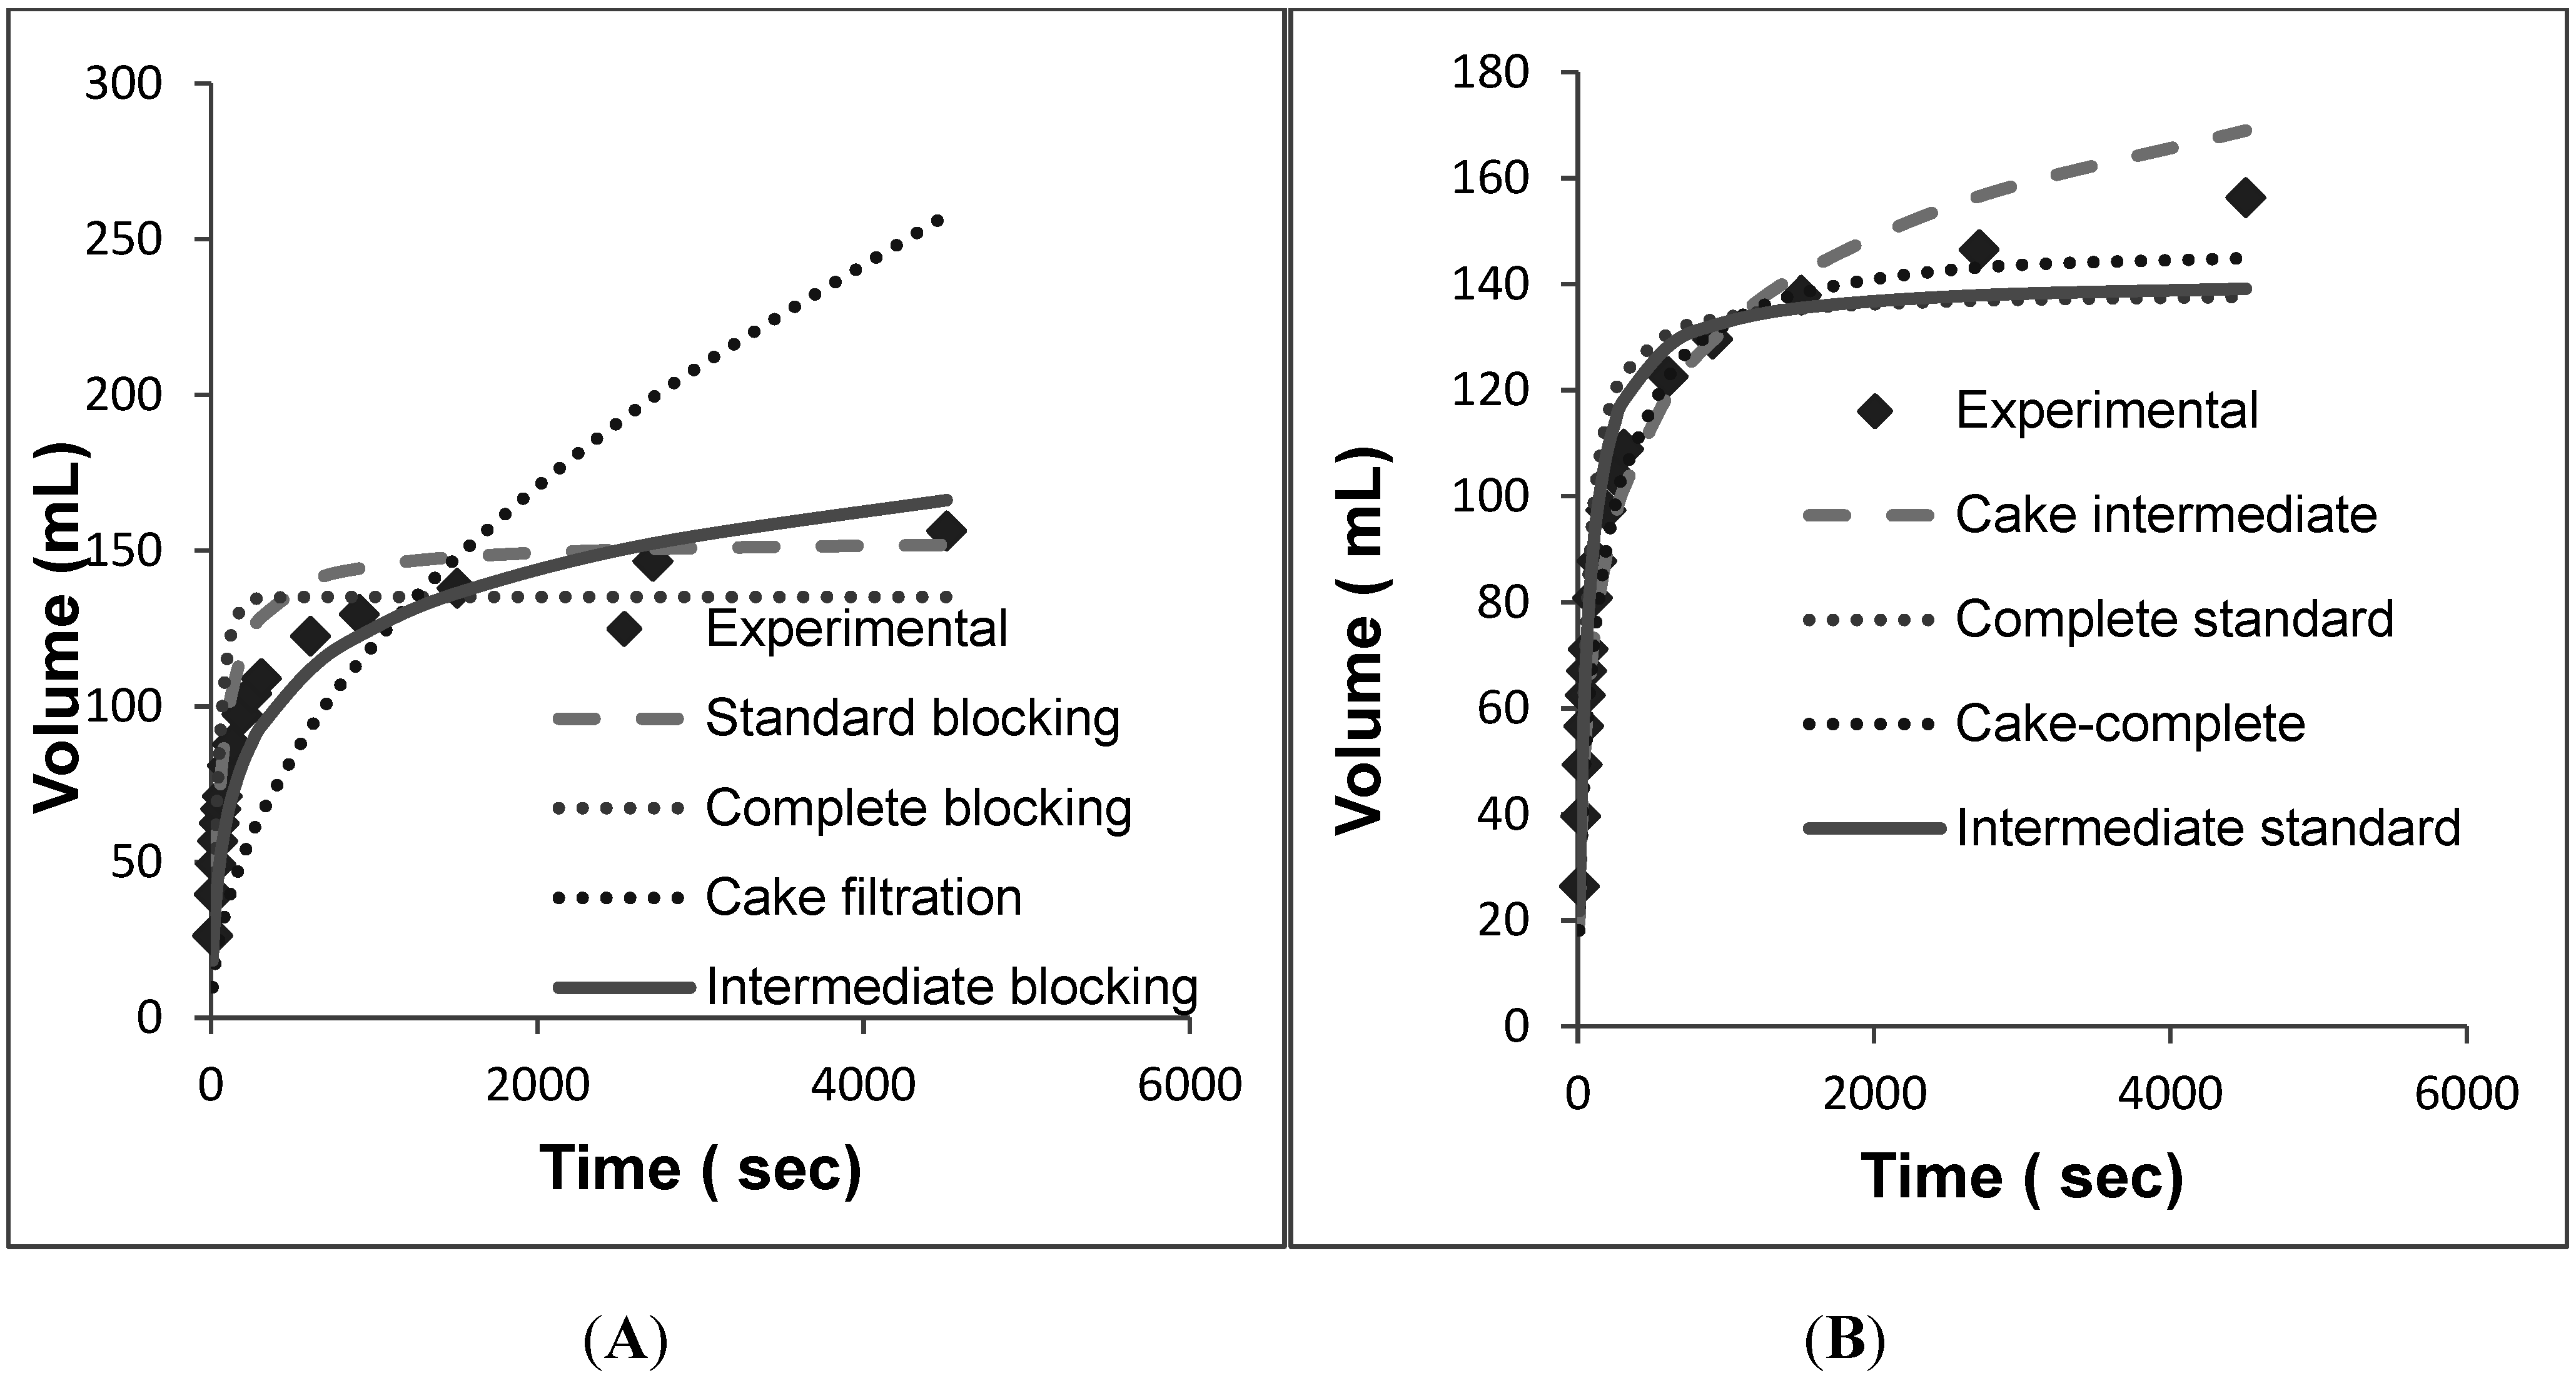
3.2. Centrifugation Followed by Microfiltration (Option 2)
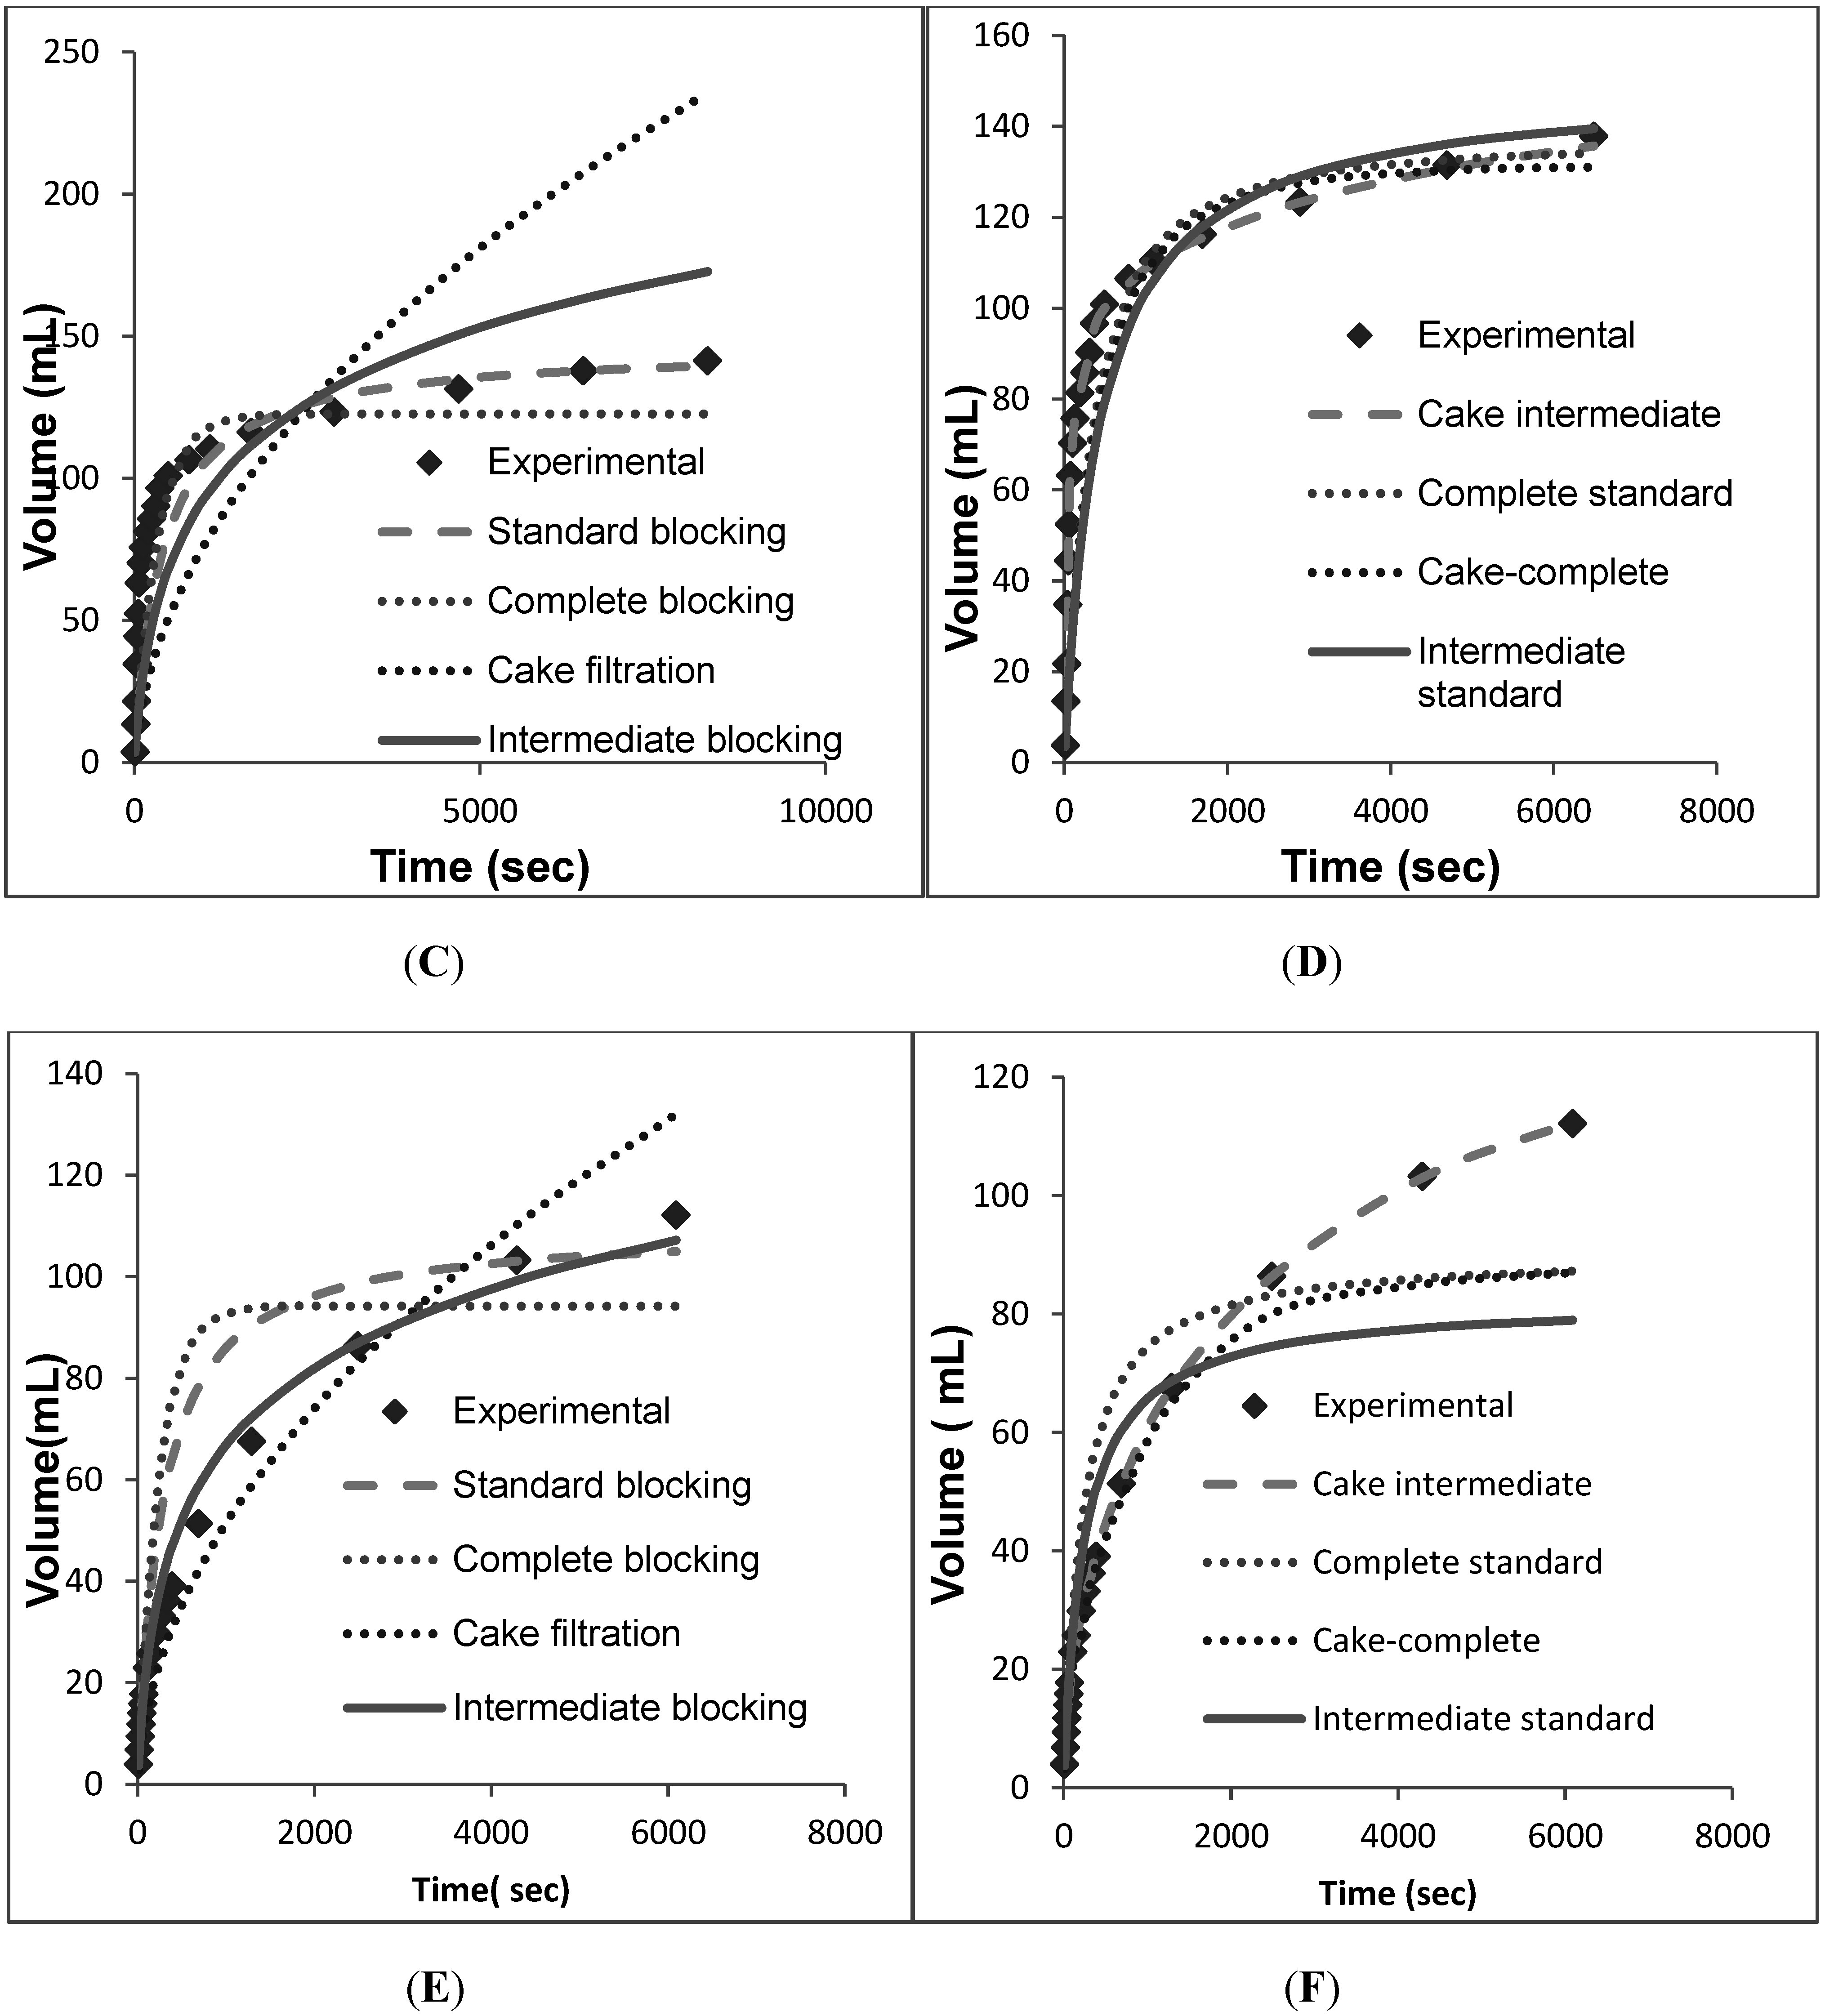
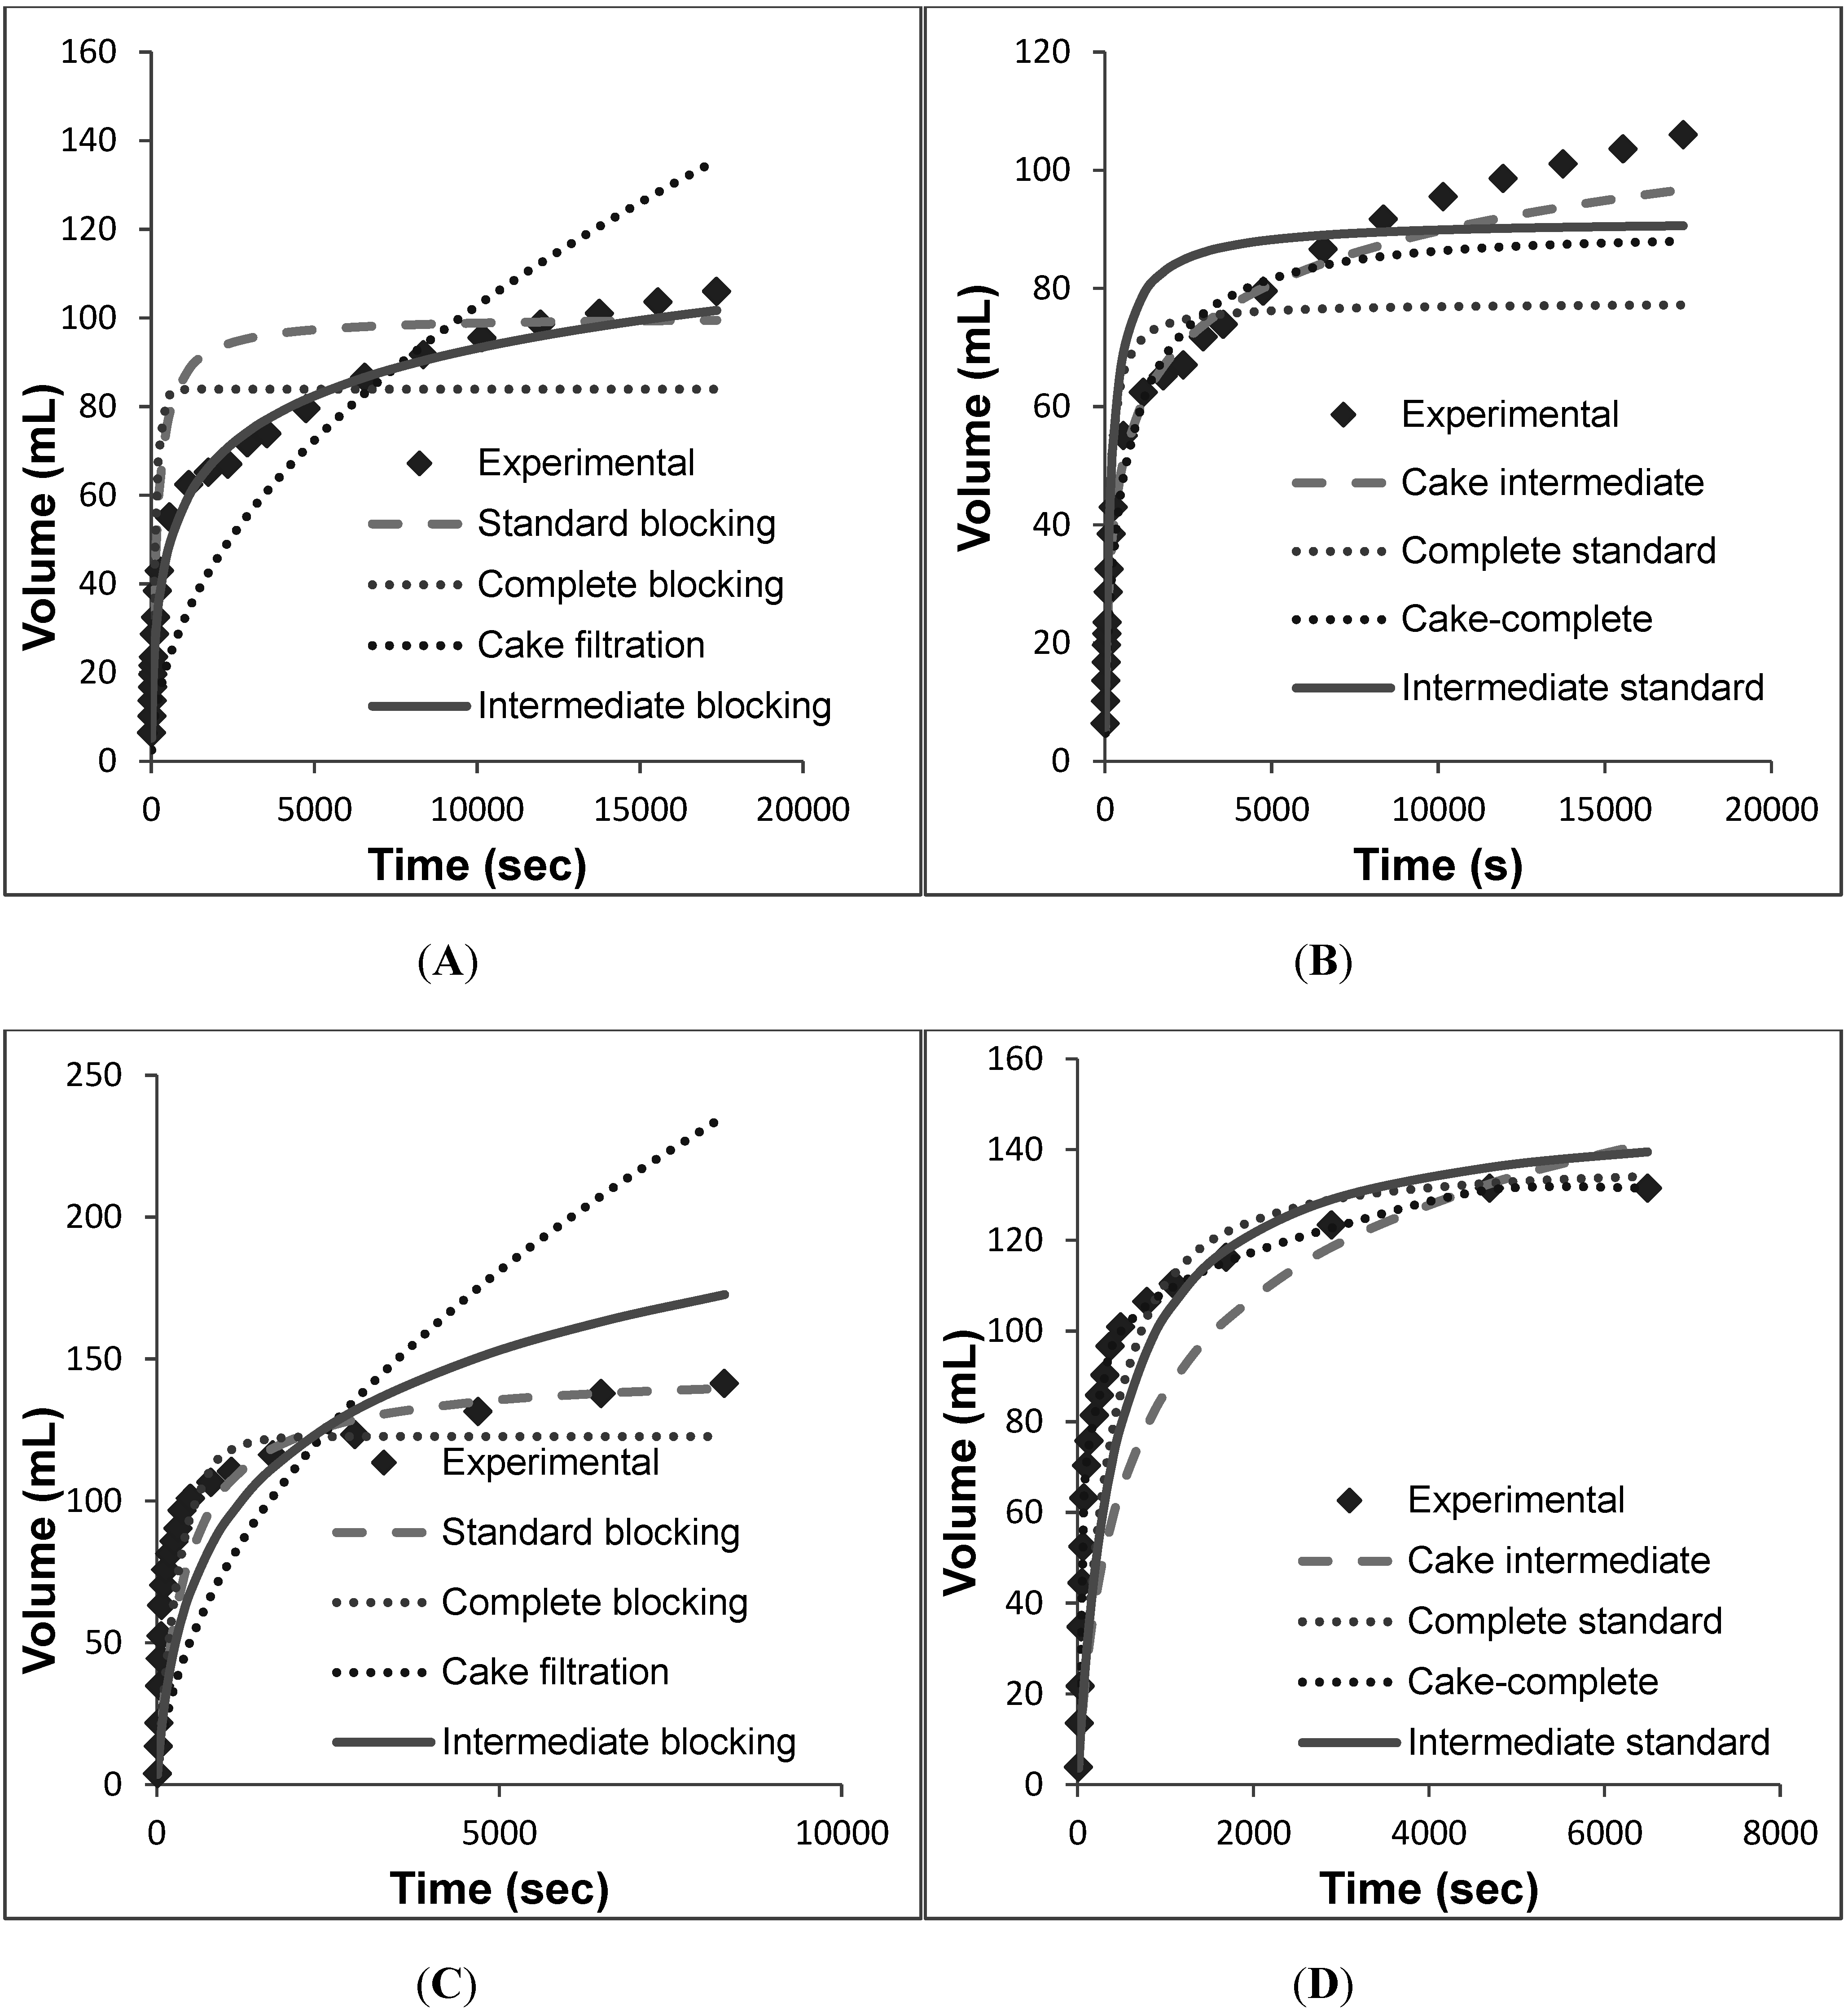
The fermentation broth was centrifuged at 8000 rpm for 30 min and then used for evaluation of the micro-filters. As mentioned above, the mean particle size was much smaller as compared to the pore diameter of the membrane. For the EKV filter, none of the four individual models mentioned above were able to explain fouling (Figure 4A). Of the four models, the intermediate blocking model provided the best fit for the data. However, significant deviations are observed between the intermediate blocking model and the experimental data, especially at the start of the operation and towards the end of the operation. This indicates that perhaps there are multiple mechanisms that are participating in the fouling of the EKV filter (as shown in Table 2).
Table 2. Summary of the combined models used for constant pressure dead end filtration.
ModelComponent mechanismEquationParametersModel
Cake-complete (6)Cake filtration, complete blocking V = J 0 K b ( 1 exp ( K b K c J 0 2 ( 1 + 2 K c J 0 2 t 1 ) ) ) Kc (s/m2),Cake-complete (6)
Kb (s−1)
Cake-intermediate (7)Cake filtration, intermediate blocking V = 1 K i ln ( 1 + K i K c J 0 ( ( 1 + 2 K c J 0 2 t ) 1 ) ) Kc (s/m2),Cake-intermediate (7)
Ki (m−1)
Complete-standard (8)Complete blocking, standard blocking V = J 0 K b ( 1 exp ( 2 K b t 2 + K s J 0 t ) ) Kb (s−1),Complete-standard (8)
Ks (m−1)
Intermediate-standard (9)Intermediate blocking, standard blocking V = 1 K i ln ( 1 + 2 k i j 0 t 2 + k s j 0 t ) Ki (m−1),Intermediate-standard (9)
Ks (m−1)
Thus, combinations of multiple models were tested (Figure 4B). As seen in Table 3, the combination of the cake filtration model and the complete blocking model yielded the best fit (SSR = 5.17). The best fit was determined by minimizing the sum of squared residuals (SSR) where the residual was equal to the difference between a data point and the model prediction. As per this model, during initial stages the particles seal off the pore entrance. As time progresses, particles accumulate on the membrane surface and form a cake (cake filtration).This could occur if caking and pore blockage are caused by different sets of particles in the feed stream. This might be possible if caking is caused by larger particles that are excluded by the membrane and pore blocking is caused by smaller particles that permeate the cake but are retained in the membrane pores. The individual contribution of the two models was quantified in terms of the coefficients, Kc and Kb, and it was observed that Kc is higher. Thus, cake filtration is the major contributor to fouling in this case.
Table 3. Comparison of the different models and values of the related parameters and the errors. The best fit for a given filter is shown in bold.
MechanismEKVPDK5PDH4PDE2EKMPKS50PEKSPPDD1
ParametersError fit (SSR)ParametersError fit (SSR)ParametersError fit (SSR)ParametersError fit (SSR)ParametersError fit (SSR)ParametersError fit (SSR)ParametersError fit (SSR)ParametersError fit (SSR)
Standard blockingKS = 87.98169.17KS = 29.912611.7KS = 32.6111,429KS = 41.913642.73KS = 45.845310.9KS = 32.6111,429KS = 107.38849.32KS = 50.631794.8
Intermediate blockingKi = 188 174.97Ki = 842756.1Ki = 5818,375Ki = 100322.59Ki = 1481460.5Ki = 5818,735Ki = 29736.07Ki = 100534.43
Complete blockingKb = 0.03581102.9Kb = 0.01948465.9Kb = 0.0033295.9Kb = 0.00427255.56Kb = 0.00745947Kb = 0.0039295.9Kb = 0.0072075.2Kb = 0.00392115.39
Cake filtrationKc = 1.1 × 1061337.3Kc = 7.02 × 10532,325Kc = 1.0 × 10643,477Kc = 3.49 × 1061147.116Kc = 9.8 × 1068372.8Kc = 1.45 × 10643,477Kc = 2.6 × 107587.15Kc = 3.0 × 1061351.2
Cake- CompleteKb = 0.0315.17Kb = 0.0181393.3Kb = 0.002810,962Kb = 0.0311059.88Kb = 0.0071.45 × 103Kb = 0.00281.106 × 102Kb = 0.00635.93Kb = 0.003189.63
Kc = 2.2 × 10⁵Kc = 7.5 × 10⁴Kc = 8.1 × 10⁴Kc = 4.95 × 10⁵Kc = 9.7 × 10⁵Kc = 8.1 × 10⁴Kc = 6.5 × 10⁶Kc = 4.9 × 10⁵
Cake-intermediateKc = 2.08 × 105294.96Ki = 501.23 × 10³Ki = 451.8 × 10²Ki = 353.66Kc = 9.7 × 104393.59Kc = 1.15 × 10431,831Kc = 2.6 × 10637.87Kc = 1.28 × 104297.81
Ki = 80Kc = 1.3 × 10⁴Kc = 1.15 × 10⁴Kc = 1.07 × 10⁴Ki = 95Ki = 60Ki = 120Ki = 38
Complete-standardKb = 0.0034147.41Kb = 0.0172169.8Kb = 0.002610,098Kb = 0.00282673.53Kb = 0.0074055.1Kb = 0.002610,091Kb = 0.006672.45Kb = 0.00281930
KS = 85KS = 13KS = 9.1KS = 32KS = 25KS = 9.1KS = 60KS = 32
Intermediate-standardKi = 62154.73Ki = 211241.8Ki = 2012,040Ki = 502508.66Ki = 452544Ki = 2012,101Ki = 150419.28Ki = 50896.01
KS = 38KS = 16KS = 15KS = 20KS = 18KS = 15KS = 20KS = 20

3.3. Depth Filtration (Option 3)

The fermentation broth was directly loaded on different depth filters (PDH4, PDE2, EKMP, KS50P, EKSP, PDD1, and PDK5). Figure 5 and Figure 6 illustrate the performance of the individual models as well as that of the combined models for the all the seven depth filters. It was seen that of all the single models, the intermediate blocking model comes closest to fitting the data. However, in all cases significant amount of error exists between the prediction of the intermediate blocking model and the actual experimental data. As mentioned above, Pegel et al. [24] have also screened different depth filters for cell separation and harvest clarification. Our flux for Pall PDK5 is approximately half of what they achieved with Pall PDK6. Besides the difference in feed material, the reasons for this difference could be the fact that the authors used constant flow rate for operation while we used constant pressure.
Hence, various combinations of the four models were tested for fitting of the experimental data for all cases. It is observed that a combination of intermediate blocking and cake filtration models provides the best fit for three of the cases (PDK5, PDH4 and PDE2), while the combination of complete blocking and cake filtration provides the best fit for PDD1,EKSP, EKMP and KS50P. A review of the information about these filters (Table 1) suggests that EKMP, EKSP, PDD1and KS50P have relatively smaller pores (0.1–0.8 µm), while PDK5, PDH4 and PDE2 have much larger pores (0.2–20 µm). Hence, it is likely that the particles tend to either completely block the pores (as in complete blocking of smaller pores) or gradually block them (as in intermediate blocking or larger pores). Eventually, as time passes by cake filtration emerges as the dominant mechanism of filter fouling.
Figure 5. Volume vs. time data for individual models fit against the individual and combined models. (A) Individual models for PDK5. (B) Combined models for PDK5. (C) Individual models for PDH4. (D) Combined models for PDH4. (E) Individual models for PDE2. (F) Combined models for PDE2.
Bioengineering 01 00260 g005aBioengineering 01 00260 g005b
Figure 6. Volume vs. time data for individual models fit against the individual and combined models. (A) Individual models for EKMP. (B) Combined models for EKMP. (C) Individual models for KS50P. (D) Combined models for KS50P. (E) Individual models for EKSP. (F) Combined models for EKSP. (G) Individual models for PDD1. (H) Combined models for PDD1.
Bioengineering 01 00260 g006aBioengineering 01 00260 g006b

3.4. Discussion

Table 3 lists the best plotting model (single or combination) for the corresponding experimental data. The parameters derived from modeling are also shown along with the error fit (SSR). With most depth filters, maximum capacity was achieved for the filters whose pore size is less than 0.8 µm. whereas for the filters with pore size greater than 0.8 µm, the maximum capacity was not achieved. It is seen that for the cases where the pores of the depth filter are smaller (0.1–0.8 µm), a combination of complete blocking and cake filtration provides the best fit. Further in these cases, the contribution from the complete blocking is quite small when compared to that from cake filtration (Kb is about 107 times smaller than Kc). Hence, in these situations, cake filtration dominates. However, for cases when the pore size of the depth filter is large (0.2–20 µm), a combination of intermediate blocking and cake filtration provides the best fit. The difference in the coefficients for these cases is significantly smaller (103 times), thus indicating that in these cases both mechanisms contribute significantly. The work presented here can be used to predict the blocking mechanism based on the filter pore size and this model can then be used for filter sizing.
The main advantages of using the single use system are the minimal residual liquid observed during system break-down as compared to the traditional filtration system installed in stainless-steel housings. This significantly reduces the cleaning time for equipment and the process suite as no CIP or cleaning validation studies are required. The single use systems also require shorter cycle times and reduced manufacturing costs. Further, based on these results, we can calculate the optimum area required for the filter at the large scale.

4. Conclusions

Modeling for filtration of a therapeutic product expressed in Pichia pastoris at constant pressure is the focus of this paper. It is observed that none of the individual models yield a satisfactory fit of the data by themselves, thus indicating that more than one fouling mechanism is at work. We were able to correlate the dominating fouling mechanism to the structure of the filter, most notably the pore size distribution. Depth filters with smaller pores were found to undergo fouling via complete pore blocking followed by cake filtration. On the other hand, depth filters with larger pores were found to undergo fouling via intermediate pore blocking followed by cake filtration. The approach proposed here can be used for modeling of microfiltration and depth filtration steps and such modeling can be very useful in accurate sizing of the filters.

Nomenclature

A
Available membrane frontal area (m2)
J0
Initial flux (m/s)
Kb
Complete blocking constant (s−1)
Kc
Cake filtration constant (s/m2)
Ki
Intermediate blocking constant (m−1)
Ks
Standard blocking constant (m−1)
T
Time (s)
V
Volume filtered through available membrane area (m3/m2)

Acknowledgements

We would like to thank Pall Life Sciences (Bangalore, India) for providing us the consumable items used in this investigation.

Author Contributions

MS performed the experiments and data analysis. AS contributed towards modeling and manuscript writing. ASR contributed towards planning of experiments, analysis of the data and manuscript writing. All authors have read and approved the final manuscript.

Conflicts of Interest

The authors declare no conflict of interest.

References

  1. Cregg, J.M.; Vedvick, T.S.; Raschke, W.C. Recent advances in the expression of foreign genes in Pichiapastoris. Nat. Biotechnol. 1993, 11, 905–910. [Google Scholar] [CrossRef]
  2. Cregg, J.M.; Cereghino, J.L.; Shi, J.; Higgins, D.R. Recombinant protein expression in Pichiapastoris. Mol. Biotechnol. 2000, 16, 23–52. [Google Scholar] [CrossRef] [PubMed]
  3. Kobayashi, K.; Kuwae, S.; Ohya, T.; Ohda, T.; Ohyama, M.; Ohi, H.; Ohmura, T. High-level expression of recombinant human serum albumin from the methylotrophic yeast Pichia pastoris with minimal protease production and activation. J. Biosci. Bioeng. 2000, 89, 55–61. [Google Scholar] [CrossRef] [PubMed]
  4. Schmidt, F.R. Recombinant expression systems in the pharmaceutical industry. Appl. Microbiol. Biotechnol. 2004, 65, 363–372. [Google Scholar] [CrossRef] [PubMed]
  5. Zhang, W.; Inan, M.; Meagher, M.M. Fermentation strategies for recombinant protein expression in the methylotrophic yeast Pichia pastoris. Biotechnol. Bioprocess Eng. 2000, 5, 275–287. [Google Scholar] [CrossRef]
  6. Van Reis, R.; Zydney, A. Bioprocess membrane technology. J. Membr. Sci. 2007, 297, 16–50. [Google Scholar] [CrossRef]
  7. Wang, A.; Lewus, R.; Rathore, A.S. Comparison of different options for harvest of a therapeutic protein product from high cell density yeast fermentation broth. Biotechnol. Bioeng. 2006, 94, 91–104. [Google Scholar] [CrossRef] [PubMed]
  8. Russell, E.; Wang, A.; Rathore, A.S. Harvest of a Therapeutic Protein Product from High Cell Density Fermentation Broths. In Process Scale Bioseparations for the Biopharmaceutical Industry; CRC Press: Boca Raton, FL, USA, 2006; pp. 1–58. [Google Scholar]
  9. Charcosset, C. Membrane processes in biotechnology: An overview. Biotechnol. Adv. 2006, 24, 482–492. [Google Scholar] [CrossRef] [PubMed]
  10. Rathore, A.S.; Shirke, A. Recent Developments in Membrane-Based Separations in Biotechnology Processes—Review. Prep. Biochem. Biotechnol. 2011, 41, 307–315. [Google Scholar] [CrossRef]
  11. Carrere, H.; Blaszkowa, F.; Roux de Balmann, H. Modelling the microfiltration of lactic acid fermentation broths and comparison of operating modes. Desalination 2002, 145, 201–206. [Google Scholar] [CrossRef] [Green Version]
  12. Grenier, A.; Meireles, M.; Aimar, P.; Carvin, P. Analysing flux decline in dead-end filtration. Chem. Eng. Res. Des. 2008, 86, 1281–1293. [Google Scholar] [CrossRef] [Green Version]
  13. Yuan, W.; Kocic, A.; Zydney, A.L. Analysis of humic acid fouling during microfiltration using a pore blockage-cake filtration model. J. Membr. Sci. 2002, 198, 51–62. [Google Scholar] [CrossRef]
  14. Rathore, A.S.; Kumar, V.; Arora, A.; Lute, S.; Brorson, K.; Shukla, A. Mechanistic modeling of viral filtration. J. Membr. Sci. 2014, 458, 96–103. [Google Scholar] [CrossRef]
  15. Hermia, J. Constant pressure blocking filtration laws—Application to power-law non-Newtonian fluids. Trans. I Chem E. 1982, 60, 183–187. [Google Scholar]
  16. Hale, M.B.; Daniels, W.F. A preliminary study of depth filtration at a constant rate. J. Biochem. Microb. Technol. Eng. 1961, 3, 139–150. [Google Scholar] [CrossRef]
  17. Guell, C.; Czekaj, P.; Davis, R.H. Microfiltration of protein mixtures and the effects of yeast on membrane fouling. J. Membr. Sci. 1999, 155, 113–122. [Google Scholar] [CrossRef]
  18. Ho, C.C.; Zydney, A.L. A combined pore blockage and cake filtration model for protein fouling during microfiltration. J. Colloid. Interf. Sci. 2000, 232, 389–399. [Google Scholar] [CrossRef]
  19. Velasco, C.; Ouammou, M.; Calvo, J.I.; Hernandez, A. Protein fouling in microfiltration: Deposition mechanism as a function of pressure for different pH. J. Colloid. Interf. Sci. 2003, 266, 148–152. [Google Scholar] [CrossRef]
  20. Schick, K. Enhancing dead end filtration throughput using a non-traditional liquid handling procedure. Filtr. Sep. 2003, 40, 30–33. [Google Scholar] [CrossRef]
  21. Kim, J.; DiGiano, F.A. Fouling models for low-pressure membrane systems. Sep. Purif. Technol. 2009, 68, 293–304. [Google Scholar] [CrossRef]
  22. Ochirkhuyag, B.; Mori, T.; Katsuoka, T.; Satone, H.; Tsubaki, J.; Choi, H.; Sugimoto, T. Development of a high-performance cake-less continuous filtration system. Chem. Eng. Sci. 2008, 63, 5274–5282. [Google Scholar] [CrossRef]
  23. Hong, S.; Krishna, P.; Hobbs, C.; Kim, D.; Cho, J. Variations in backwash efficiency during colloidal filtration of hollow-fiber microfiltration membranes. Desalination 2005, 173, 257–268. [Google Scholar] [CrossRef]
  24. Pegel, A.; Ubele, F.; Reiser, S.; Muller, D.; Dudziak, G. Evaluation of disposable systems for harvesting high cell density fed batch processes. BMC Proceedings 2011, 5. [Google Scholar] [CrossRef]
  25. Bowen, W.R.; Calvo, J.I.; Hernandez, A. Steps of membrane blocking in flux decline during protein microfiltration. J. Membr. Sci. 1995, 101, 153–165. [Google Scholar] [CrossRef]
  26. Bolton, G.; LaCasse, D.; Kuriyel, R. Combined models of membrane fouling: Development and application to microfiltration and ultrafiltration of biological fluids. J. Membr. Sci. 2006, 277, 75–84. [Google Scholar] [CrossRef]

