Development of a New Detection Algorithm to Identify Acute Coronary Syndrome Using Electrochemical Biosensors for Real-World Long-Term Monitoring


Abstract
:1. Introduction
- Preservation of the biosensors;
- Variability between batches of biosensors;
- Effect of medications on the physical properties of blood;
- Presence of interfering analytes in blood;
- Sampling conditions affected by patient routine;
- Variability between samples (e.g., different times of the day and sample volume).
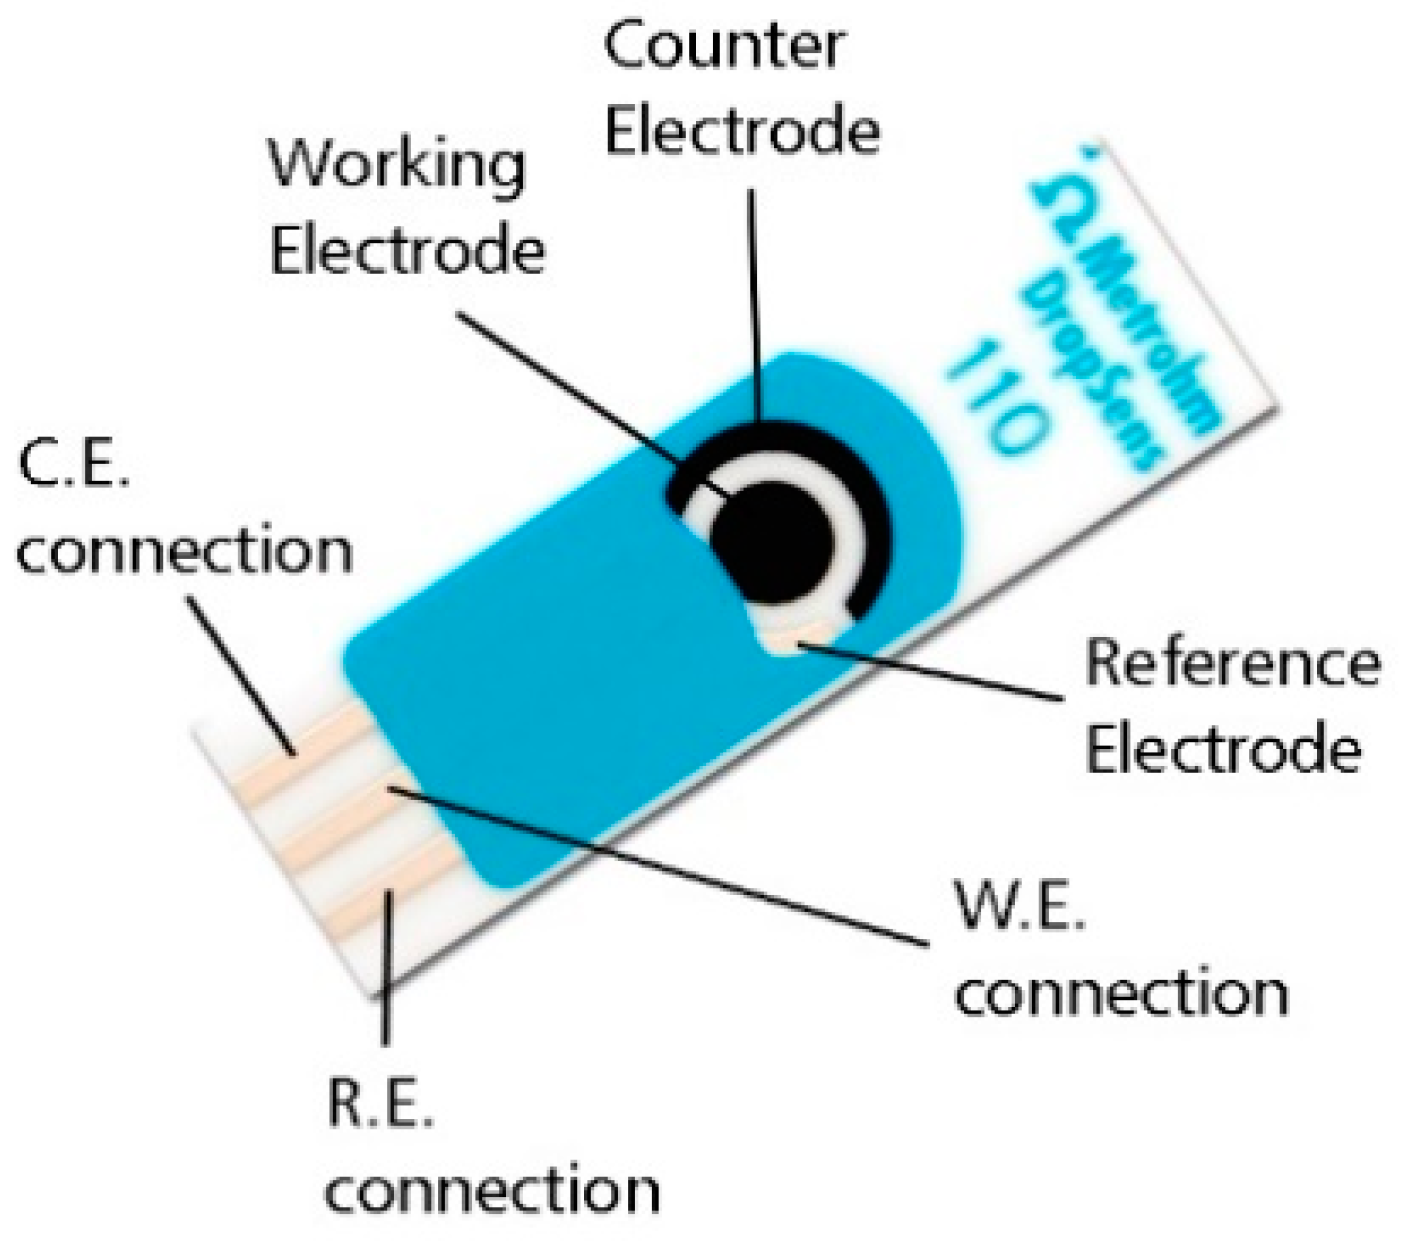
2. Materials & Methods
3. Results
3.1. General Results
3.2. Logistic Regression Model
4. Discussion
5. Conclusions
Supplementary Materials
Author Contributions
Funding
Institutional Review Board Statement
Informed Consent Statement
Data Availability Statement
Acknowledgments
Conflicts of Interest
References
- Cardiovascular Diseases (CVDs). Available online: https://www.who.int/news-room/fact-sheets/detail/cardiovascular-diseases-(cvds) (accessed on 7 April 2020).
- Wilkins, E.; Wickramasinghe, K.; Bhatnagar, P.; Leal, J.; Luengo-Fernandez, R.; Burns, R.; Rayner, M.; Townsend, N. European Cardiovascular Disease Statistics 2017. Eur. Heart Netw. 2017, 3, 11–35. [Google Scholar]
- Mahler, S.A.; Lenoir, K.M.; Wells, B.J.; Burke, G.L.; Duncan, P.W.; Case, L.D.; Herrington, D.M.; Diaz-Garelli, J.-F.; Futrell, W.M.; Hiestand, B.C.; et al. Safely Identifying Emergency Department Patients with Acute Chest Pain for Early Discharge: The HEART Pathway Accelerated Diagnostic Protocol. Circulation 2018, 138, 2456–2468. [Google Scholar] [CrossRef] [PubMed]
- Herlitz, J.; WireklintSundström, B.; Bång, A.; Berglund, A.; Svensson, L.; Blomstrand, C. Early Identification and Delay to Treatment in Myocardial Infarction and Stroke: Differences and Similarities. Scand. J. Trauma Resusc. Emerg. Med. 2010, 18, 48. [Google Scholar] [CrossRef] [PubMed] [Green Version]
- Redón, P.; Shahzad, A.; Iqbal, T.; Wijns, W. Benefits of Home-Based Solutions for Diagnosis and Treatment of Acute Coronary Syndromes on Health Care Costs: A Systematic Review. Sensors 2020, 20. [Google Scholar] [CrossRef]
- Upasham, S.; Tanak, A.; Prasad, S. Cardiac Troponin Biosensors: Where Are We Now? Adv. Health Care Technol. 2018, 4, 1–13. [Google Scholar] [CrossRef] [Green Version]
- Abdorahim, M.; Rabiee, M.; Alhosseini, S.N.; Tahriri, M.; Yazdanpanah, S.; Alavi, S.H.; Tayebi, L. Nanomaterials-Based Electrochemical Immunosensors for Cardiac Troponin Recognition: An Illustrated Review. Trac Trends Anal. Chem. 2016, 82, 337–347. [Google Scholar] [CrossRef]
- Pedrero, M.; Campuzano, S.; Pingarrón, J.M. Electrochemical Biosensors for the Determination of Cardiovascular Markers: A Review. Electroanalysis 2014, 26, 1132–1153. [Google Scholar] [CrossRef]
- Dean, S.N.; Shriver-Lake, L.C.; Stenger, D.A.; Erickson, J.S.; Golden, J.P.; Trammell, S.A. Machine Learning Techniques for Chemical Identification Using Cyclic Square Wave Voltammetry. Sensors 2019, 19. [Google Scholar] [CrossRef] [Green Version]
- Romero Bonilla, H.; Ramírez-Morales, I.; Romero Flores, C.; Romero Bonilla, H.; Ramírez-Morales, I.; Romero Flores, C. Automatic classification of water samples using an optimized SVM model applied to cyclic voltammetry signals. Vitae 2019, 26, 94–103. [Google Scholar] [CrossRef]
- Parwaiz, S.; Malik, O.A.; Pradhan, D.; Khan, M.M. Machine-Learning-Based Cyclic Voltammetry Behavior Model for Supercapacitance of Co-Doped Ceria/RGO Nanocomposite. J. Chem. Inf. Model 2018, 58, 2517–2527. [Google Scholar] [CrossRef]
- Lokhande, P.; Chavan, U. Cyclic Voltammetry Behavior Modeling of Fabricated Nanostructured Ni(OH)2 Electrode Using Artificial Neural Network for Supercapacitor Application. Proc. Inst. Mech. Eng. Part C: J. Mech. Eng. Sci. 2020, 234, 2563–2568. [Google Scholar] [CrossRef]
- Rubini Gimenez, M.; Twerenbold, R.; Reichlin, T.; Wildi, K.; Haaf, P.; Schaefer, M.; Zellweger, C.; Moehring, B.; Stallone, F.; Sou, S.M.; et al. Direct Comparison of High-Sensitivity-Cardiac Troponin I vs. T for the Early Diagnosis of Acute Myocardial Infarction. Eur. Heart J. 2014, 35, 2303–2311. [Google Scholar] [CrossRef] [Green Version]
- Bhoi, S.; Verma, P.; Vankar, S.; Galwankar, S. High Sensitivity Troponins and Conventional Troponins at the Bedside. Int. J. Crit. Illn. Inj. Sci. 2014, 4, 253–256. [Google Scholar] [CrossRef] [Green Version]
- Apple, F.S.; Parvin, C.A.; Buechler, K.F.; Christenson, R.H.; Wu, A.H.B.; Jaffe, A.S. Validation of the 99th Percentile Cutoff Independent of Assay Imprecision (CV) for Cardiac Troponin Monitoring for Ruling out Myocardial Infarction. Clin. Chem. 2005, 51, 2198–2200. [Google Scholar] [CrossRef] [PubMed] [Green Version]
- Ibanez, B.; James, S.; Agewall, S.; Antunes, M.J.; Bucciarelli-Ducci, C.; Bueno, H.; Caforio, A.L.P.; Crea, F.; Goudevenos, J.A.; Halvorsen, S.; et al. 2017 ESC Guidelines for the Management of Acute Myocardial Infarction in Patients Presenting with ST-Segment Elevation. Eur. Heart J. 2018, 39, 119–177. [Google Scholar] [CrossRef] [PubMed] [Green Version]
- Twerenbold, R.; Rubini Gimenez, M.; Nestelberger, T.; Boeddinghaus, J.; Wildi, K.; Mueller, C. Optimising the Early Rule-out and Rule-in of Myocardial Infarction Using Biomarkers. Cardiovasc. Med. 2019, 22. [Google Scholar] [CrossRef] [Green Version]
- Aldous, S.J.; Richards, M.; Cullen, L.; Troughton, R.; Than, M. Diagnostic and Prognostic Utility of Early Measurement with High-Sensitivity Troponin T Assay in Patients Presenting with Chest Pain. CMAJ 2012, 184, E260–E268. [Google Scholar] [CrossRef] [PubMed] [Green Version]
- Metrohm Metrohm Autolab Compact Potentiostat/Galvanostat Instruments. Available online: https://www.metrohm.com/en/products/electrochemistry/autolab-compact-line/PGSTAT204 (accessed on 14 July 2020).
- Matlab Version 9.5.0.4444 (2018b); The Mathworks, Inc.: Natick, MA, USA, 2018.
- IBM Corporation. IBM SPSS Statistics for Windows; IBM Corporation: Armonk, NY, USA, 2016. [Google Scholar]
- Calderon, J.M.; Álvarez-Pitti, J.; Cuenca, I.; Ponce, F.; Redon, P. Development of a Minimally Invasive Screening Tool to Identify Obese Pediatric Population at Risk of Obstructive Sleep Apnea/Hypopnea Syndrome. Bioengineering 2020, 7. [Google Scholar] [CrossRef]
- Šimundić, A.-M. Measures of Diagnostic Accuracy: Basic Definitions. EJIFCC 2009, 19, 203–211. [Google Scholar]
- Tharwat, A. Classification Assessment Methods. Appl. Comput. Inform. 2018. [Google Scholar] [CrossRef]
- Sethi, A.; Bajaj, A.; Malhotra, G.; Arora, R.R.; Khosla, S. Diagnostic Accuracy of Sensitive or High-Sensitive Troponin on Presentation for Myocardial Infarction: A Meta-Analysis and Systematic Review. Vasc. Health Risk Manag. 2014, 10, 435–450. [Google Scholar] [CrossRef] [PubMed] [Green Version]
- Herren, K.R.; Mackway-Jones, K. Emergency Management of Cardiac Chest Pain: A Review. Emerg. Med. J. 2001, 18, 6–10. [Google Scholar] [CrossRef] [PubMed]


| Biomarker | Methodology | Assay Principle | Concentration Range | Limit of Detection (LOD) |
|---|---|---|---|---|
| cTnT | NH2-CNT-SPEs/polyethyleneterephtalate (PET)/NHS-EDC-anti-cTnT/glycine/cTnT | Amperometric | 0.0025–0.5 ng/mL | 0.0035 ng/ml |
| cTnT | Gold (Au)/polyethyleneimine (PEI)/carboxylated CNTs (COOH-CNT)/ANTI-cTnT/glycine/ cTnT | 0.1–10 ng/mL | 0.033 ng/mL | |
| cTnT | GCE/o-aminobenzoic acid (poly-o-ABA)/EDC/NHS/anti-cTnT/ethanolamine/ cTnT | 0.05–5 ng/mL | 0.016 ng/mL | |
| cTnT | SPE/polyethylene terephtalate (PTE)/anti-cTnT/biotin/glutaraldehyde (glu)/streptavidin microsphere/glycine/cTnT/HRP-conjugated anti-cTnT | 0.1–10 ng/mL | 0.2 ng/mL | |
| cTnI | Interdigitatedarray (IDA) chip/polydimethylsiloxane (PDMS)/NHS/BSA anti-cTnI/protein/ cTnI/alkalinephosphatase (AP)-labeled anti-cTnI/enzyme substrate (PaPP) | 0.2 ng/mL–10 µg/mL | 148 pg/mL | |
| cTnI | PDMS-GNP composite/anti-cTnI and anti-CRP (Ab1)/BSA/CdTe and ZnSe quantum dots-anti-cTnI and anti-CRP (Ab2) | 0.01–50 µg/mL | 5 amol | |
| cTnI | Microfluidic channel/EDC and SNHS/Branched polyethylenimine (BPEI)/BPEI activation with GA/anti- cTnI/BSA/cTnI/biotinylated detection antibody/GOx-avidin | NA | 25 pg/mL | |
| cTnI | SPE/AuNPs/anti-cTnI/BSA/cTnI | Capacitance | 0.2–12.5 ng/mL | 0.2 ng/mL |
| cTnT | An electrode/self-assembled monolayer/glutaredehyde/anti-cTnT/glysin/cTnT | 0.07–6.38 ng/mL | NA | |
| cTnT | Increase of low-frequency capacitance between two Al electrodes after Ab-Ag interaction | 0.01–5 ng/mL (PBS) 0.07–6.83 ng/mL (serum) | NA | |
| cTnI | Indium tin oxide (ITO)/Gold nanoparticles (GNPs)/anti-cTnI/cTnI/NHRP-conjugated anti-cTnI | Open circuit potential | 1–100 ng/mL | NA |
| cTnT | cTnT/carboxylated, MWCNT/acrylamide (AAM), N,N-methylenebisacrylamide (NNMBA, cross-linker) and ammonium persulphate (APS, initiator)/cTnT | Potentiometric | 1.41–20.68 µg/mL | 0.16 µg/mL |
| cTnI | Au electrode/PANI nanowire integrated with microfluidic channels/anti-cTnI/cTnI | Conductance | NA | 250 fg/mL |
| cTnT | GCE/(E)-1-decyl-4-[(4-decyloxyphenyl)diazenyl] pyridinium bromide (Br-Py)film/gold nanoparticles (AuNP) stabilized in a water-soluble 3-n-propyl-4-picolinium silsesquioxane chloride (Si4Pic + Cl−)/anti cTnT/glycine/cTnT | Cyclic voltammetry and impedance | 0.1–0.9 ng/mL | 0.076 ng/mL |
| cTnI | Interdigitated electrode surface/graphene-ABA nano composite/anti-hcTnI/cTnI | 0.1–1 ng/mL | 0.01 ng/mL | |
| cTnT | GCE/I-Py/CTS-AuNP/anti-cTnT/glycine/cTnT | Cyclic voltammetry | 0.2–1 ng/mL | 0.1 ng/mL |
| cTnI | Au electrode modified with a mixed SAM where biotinylated antibodies were linked through neutravidin | Impedance | 10–13–10–7 mol/L | 10–13 mol/L |
| cTnI | PANI electrodeposited on patterned screen-printed paper electrodes. PANI oxidation current change after an immunological reaction | Cyclic voltammetry | 1–100 ng/mL | NA |
| cTnT | Amine-functionalized CNT-SPEs platforms | Differential Pulse Voltammetry | 0.0023 ng/mL–0.5 ng/mL | 0.0035 ng/mL |
| Variables | Scenario 1 | Scenario 4 | Mann-Whitney | Scenario 3 | Scenario 4 | Mann-Whitney | ||||
|---|---|---|---|---|---|---|---|---|---|---|
| Ranks | Sum | Ranks | Sum | p-Value | Ranks | Sum | Ranks | Sum | p-Value | |
| V1 | 15.44 | 417.00 | 52.75 | 2743.00 | 0.000 | 13.50 | 243.00 | 43.12 | 2242.00 | 0.000 |
| V2 | 15.59 | 421.00 | 52.57 | 2739.00 | 0.000 | 13.94 | 251.00 | 42.96 | 2234.00 | 0.000 |
| V3 | 39.74 | 1073.00 | 40.13 | 2087.00 | 0.942 | 28.72 | 517.00 | 37.85 | 1968.00 | 0.101 |
| V4 | 44.44 | 1200.00 | 37.89 | 1960.00 | 0.215 | 40.94 | 737.00 | 33.62 | 1748.00 | 0.186 |
| V5 | 46.74 | 1262.00 | 36.50 | 1898.00 | 0.060 | 39.83 | 717.00 | 34.00 | 1768.00 | 0.295 |
| Variables | B | Standard Error | Sig. | |
|---|---|---|---|---|
| V1 | −31.356 | 15.141 | 0.038 | |
| V2 | 43.863 | 17.369 | 0.012 | |
| V3 | 5.150 | 1.366 | 0.000 | |
| V4 | −3.361 | 3.008 | 0.264 | |
| V5 | −8.577 | 2.103 | 0.000 | |
| Constant | 2.429 | 1.098 | 0.027 | |
| Prediction | Accuracy | ||
|---|---|---|---|
| Observations | Normal | Abnormal | % |
| Normal | 67 | 4 | 94 |
| Abnormal | 4 | 48 | 92 |
| Total | 94 | ||
| Performance Indicators. | Value |
|---|---|
| Accuracy | 94.00% |
| Specificity | 94.37% |
| Recall = Sensitivity | 92.31% |
| PPV | 92.31% |
| NPV | 92.31% |
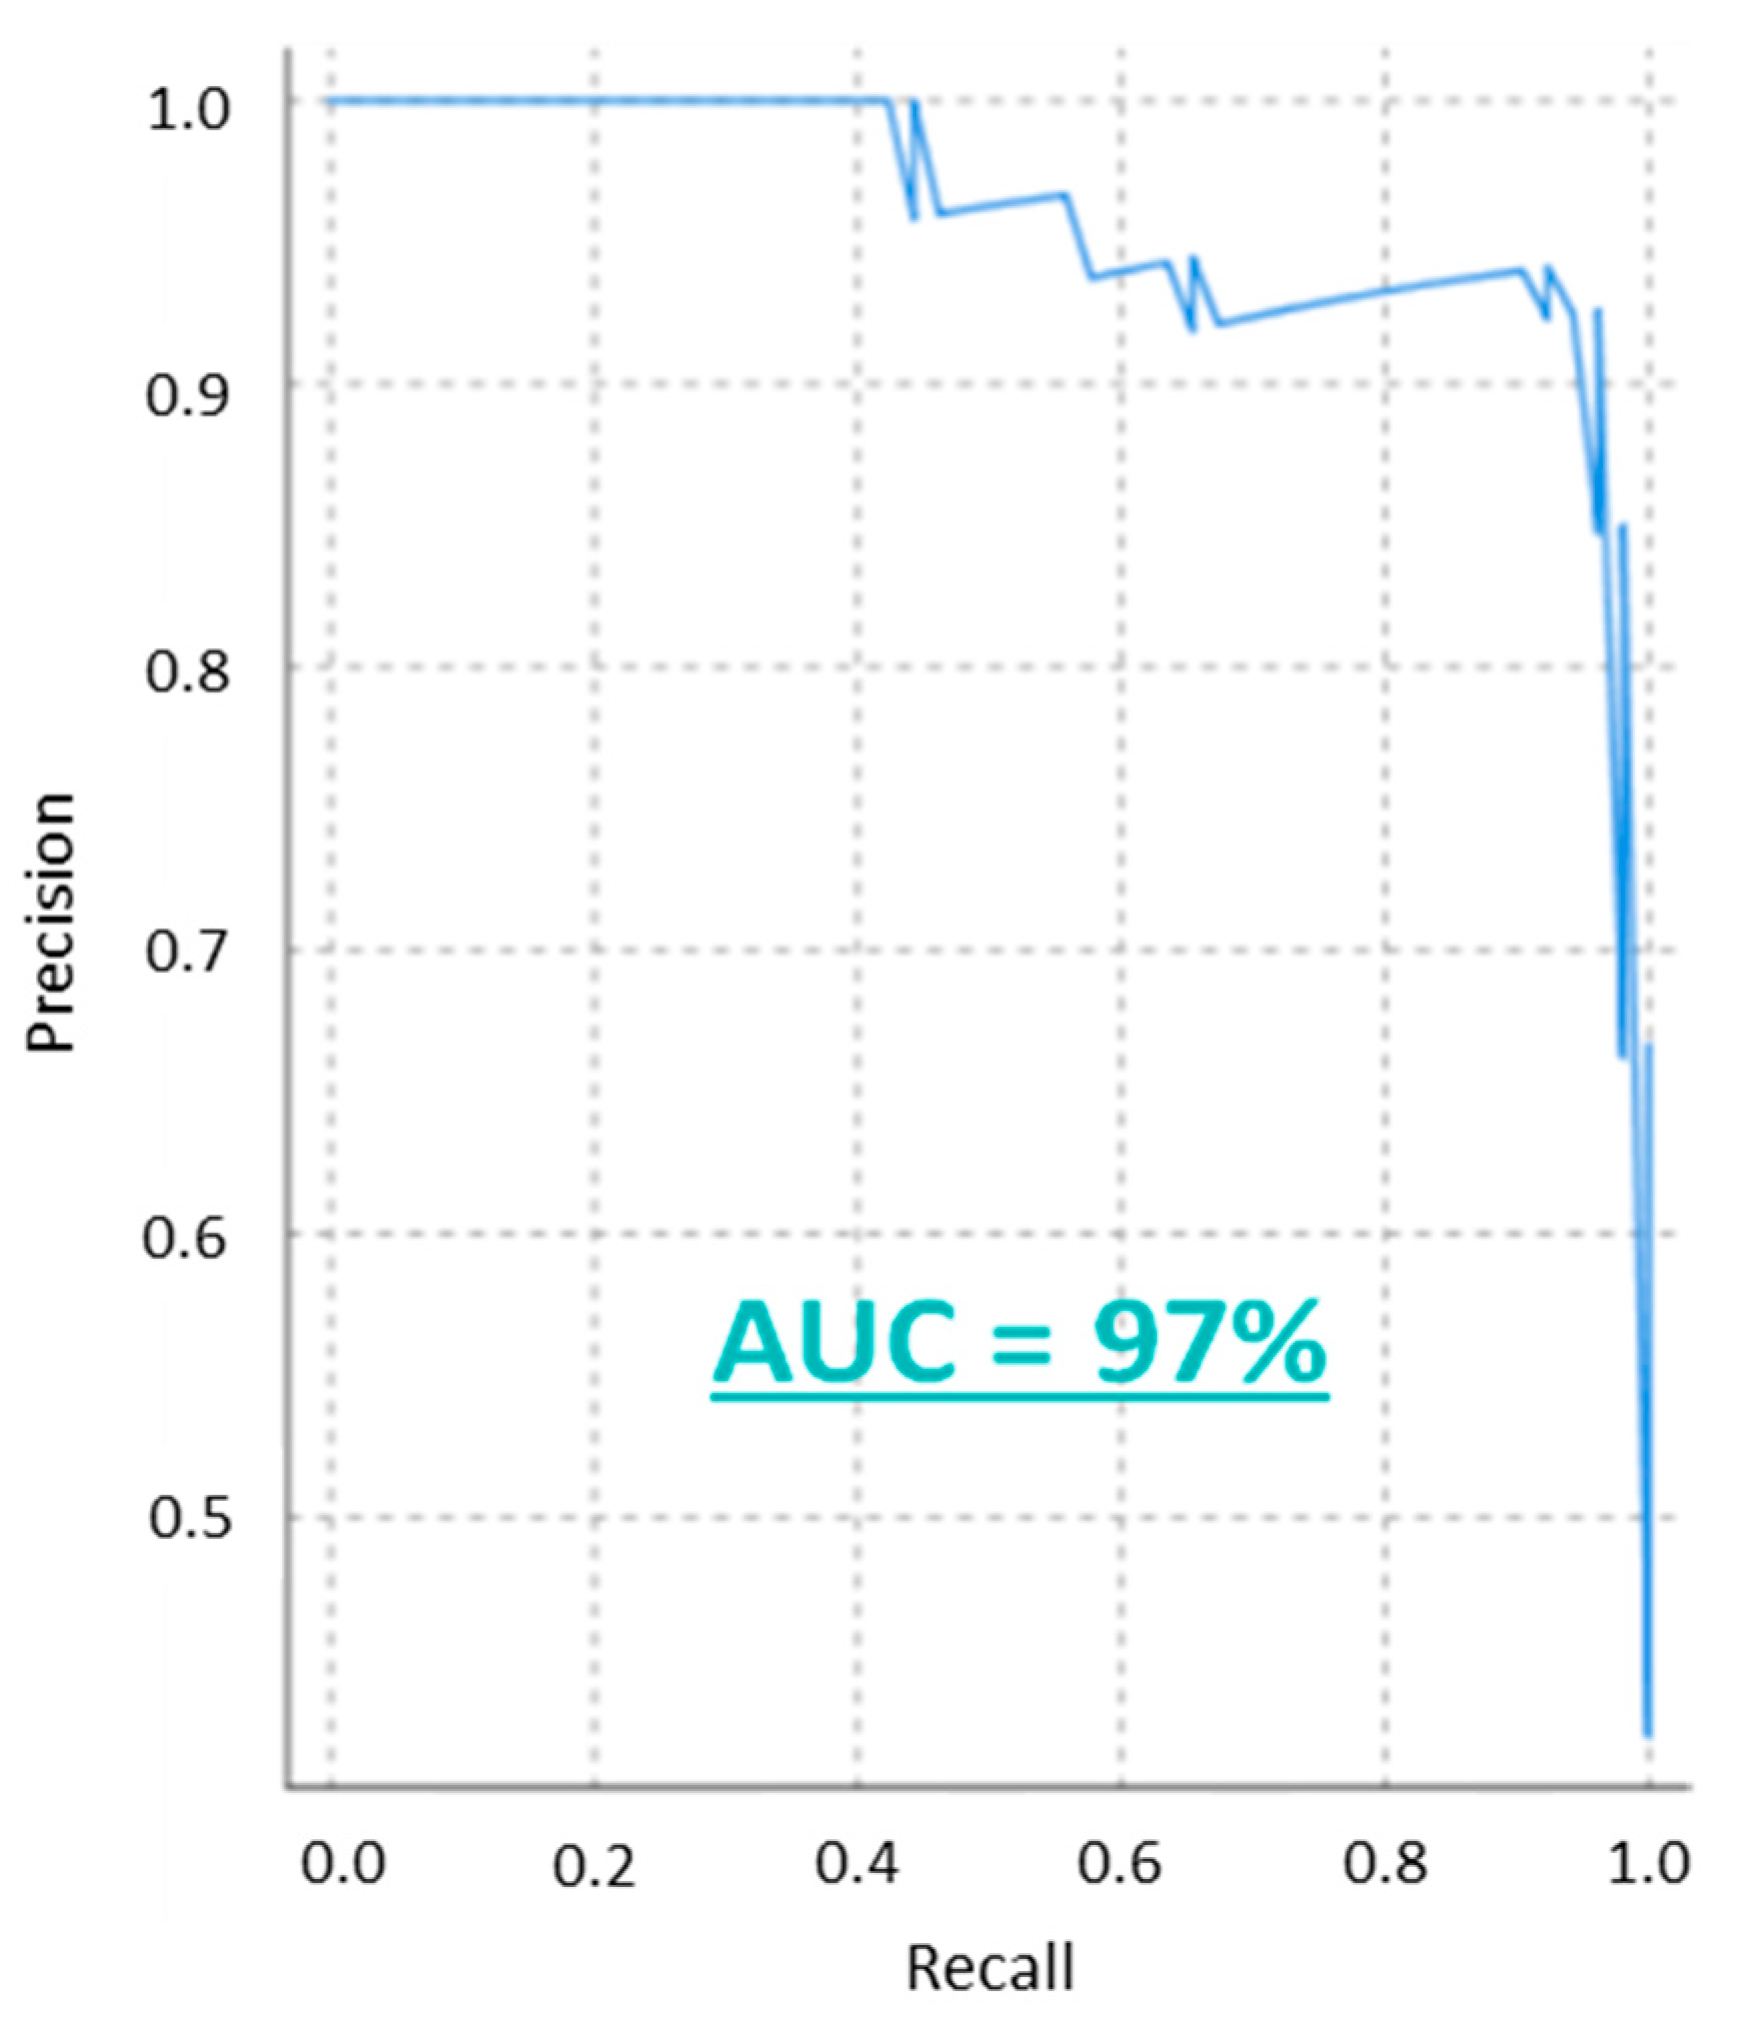
| AUC | 97.00% |
| F-Score | 92.31% |
| YI | 0.87 |
| LR+ | 16.38 |
| LR− | 0.082 |
| DOR | 71.64% |
Publisher’s Note: MDPI stays neutral with regard to jurisdictional claims in published maps and institutional affiliations. |
© 2021 by the authors. Licensee MDPI, Basel, Switzerland. This article is an open access article distributed under the terms and conditions of the Creative Commons Attribution (CC BY) license (http://creativecommons.org/licenses/by/4.0/).
Share and Cite
Redon, P.; Shahzad, A.; Iqbal, T.; Wijns, W. Development of a New Detection Algorithm to Identify Acute Coronary Syndrome Using Electrochemical Biosensors for Real-World Long-Term Monitoring. Bioengineering 2021, 8, 28. https://0-doi-org.brum.beds.ac.uk/10.3390/bioengineering8020028
Redon P, Shahzad A, Iqbal T, Wijns W. Development of a New Detection Algorithm to Identify Acute Coronary Syndrome Using Electrochemical Biosensors for Real-World Long-Term Monitoring. Bioengineering. 2021; 8(2):28. https://0-doi-org.brum.beds.ac.uk/10.3390/bioengineering8020028
Chicago/Turabian StyleRedon, Pau, Atif Shahzad, Talha Iqbal, and William Wijns. 2021. "Development of a New Detection Algorithm to Identify Acute Coronary Syndrome Using Electrochemical Biosensors for Real-World Long-Term Monitoring" Bioengineering 8, no. 2: 28. https://0-doi-org.brum.beds.ac.uk/10.3390/bioengineering8020028