Article

Perception and Description of Premium Beers by Panels with Different Degrees of Product Expertise

by
Davide Giacalone
1,*,
Letícia Machado Ribeiro
2 and
Michael Bom Frøst
2
1
Department of Technology and Innovation, University of Southern Denmark, Campusvej 55, 5230 Odense M, Denmark
2
Department of Food Science, University of Copenhagen, Rolighedsvej 30, 1958 Frederiksberg C, Denmark
*
Author to whom correspondence should be addressed.
Submission received: 14 December 2015 / Revised: 5 February 2016 / Accepted: 16 February 2016 / Published: 26 February 2016
(This article belongs to the Special Issue Alcohol Perception and Consumption)

Abstract

:
The present study compares subjects with varying degrees of product expertise with regards to their ability to provide a sensory profile of beverages. Eight premium beers were evaluated by three different panels using a Napping® test, followed by a descriptive task. Two panels were constituted of consumers, classified according to their self-assessed product expertise into “Novices” (N = 14) and “Enthusiasts” (N = 26). The sensory panel at a large brewery, and a group of master brewers constituted the third panel (“Experts”, N = 15). The Napping® data from the three panels were digitalized using a coordinate system, whereas attributes were entered separately and treated as frequency table crossing products and attributes. The position data were analyzed by Hierarchical Multiple Factor Analysis (HMFA). Partial Least Squares-Discriminant Analysis (PLS-DA) was used to test differences between the three panels with regards to the use of attributes. The HMFA results showed a separation of the samples into two distinct groups on the first dimension, whereas the second dimension highlighted the specificity of two of the samples. RV coefficients between partial configurations obtained from the three panels were all above 0.90, indicating high configurational similarity. In contrast, PLS-DA showed significant differences in the use of attributes, particularly between Experts and Novices, suggesting that product expertise is more associated with descriptive, rather than perceptual, ability.

1. Introduction

1.1. Sensory Profiling of Beer

Sensory properties of beers are of paramount importance for consumer acceptance. The extent to which the assessment of taste, flavors and aromas in beers has occupied the minds of brewers, flavor chemists and sensory scientists is evident from the ample literature compiled on the subjects [1]. Beer flavor has been studied extensively in the domain of analytical chemistry (e.g., [2]), and indeed it is well known that a large number of compounds affect the sensory properties of beer, such as sugars, organic acids, hop bitter acids, polyphenols, DMS and carbonyl compounds [3]. Although instrumental measurements on chemical and physical parameters in beer are obviously valuable, there is hardly a one-to-one relationship between an analytically determined compound and a specific sensory attribute [1], which is why human assessors must be employed to collect information on the sensory quality of beers.
Indeed, sensory scientific approaches to evaluation of beer flavors abound in the literature, with a significant share of this work even originated from within the brewing industry (e.g., [4]). Previous studies have used sensory descriptive analysis (DA) for a variety of applications: e.g., to relate sensory characteristics of beer to its chemical composition (e.g., [2]), ageing [5] or storage conditions [6]; to define different brewing styles from a sensory standpoint [7], and to predict consumer preferences [8].
The majority of these studies have employed highly trained panels for sensory profiling of beers. However, attempts at using consumers for sensory profiling of beers have also been reported. In a classical study comparing panels with different degrees of expertise in a DA task, Clapperton and Piggott [9] found that trained subjects and consumers are able to produce similar profiles (though training was found to improve reproducibility and discrimination). Later, Gains and Thomson [10] successfully conducted a home use test (HUT) in which they used a consumer population for sensory profiling of a selected sample of lager beers. They concluded that consumers can validly profile beers, provided that sensory differences are not extremely subtle, especially if they have at least some degree of familiarity with the product [10]. A similar conclusion was reached by Chollet and colleagues [11] who used a combination of sorting and a fast descriptive task.

1.2. Aims of the Present Study

Although DA is known to produce detailed, robust and repeatable results, as documented by numerous scientific publications (for a review on the topic, see [12]), it has also certain drawbacks. It is a very slow method, particularly because of the extended training phase. Second, it is a very costly method. Maintaining a sensory panel is (usually) not affordable for, e.g., craft brewers, and can be a significant spending also for large brewing companies. Lastly, it is possible that the trained assessors experience the product differently from the final consumers, and/or that they may take into account sensory characteristics that may be irrelevant for the consumers [13], providing high quality results but with low external validity.
In order to address these drawbacks, a number of alternative descriptive methodologies have been proposed over the years, most of which require little or no training, and are easily implementable with trained panelists or consumers alike.
In the context of this research, it was considered of interest to explore the suitability of new approaches for the sensory profiling of beers. It was chosen to focus primarily on Napping® [14]. This choice was motivated by a number of factors: this method is reportedly fast, low-cost, and it requires a smaller number of assessors than other sensory profiling methods [15,16]. Furthermore, it has been used successfully, with both trained and untrained assessors, for sensory profiling of several beverages categories, such as wine, beer, and high alcohol products [14,15,16,17,18,19,20,21].
The Napping® method was introduced by Pagès [14], and is a specific variant of the original projective mapping [22], a method that is based on the idea that inter-perceived product differences can be expressed as a Euclidean configuration in a unique session.
The method consists in presenting the samples simultaneously to each assessor, together with a large rectangular sheet of blank paper of a size similar to a standard A2 sheet (60 by 40 cm), which resembles a paper tablecloth (the word “napping” derives from ”nappe”—the French word for “tablecloth”). Assessors are then instructed to evaluate the perceived the similarities (or dissimilarities) between the samples, by positioning them on the sheet in such a way that two samples should be placed very close if they seem identical, and distant from one another if they seem different. It is stressed that assessors have to do so according to their own criteria, and that are not right or wrong solutions. At the end of the task, assessors usually write the sample code in the place it occupies on the sheet, or use post-its notes to that effect.
These data are digitalized using a coordinate system (the origin is customarily placed in the bottom left corner, though it can be placed anywhere) and entered into a data matrix with products as rows, and X- and Y-coordinates as columns. Finally, because Napping® itself is purely a sorting task, it has become customary to instruct the assessors, once they have reached a final configuration, to add a list of sensory attributes that they find appropriate to describe the samples. This quick descriptive procedure is usually referred to as Ultra-Flash Profiling (UFP, [20,21]).
A visual representation of a completed Napping® (+UFP) sheet is shown in Figure 1.
The Napping® methodology has been recently suggested as advantageous for rapid evaluations of beer as rapid product screening tool, to obtain feedbacks on product and process specifications, and/or for generating a sensory vocabulary [15,16,23]. For larger breweries, Napping® may be an advantageous exploratory tool in preparation for more thorough sensory assessment. For craft breweries, which do not usually have access to conventional sensory panels, Napping® can be a useful tool to, say, document the sensory outcome of experimental brews in a more systematic manner [15].
Before one can advocate its adoption with confidence, however, it is important to understand methodological aspects of Napping® more in depth. Of relevance in this paper is the type of assessors that are suitable for this task. Initial exploratory work has suggested that product expertise might increase panelist performance when evaluating beer with a Napping® task [16].
In the present work, we delve deeper and more systematically into the question of whether product expertise is related to the ability to provide a sensory profile of beers by a Napping® task. In particular, the aim of the present work was to compare the performance of three different panels with varying degree of beer-related expertise, with respect to two evaluative criteria: (1) perceptual similarity, i.e., the degree of configurational agreement between the sensory spaces obtained at individual panel level; and (2) descriptive similarity, i.e., the degree to which the three panels would use similar attributes to verbalize their impressions of the beers.

2. Materials and Methods

This paper is partly based on a re-analysis of previously published data [23], and partly on new data on the same beers. For this reason, the main experimental procedures are briefly described below, and the reader will be referred to the original publication for additional details.

2.1. Samples

Eight beers (six commercially available and two experimental) with very different sensory profiles were chosen for the study. They included a pale ale brewed with elderflowers (“Fynsk Forår”, 5.0% ABV), an Amber Ale brewed with beech twigs (“Bøgebryg”, 5.2% ABV), a brown ale with Walnuts (“Valnød Hertug”, 7.0% ABV), a dark ale with star anise (“Stjernebryg”, 8.0% ABV), a stout with juniper berries (“Enebær”, 6.0% ABV), and finally a standard pale lager representing the most consumed beer type in Denmark (“Thy Pilsner”, 4.6% ABV). Two additional beers were developed by the experimenters to represent novel ingredients not available in the context of Danish brewing at the time. They were brewed from a base pale lager (4.5% ABV) with the addition of pine needle extract (“Pine”) in one case, and sea-buckthorn juice (“Sea-buckthorn juice”).
Additional information on the samples are available in [23].

2.2. Assessors

Three different panels of assessors were recruited for the study. Two panels were constituted of consumers, recruited through advertisement on social media, beer magazines and flyers.
Data from these two panels combined have been previously presented in [23], where they jointly make up the “Napping” group. Here, we look deeper in the results by looking at subgroups of consumers with different degrees of expertise. In the present paper, consumers were divided, based on their self-reported beer-related expertise, into “Novices” (N = 14) and “Enthusiasts” (N = 26). Beer-related expertise was assessed through a composite score comprising nine different measures: six Likert items rated on a 9-point agree-disagree scale (“I know a lot about beer”, “I can easily name and recognize several beer types”, “I am very interested in beer”, “I often try out new beers”, “I often take part in beer-related events”, “I am interested in knowing more about beer”), and three measures of consumption frequency (beer drinking frequency, typical intake at a drinking event, number of different beers consumed per month). This set of items was found to be very unidimensional (Cronbach’s alpha = 0.90), and its median was used as a divide to assign consumers into the two experimental groups.
Additionally, a third sensory panel was recruited to include assessors with both high technical expertise on beer and brewing and formal experience with sensory evaluation. This third panel was recruited through the authors’ personal network, and comprised the trained sensory panel at a large commercial brewery, and a group of master brewers (“Experts”, N = 15).
All assessors received a token incentive for their participation (a 50 cl bottle of craft beer, commercial value approximately $10 USD).

2.3. Experimental Procedures

After receiving a brief introduction to the task by an experimenter, assessors were served all the beer samples (40 mL each) simultaneously on a tray. The serving temperature was approximately 10 °C. The samples were served in 24 cl beer glass covered with watch glasses and coded with three-digit random numbers. In addition to the tray with the samples, each assessor was provided with a 60 × 40 cm blank paper (the Napping® sheet), a pen, post-its, and a spittoon. Waters and crackers were made available to the assessors as palate cleansers.
The assessors were instructed to evaluate the beer samples according to similarities or dissimilarities with respect to smell and taste attributes (this modality restricted version of Napping® is sometimes referred to as “Partial Napping®” [15]). The task consisted in placing similar samples close to each other and more dissimilar samples further apart on the Napping® sheet. The tasting order on the individual trays was randomized across assessors to minimize position effects (although it should be noted that the method allows assessors to re-taste a sample at will).
After they had reached a final configuration on their individual sheets, assessors were instructed to write down any sensory attributes they thought was appropriate for describing each sample (UFP).
Most assessors completed the task within 30 min.

2.4. Data Analysis

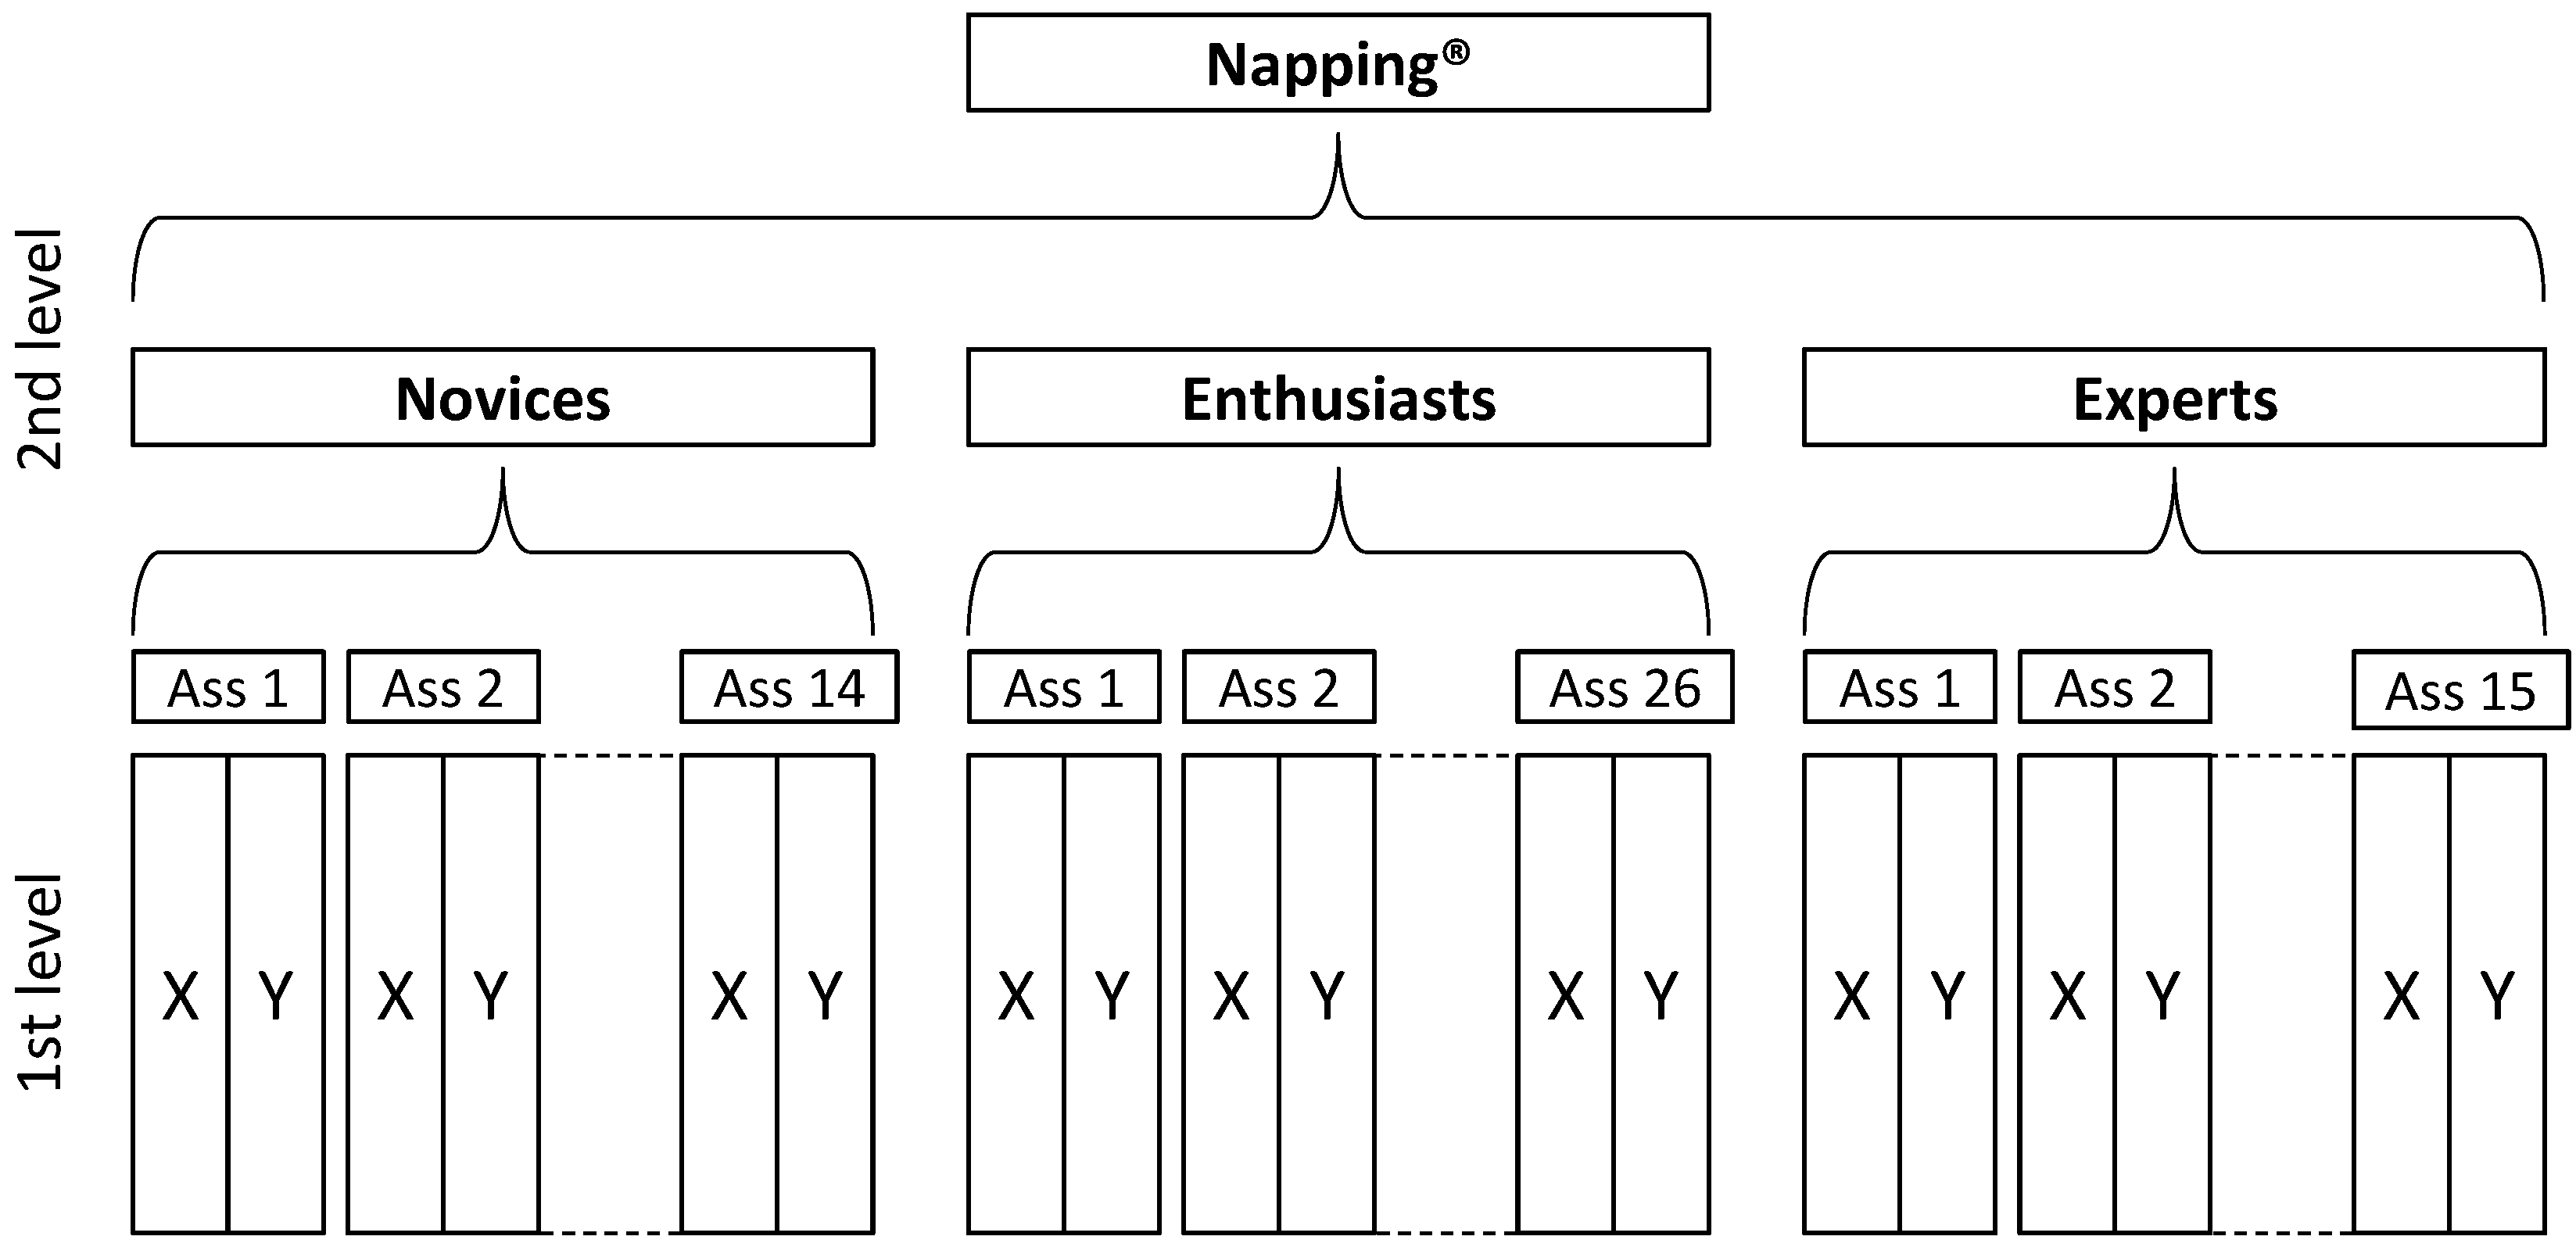
The analysis performed comprised two main parts: (1) an analysis of the sample spaces generated using the Napping® data; and (2) an analysis of the descriptive outputs (the UFP data). The analysis of the sample spaces was directly related to assessing whether the three panels would differ with regards to the perceptual spaces generated. To this end, Hierarchical Multiple Factor Analysis (HMFA [24]) was used. This method is a generalization of Multiple Factor Analysis (MFA [25]) applicable to situations when the data at are hierarchically structured. In MFA, the goal of the analysis is to integrate different groups of variables describing the same observations, and to balance their influence by using a scaling procedure based on the variance associated with each group of variables. HMFA shares the same goal, but it balances the role of the groups of variables by applying MFA in a stepwise fashion within each node of the hierarchy. As a result, it provides graphical displays that can be interpreted from a global perspective, as well as from the perspective of the groups of variables hierarchically defined [24]. In the present context, we defined two levels of hierarchy, resulting in the structure illustrated in Figure 2. The first level is associated with the individual assessors’ sheets, i.e., 55 groups of variables corresponding to the X- and Y- coordinates for each beer sample. The second level was associated to the three different panels and contains the variables associated with Novices, Enthusiasts and Experts. In HMFA, a succession of MFA is applied to each level of the hierarchy from the bottom to the top of the hierarchy, in order to balance the groups of variables within every level. HMFA starts by performing individual Principal Component Analysis (PCA) models on these mean-centered data and applies a scaling factor corresponding to the square root of the first eigenvalue obtained in the individual PCA models. HMFA proceeds sequentially to performing another MFA on the next three groups of variables, and then perform a global PCA on the merged data set.
HMFA visuals were used in this paper to inspect the sample space obtained by the Napping® methodology both at the aggregated level, but also at the level of partial configurations obtained from the three groups of assessors. This was done both qualitatively, i.e., by visual inspections of partial configurations superimposed to the sample space, as well as quantitatively by computing RV coefficients between configurations obtained by each of the three panels. The RV coefficient is a measure of configurational similarity that is commonly employed for estimating similarities between sensory spaces on the same products [25]. It is a multivariate generalization of the simple correlation coefficients, and takes values between 0 and 1, where 1 indicates a perfect correspondence between two groups of variables. The significance of the RV coefficients was tested using a permutation test [26].
The second part of the analysis concerned the descriptive output provided by the assessors during the UFP task. To this end, attributes from the UFP were collected into an occurrence matrix (samples × attribute × Panel) containing the number of times an attribute was mentioned to describe a specific sample by a specific panel. Semantic grouping of attributes indicating the same sensory sensation (e.g., “citrus fruit” and “citrusy”) was performed prior to further analysis. Moreover, only attributes mentioned more than five times in total were considered. Both a priori semantic grouping and the adoption of a cut-off point are commonly applied to improve interpretation of UFP data (e.g., [16,23]). The data were further split into a design matrix consisting of the number of beers times the number of panels, and a second matrix containing the actual UFP data. Partial Least Squares Regression-Discriminant Analysis (PLS-DA) [27], a form of discriminant analysis in which the design factors are used as predictors in the context of Partial Least Squares Regression, was used to estimate the effect of each design variables on the use of the UFP attributes, as recently suggested for similar type of data [28]. Significance of the effect was further tested by Pearsons’ chi-squared test run, on an attribute by attribute basis, to test the hypothesis that belonging to a certain panel would be related to the proportion of using a specific attribute. Yates correction for continuity was applied as cell count was sometimes less than five for attributes that were less frequently mentioned.
All analyses were performed in R [29], using functions from the “FactoMineR” package [30] and the “pls” package [31].

3. Results and Discussion

3.1. Configurational Congruence

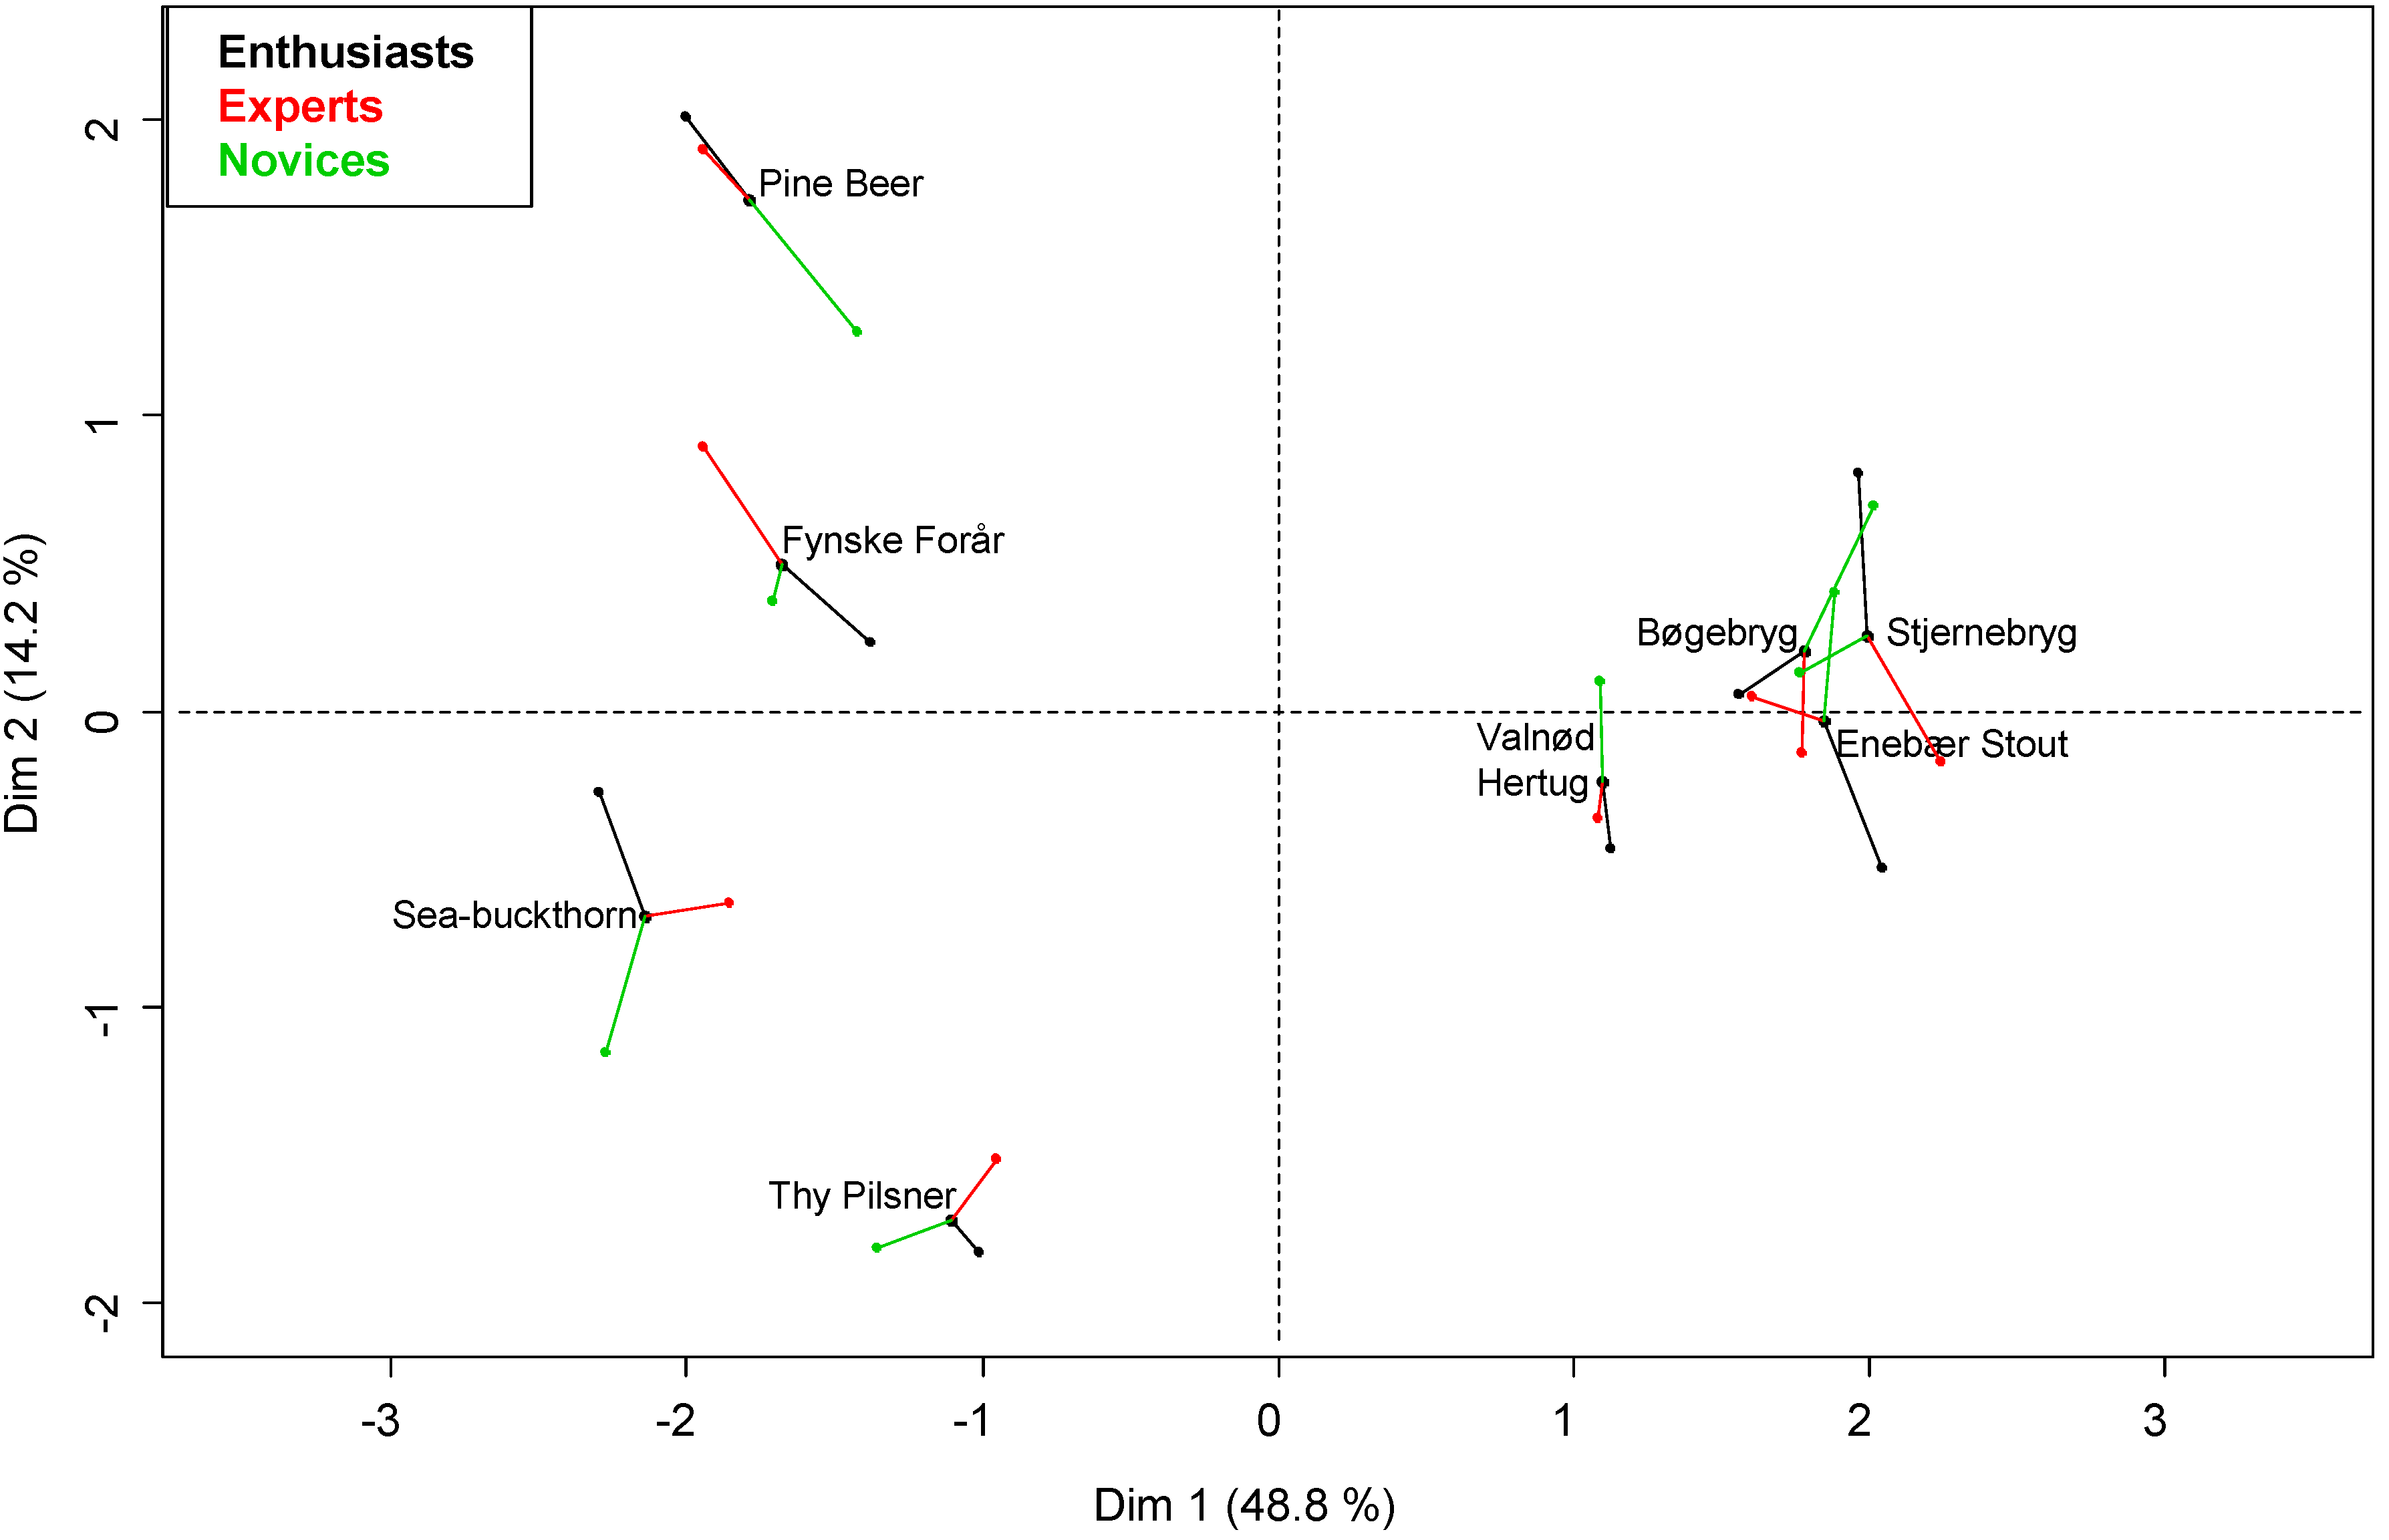
Figure 3 shows the first two dimensions of the HMFA model (63% variance explained) representing the sensory differences between the samples as captured by the Napping® method, both at an overall level and at the level of individual panel configurations. At an overall level, the HMFA model showed a separation of the samples into two distinct groups on the first dimension. The first group included the lagers and pale ales (Pine beer, Sea-buckthorn, Fynsk Forår and Thy Pilsner), which were opposed to the darker ales and stouts (Stjernebryg, Enebær Stout, Valnød Hertug and Bøgebryg). Clearly, this dimension describes variation related to malt roasting, and indeed this was reflected also in the choice of UFP attributes associated with these two groups. The first group was associated to attributes such as “sour”, “fresh”, “floral”, “fruity” and “light”, whereas the second group of beers was associated to attributes as “sweet”, “licorice”, “alcoholic”, “full bodied” and “caramel”. The second dimension highlighted the differences between two of the light beers, Pine beer and Thy Pilsner, which were described, respectively, as “piney” and “hoppy”. A complete characterization of the samples is outside the scope of this paper and the reader is referred to [23] for a more in depth discussion of these sensory differences.
Of importance in this context is rather to evaluate the configurational similarity between configurations obtained by the three different panels which, in Figure 3, are represented as partial points superimposed to the consensus configuration. This plot allows a graphical evaluation of the differences by looking at the distance between the consensus point and the partial points. By looking at Figure 3 it can be seen that, although some differences are noticeable, the partial points are rather close to the consensus and to each other, especially with respect to their coordinates on the first HMFA dimension (the dimension of maximum variance).
The high configurational congruence, inferred qualitatively from visually inspecting Figure 3, was fully confirmed from the computation of the RV coefficients between the partial configurations obtained from the three groups (Table 1), which were all above 0.90. These values are very high considering that, as a point of comparison, RV values higher than 0.85 have been generally considered to indicate good reproducibility between replicate evaluations by trained panels [32].
Taken collectively, the HMFA results indicate that the three panels perceived the beers similarly and produced similar configurations using the Napping® methodology. Thus, product expertise did not significantly affect perceptual ability in this experiment.
However, it is important to notice here that these conclusions refer to a product space with relatively large sensory differences. For instance, a recent study on wine where product expertise was directly manipulated, showed that the latter increased the perceptual discrimination of subtle differences [17]. Therefore, whether the same results obtained in this paper would hold for a sample space with small differences is unclear and warrants further investigations.

3.2. Verbal Description

Table 2 shows regression coefficients from PLS-DA describing differences between the three panels in the use of the UFP attributes, as well as chi-square test results indicating the significance of such differences. Significant differences in the use of terms based on the different expertise were observed for 13 attributes out 57 attributes, corresponding to 23% of the total. Therefore, product expertise did not have a significant effect for the majority of attributes elicited during UFP. Nevertheless, if we focus on the attributes that did differ in usage frequency across the three panels, some insights emerge. It seems that experts tended to use more specific words that could not easily be detected without knowing the corresponding sensory concept and reference. The attributes “ester” and “sulfuric”, are a good example of this. Esters and sulfuric compounds are very important in beer flavor, and have very clear references in the beer world, as reported in established tools such as the beer “flavor wheel” [33]. Their usage is strongly associated with the expert group (Table 2) which obviously is more likely to have come across these sensory tools. Interestingly, however, these two attributes have counterparts in more “lay” sensory language such, as respectively, the attributes “banana” and “yeasty”. These two attributes which were also mentioned by our panels, but did not differ in their usage. This seems to suggest that, while sensory perceptions associated with ester and sulfur compounds were perceived by all panels equally, only the experts characterized them as such.
On the contrary, there was a tendency of novice assessors to use holistic and emotional words such as “Autumn”, “Summer”, and “Winter” (Table 2), and with abstract attributes such as “Heavy”. This suggests a tendency to use emotional conceptualizations in addition to sensory terms, which might indicate that novice assessors were more holistic and less analytical relative to assessors who are more used to evaluating beer. In conclusion, some minor differences between the three panels were found with regards to usage frequency of specific terms, and such differences were ostensibly related to product expertise. Taken collectively, the results so far presented appear consistent with extant research on the topic that point at product expertise being important for verbalization of sensory perceptions, but less so for perceptual ability [11,34,35,36].
Nevertheless, let us note here that differences were found only for a minority of the attributes considered. Overall, these results do not point at a large effect of product expertise on verbal ability in a Napping® task.

4. Conclusions

This work has compared the performance of panels with varying degrees of product expertise with regards to their ability to provide a sensory profile of eight premium beers using the Napping® method, followed by a descriptive task. All three panels generated similar sample spaces, but differed to some extent in their use of sensory attributes. In particular the level of expertise was associated with a better (i.e., more specific) use of sensory attributes.
The results obtained in this work confirm previous claims that consumers can validly be used for sensory profiling of beer using the Napping® method [15,16], but suggest that experts might outperform novice assessors if verbalization of the sensory attributes is required. This supports and extends the findings obtained by Clapperton and Piggott [9], and by Chollet and Valentin [11], who reached similar conclusions by applying different approaches to beer evaluation (respectively, DA, and a combination of sorting and UFP).
More in general, these results are in agreement with previous claims that the issue of expertise is more related to the quality of the sensory terminology than to perceptual abilities.
From an applied perspective, the results obtained in this study (in particular, the high reproducibility of sensory information obtained across different panels) add further validity of the Napping® methodology, and allow us to advocate with greater confidence its use in the brewing industry for rapid sensory profiling, either in preparation to more formal sensory profiling or even, when time and resources are limited, as a stand-alone sensory profiling method.

Acknowledgments

Support for this work was provided by the Danish Agency for Science, Technology and Innovation, throughout the consortium “Dansk Mikrobryg—Produktinnovation og kvalitet”. Additional support was provided by the Faculty of Science, University of Copenhagen, and the Faculty of Engineering, University of Southern Denmark.

Author Contributions

Study conception and design: All; Acquisition of data: D.G., L.M.R.; Analysis and interpretation of data: All; Drafting of manuscript: D.G.

Conflicts of Interest

The authors declare no conflict of interest.

References

  1. Hughes, P.S.; Baxter, E.D. Beer: Quality, Safety and Nutritional Aspects; The Royal Society of Chemistry: Cambridge, UK, 2001. [Google Scholar]
  2. Meilgaard, M.C. Predictions of flavour differences between beers from their chemical composition. J. Agric. Food Chem. 1982, 30, 1009–1017. [Google Scholar] [CrossRef]
  3. Liu, C.; Dong, J.; Wang, J.; Yin, X.; Li, Q. A comprehensive sensory evaluation of beers from the Chinese market. J. Inst. Brew. 2012, 118, 325–333. [Google Scholar] [CrossRef]
  4. Brown, D.G.W.; Clapperton, J.F. Discriminant analysis of sensory and instrumental data on beer. J. Inst. Brew. 1978, 84, 318–323. [Google Scholar] [CrossRef]
  5. Guyot-Declerck, C.; François, N.; Ritter, C.; Govaerts, B.; Collin, S. Influence of pH and ageing on beer organoleptic properties. A sensory analysis based on AEDA data. Food Qual. Preference 2005, 16, 157–162. [Google Scholar] [CrossRef]
  6. Pangborn, R.M.; Lewis, M.J.; Tanno, L.S. Sensory quantification of bitterness and flavor of beer during storage. J. Inst. Brew. 1977, 83, 244–250. [Google Scholar] [CrossRef]
  7. Daems, V.; Delvaux, F. Multivariate analysis of descriptive sensory data on 40 commercial beers. Food Qual. Preference 1997, 8, 373–380. [Google Scholar]
  8. Guinard, J.; Uotani, B.; Schlich, P. Internal and external mapping of preferences for commercial lager beers: Comparison of hedonic ratings by consumers blind versus with knowledge of brand and price. Food Qual. Preference 2001, 12, 243–255. [Google Scholar] [CrossRef]
  9. Clapperton, J.F.; Piggot, J.R. Differentiation of ale and lager flavor by principal component analysis of flavor characterization data. J. Inst. Brew. 1979, 85, 271–274. [Google Scholar] [CrossRef]
  10. Gains, N.; Thomson, D.M.H. Sensory profiling of canned lager beers using consumers in their own homes. Food Qual. Preference 1990, 2, 39–47. [Google Scholar] [CrossRef]
  11. Chollet, S.; Valentin, D.; Abdi, H. Do trained assessors generalize their knowledge to new stimuli? Food Qual. Preference 2005, 16, 13–23. [Google Scholar] [CrossRef]
  12. Murray, J.M.; Delahunty, C.M.; Baxter, I.A. Descriptive sensory analysis: Past, present and future. Food Res. Int. 2001, 34, 461–471. [Google Scholar] [CrossRef]
  13. Ares, G.; Deliza, R.; Barreiro, C.; Gimenez, A.; Gámbaro, A. Comparison of two sensory profiling techniques based on consumer perception. Food Qual. Preference 2010, 21, 417–426. [Google Scholar] [CrossRef]
  14. Pagès, J. Collection and analysis of perceived product inter-distances using multiple factor analysis: Application of 10 white wines from the Loire valley. Food Qual. Preference 2005, 16, 642–649. [Google Scholar] [CrossRef]
  15. Frøst, M.B.; Giacalone, D.; Rasmussen, K. Alternative methods of sensory testing: Working with chefs, culinary professionals and brew masters. In Rapid Sensory Profiling Techniques. Applications in New Product Development and Consumer Research; Delarue, J., Lawlor, B., Rogeaux, M., Eds.; Elsevier: Cambridge, UK, 2015; pp. 363–382. [Google Scholar]
  16. Giacalone, D.; Ribeiro, L.M.; Frøst, M.B. Consumer-Based Product Profiling: Application of Partial Napping® for Sensory Characterization of Specialty Beers by Novices and Experts. J. Food Prod. Mark. 2013, 19, 201–218. [Google Scholar] [CrossRef]
  17. Liu, J.; Grønbeck, M.S.; Di Monaco, R.; Giacalone, D.; Bredie, W.L.P. Performance of Flash Profile and Napping with and without training for describing small sensory differences in a model wine. Food Qual. Preference 2016, 48, 41–49. [Google Scholar] [CrossRef]
  18. Louw, L.; Malherbe, S.; Naes, T.; Lambrechts, M.; van Rensburg, P.; Nieuwoudt, H. Validation of two Napping® techniques as rapid sensory screening tools for high alcohol products. Food Qual. Preference 2013, 30, 192–201. [Google Scholar] [CrossRef]
  19. Louw, L.; Oelofse, S.; Naes, T.; Lambrechts, M.; van Rensburg, P.; Nieuwoudt, H. Optimisation of the partial napping approach for the successful capturing of mouthfeel differentiation between brandy products. Food Qual. Preference 2015, 41, 245–253. [Google Scholar] [CrossRef]
  20. Perrin, L.; Pagès, J. Construction of a product space from the ultra-flash profiling method: Application to 10 red wines from the Loire valley. J. Sens. Stud. 2009, 24, 372–395. [Google Scholar] [CrossRef]
  21. Perrin, L.; Symoneaux, R.; Maître, I.; Asselin, C.; Jourjon, F.; Pagès, J. Comparison of three sensory methods for use with the napping® procedure: Case of ten wines from Loire valley. Food Qual. Preference 2008, 19, 1–11. [Google Scholar] [CrossRef]
  22. Risvik, E.; McEwan, J.A.; Colwill, J.S.; Rogers, R.; Lyon, D.H. Projective mapping: A tool for sensory analysis and consumer research. Food Qual. Preference 1994, 5, 263–269. [Google Scholar] [CrossRef]
  23. Reinbach, H.C.; Giacalone, D.; Machado, L.M.; Bredie, W.L.P.; Frøst, M.B. Comparison of three sensory profiling methods based on consumer perception: CATA, CATA with intensity and Napping®. Food Qual. Preference 2014, 32, 160–166. [Google Scholar] [CrossRef]
  24. Lê, S.; Pagès, J. Hierarchical Multiple Factor Analysis: Application to the comparison o fsensory profiles. Food Qual. Preference 2003, 14, 397–403. [Google Scholar]
  25. Escoufier, B.; Pagès, J. Multiple Factor Analysis. Comput. Stat. Data Anal. 1990, 18, 121–140. [Google Scholar] [CrossRef]
  26. Josse, J.; Pagès, J.; Husson, F. Testing the significance of the RV coefficient. Comput. Stat. Data Anal. 2008, 53, 82–91. [Google Scholar] [CrossRef]
  27. Martens, H.; Martens, M. Multivariate Analysis of Quality: An Introduction; John Wiley & Sons: Chichester, UK, 2001. [Google Scholar]
  28. Rinnan, A.; Giacalone, D.; Frøst, M.B. Check-all-that-apply data analyzed by Partial Least Squares Regression. Food Qual. Preference 2015, 42, 146–153. [Google Scholar] [CrossRef]
  29. R Development Core Team. R: A Language and Environment for Statistical Computing; R Foundation for Statistical Computing: Vienna, Austria, 2015; Available online: https://www.R-project.org/ (accessed on 10 October 2015).
  30. Lê, S.; Josse, J.; Husson, F. FactoMineR: An R package for multivariate analysis. J. Stat. Softw. 2008, 25, 1–18. [Google Scholar] [CrossRef]
  31. Mevik, B.H.; Wehrens, R. The pls package: Principal component and partial least squares regression in R. J. Stat. Softw. 2007, 18, 1–23. [Google Scholar] [CrossRef]
  32. Lawless, H.T.; Glatter, S. Consistency of multidimensional scaling models derived from odor sorting. J. Sens. Stud. 1990, 5, 217–230. [Google Scholar] [CrossRef]
  33. Meilgaard, M.C.; Dalgliesh, C.E.; Clapperton, J.F. Beer flavor terminology. J. Inst. Brew. 1979, 85, 38–42. [Google Scholar] [CrossRef]
  34. Lawless, H.T. Flavor description of white wine by “expert” and nonexpert wine consumers. J. Food Sci. 1984, 49, 120–123. [Google Scholar] [CrossRef]
  35. Guerrero, L.; Gou, P.; Arnau, J. Descriptive analysis of toasted almonds: A comparison between expert and semi-trained assessors. J. Sens. Stud. 1997, 12, 39–54. [Google Scholar] [CrossRef]
  36. Urdapilleta, I.; Parr, W.; Dacremont, C.; Green, J. Semantic and perceptive organization of sauvignon blanc wine characteristics: Influence of expertise. Food Qual. Preference 2011, 22, 119–128. [Google Scholar] [CrossRef]
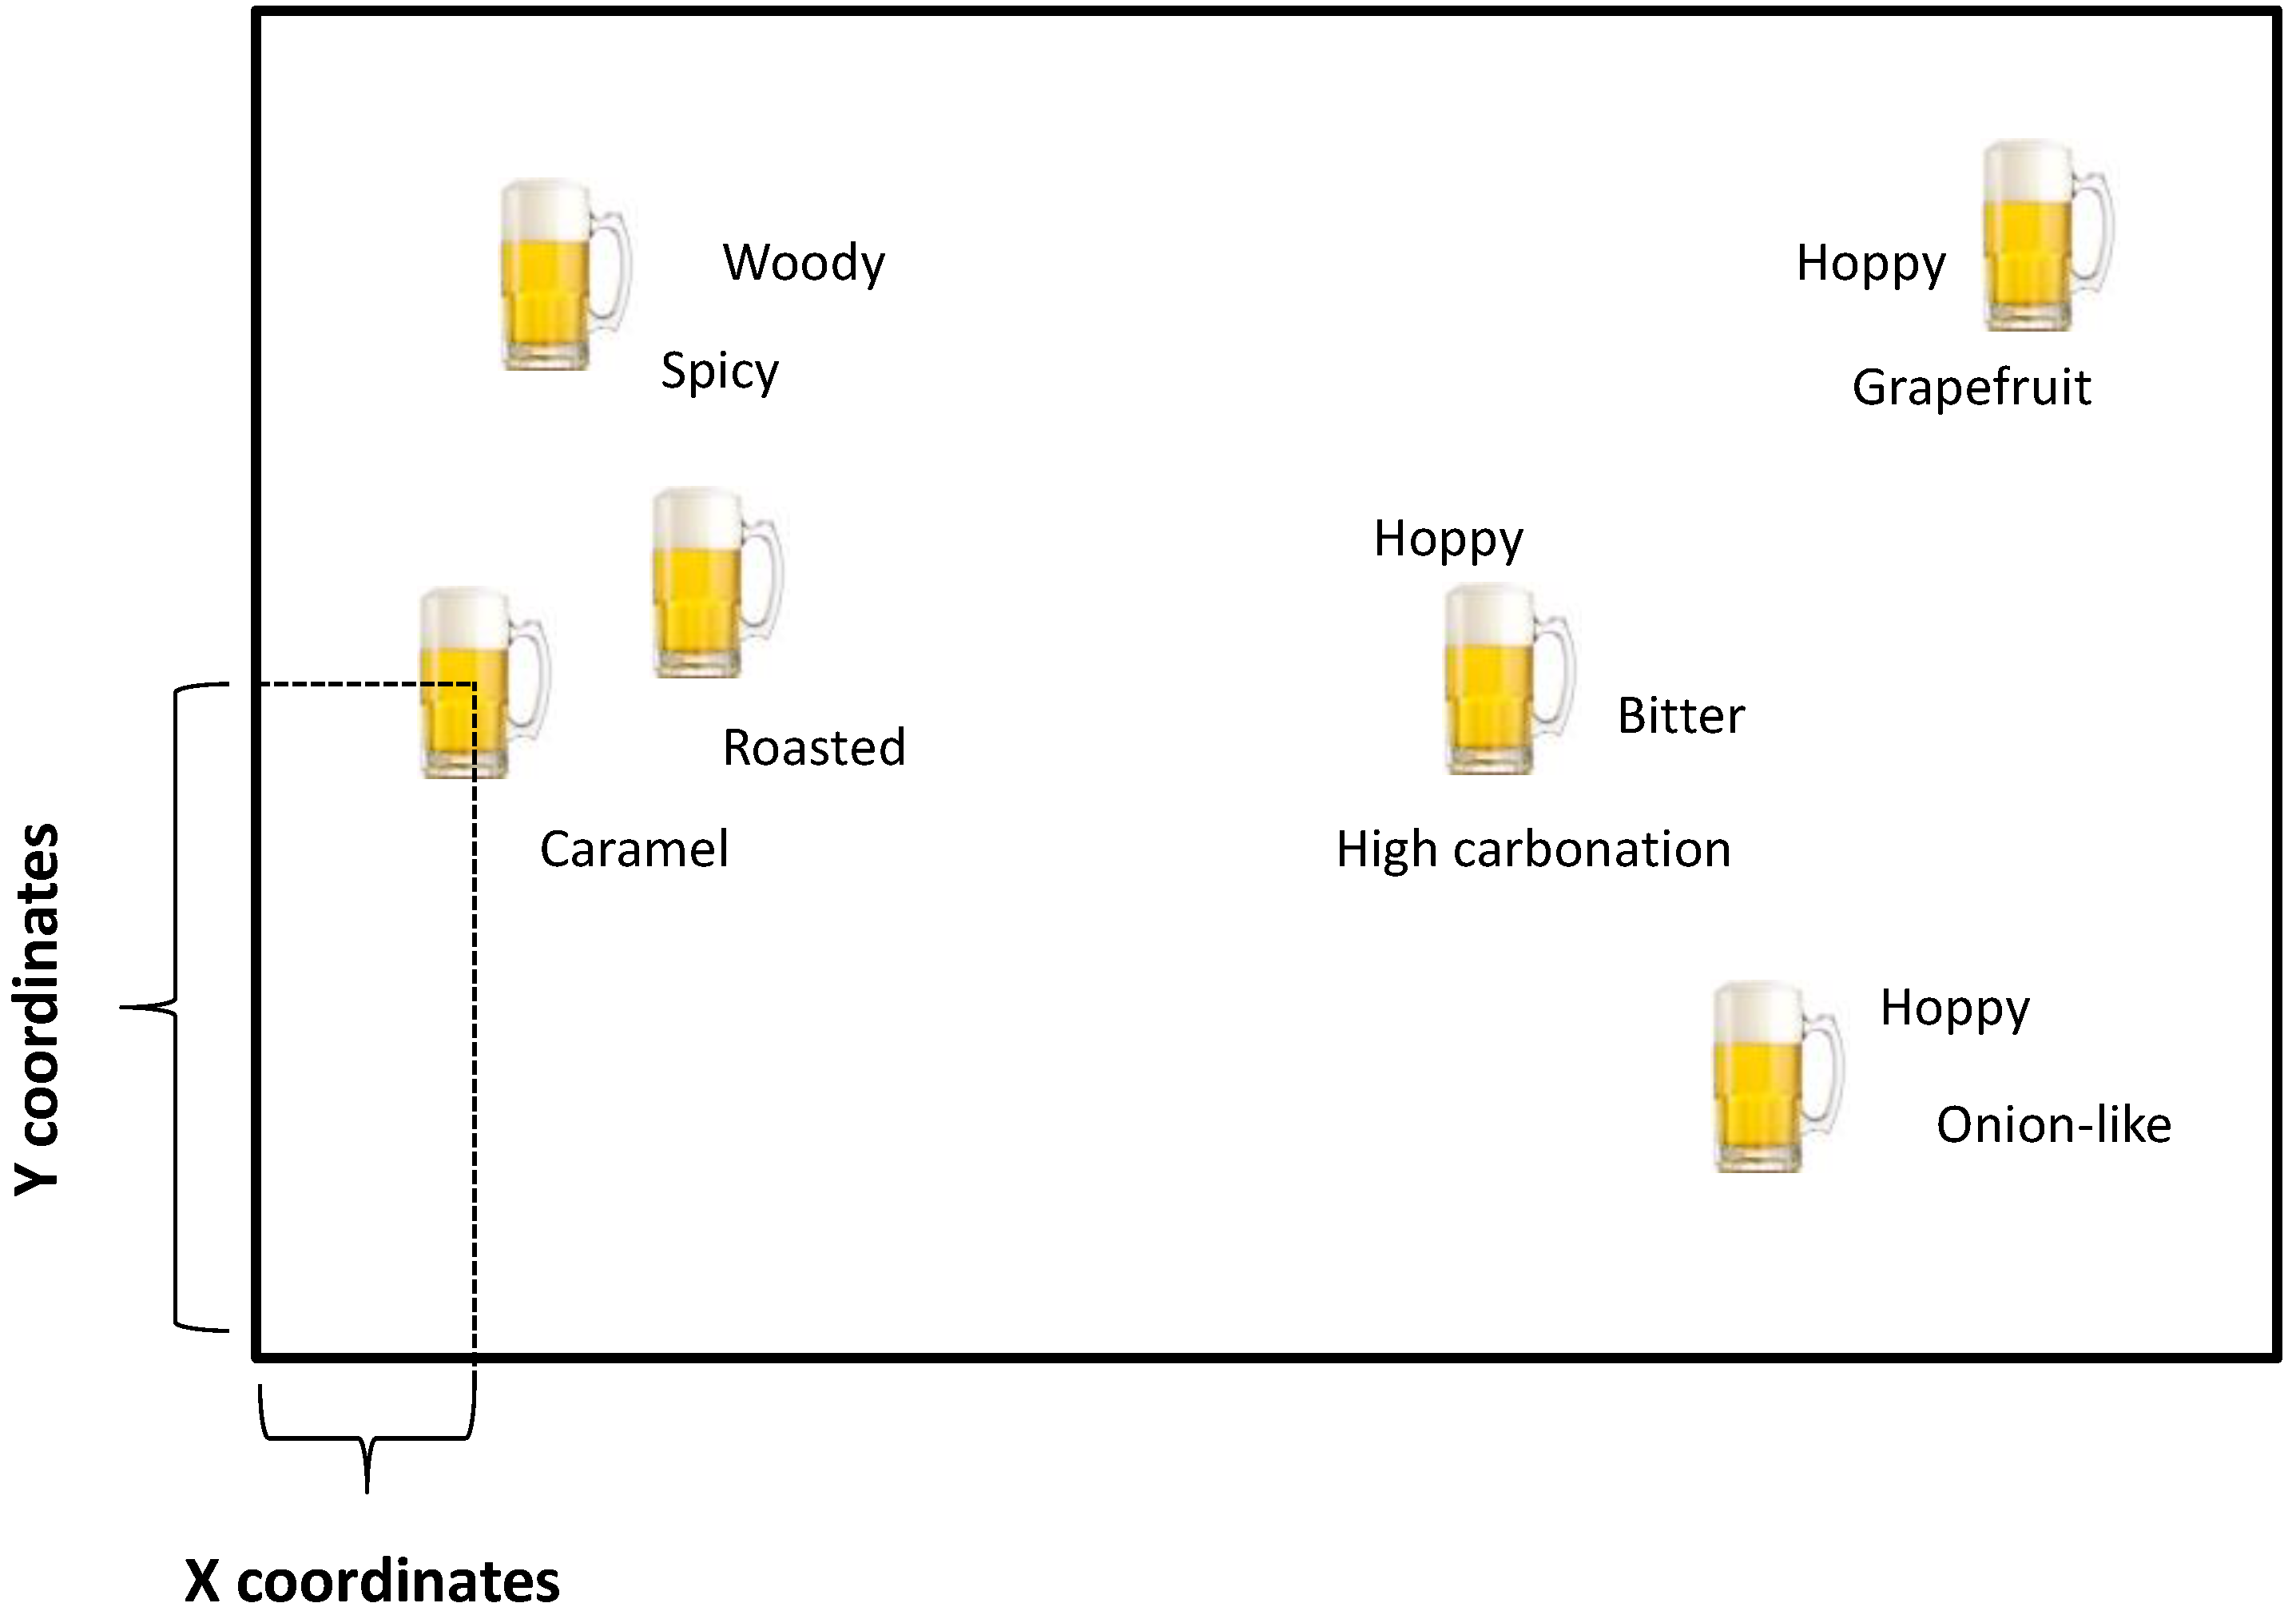
Figure 1. Visual representation of a completed Napping® sheet.
Beverages 02 00005 g001
Figure 2. Visual representation of the data structure for the two levels HMFA.
Beverages 02 00005 g002
Figure 3. First and second HMFA dimensions showing the consensus sample space, with superimposed representation of the partial points obtained by the three panels.
Beverages 02 00005 g003
Table 1. RV coefficients between partial configurations and associated p value.
RVp
Experts vs. Novices0.920.003
Experts vs. Enthusiasts0.930.003
Novices vs. Enthusiasts0.910.005
Table 2. Regression coefficients from PLS-DA showing the effect of product expertise on the use of sensory attributes elicited during the UFP. Attributes are ordered by total frequency of mention. Significant effects (chi-squared test) are reported in bold typeface and refer to differences of usage frequency of these terms across the three groups.
AttributeNovicesEnthusiastsExpertsTotalχ2 (2)p Value
Sweet−2.2+2.9−0.61274.20.123
Bitter−1.1+1.4−0.21021.00.613
Hoppy−1.3+2.4−1.1558.40.015
Caramel−1.6+1.4+0.2490.20.678
Sour−1.0+1.0−0.1471.80.410
Light+0.1+0.1−0.9334.80.090
Liquorice−0.2+0.3−0.1320.30.863
Acidic−0.8+0.6+0.2294.70.093
Spicy+0.2+0.2−0.4280.70.702
Full−0.4+0.6−0.3260.50.781
Malty−1.0+1.0+0.1266.80.033
Elderflower−0.1+0.8−0.6253.50.174
Fruity−0.7+0.1+0.4255.00.082
Floral−0.1+0.5−0.5242.20.324
Alcoholic−0.6+0.3+0.3214.20.124
Citrus−0.1+0.5−0.4211.30.519
Fresh+0.1+0.5−0.7214.10.126
Piney+0.3+0.7−1.0205.40.068
Yeasty−0.3+0.4−0.1200.50.760
Pilsner−0.5+0.5+0.1190.30.867
Neutral−0.5+0.3+0.1172.50.291
Nutty+0.1+0.4−0.5174.80.090
Strong+0.1−0.1+0.1172.30.319
Smoky+0.4−0.4−0.1158.70.012
Burnt−0.5+0.6−0.1145.50.041
Thin+0.2+0.1−0.3142.70.263
Dry−0.5+0.4+0.1134.60.100
Grainy−0.4+0.6−0.2132.60.273
Summer+0.3+0.1−0.4136.30.042
Watery−0.4+0.6−0.1133.10.211
Coffee−0.4+0.5−0.1124.30.118
Ester−0.5−0.5+1.01225.2<0.001
Roasted−0.2+0.4−0.3121.80.393
Soapy−0.1+0.4−0.3121.80.393
Woody+0.5−0.1−0.31211.10.003
Apple−0.3+0.1+0.2113.40.181
Walnut−0.2+0.4−0.2111.20.544
Anise−0.2+0.4−0.2102.30.320
Chemical−0.2−0.3+0.4911.80.003
Chocolate−0.2+0.5−0.393.40.180
Christmas−0.1−0.1+0.191.40.494
Old−0.4−0.2+0.6914.6<0.001
Round−0.2+0.2−0.190.20.879
Berries+0.2−0.1−0.285.90.052
Banana−0.3+0.3−0.172.70.260
Heavy+0.4−0.1−0.3713.70.002
Herbal+0.4−0.3−0.179.20.005
Honey+0.1+0.2−0.372.90.230
Regular+0.1+0.1−0.173.70.151
Spring+0.1+0.2−0.372.90.230
Sulfuric−0.3−0.1+0.5712.30.003
Autumn+0.2+0.1−0.266.00.050
Low bitterness−0.2+0.2+0.162.70.260
Medicine−0.2+0.3−0.163.50.176
Perfume+0.1−0.1−0.160.50.786
Weak−0.1+0.1−0.160.40.815
Winter+0.2+0.1−0.363.10.140