
Optimization of the Juice Extraction Process and Investigation on Must Fermentation of Overripe Giant Horn Plantains

1
Department of Process Engineering, National School of Agro-Industrial Sciences (ENSAI), University of Ngaoundere, P.O. Box 455 Ngaoundere, Cameroon
2
Department of Food Processing and Quality Control, University Institute of Technology (UIT), The University of Ngaoundere, P.O. Box 455 Ngaoundere, Cameroon
*
Author to whom correspondence should be addressed.
Beverages 2017, 3(2), 19; https://0-doi-org.brum.beds.ac.uk/10.3390/beverages3020019
Submission received: 6 March 2017
/
Revised: 24 March 2017
/
Accepted: 6 April 2017
/
Published: 13 April 2017
(This article belongs to the Special Issue Phenolic Compounds in Fruit Beverages)
Abstract
:The study was initiated to optimize the enzymabtic extraction process of plantain pulp using response surface methodology. Weight loss of plantain decreased until it became stable at an over-ripe stage. The significant regression model describing the changes of extraction yield and Brix with respect to hydrolysis parameters was established. Temperature contributed to reducing the yield from 53.52% down to 49.43%, and the dilution factor increased the yield from 53.52% to 92.97%. On the contrary, the dilution factor significantly reduced Brix from 21.74 °Bx down to 0.15 °Bx, while the enzyme concentration increased Brix from 21.73 °Bx to 26.16 °Bx. The optimum conditions for juice extraction from plantain pulp were: temperature: 25 °C; enzyme concentration: 5%; dilution ratio: 1.10; and extraction time: 24 h. The implementation of these conditions led to (resulted in obtaining) obtaining a must yield of more than 70% and Brix between 10 °Bx and 15 °Bx. The total polyphenols and flavonoids were 7.70 ± 0.99 mg GAE /100 g and 0.4 ± 0.01 µg rutin/g for must and 17.01 ± 0.34 mg GAE/100 g and 4 ± 0.12 µg rutin/g and 7.70 ± 0.99 for wine, indicated the presence of antioxidant activity in the produced wine. On the other hand, the total soluble solids were between 16.06 ± 0.58 °Bx and 1.5 ± 0.10 °Bx, which permitted obtaining a wine with low alcohol content.
1. Introduction
Although banana/plantain is a staple for many African countries, it has until recently not been successfully exploited in food processing and assimilated industries due to the lack of adequate post-harvest preservation technologies [1]. The high level of post-harvest losses is one of the food security challenges facing African countries. In Sub-Saharan Africa, the annual value of these losses is estimated at about USD 48 billion [2]. Cameroon produces about 3,882,741 million tons of plantain annually [3]. Approximately half of this is consumed locally, while less than two fifths is exported. The remaining quantities rot in the fields because of rapid ripening of the fruits, poor handling, inadequate storage and transportation means and poor knowledge of food processing options [1]. It is estimated that more than 30% of the banana [4] and 35% of plantain [5] production are lost after harvest in developing countries. In Cameroon, studies have estimated that 30% of post-harvest losses are incurred during whole sale and about 70% during retailing [4].
Banana plants are important monocotyledonous perennial crops in the tropical and subtropical world regions [6]. They include dessert banana, plantain and cooking bananas. Plantain (Musa paradisiaca) is one of the most important crops of the tropical plants. It belongs to the family Musaceae and the genus Musa. Lately, wine production has been honed with different natural products, for example apple, pear and strawberry, fruits, plum, pineapple, banana and oranges [7,8,9]. Wines are energizing drinks that have been viewed as a characteristic solution for man’s disease from early days and are said to help recuperation amid the gaining strength period [10,11]. Studies to upgrade banana juice extraction were completed by utilizing diverse levels of pectinase enzymes and distinctive hatching periods at 28 ± 2 °C [12]. The juice recuperation from over-ripe bananas was higher (67.6%) than that from ordinary natural fruits (60.2%). A great quality wine was obtained from over-ripe banana fruits [12,13].
There is an extensive misuse of bananas, particularly those that do not meet the quality standards for export. Because of the way that the banana/plantain fruit is organically dynamic and completes transpiration, ripening and other biochemical exercises even after harvest, the losses are high [5]. This phenomenon has shifted to break down the nature of leafy foods, making them unmarketable. Wastage of the plantain fruit because of poor post-harvest handling or over-ripening remains a noteworthy issue today. The change of over-ripe plantain into other important items has been the main impetus behind this study. Over the span of this study, we chose to concentrate on the production of wine from giant horn over-ripe plantains. This will be done using response surface methodology and by applying industrial enzymes to quantitatively extract plantain juice, determining the parameters for optimum yield and analyzing some physicochemical parameters before and after fermentation.
2. Material and Methods
2.1. Material
2.1.1. Biological Material
Giant horn plantain (Figure 1) was obtained from a farmer in Mamfe in the South West Region, Cameroon. Enzymes’ characteristics utilized were as mentioned in Table 1. The white wine yeast Lalvin ICV D-47 Saccharomyces cerevisiae was issued by The Home Brew Shop (Unit 3, Hawley Lane Business Park, United Kingdom).
2.1.2. Chemicals
The following reagents were obtained from Fluka Chemika, Switzerland: 3,5-dinitrosalicylic acid (DNS), ethanol, fructose, D-Glucose, NaOH and maltose; while ninhydrin, sodium carbonate (Na2CO3), sodium potassium tartrate and sodium hydroxide were obtained from Chemphora Chemical, Netherlands.
2.2. Methods
2.2.1. Sample Ripening
Unripe mature plantains were over-ripened for 11 days at 25 ± 2 °C utilizing a Heraeus-type incubator (D-63450 Hanau, Germany) without the use of ethylene until they passed Stage 7 (over-ripe). After that, samples were used immediately for wine production.
2.2.2. General Process Overview
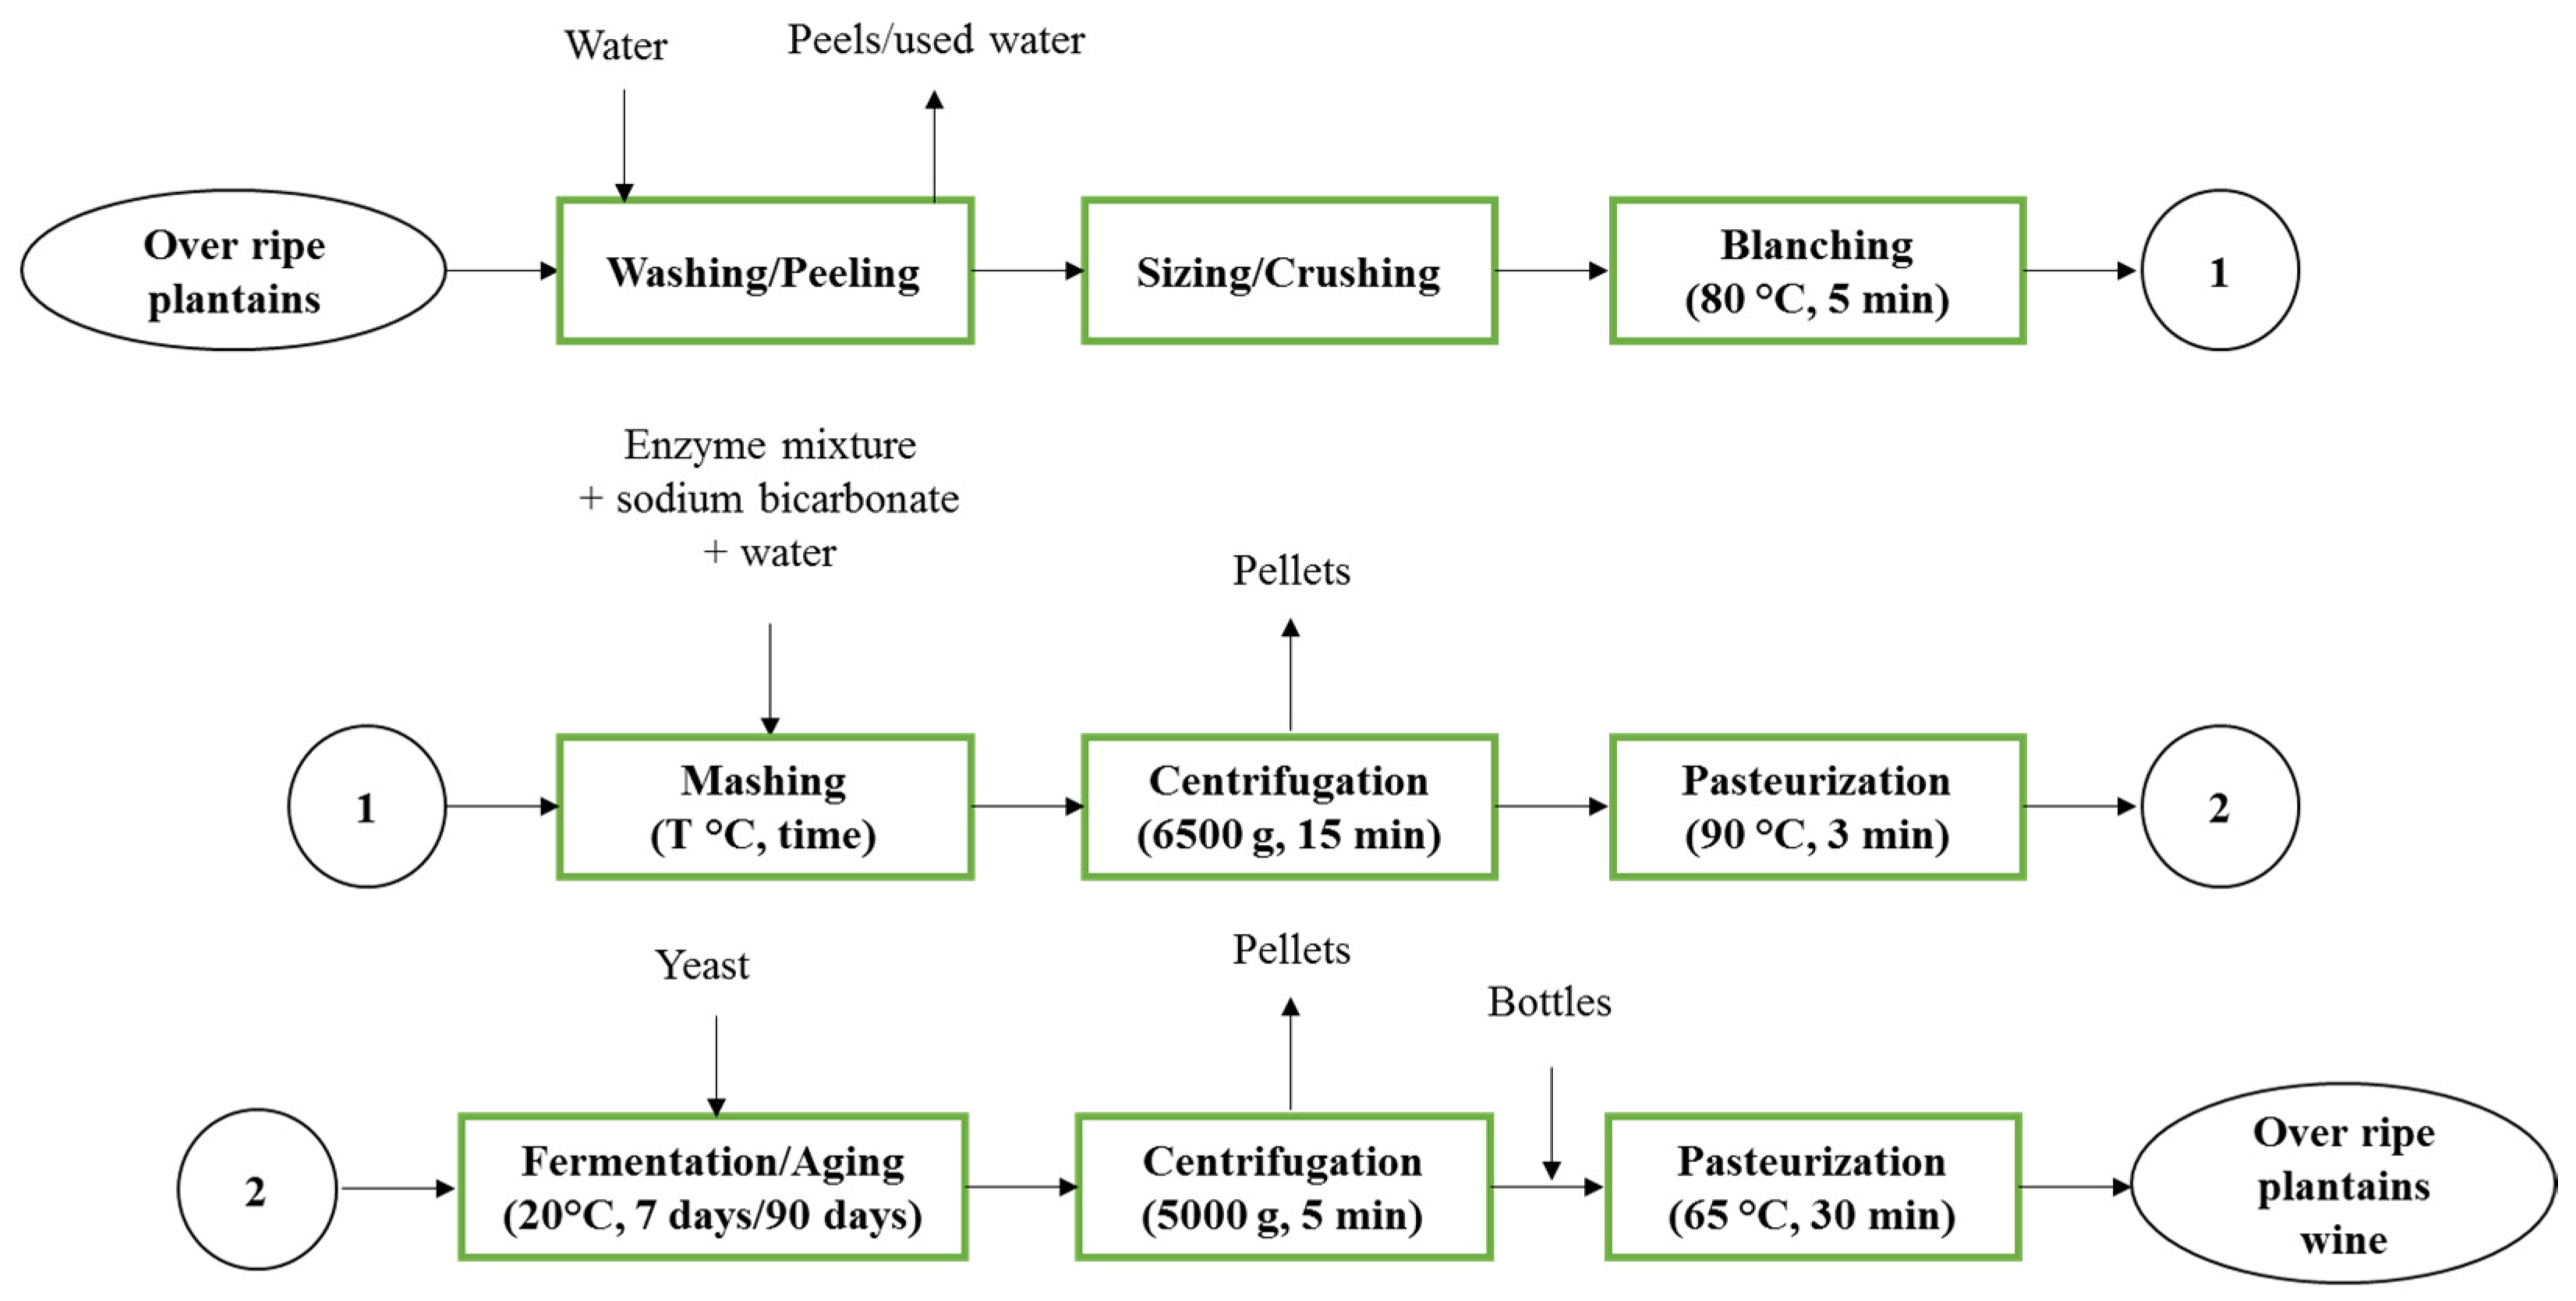
The methods involved in wine production from over-ripe giant horn plantain are given in Figure 2.
The over-ripe plantains coming from the ripening process were washed three times with tap water and peeled. After the peeling process, they were sized and crushed to get the pulp paste. Then, the blanching process was executed at 80 °C for 5 min. Pulp paste was mashed using Doehlert experimental design conditions when the enzyme mixture, sodium bicarbonate and water were added. At the end of the mashing process, the mash was centrifuged (6500× g, 15 min) to remove pellets, and the must was then pasteurized (90 °C, 3 min). After cooling, the must was fermented at 20 °C for 7 days using yeast (4 g/L) and aged for 90 days. At the end of the aging process, the wine was centrifuged (5000× g, 5 min) to remove pellets (trub and yeast) and bottled. The bottles containing wine were then pasteurized at 65 °C for 30 min.
2.2.3. Experimental Design for the Extraction Process
Doehlert’s experimental design [14] was used to model four factors: extraction temperature (°C), enzyme concentration (%), dilution factor and extraction time (h). The experimental domains (Table 2) over which factors were studied were based on the literature. These independent variables were studied using the response surface methodology (RSM) at three different levels (−1, 0, +1) to give a total of 25 experiments. The conversion of coded values into real values was done according to the literature [15].
2.2.4. Modelling and Optimizing
The model chosen was an empirical quadratic model, which determined the magnitude of the contributions of each factor in the linear, quadratic and interaction forms. The model used to determine the responses is given below:
where is the response, a constant, the linear coefficients, the quadratic coefficients, the coefficients of interaction, and , , , and , the linear, interaction and quadratic forms of the experimental variables respectively. is the error. The determination of the coefficients of the models was done by a multilinear regression in which we had: the number of experiments in the design matrix, the number of coefficients in the chosen model, the vector of experimental responses yi, ; the vector of theoretical responses , ; the matrix , matrix of the model.
is the column vector of the parameters to be estimated; …; ; is the column vector of estimators , is the column vector of experimental error , .
Given the following classical matrix:
when , the least squares method is used to estimate the coefficients of the polynomial.
is an estimator of
To this effect, Minitab software was used to determine the coefficients of the models.
In order to write equations that allow for the prediction of responses in the domain defined for the studies, it was important to validate the models. To that effect, the observed values and the values predicted by the model were compared. Further statistical tools were used in addition to the determination coefficient. Absolute average deviation (AAD) was calculated as follows:
is the experimental response and the response calculated from model i; N is number of experiments.
The bias factor () and exactitude factor () were also expressed as follows:
with:
Table 3 gives the acceptable values of the different indicators of valid models. The graphs and contour plots were done using OriginPro 2016 b9.3.226 (OriginLab Corporation, www.originlab.com).
Optimization was done using the software Minitab® 17 (Build 17.3.1, Minitab, Inc.). The conditions were fixed to maximize the extraction yield and Brix. After that, a compromise was made. The use of Sigmaplot (Version 12.5, Systat Software, Inc.) allowed drawing the contour plots and superimpose the graphs in order to determine the interest zone.
The analysis of variance (Table 4) was used to identify the influence of each factor and also the significance of their effects. This was achieved by comparing the average square of each effect to the experimental error. The significance of each factor was determined by the Fischer test. The significance of the Fischer (F) ’ratio’ indicates the values necessary to reject the null hypothesis at the 0.05 probability level.
2.2.5. Juice Extraction
Over ripe plantains were washed 3 times, hand peeled and sized. A Panasonic blender (MX-GM1011) was used to crush the plantains, then they were blanched in water at 80 °C for 5 min in a water bath (Memmert). The four enzymes, amyloglucosidase, alpha amylase (BAN 480 L), pectinase and bioglucanase TX, were then introduced into biological reactors (beakers) containing 20 g of the pulp with its respective dilutions, which was then incubated at a temperature and time specified by the Doehlert experimental design in a water bath. After incubation, the pulp was then centrifuged at 6500× g for 15 min using a centrifuge (Heraeus-Kendro Lab products, model: Biofuge primo R, type: D-37520, Hanau, Germany). The supernatant was collected and pasteurized at 90 °C for 1 min in the water bath. Each experiment was conducted in triplicate.
2.2.6. Yeast Preparation and Must Fermentation
The white wine yeast Lalvin ICV D-47 Saccharomyces cerevisiae obtained from The Home Brew Shop (Unit 3, Hawley Lane Business Park, United Kingdom) was used for the fermentation of the giant horn plantain. Yeast, which was kept at 2–4 °C, was rehydrated at 30 °C in tap water (10 mL of water/g of yeast) for about 10 min and stirred for 5 s. After rehydration, yeast was introduced to the giant horn plantain juice extracted utilizing optimal conditions, and the mixture was mixed to ensure must aeration and yeast distribution. The principal fermentation was then done at 20 °C during 7 days and aging for 90 days in an incubator (SHP Biochemical Incubator 250 L, Shanghai, Guangzhou, China).
2.2.7. Determination of Extraction Yield
The percentage of juice yield (% w/w) was calculated as the difference between the initial mass and the weight of the pellet after centrifugation divided by the initial mass as follows:
2.2.8. Determination of Total Soluble Solids [19]
Before reading the value of total soluble solids, the Hanna HI 96801 refractometer (Hanna instruments Inc., Woonsocket, RI, USA) was calibrated using distilled water. An equal number of drops from the prepared plantain juice was placed onto the refractometer prism plate. The reading on the prism scale is generated numerically. After each test, the prism plate was cleaned with (distilled) water and wiped dry with a soft tissue.
2.2.9. Determination of pH
The initial pH of each plantain juice was determined using a pH meter (HANNA® Calibration Check™ pH meter, HI 223 Type, Johannesburg, South Africa). Twenty milliliters of each freshly-prepared plantain juice was placed in a glass beaker on a thermostatically-controlled electric hotplate (mark: GMARK) at 25 °C. Before reading its pH, each sample was agitated (using a magnetic stirrer) for 30 s until a stable reading was assessed. Each test was made in triplicate. Between readings, the electrode was rinsed with distilled water for the accuracy of the measurement.
2.2.10. Determination of Turbidity
To the turbidimeter cell, the plantain juice was added up to the horizontal mark. After closing the cell, it was wiped using a tissue and placed in the turbidimeter (Hach, Model 2100 N, Hach Company, Loveland, CO, USA), and the sample was covered. The turbidity value was then assessed when the reading was stable.
2.2.11. Determination of Total Phenolic Compounds: Folin–Ciocalteu Method [20]
The volume of 0.02 mL of plantain juice before and after fermentation was mixed with 0.1 mL of Folin–Ciocalteu reagent previously diluted with distilled water. A volume of 0.3 mL of 20% sodium carbonate solution was added to the mixture, shaken thoroughly and diluted to 2 mL by adding distilled water. The mixture was allowed to stand for 120 min, and the blue color formed was measured at 760 nm with a spectrophotometer (JENWAY, Model: 7310, Serial No. 39756, JENWAY Limited, Staffordshire, UK). Gallic acid was invoked as a standard for the calibration curve. The concentrations of gallic acid in the solution, utilized for obtaining the calibration curve, were 0, 1, 2, 3, 4, 5, 6, 7, 8, 9 and 10 mg/L (R2 = 0.965). The total polyphenol content was expressed as mg of gallic acid equivalent (GAE) per 100 g of fruit juice. All measurements were carried out in triplicate.
2.2.12. Determination of Titratable Acidity [21]
Titratable acidity was established according to the standardized method, with 0.1 N sodium hydroxide (NaOH) in the presence of the phenolphthalein indicator. Ten milliliters of sample were pipetted into a conical flask and 0.1 mL of phenolphthalein (0.05%) added. Titration is halted when the initial color changes to pink and persisting for at least 30 s. The burette reading is noted. The titratable acidity (TA) is expressed in g/L tartaric acid:
where: is the volume (mL) of the sodium hydroxide noted at the end point; is the concentration of the base; is the volume of titrate.
2.2.13. Determination of Color by the Spectrophotometric Method [22]
The wavelength of the spectrophotometer (JENWAY, Model: 7310, Serial No. 39756, JENWAY Limited, Staffordshire, UK) was set at 430 nm. The cell was filled with water and the absorbance set to read as 0.00. The cell was then rinsed and filled with the sample (must and wine) and the absorbance read. For samples with a turbidity above 1 EBC, a filtration was done before using a 0.45-µm membrane filter (Whatmann, GE Healthcare, Chicago, IL, USA). The results were then expressed as follows:
where: is absorbance at 430 nm; is the dilution factor; EBC is the European Brewery Convention units.
2.2.14. Dry Matter and Water (Moisture) Contents
Crushed plantain pulp (5 g) was weighed using a balance (SCIENTECH, ZSP250 MG Balance, Scientech Inc., Boulder, CO, USA) and placed in a drying dish. The dish was then placed in an oven (Heraeus, model: Kendro laboratory products, D-63450, GmbH, Hanau, Germany) previously set at 105 °C and left there till it attained constant weight. It was removed from the oven at the end of 24 h. After cooling in a desiccator, the dish was then weighed again. The dry matter content represents the difference in mass before and after drying in the oven. The dry matter (DM) content in 100 g of fresh sample was calculated using the following formula:
where: is mass (in g) of empty drying dish; is mass (in g) of sample before drying; is mass (in g) of drying dish + sample after drying.
The water or moisture content (%W) was calculated using the following expression:
2.2.15. Determination of Reducing Sugars by the DNS Method [23,24]
The 3,5-Dinitrosalicylic acid (DNS) reagent was made by mixing in 5 g of dinitrosalicylic acid (Fluka Chemika, Fluka Chemie GmbH, Buchs, Switzerland) in 250 mL of distilled water at 80 °C in a water bath (Memmert, Memmert GmbH + Co., Äußere Rittersbacher Straße 38 D-91126 Schwabach, Germany). When this solution dropped to room temperature (25 °C), 100 mL of NaOH, 2 N (Fluka Chemika, Switzerland) and 150 g of sodium potassium tartrate (Fluka Chemika, Fluka Chemie GmbH, Buchs, Switzerland) were introduced, and the volume was completed with distilled water to 500 mL. The standard calibration curves were on glucose. According to the traditional method, 2 mL of dinitrosalicylic acid reagent and 0.1 mL of sample (must or wine), or distilled water (blank), were added to test tubes. The tubes were plunged in a water bath (100 °C) for 5 min and then cooled in cold water, while 7.9 mL of distilled water were introduced to each tube, resulting in the final reaction mixture. The addition of water while the tubes are plunged in cold water is performed to stop the reaction immediately. The optical density at 540 nm is read in the UV-visible spectrophotometer (JENWAY, Model: 7310, Serial No. 39756, JENWAY Limited, Staffordshire, UK).
2.2.16. Flavonoids
The flavonoid contents in the produced must and wine were determined utilizing spectrophotometric method [25]. The sample (20 µL) was added to 2 mL of 2% AlCl3 solution dissolved in methanol. The samples were incubated for 1 h at room temperature (25 °C). The absorbance was assessed using the spectrophotometer at λmax = 415 nm. The same steps were repeated for the standard solution of rutin, and the calibration line was built. Based on the determined absorbance, the concentration of flavonoids was read (mg/mL) on the calibration curve; and the flavonoid contents of must and wine were expressed in rutin equivalents (µg rutin/g of extract).
3. Results and Discussion
3.1. Ripening of Plantain
3.1.1. Percentage of Weight Loss
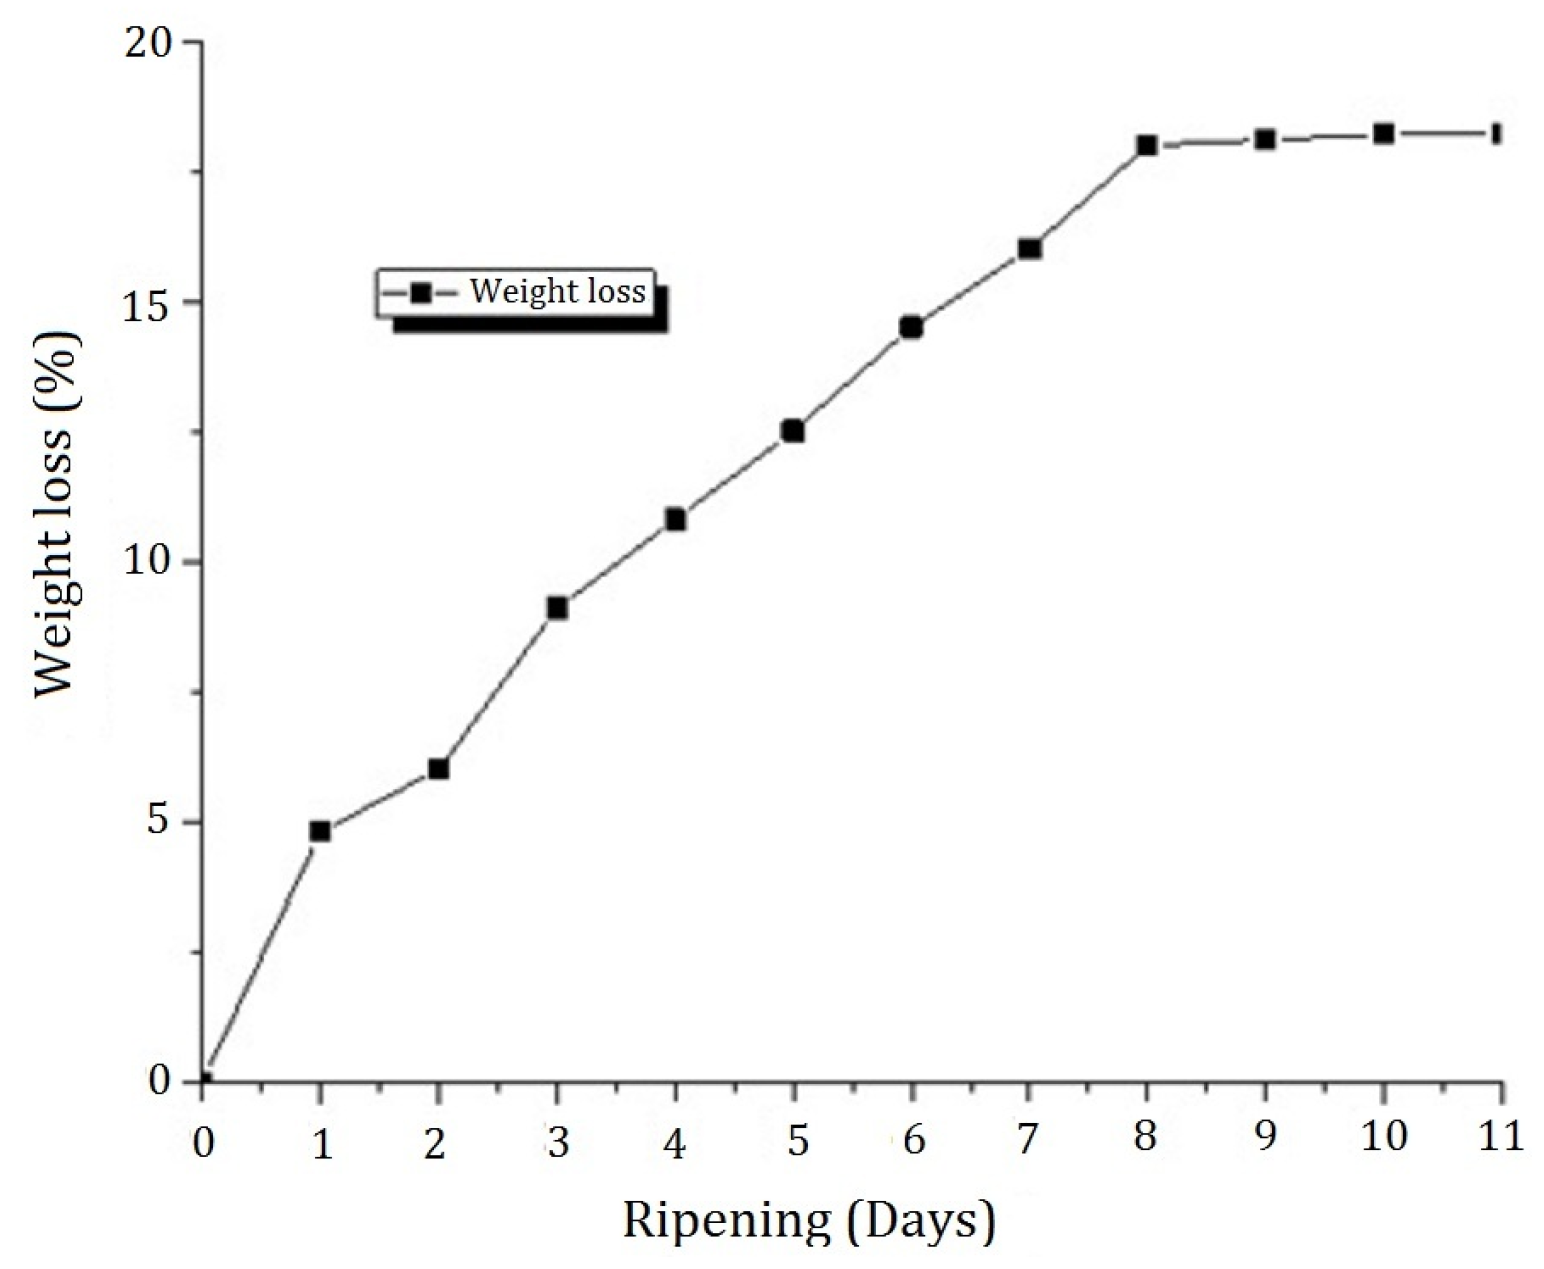
The weight loss evolution of giant horn plantain with ripening time is presented in Figure 3.
It was observed from the figure that the weight loss increased to reach a maximum weight loss of 18.2% after 10 days. The weight loss percentage obtained was higher than the 14.01% obtained after plantain ripening for 10 days [26,27,28,29]. The percent of the weight reduction of ‘giant horn’ plantain expanded constantly due to ripening because of a high storage temperature, ~25 °C. Like every chemical reaction, the plant metabolism increments with temperature. Since high energy was required to run the procedure, consequently, starch was changed over to sugar and utilized as energy. The most striking post-harvest compound change that happens amid the post-harvest ripening of plantain was the hydrolysis of starch and the amassing of sugars, like, sucrose, glucose and fructose [30,31], which were responsible for the sweetening of the product (as it matures). In plantain, this breakdown was slower and less complete and proceeds in over-ripe and senescent fruit [32]. The abundant energy created therefore from the respiration process [33,34] was dismissed from the tissue by the vaporization of water, which will in this way be transpired from the fruit, bringing on a weight reduction. A portion of humidity reduction through the peel could be seen through shrinkage on the peel.
3.1.2. Moisture Content
The moisture content of the ripe plantain was 63.4% ± 0.52%. This value was in the range of the value (61.3%) obtained in the literature [35]. The high moisture contents in the ripe plantain could be as a result of moisture transfer from the peel to the pulp. It was reported that the increase in moisture content of pulp occurred due to the increase in sugar content in the pulp as a result of starch hydrolysis to sugar [35,36].
3.2. Modelling and Optimizing of Juice Extraction
Table 5 presents the findings of the juice extraction carried out on the blanched plantain pulp. These results were later computed to develop statistical models for responses, amongst which were the yield and Brix. They are written as follows:
with: , Brix; , yield; , extraction temperature; , enzyme concentration; , dilution factor and , extraction time.
The values, , and permitted the validation of the model. This was in accordance with the literature [18,37,38]. Factors modeled were linear (, , and ), quadratic (, , and ) and with interactions (, , , , and ). They were considered statistically significant or not if the probability (p) was ≤0.1 or ≥0.1, respectively (Table 6).
These models were the second-degree multivariable polynomial with interactions equations with the following characteristics: R2 = 0.98 an, AAD = 0 for both, Af = 1.016 and 1.065 and Bf = 1.000 and 0.997, respectively, for yield and Brix.
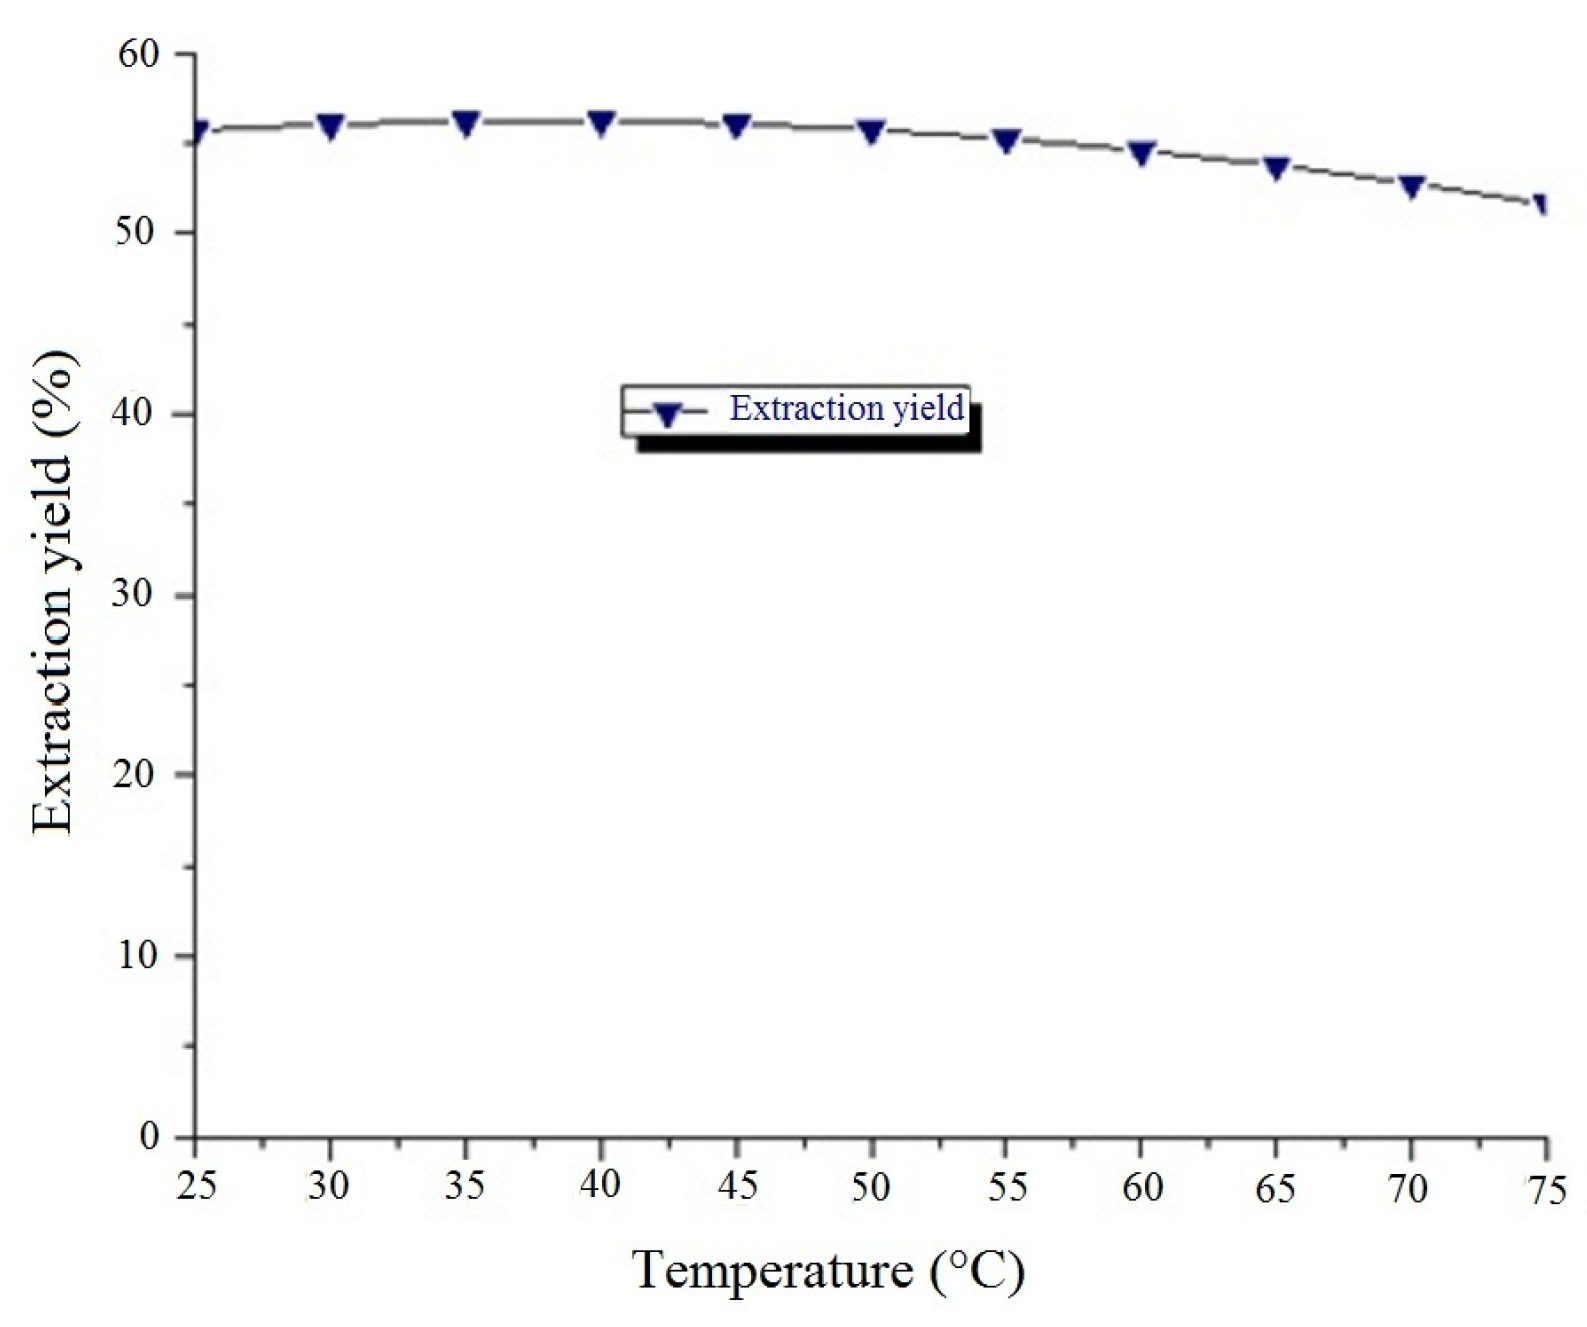
3.2.1. Impact of Extraction Temperature
The impact of extraction temperature was only significant (p = 0.010, Table 6) on the extraction yield. In fact, that temperature contributed to reducing the yield from 53.52% at 25 °C to 49.43% at 75 °C (Figure 4) when fixing the enzyme concentration at 0.1%, the dilution factor at zero (no dilution) and the extraction time at 0.5 h. It was found that for an average of several hybrids of plantains, an amount of water was absorbed after 30 min cooking [39,40]. When heated in excess water with a sufficient amount of heat, native starch granules undergo irreversible phase transition, called gelatinization [41]. The highly-ordered structure becomes disordered. Gelatinization of starch has been broadly defined as an irreversible endothermic transition, the “breakage of the molecular order”, breaking the hydrogen bonds in the starch granule. Irreversible changes are observed: water gain, swelling of the granule, crystalline melting, loss of birefringence, the solubilization of the starch and the increase in viscosity [42]. During the heat treatment, the water enters in the first place in the amorphous regions, which swell and transmit disturbing forces in the crystalline regions [43,44]. All of this results in the reduction of yield extraction.
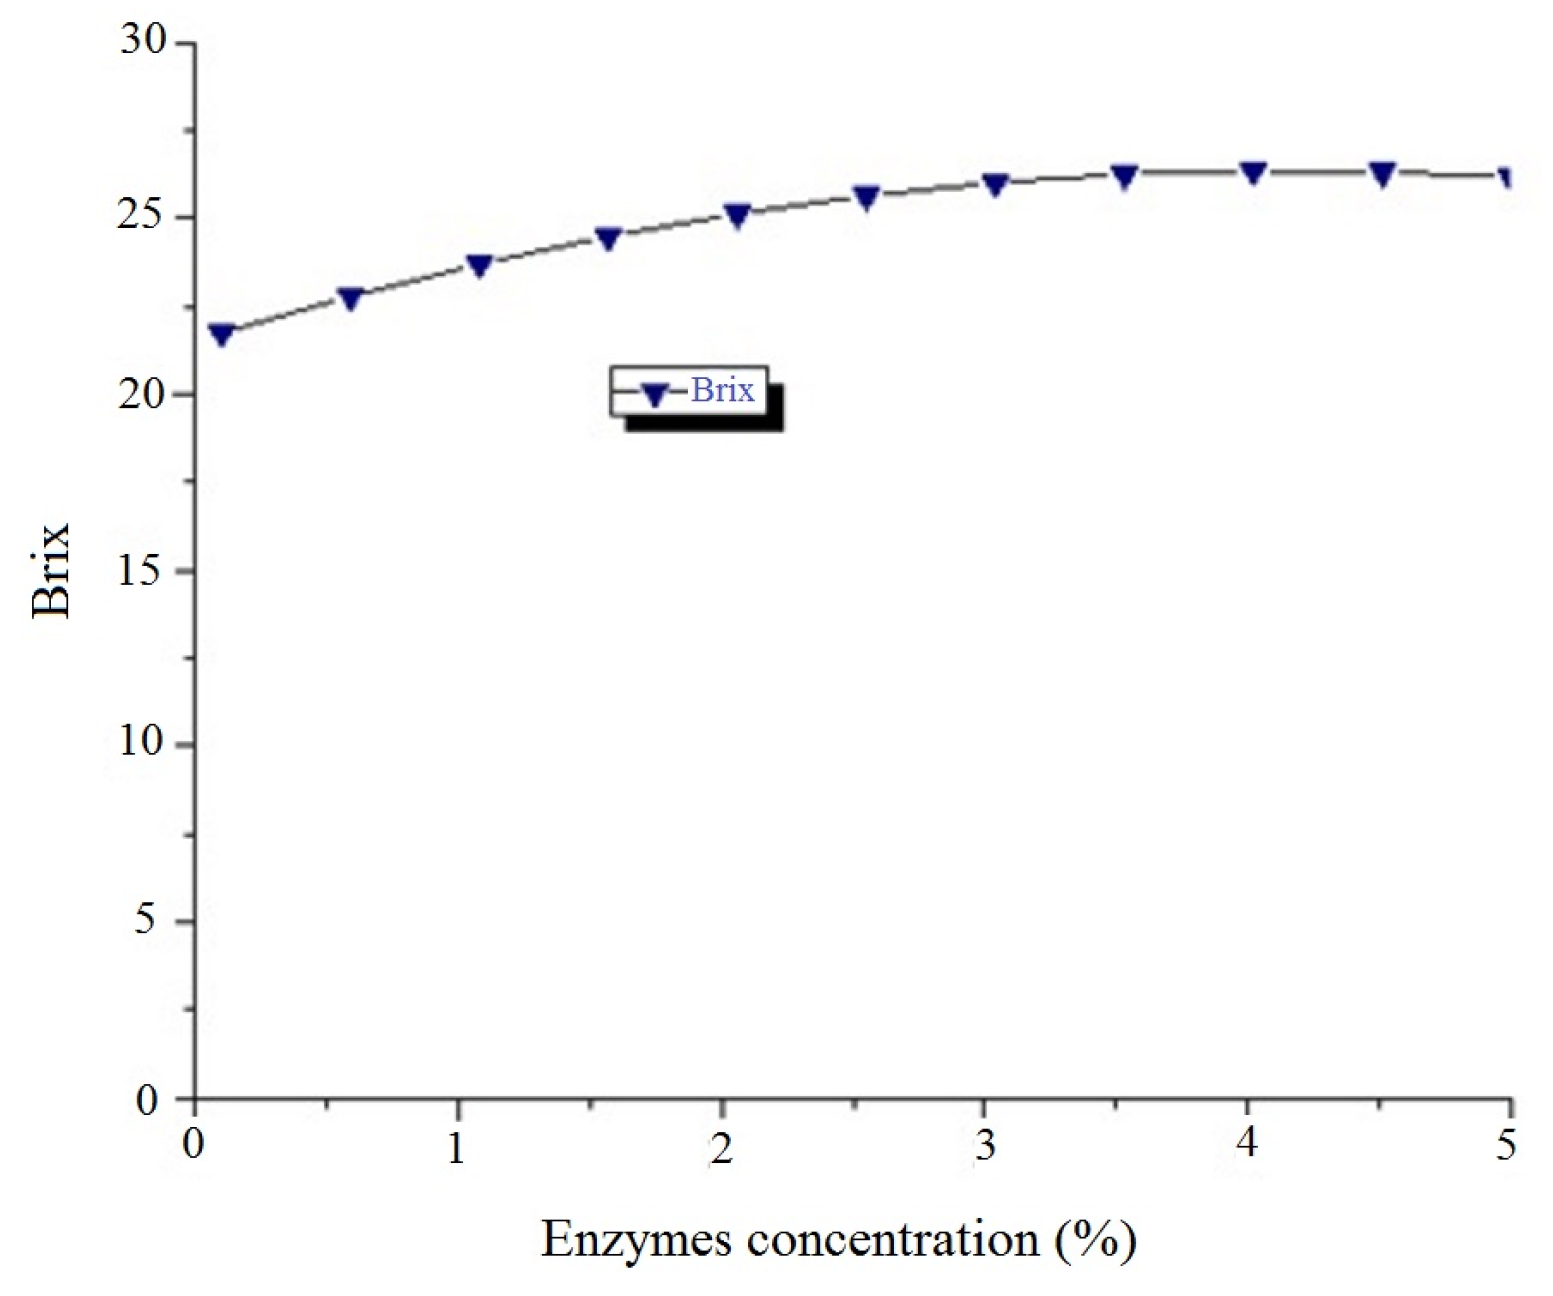
3.2.2. Impact of Enzyme Concentration
The impact of enzyme concentration was this time only significant (p = 0.066, Table 6) on the Brix. In fact, the enzyme concentration contributed to increase the Brix from 21.73 °Bx at 0.1% to 26.16 °Bx at 5% (Figure 5) when fixing the extraction temperature at 25 °C, the dilution factor at zero (no dilution) and the extraction time at 0.5 h. The use of multiple enzymes increased the TSS (total soluble solids) content of juice. The enzymatic effect permitted the cell walls to be more permeable, which generated the extraction of total soluble solids from the plantain puree. The presence of polysaccharide-degrading enzymes (amyloglucosidase, α-amylase, pectinase and bioglucanase activities) in the preparations was then linked to a higher degree of tissue breakdown, discharging more compounds, such as sugars [45], which contribute to total soluble solids.
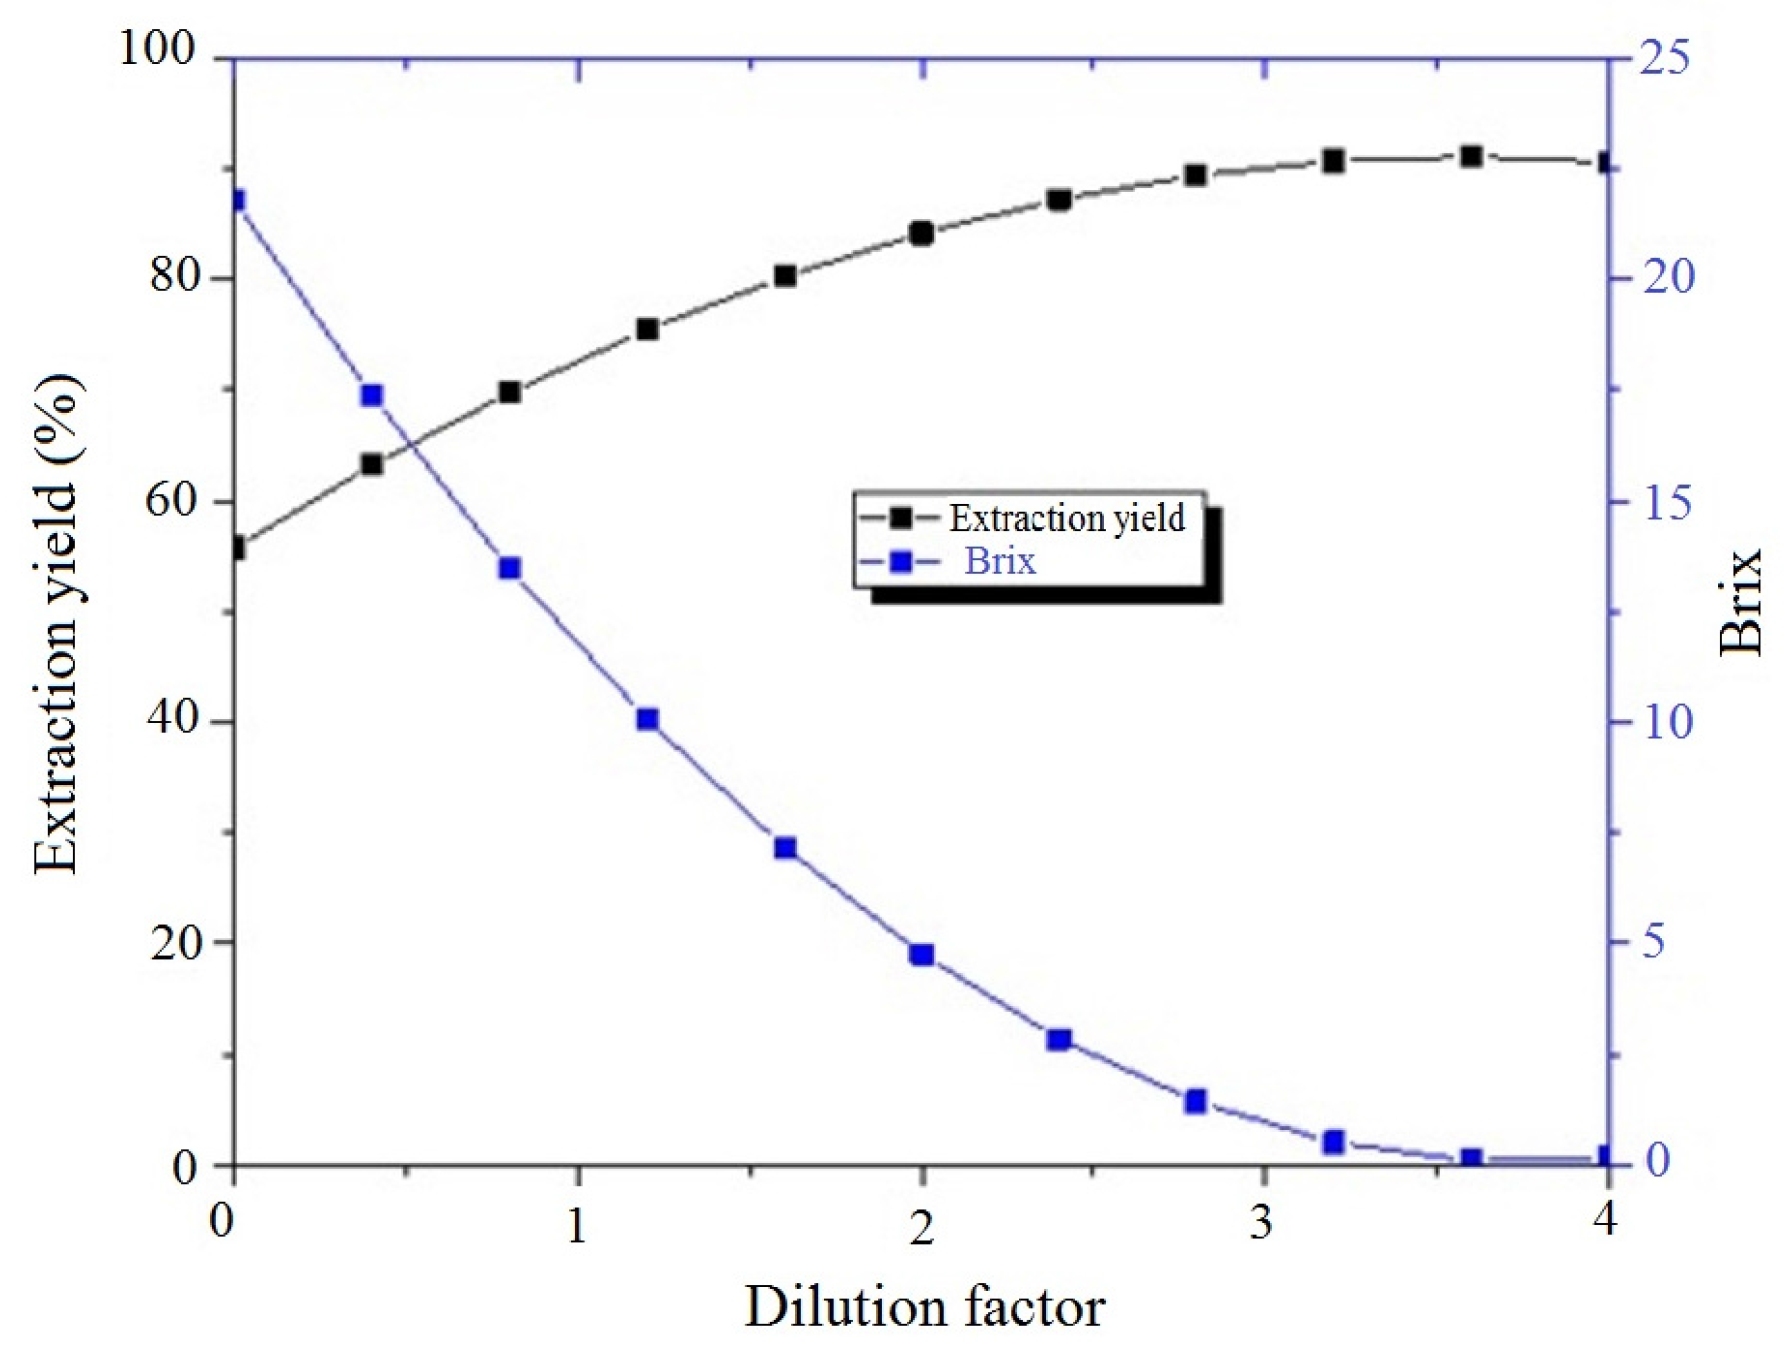
3.2.3. Impact of the Dilution Factor
The effect of the dilution factor was significant (p = 0.000 for both; Table 6) on the increase of extraction yield and the decrease of Brix.
The increase for extraction yield started from 53.52% at zero (no dilution) to 92.77% at four, while the decrease of Brix (Figure 6) started from 21.74 °Bx at zero (no dilution) to 0.15 °Bx at four; all this when fixing the temperature at 25 °C, the enzyme concentration at 0.1% and the extraction time at 0.5 h.
The increase of water during the extraction process contributed to the increase of extraction yield because at the fixed temperature of 25 °C, the starch granules were not gelatinized, and therefore, the more water was added during the process, the more it was recovered during centrifugation to obtain the juice; while, at the same time, the increase of water when proceeding to extraction contributed to diluting the total soluble solids of that juice, which had as the impact the reduction of the Brix, which expresses the concentration (in percentage) of total soluble solids in the juice.
3.2.4. Optimization of Juice Extraction
Production of the juice took globally into account the compromise between the extraction yield and the physicochemical composition of the juice extracted, since the extraction procedure could influence the composition.
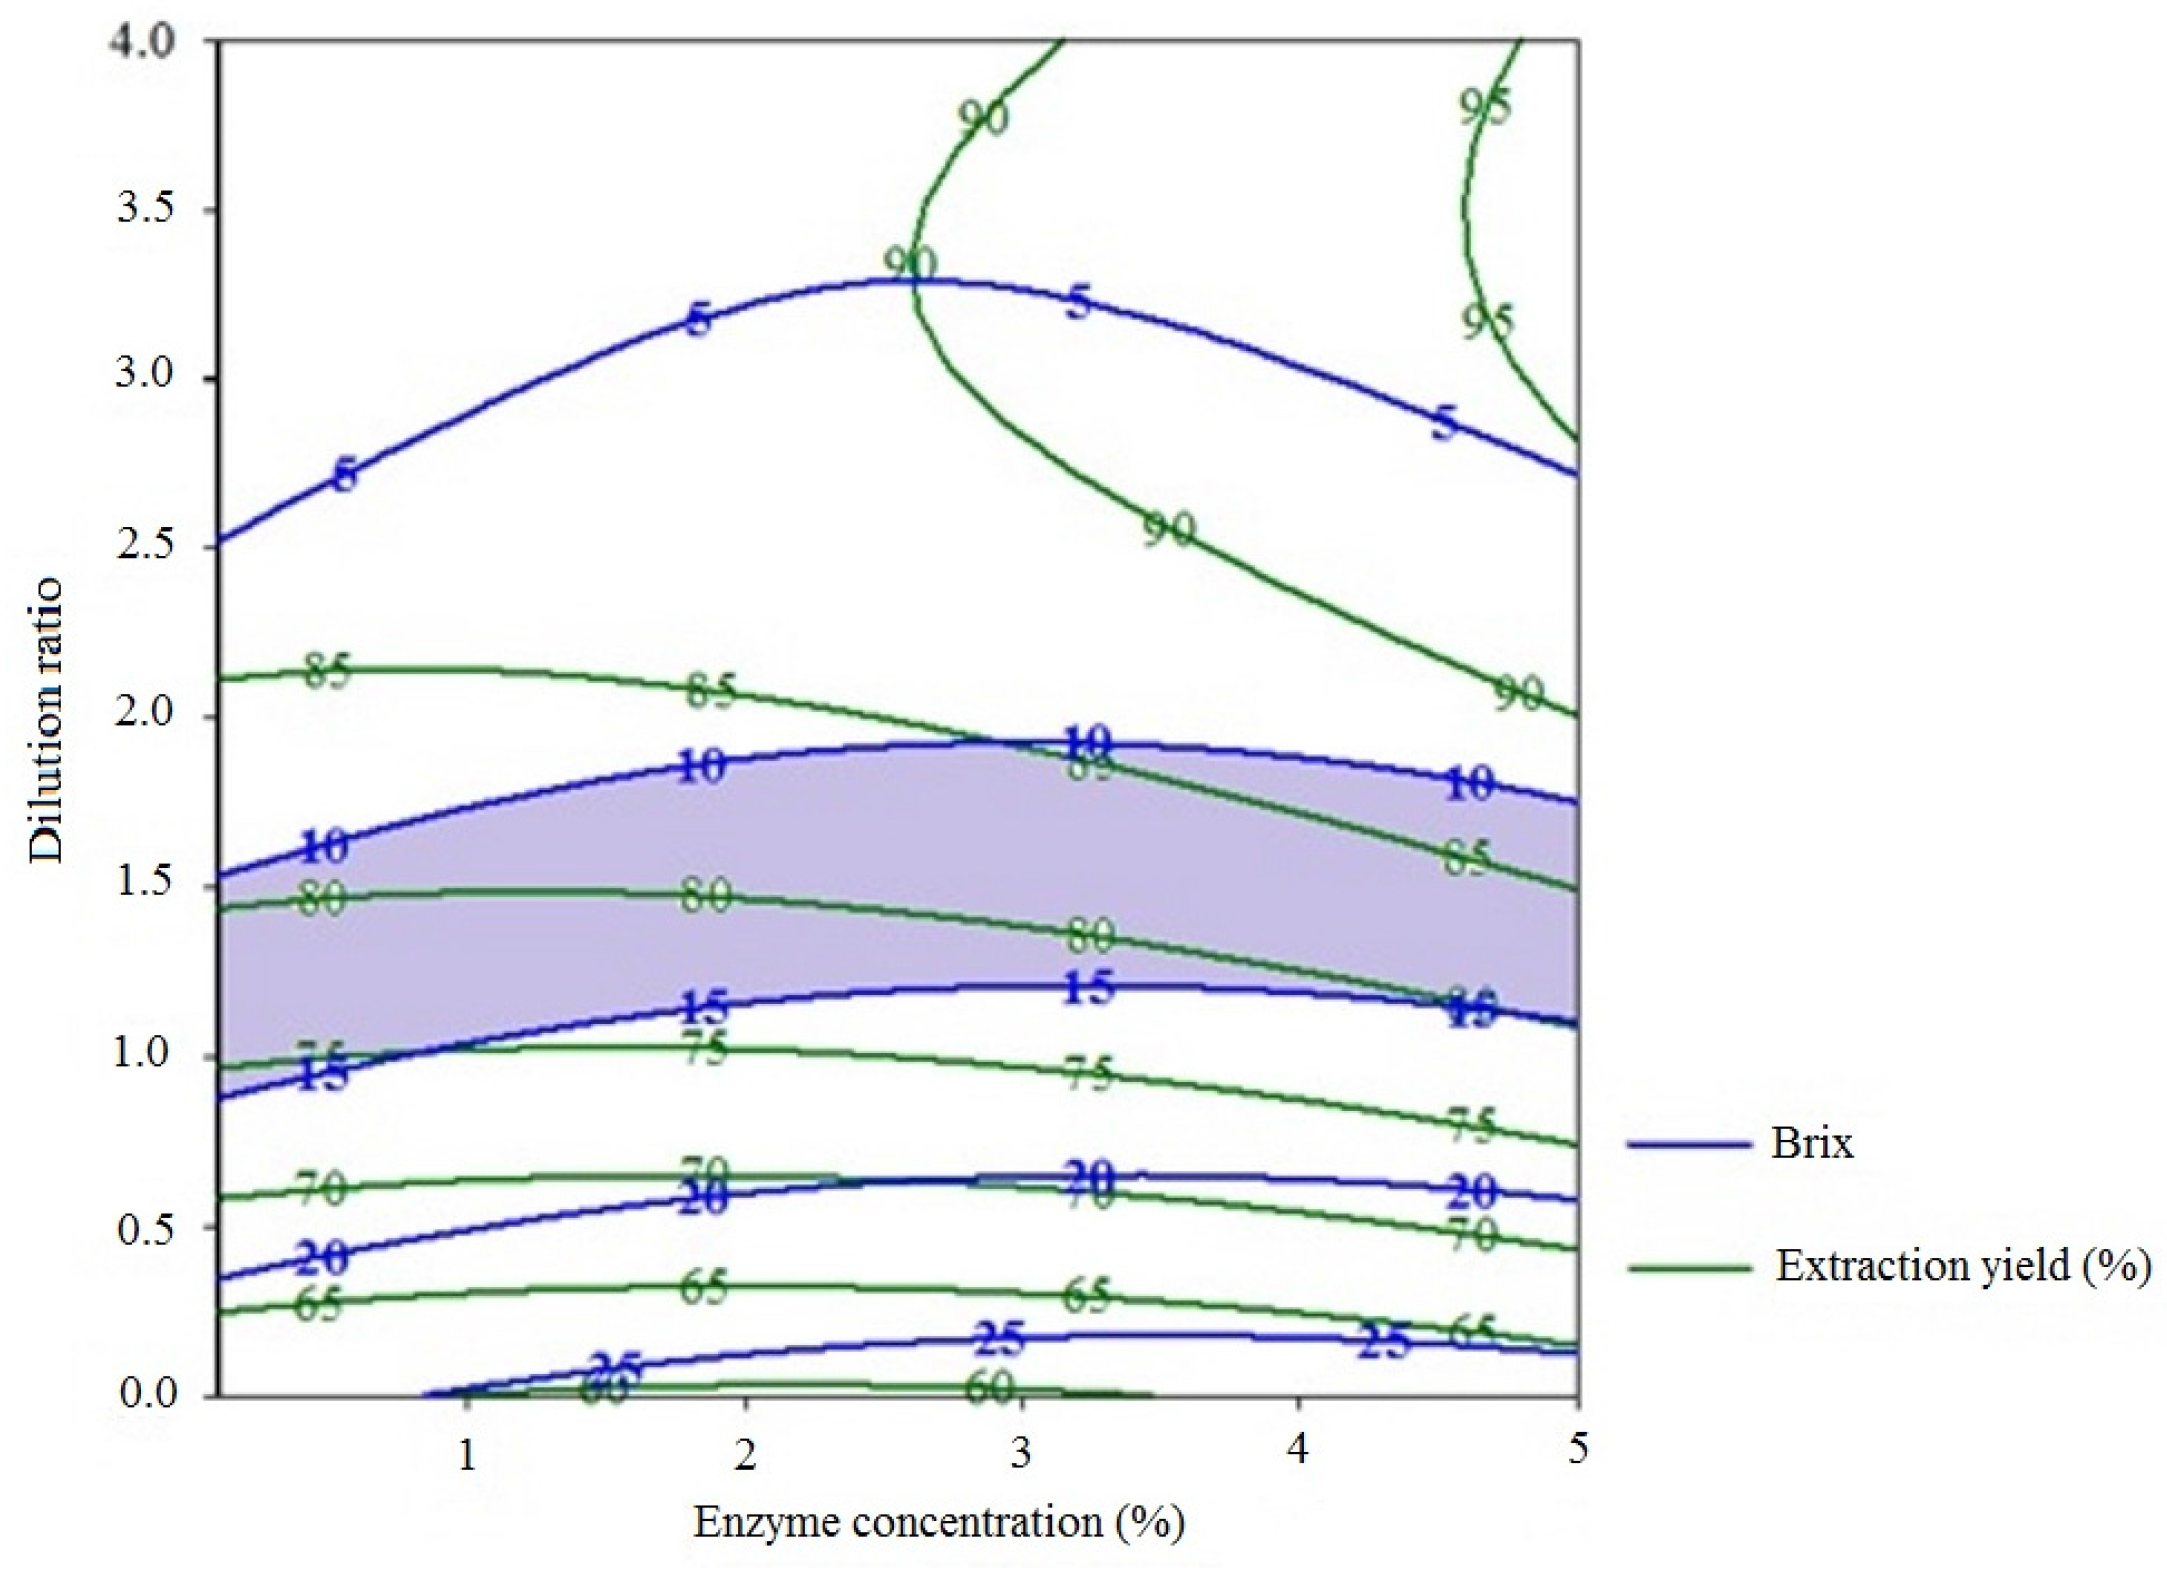
When trying to maximize the responses singularly, different optimal combinations were obtained. For the Brix, the maximal value obtained was 28.19 °Bx for an optimal combination of 48.74 °C for temperature, 3.81% for enzyme concentration, zero (no dilution) for the dilution factor and 13.08 h for the extraction time; while the maximization of the extraction yield gave 99.47% using 25 °C for the temperature, 5% for the enzyme concentration, four for the dilution factor and 0.5 h for the extraction time. From the two singulars response maximization, it was obvious that a compromise should be found. For that purpose, an extraction yield ≥70% and 10 ≤ Brix ≤ 15 °Bx were fixed as “good” conditions. That choice was made because of the aim of producing a wine (low Brix) and to have at the same time enough juice volume (high extraction yield). After superimposing the graphs for Brix and extraction yield (Figure 7), it was obtained that the area that could permit reaching the target (extraction yield ≥ 70% and 10 ≤ Brix ≤ 15 °Bx) was within the interest zone highlighted (that zone was obtained after fixing the temperature at 25 °C and the extraction time at 24 h).
The optimal condition in the highlighted area was assessed as follows: temperature, 25 °C; enzyme concentration, 5%; dilution ratio, 1.10; and extraction time, 24 h. That optimal combination gave respectively for Brix 14.99 °Bx and for the extraction yield 80.22%.
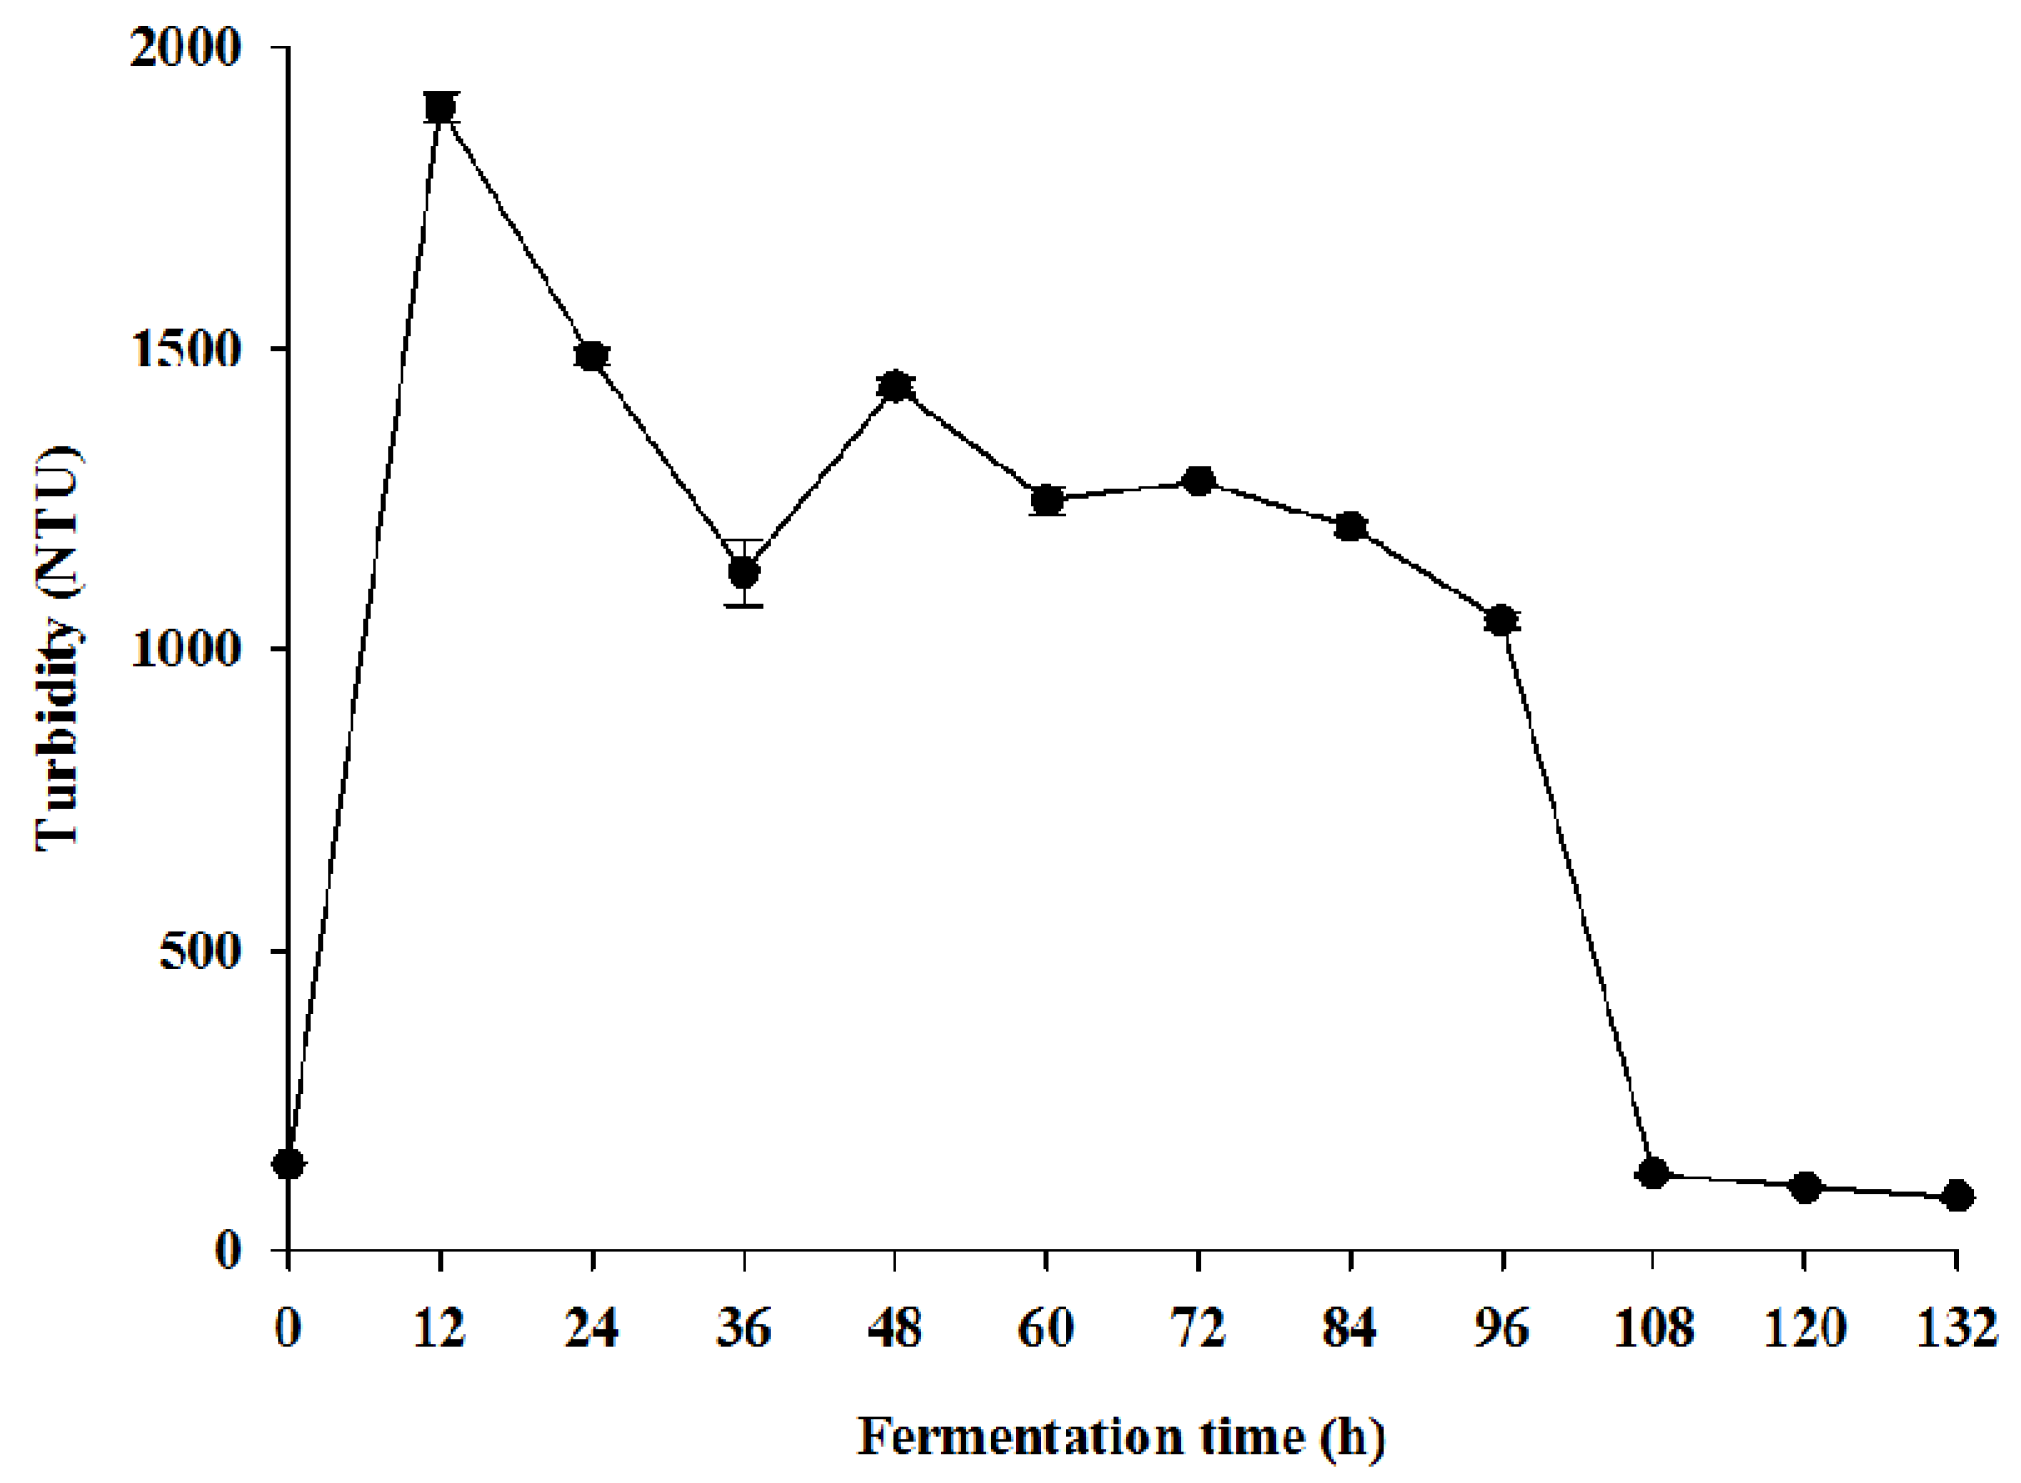
3.3. Evolution of Turbidity during Fermentation
Figure 8 shows the evolution of turbidity during the fermentation of over-ripe giant horn plantain juice extraction using optimal conditions and during the first fermentation. Turbidity increased from 144.33 ± 0.57 NTU (the initial day) to 1901.33 ± 26.31 NTU (the first day). After that first day, the turbidity decreased till the value of 88.66 ± 0.57 NTU. The high turbidity observed the first day of fermentation could be due to the fact that the yeast metabolized the sugars, and that produced a high volume of CO2.
Gas escaping created turbulence in the medium and dispersing yeast. The progressive reduction of turbidity could be linked to the reduction of CO2 production and, at the same time, the beginning of yeast and other solids’ decantation. After 96 h, the drop of turbidity was drastic. This could be explained by a significant reduction of CO2 gas and, therefore, a more efficient decantation.
3.4. Physicochemical Characteristics of Must and Wine
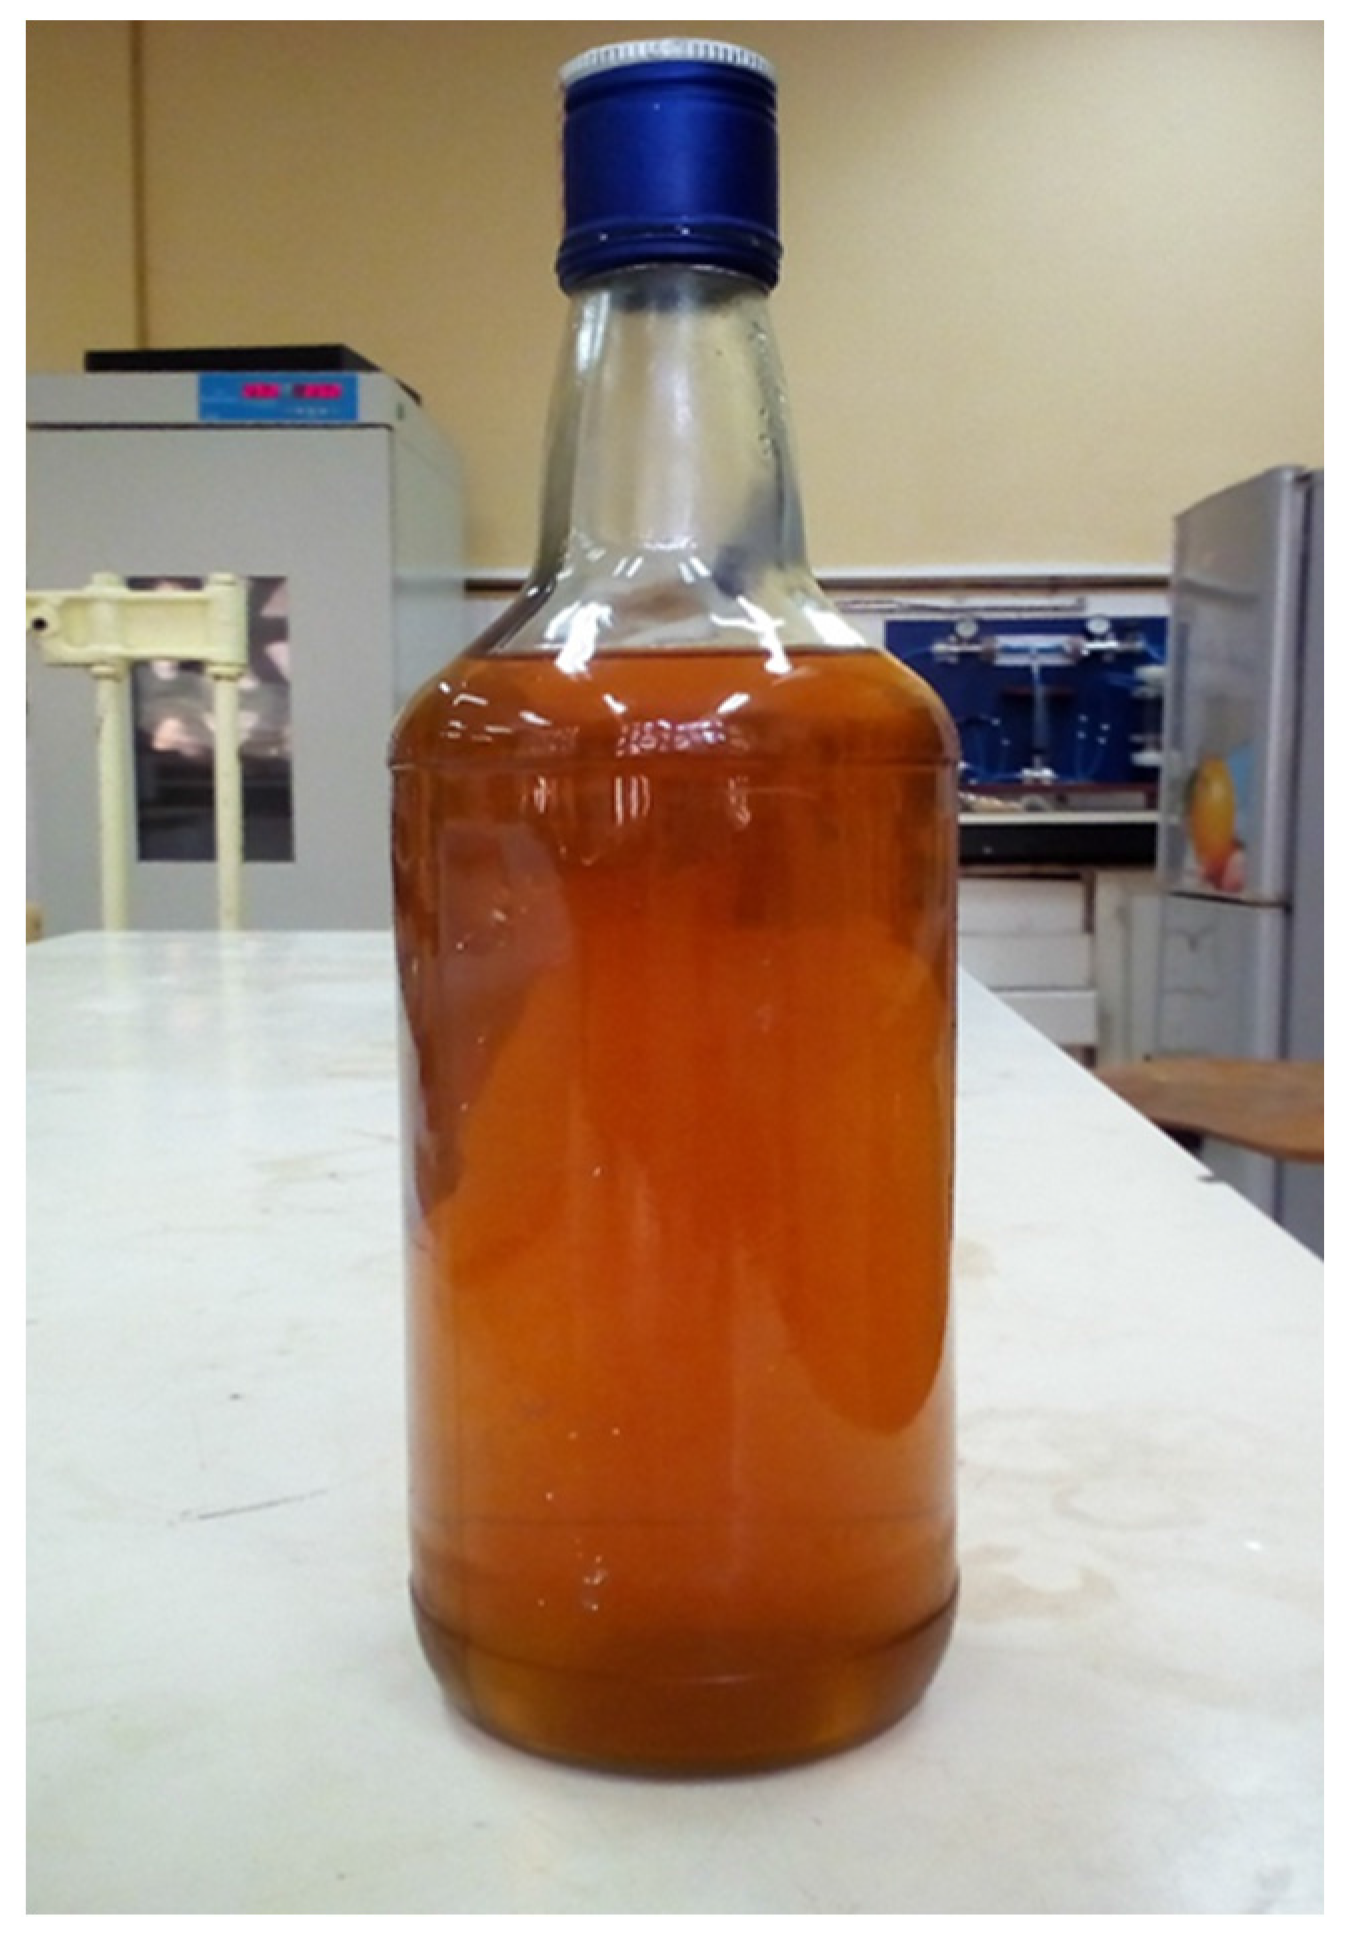
Some physicochemical characteristics of the must and the wine (Figure 9) at the end of the 90 days of the aging process are presented in Table 7.
After extraction in optimal conditions, which gives 15.1 ± 0.42 °Bx, the juice was then pasteurized to prevent fermentation starting prematurely by indigenous yeasts and bacteria.
From Table 7, it was observed that the pH dropped from 4.26 ± 0.01 in must to 4.12 ± 0.21 in wine. During the alcoholic fermentation, the pH of the must was constantly changing. Organic acids consumed or produced undergo dissociation and release hydrogen ions in the fermentation medium, thus influencing the pH. All hydrogen ions did not come, however, from dissociation of organic acids. Some came from the assimilation of nitrogen source, including ammonium ions, probably amino acids, which could contribute to the pH drop by amino acid assimilation of a positive charge. Alcohol was the main product of fermentation and was also involved in the change in pH. It acted on the dissociation constants of organic acids, on the density and the dielectric constant of the solvent and, thus, indirectly on the pH [46].
For the total soluble solids, a decrease of Brix from 16.06 ± 0.58 °Bx to 1.5 ± 0.10 °Bx was observed (Table 7). Yeasts are facultative aerobic organisms. When oxygen was available, glucose was metabolized aerobically. In the absence of air, yeast must go against this by alcoholic fermentation. As it produced less energy than aerobic respiration, the need for glucose increased significantly. This phenomenon is named the Pasteur effect. Due to the limited production of energy, yeast multiplied in the absence of air much less quickly than in its presence. In addition, the ethanol produced acted as a cellular poison. The need for glucose by the yeast contributed then to the decrease of sugar in the medium.
Furthermore, the fact that the residual sugar content was 1.5 ± 0.10 °Bx could then be explained as said earlier. The titratable acidity obtained was 4.4 ± 0.09 g/L tartaric acid for the must and increased to 8.19 ± 0.03 g/L tartaric acid for wine (Table 7). Organic acids are essential elements of the constitution of musts and wines, their qualities and their defects. Nature and concentration regulate the acid-base balance and, therefore, control the acid taste of wine. During the fermentation, sugar consumption by the yeast (glycolysis) results in the formation of typical organic acid fermentation [46].
The flavonoid content of the giant horn plantain must and wine is shown in Table 7. The flavonoid content of must and wine samples was from 0.4 ± 0.01 µg rutin/g–4 ± 0.12 µg rutin/g, respectively. The augmentation in flavonoid content in giant horn plantain wine as a result of fermentation could be due to the increase in acidity during fermentation, which involves unchaining bound flavonoid components and making them more available [47].
The total phenolic content of the giant horn plantain must and wine expressed as mg gallic acid equivalent (GAE) per 100 g sample is shown in Table 7. Phenolic content for must and wine samples analyzed in this study ranged from 7.70 ± 0.99 mg GAE/100 g to 17.01 ± 0.34 mg GAE/100 g, respectively. In natural medium, phenolic compounds are linked with sugar, which decreases their disponibility. During fermentation, proteases hydrolyze complexes of phenolics into soluble-free phenols and other simpler and biologically more active ones that are readily absorbed [48,49].
From Table 7, a decrease in color from must to wine was also observed. That color level was 23.67 ± 1.50 EBC for must and 20.03 ± 0.04 EBC for wine. This could be explained by the yeast, which has been shown to absorb anthocyanins onto its cell walls and cause color loss [50].
After analyzing free amino nitrogen (FAN) of the must and at the end of the fermentation (wine) in Table 7, a drop from 138.94 ± 5.23 mg/L (must) to 78.77 ± 2.75 mg/L (wine) was observed. Generally, during alcoholic fermentation, ammonium ions and most amino acids are completely consumed after the first 50 h of fermentation [51,52]. It is also known that amino acids are involved in the synthesis of higher alcohols by the yeast mechanism. Thus, the more a must is concentrated in available nitrogen, a larger amount is consumed, as pointed out by the literature [53].
4. Conclusions
This study was aimed at valorizing over-ripe plantains in order to reduce post-harvest losses by processing them into wine owing to 35% of the total plantains produced being wasted as post-harvest losses. Mathematical models for the must extraction were successfully developed in order to predict the appropriate conditions for optimal yield and Brix. A compromise of the optimum processing conditions for both responses (extraction yield and Brix) was determined as 80.22% and 14.99 °Bx, respectively. The must and wine produced were characterized for pH, turbidity, total soluble sugars, total polyphenols, free amino nitrogen, color, total sugars, flavonoids and titratable acidity and tend to have suitable properties, as well. It has been determined that over-ripe plantains that may be available in bulk should not be wasted, as they can be processed with minimal problems to produce safe and quality alcoholic beverages (wines).
Acknowledgments
The authors gratefully acknowledge the Department of Process Engineering, National School of Agro-Industrial Sciences (ENSAI) of the University of Ngaoundere (Cameroon) for providing necessary facilities for the successful completion of this research work.
Author Contributions
W. C. Makebe, performed the experiments. Z. S. C. Desobgo, analyzed the data; contributed reagents/materials/analysis tools; wrote the paper. E. J. Nso, contributed reagents/materials/analysis tools.
Conflicts of Interest
The authors declare no conflicts of interest.
Abbreviations
| ANOVA | Analysis of variance |
| AAD | Absolute average deviation |
| AAE | Ascorbic acid equivalent |
| Af | Exactitude factor |
| Bf | Bias factor |
| °Bx | Degree Brix |
| Cal | Calculated value from the model |
| DM | Dry matter |
| DF | Degree of freedom |
| EBC | European Brewing Convention |
| Exp | Experimental value |
| GAE | Gallic acid equivalent |
| N | Number of experiments |
| n0 | number of points repeated independently |
| NTU | Nephelometric turbidity unit |
| P | Number of model coefficients |
| R2 | Coefficient of determination |
| Res | Residue (Difference between experimental and calculated values) |
| RSM | Response surface methodology |
| SS | Sum of squares |
| SSE | Sum square of error |
| SSE1 | Sum of the squares of the experimental errors (at the repeated points) |
| SSE2 | Sum of the squares of the deviations (at other points) or validity. |
| SSR | Sum of squares due to regression |
| TSS | Total sum of squares |
References
- Olurunda, A.O. Recent advances in post-harvest technology of banana and plantains in Africa. Acta Hort. 2000, 540, 517–527. [Google Scholar] [CrossRef]
- Essilfie, G. Analysis of the Post-Harvest Knowledge System in Ghana: Case Study of Cassava; CTA: Wageningen, The Netherlands, 2014; p. 10. [Google Scholar]
- Food and Agriculture Organization (FAO). Faostat Database Collections; Food and Agriculture Organization of the United Nations: Rome, Italy, 2014. [Google Scholar]
- Adeniji, T.A.; Tenkouano, A.; Ezurike, J.N.; Ariyo, C.O.; Vroh-Bi, I. Value-adding post harvest processing of cooking bananas (Musa spp. Aab and abb genome groups). Afr. J. Biotechnol. 2010, 9, 9135–9141. [Google Scholar]
- Hailu, M.; Workneh, T.S.; Belew, D. Review on postharvest technology of banana fruit. Afr. J. Biotechnol. 2013, 12, 635–647. [Google Scholar]
- Strosse, H.; Schoofs, H.; Panis, B.; André, E.; Reyniers, K.; Swennen, R. Development of embryogenic cell suspensions from shoot meristematic tissue in bananas and plantains (Musa spp.). Plant Sci. 2006, 170, 104–112. [Google Scholar] [CrossRef]
- Fleet, G.H. Wine: Microbiology and Biotechnology; Harwood Academic Publishers: London, UK, 1993; p. 130. [Google Scholar]
- Webb, A.D. The science of making wine. Am. Sci. 1984, 72, 360–367. [Google Scholar]
- Isitua, C.C.; Ibeh, I.N. Novel method of wine production from banana (Musa acuminata) and pineapple (ananas comosus) wastes. Afr. J. Biotechnol. 2010, 9, 7521–7524. [Google Scholar] [CrossRef]
- Jay, J.M. Modern Food Microbiology, 5th ed.; Chapman and Hall: New York, NY, USA, 1996; p. 212. [Google Scholar]
- Okafor, N. Modern Industrial Microbiology and Biotechnology; Science Publishers: Enfield, NH, USA, 2007; p. 530. [Google Scholar]
- Kotecha, M.P.; Adsule, R.N.; Kadam, S.S. Preparation of wine from over-ripe banana fruits. Beverage Food World 1994, 21, 28–29. [Google Scholar]
- Akingbala, J.O.; Oguntimein, G.B.; Olunlade, B.A.; Aina, J.O. Effects of pasteurization and packaging on properties of wine from over-ripe mango (mangifera indica) and banana (musaacuminata) juices. Trop. Sci. 1992, 34, 345–352. [Google Scholar]
- Goupy, J.; Creighton, L. Introduction Aux Plans D'expériences, 3rd ed.; Dunod: Paris, France, 2006; p. 325. [Google Scholar]
- Ekorong, A.A.J.F.; Zomegni, G.; Desobgo, Z.S.C.; Ndjouenkeu, R. Optimization of drying parameters for mango seed kernels using central composite design. Bioresour. Bioprocess 2015, 2, 1–9. [Google Scholar] [CrossRef]
- Joglekar, A.M.; May, A.T. Product excellence through design of experiments. Cereal Foods World 1987, 32, 857–868. [Google Scholar]
- Baș, D.; Boyac, I.H. Modeling and optimization i: Usability of response surface methodology. J. Food Eng. 2007, 78, 836–845. [Google Scholar] [CrossRef]
- Dalgaard, P.; Jorgensen, L.V. Predicted and observed growth of listeria monocytogenes in seafood challenge tests and in naturally contaminated cold smoked salmon. Int. J. Food Microbiol. 1998, 40, 105–115. [Google Scholar] [CrossRef]
- ISO 2173:2003. Fruit and Vegetable Products—Determination of Soluble solids—Refractometric Method; International Organization of Standardization (ISO): Geneva, Switzerland, 2003.
- Marigo, G. Méthode de fractionnement et d’estimation des composés phénoliques chez les végétaux. Analysis 1973, 2, 106–110. [Google Scholar]
- Association Française de Normalisation (AFNOR). Recueil Des Normes Françaises Des Produits Dérivés Des Fruits Et Légumes, 1st ed.; Association Française de Normalisation: Paris, France, 1982. [Google Scholar]
- Analytica-EBC. European Brewery Convention; Fachverlag Hans Carl: Nürnberg, Germany, 1998. [Google Scholar]
- Fisher, E.H.; Stein, E.A. Dns colorimetric determination of available carbohydrates in foods. Biochem. Prep. 1961, 8, 30–37. [Google Scholar]
- Fisher, E.H.; Stein, E.A. Enzymes, 2nd ed.; Academic Press: New York, NY, USA, 1960; Volume 4, p. 343. [Google Scholar]
- Quettier-Deleu, C.; Gressier, B.; Vasseur, J.; Dine, T.; Brunet, J.; Luyck, M.; Cazin, M.; Cazin, J.C.; Bailleul, F.; Trotin, F. Phenolic compounds and antioxidant activities of buckwheat (Fagopyrum esculentum moench) hulls and flour. J. Ethnopharmacol. 2000, 72, 35–40. [Google Scholar] [CrossRef]
- Oluwalana, I.B. Fruit cultivation and processing improvement in nigeria. Agric. J. 2006, 1, 307–310. [Google Scholar]
- Oluwalana, I.B. Minimizing fruit wastages in nigeria. Int. J. Agric. Food Sci. 2010, 1, 77–87. [Google Scholar]
- Oluwalana, I.B.; Oluwamukomi, M.O. Changes in qualities of ripening plantain fruits stored at tropical ambient conditions. Int. J. Agric. Food Sci. 2010, 1, 203–207. [Google Scholar]
- Oluwalana, I.B.; Oluwamukomi, M.O.; Olajide, S.T. Physicochemical changes in ripening plantain stored at tropical ambient conditions. J. Food Technol. 2006, 4, 253–254. [Google Scholar]
- Lœsecke, H.V. Bananas, 2nd ed.; InterScience: New York, NY, USA, 1950. [Google Scholar]
- Palmer, J.K. The banana. In The Biochemistry of Fruits and Their Products; Hulme, A.C., Ed.; Academic Press: London, UK, 1971; Volume 2, pp. 65–105. [Google Scholar]
- Marriott, J.; Robinson, M.; Karikari, S.K. Starch and sugar transformation during ripening of plantains and bananas. Trop. Sci. 1981, 32, 1021–1026. [Google Scholar] [CrossRef]
- George, J.B.; Marriott, J. The effect of humidity in plantain ripening. Sci. Holtic. 1983, 5, 37–48. [Google Scholar] [CrossRef]
- Pantastico, B.E. Postharvest Physiology, Handling and Utilization of Tropical and Subtropical Fruits and Vegetables; AVI Publishing Co. Inc.: Westport, CT, USA, 1975. [Google Scholar]
- Egbebi, A.O.; Bademosi, T.A. Chemical compositions of ripe and unripe banana and plantain. Int. J. Trop. Med. Public Health 2012, 1, 1–5. [Google Scholar]
- Patil, S.K.; Shanmugasundaram, S. Physicochemical changes during ripening of monthan banana. Int. J. Technol. Enhanc. Emerg. Eng. Res. 2015, 3, 18–21. [Google Scholar]
- Ross, T. Indices for performance evaluation of predictive models in food microbiology. J. Appl. Bacteriol. 1996, 81, 501–508. [Google Scholar] [PubMed]
- Baranyi, J.; Pin, C.; Ross, T. Validating and comparing predictive models. Int. J. Food Microbiol. 1999, 48, 159–166. [Google Scholar] [CrossRef]
- Dadzie, B.K. Cooking qualities of black sigatoka resistant plantain hybrids. Infomusa 1995, 4, 7–9. [Google Scholar]
- Ngalani, J.A.; Tchango-Tchango, J. Cooking qualities and physicochemical changes during ripening in some banana and plantain hybrids and cultivars. Acta Hortic. 1998, 490, 571–576. [Google Scholar] [CrossRef]
- Wang, S.; Copeland, L. Molecular disassembly of starch granules during gelatinization and its effect on starch digestibility: A review. Food Funct. 2013, 4, 1564–1580. [Google Scholar] [CrossRef] [PubMed]
- Donovan, J.W. Phase transitions of the starch–water system. Biopolymers 1979, 18, 263–275. [Google Scholar] [CrossRef]
- BeMiller, J.N. Pasting, paste, and gel properties of starch–hydrocolloid combinations. Carbohydr. Polym. 2011, 86, 386–423. [Google Scholar] [CrossRef]
- Slade, L.; Levine, H. Non-equilibrium melting of native granular starch: Part i. Temperature location of the glass transition associated with gelatinization of a-type cereal starches. Carbohydr. Polym. 1988, 8, 183–208. [Google Scholar] [CrossRef]
- Sreenath, H.K.; Frey, M.D.; Scherz, H.; Radola, B.J. Degradation of a washed carrot preparation by cellulases and pectinases. Biotechnol. Bioeng. 1984, 26, 788–796. [Google Scholar] [CrossRef] [PubMed]
- Akin, H. Evolution Du Ph Pendant La Fermentation Alcoolique De Moûts De Raisins: Modélisation Et Interprétation Métabolique; Institut National Polytechnique de Toulouse Toulouse: Toulouse, France, 2008. [Google Scholar]
- Adetuyi, F.O.; Ibrahim, T.A. Effect of fermentation time on the phenolic, flavonoid and vitamin C contents and antioxidant activities of okra (abelmoschus esculentus) seeds. Niger. Food J. 2014, 32, 128–137. [Google Scholar] [CrossRef]
- Shrestha, A.K.; Dahal, N.R.; Ndungustse, V. Bacillus fermentation of soybean: A review. J. Food Sci. Technol. Nepal 2010, 6, 1–9. [Google Scholar] [CrossRef]
- Ademiluyi, A.O.; Oboh, G. Antioxidant properties of condiment produced from fermented bambara groundnut (Vigna subterranean L. Verdc). J. Food Biochem. 2011, 35, 1145–1160. [Google Scholar] [CrossRef]
- Morata, A.; Gomez-Cordoves, M.C.; Colomo, B.; Suarez, J.A. Pyruvic acid and acetaldehyde production by different strains of saccharomyces: Relationship with vitisin a and b formation in red wines. J. Agric. Food Chem. 2003, 51, 7402–7409. [Google Scholar] [CrossRef] [PubMed]
- Jiranek, V.; Langridge, P.; Henschke, P.A. Amino acid and ammonium utilization by saccharomyces cerevisiae wine yeasts from a chemically defined medium. Am. J. Enol. Vitic. 1995, 46, 75–83. [Google Scholar]
- Beltran, G.; Novo, M.; Rozès, N.; Mas, A.; Guillamón, J.M. Nitrogen catabolite repression in saccharomyces cerevisiae during wine fermentations. FEMS Yeast Res. 2004, 4, 625–632. [Google Scholar] [CrossRef] [PubMed]
- Taillandier, P.; Ramon-Portugal, F.; Fuster, A.; Strehaiano, P. Effect of ammonium concentration on alcoholic fermentation kinetics by wine yeasts for high sugar content. Food Microbiol. 2007, 24, 95–100. [Google Scholar] [CrossRef] [PubMed]
Figure 1.
Giant horn plantains ((A) unripe; (B) over-ripe).

Figure 2.
Process diagram for the ripe plantain wine production.

Figure 3.
Weight loss (%) of giant horn plantain during ripening.

Figure 4.
Evolution of extraction yield with temperature.

Figure 5.
Evolution of Brix with enzyme concentration.

Figure 6.
Evolution of extraction yield and Brix with the dilution factor.

Figure 7.
Interest zone for giant horn plantain juice extraction.

Figure 8.
Evolution of turbidity during fermentation of over-ripe giant horn plantain juice.

Figure 9.
Over-ripe giant horn plantain wine.


Table 1.
Enzyme properties.
| Enzymes (Origins, Suppliers) | Enzymes Percentage in the Mixture | pH | Temperature | ||
|---|---|---|---|---|---|
| Tolerance | Optimal | Tolerance | Optimal | ||
| Amyloglucosidase (AMG 300 L, Novozymes) | 43% | 4.0–6.0 | 4.5 | 30–65 °C | 60 °C |
| Alpha-amylase (BAN 480 L, Novozymes) | 29% | 5.0–6.0 | 5.4–5.8 | 37–75 °C | 70 °C |
| Pectinase (Aspergillus aculeatus, Sigma Aldrich) | 14% | 3.5–6.0 | 4.5 | 30–55 °C | 50 °C |
| Bioglucanase TX (Trichoderma reesei, Kerry Bioscience) | 14% | 4.5–6.5 | 4.5–6.5 | / | 60 °C |
Table 2.
Experimental level of factors for ripe plantain fermentation.
| Factors (Variables) | Level |
|---|---|
| Temperature (°C) | 25–75 |
| Enzyme mix concentration (%) | 0.1–5 |
| Dilution factor | 0–4 |
| Time (h) | 0.5–24 |
Table 3.
Standard and acceptable values of the indicators of the validation of the models.
| Indicators of Validation | Standard Values | Acceptable Values | References |
|---|---|---|---|
| Adjusted R2 | 1 | ≥0.8 | [16] |
| AAD | 0 | [0–0.3] | [17] |
| Bias factor | 1 | [0.75–1.25] | [18] |
| Exactitude factor | 1 | [0.75–1.25] | [18] |
Table 4.
Analysis of variance (ANOVA).
| Source of Variation | DF | SS | Mean Square | Fisher (F-Test) |
|---|---|---|---|---|
| Regression (between) | ||||
| Residue (within) | ||||
| Validity | ||||
| Error | ||||
| Total |
Table 5.
Doehlert experimental design: coded variables, real variables and responses.
| Number | Coded Variables | Real Variables | Responses | |||||||||||
|---|---|---|---|---|---|---|---|---|---|---|---|---|---|---|
| Yield (%) | Brix (°Bx) | |||||||||||||
| Exp | Cal | Res | Exp | Cal | Res | |||||||||
| 1 | 1 | 0 | 0 | 0 | 75 | 2.55 | 2 | 12.25 | 73.10 | 74.70 | −1.60 | 12.65 | 11.58 | 1.08 |
| 2 | −1 | 0 | 0 | 0 | 25 | 2.55 | 2 | 12.25 | 83.75 | 82.14 | 1.61 | 8.90 | 9.96 | −1.06 |
| 3 | 0.5 | 0.866 | 0 | 0 | 62.5 | 5 | 2 | 12.25 | 80.23 | 79.99 | 0.24 | 10.45 | 10.69 | −0.24 |
| 4 | −0.5 | −0.866 | 0 | 0 | 37.5 | 0.1 | 2 | 12.25 | 82.08 | 82.30 | −0.22 | 8.10 | 7.86 | 0.24 |
| 5 | 0.5 | −0.866 | 0 | 0 | 62.5 | 0.1 | 2 | 12.25 | 81.73 | 80.41 | 1.32 | 8.15 | 8.67 | −0.52 |
| 6 | −0.5 | 0.866 | 0 | 0 | 37.5 | 5 | 2 | 12.25 | 84.23 | 85.53 | −1.30 | 10.40 | 9.88 | 0.52 |
| 7 | 0.5 | 0.289 | 0.816 | 0 | 62.5 | 3.37 | 4 | 12.25 | 87.78 | 85.51 | 2.27 | 6.35 | 7.38 | −1.03 |
| 8 | −0.5 | −0.289 | −0.816 | 0 | 37.5 | 1.73 | 0 | 12.25 | 51.75 | 54.00 | −2.25 | 27.90 | 26.87 | 1.03 |
| 9 | 0.5 | −0.289 | −0.816 | 0 | 62.5 | 1.73 | 0 | 12.25 | 49.68 | 50.62 | −0.94 | 27.10 | 26.85 | 0.25 |
| 10 | 0 | 0.577 | −0.816 | 0 | 50 | 4.18 | 0 | 12.25 | 51.48 | 52.02 | −0.54 | 28.60 | 28.16 | 0.44 |
| 11 | −0.5 | 0.289 | 0.816 | 0 | 37.5 | 3.37 | 4 | 12.25 | 90.53 | 89.57 | 0.96 | 5.50 | 5.74 | −0.24 |
| 12 | 0 | −0.577 | 0.816 | 0 | 50 | 0.92 | 4 | 12.25 | 86.40 | 85.85 | 0.55 | 5.40 | 5.84 | −0.44 |
| 13 | 0.5 | 0.289 | 0.204 | 0.791 | 62.5 | 3.37 | 2.5 | 24 | 83.50 | 84.38 | −0.88 | 8.75 | 8.53 | 0.22 |
| 14 | −0.5 | −0.289 | −0.204 | −0.791 | 37.5 | 1.73 | 1.5 | 0.5 | 79.33 | 78.44 | 0.89 | 10.80 | 11.01 | −0.21 |
| 15 | 0.5 | −0.289 | −0.204 | −0.791 | 62.5 | 1.73 | 1.5 | 0.5 | 76.63 | 75.38 | 1.25 | 11.00 | 11.79 | −0.79 |
| 16 | 0 | 0.577 | −0.204 | −0.791 | 50 | 4.18 | 1.5 | 0.5 | 79.63 | 77.99 | 1.64 | 11.80 | 12.53 | −0.73 |
| 17 | 0 | 0 | 0.612 | −0.791 | 50 | 2.55 | 3.5 | 0.5 | 87.78 | 91.54 | −3.76 | 6.25 | 4.54 | 1.71 |
| 18 | −0.5 | 0.289 | 0.204 | 0.791 | 37.5 | 3.37 | 2.5 | 24 | 87.53 | 88.77 | −1.24 | 8.50 | 7.70 | 0.80 |
| 19 | 0 | −0.577 | 0.204 | 0.791 | 50 | 0.92 | 2.5 | 24 | 84.63 | 86.25 | −1.62 | 7.95 | 7.22 | 0.73 |
| 20 | 0 | 0 | −0.612 | 0.791 | 50 | 2.55 | 0.5 | 24 | 69.75 | 65.98 | 3.77 | 19.85 | 21.56 | −1.71 |
| 21 | 0 | 0 | 0 | 0 | 50 | 2.55 | 2 | 12.25 | 80.83 | 80.50 | 0.33 | 11.35 | 11.03 | 0.32 |
| 22 | 0 | 0 | 0 | 0 | 50 | 2.55 | 2 | 12.25 | 80.28 | 80.50 | −0.22 | 10.80 | 11.03 | −0.23 |
| 23 | 0 | 0 | 0 | 0 | 50 | 2.55 | 2 | 12.25 | 80.76 | 80.50 | 0.26 | 11.00 | 11.03 | −0.03 |
| 24 | 0 | 0 | 0 | 0 | 50 | 2.55 | 2 | 12.25 | 80.15 | 80.50 | −0.35 | 10.95 | 11.03 | −0.08 |
| 25 | 0 | 0 | 0 | 0 | 50 | 2.55 | 2 | 12.25 | 73.10 | 80.50 | −7.40 | 12.65 | 11.03 | 1.63 |
Exp: Experimental value; Cal: Calculated value; Res: Residue (difference between experimental and calculated value)
Table 6.
Estimation of the regression coefficients and variables’ contributions for the yield and Brix of over-ripe giant horn plantain juice.
Table 6.
Estimation of the regression coefficients and variables’ contributions for the yield and Brix of over-ripe giant horn plantain juice.
| Effects | Coefficients | df | Sum of Squares | Mean Square | F-Value | p-Value | |||||
|---|---|---|---|---|---|---|---|---|---|---|---|
| Yield | Brix | Yield | Brix | Yield | Brix | Yield | Brix | Yield | Brix | ||
| Constant | 80.50 | 11.025 | 14 | 2949.24 | 1045.51 | 210.66 | 74.679 | 31.57 | 48.12 | 0.000 | 0.000 |
| Linear | 4 | 2338.06 | 838.24 | 584.51 | 209.559 | 87.61 | 135.03 | 0.000 | 0.000 | ||
| −3.72 | 0.810 | 1 | 69.19 | 3.28 | 69.19 | 3.281 | 10.37 | 2.11 | 0.010 | 0.180 | |
| 0.70 | 1.010 | 1 | 3.29 | 6.80 | 3.29 | 6.801 | 0.49 | 4.38 | 0.500 | 0.066 | |
| 17.378 | −10.487 | 1 | 2264.98 | 824.84 | 2264.98 | 824.837 | 339.47 | 531.49 | 0.000 | 0.000 | |
| 0.256 | 0.650 | 1 | 0.52 | 3.38 | 0.52 | 3.377 | 0.08 | 2.18 | 0.786 | 0.174 | |
| Square | 4 | 591.34 | 190.62 | 147.83 | 47.656 | 22.16 | 30.71 | 0.000 | 0.000 | ||
| −2.08 | −0.25 | 1 | 5.76 | 0.08 | 5.76 | 0.083 | 0.86 | 0.05 | 0.377 | 0.822 | |
| 2.08 | −1.685 | 1 | 10.24 | 6.75 | 10.24 | 6.750 | 1.53 | 4.35 | 0.247 | 0.067 | |
| −11.02 | 6.200 | 1 | 409.86 | 129.75 | 409.86 | 129.748 | 61.43 | 83.60 | 0.000 | 0.000 | |
| 2.57 | −1.262 | 1 | 28.17 | 6.80 | 28.17 | 6.799 | 4.22 | 4.38 | 0.070 | 0.066 | |
| Interactions | 6 | 18.61 | 1.86 | 3.10 | 0.310 | 0.46 | 0.20 | 0.818 | 0.968 | ||
| −1.82 | 0.00 | 1 | 3.33 | 0.00 | 3.33 | 0.000 | 0.50 | 0.00 | 0.498 | 1.000 | |
| 0.27 | 0.82 | 1 | 0.07 | 0.61 | 0.07 | 0.612 | 0.01 | 0.39 | 0.923 | 0.545 | |
| −0.12 | −0.18 | 1 | 0.01 | 0.03 | 0.01 | 0.029 | 0.00 | 0.02 | 0.966 | 0.894 | |
| 2.20 | −0.79 | 1 | 5.83 | 0.74 | 5.83 | 0.742 | 0.87 | 0.48 | 0.374 | 0.507 | |
| 0.28 | −0.41 | 1 | 0.09 | 0.20 | 0.09 | 0.204 | 0.01 | 0.13 | 0.909 | 0.725 | |
| −2.52 | 0.27 | 1 | 8.45 | 0.10 | 8.45 | 0.095 | 1.27 | 0.06 | 0.290 | 0.810 | |
| Residual | 9 | 60.05 | 13.97 | 6.67 | 1.552 | ||||||
| total | 23 | 3009.28 | 1059.47 | ||||||||
Table 7.
Physicochemical analysis of must and wine.
| Analysis | Must | Wine |
|---|---|---|
| pH | 4.26 ± 0.01 | 4.12 ± 0.21 |
| Total soluble sugar (°Bx) | 16.06 ± 0.58 | 1.5 ± 0.10 |
| Titratable acidity (g/L tartaric acid) | 4.4 ± 0.09 | 8.19 ± 0.03 |
| Flavonoids (µg rutin/g of sample) | 0.4 ± 0.01 | 4 ± 0.12 |
| Polyphenols (mg GAE/100 g of sample) | 7.70 ± 0.99 | 17.01 ± 0.34 |
| Color (EBC: European Brewery Convention unit) | 23.67 ± 1.50 | 20.03 ± 0.04 |
| Total sugars (g/100 mL) | 9.61 ± 0.14 | 3.23 ± 0.09 |
| Free amino nitrogen (mg/L) | 138.94 ± 5.23 | 78.77 ± 2.75 |
© 2017 by the authors. Licensee MDPI, Basel, Switzerland. This article is an open access article distributed under the terms and conditions of the Creative Commons Attribution (CC BY) license (http://creativecommons.org/licenses/by/4.0/).
Share and Cite
MDPI and ACS Style
Makebe, C.W.; Desobgo, Z.S.C.; Nso, E.J. Optimization of the Juice Extraction Process and Investigation on Must Fermentation of Overripe Giant Horn Plantains. Beverages 2017, 3, 19. https://0-doi-org.brum.beds.ac.uk/10.3390/beverages3020019
AMA Style
Makebe CW, Desobgo ZSC, Nso EJ. Optimization of the Juice Extraction Process and Investigation on Must Fermentation of Overripe Giant Horn Plantains. Beverages. 2017; 3(2):19. https://0-doi-org.brum.beds.ac.uk/10.3390/beverages3020019
Chicago/Turabian StyleMakebe, C. W., Z. S. C. Desobgo, and E. J. Nso. 2017. "Optimization of the Juice Extraction Process and Investigation on Must Fermentation of Overripe Giant Horn Plantains" Beverages 3, no. 2: 19. https://0-doi-org.brum.beds.ac.uk/10.3390/beverages3020019
Note that from the first issue of 2016, this journal uses article numbers instead of page numbers. See further details here.