Article

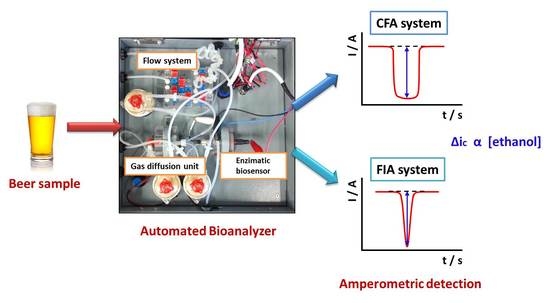
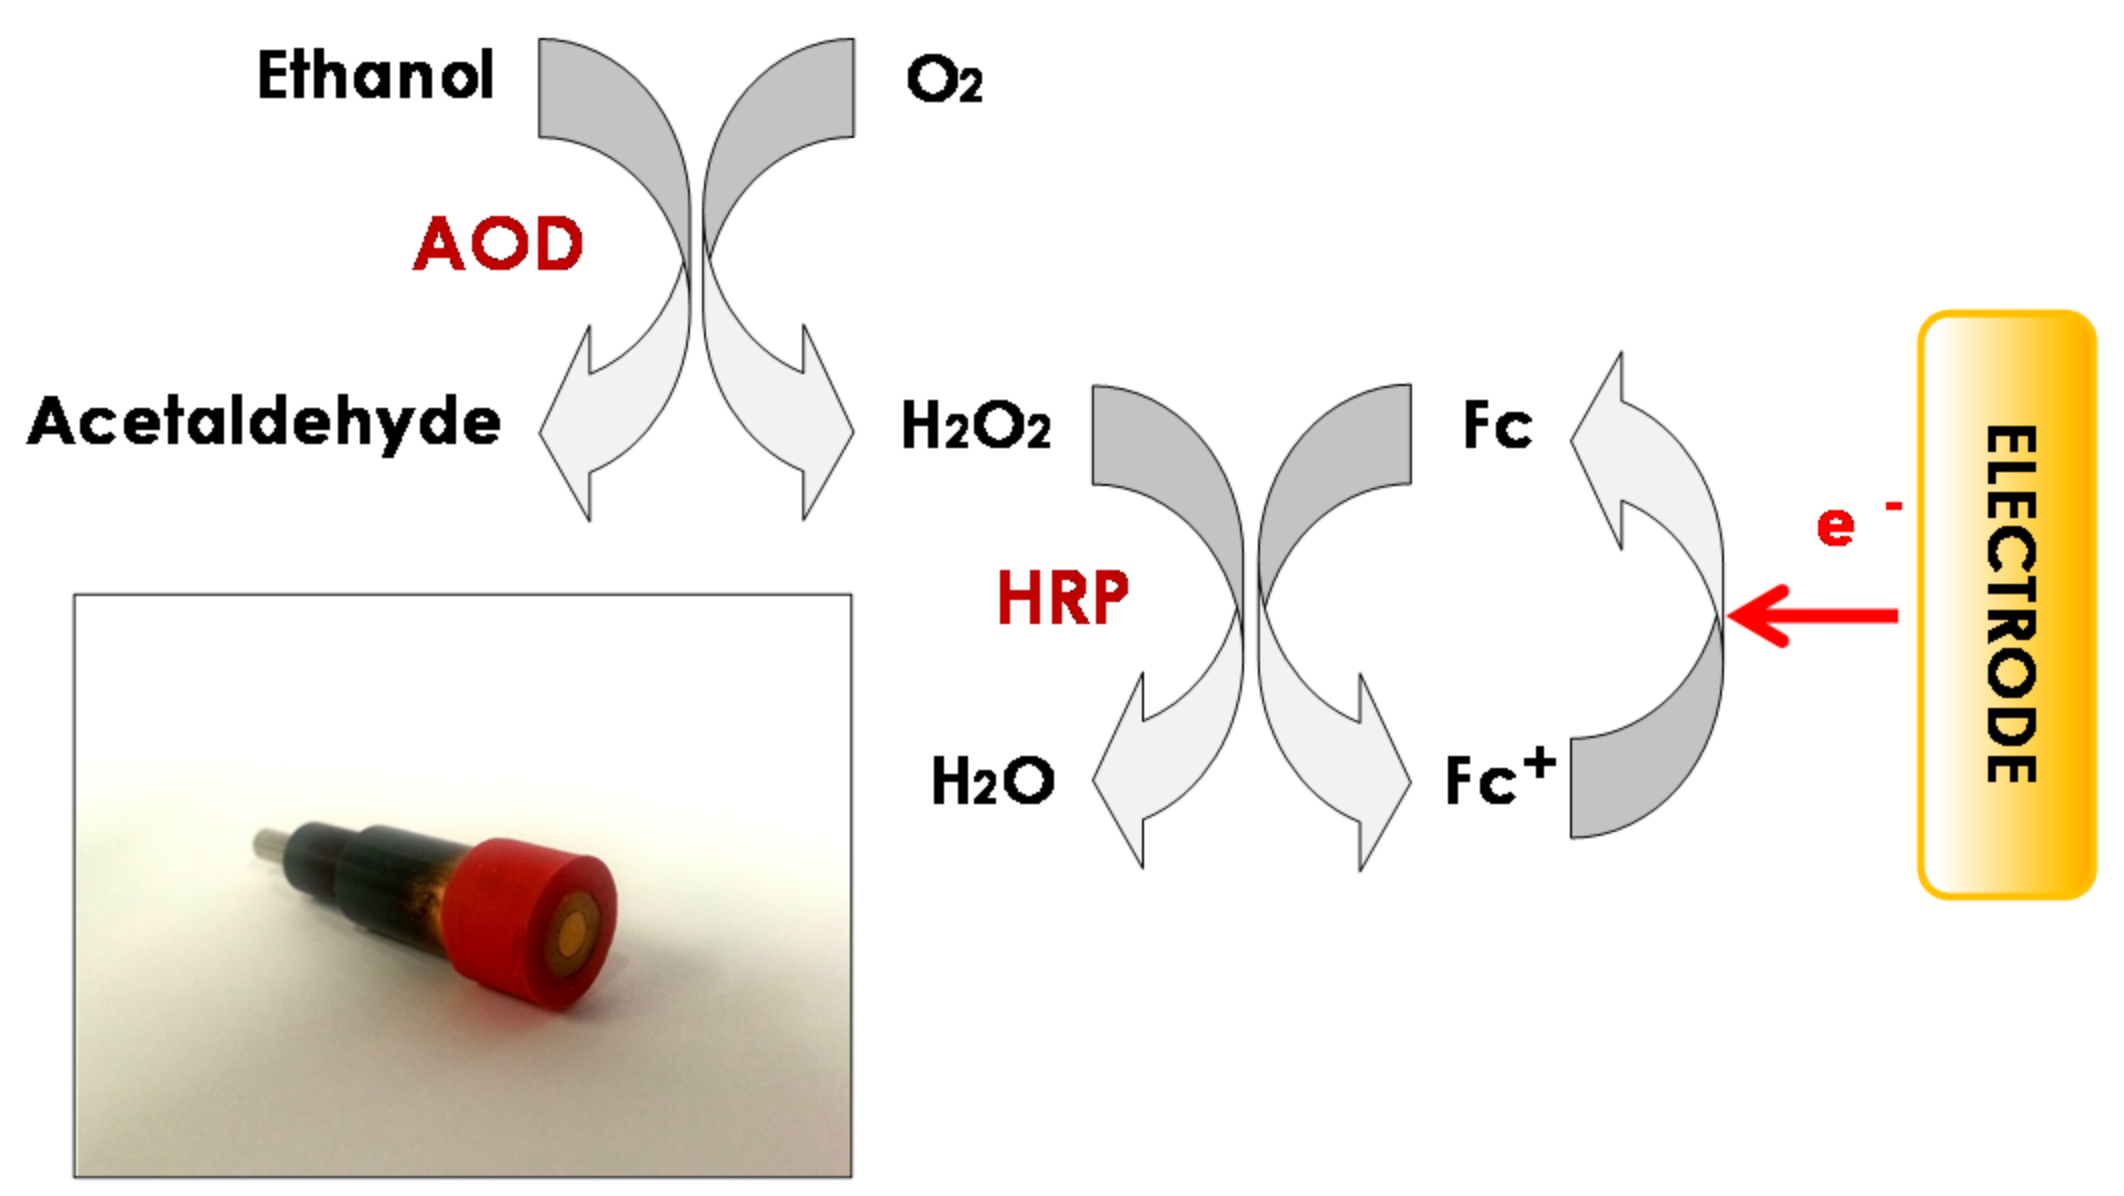
Automated Bioanalyzer Based on Amperometric Enzymatic Biosensors for the Determination of Ethanol in Low-Alcohol Beers

by
Eva Vargas
1,2,
Felipe Conzuelo
1,†,
M. Asunción Ruiz
2,
Susana Campuzano
1,
Víctor Ruiz-Valdepeñas Montiel
1,
Guillermo González de Rivera
3,
Fernando López-Colino
3,
Á. Julio Reviejo
1 and
José M. Pingarrón
1,*
1
Departamento de Química Analítica, Facultad de CC. Químicas, Universidad Complutense de Madrid, Avda. Complutense s/n, 28040 Madrid, Spain
2
InBea Biosensores S.L. Parque Científico de Madrid, C/ Santiago Grisolía 2, Tres Cantos, 28760 Madrid, Spain
3
Escuela Politécnica Superior, Universidad Autónoma de Madrid, 28049 Madrid, Spain
*
Author to whom correspondence should be addressed.
Present address: Analytical Chemistry—Center for Electrochemical Sciences (CES), Ruhr-Universität Bochum, Universitätsstr. 150, 44780 Bochum, Germany.
Submission received: 6 April 2017 / Revised: 28 April 2017 / Accepted: 9 May 2017 / Published: 13 May 2017
(This article belongs to the Special Issue Beer)

Abstract

:
In this work, a new automated bioanalyzer based on the use of enzymatic biosensors as amperometric detectors is reported. This automatic bioanalyzer is configurable both as continuous flow and flow injection analysis systems and enables both on-line and off-line monitoring of ethanol in low-alcohol beer to be performed. The attractive analytical and operational characteristics demonstrated by the automated bioanalyzer make it a promising, simple, rapid, and reliable tool for quality control of this beverage in the beer industry, either during the manufacturing process or in the final product. Moreover its applicability to the analysis of the ethanol content in different non-alcoholic beers working at different modes was successfully demonstrated.

Graphical Abstract

1. Introduction

Beer is one of the most ancient alcoholic beverages consumed by mankind. It is easily obtained by fermentation of cereal grains, most commonly malted barley, in the presence of hops and yeast [1]. Along with water and carbohydrates, ethanol or ethyl alcohol is one of beer’s main components and represents an important organoleptic characteristic that determines its taste as well as its classification in terms of taxes and restrictions. Ethanol concentration in beer varies from a concentration below 1.0% (v/v) in low alcohol beers to a maximum value of about 12.5% (v/v) in those beers that are considered beers with high alcohol content [2]. Among low-alcohol beers, those with an ethanol concentration below 0.05% (v/v) are legally considered non-alcoholic beers [3]. In recent years, the market for non-alcoholic beer has experienced an expansion because of the great amount of consumers who want to continue ingesting beer but avoid medical and/or legal problems and even religious ones related to alcohol consumption [4].
At an industrial scale, the control of the fermentation processes in the brewing industry is based mainly on the monitoring of ethanol content. Due to the small amount of ethanol in low-alcohol beer, an efficient analytical control of its content is not easy and becomes considerably difficult when the control is intended to be performed in the process line. For this reason, it is important to have reliable and efficient analytical instrumentation allowing accurate and rapid determination of ethanol to be carried out so that regulation and control of the process of making beer with low-alcohol content is possible. Therefore, there is a growing demand for fast, reliable, and low-cost methods that allow continuous monitoring of ethanol concentration and that can be used during the beer production process.
Traditionally, the monitoring of ethanol content during the production of low-alcohol beer is carried out by means of off-line methods using techniques like refractometry, densitometry, redox titration [2], or gas chromatography [5,6,7,8]. Nevertheless, the complexity and low response time of these methods prevents their use for continuous monitoring.
In recent years, great efforts in the development of automated systems for ethanol determination in beer have been made. Of particular interest are methods based on flow analysis techniques due to their capability to provide short response times and being comparatively easy to automate and miniaturize [9]. Several analytical systems have been implemented using different instrumental techniques, including infrared spectroscopy [10,11,12,13]; visible spectroscopy [14,15,16,17]; nuclear magnetic resonance [18]; mass spectrometry [19]; flame ionization detector (FID) [20]; and biosensor devices involving both optical [21] and electrochemical detection [22,23,24,25,26,27]. Such systems, the main characteristics of which are summarized in Table 1, are likely to be automated and implemented as on-line analyzer systems, making possible to carry out the monitoring of alcohol concentration continuously and in real time. However, the application of this kind of system at an industrial production level is still not well established due to the lack of continuous detection devices with correction capacity allowing monitoring and control of processes. Real-time monitoring in the production line demands that the analyzer system by itself would be able to scrutinize the obtained results and perform recalibrations, if needed, at required time intervals [28].
In this work, we report the development for the first time of an automated bioanalyzer for ethanol using enzymatic (alcohol oxidase/peroxidase) biosensors as amperometric detectors, which allows ethanol in low-alcohol beers to be monitored either during the manufacturing process or in the final product. Based on previous optimizations carried out in semiautomatic flow systems, an automated instrument, which can be configured both as a CFA (continuous flow analysis) and a FIA (flow injection analysis) analyzer, was developed. From the point of view of sampling and detection steps, this instrument can work as an on-line analyzer if ethanol monitoring is carried out in the production line or as an off-line analyzer if the determination is performed at the laboratory. The operational characteristics of this bioanalyzer were evaluated in the different working modes and its applicability for the analysis of real samples was successfully demonstrated by comparing the results with those provided by reference analysis methods.

2. Materials and Methods

2.1. Apparatus and Electrodes

Amperometric measurements were carried out with an amperometric detector purchased from InBea Biosensores S.L. (Madrid, Spain). Flow experiments were carried out using a Spetec Perimax-12 peristaltic pump.
A commercial disposable ethanol biosensor (InBea Biosensores S.L., Madrid, Spain) [27] and a graphite-Teflon composite ethanol biosensor, reusable by polishing [25], were employed to carry out the amperometric detection. Both bienzymatic biosensors are based on the use of an alcohol oxidase/peroxidase (AOD/HRP) system and use ferrocene as a redox mediator. While the composite biosensor involves the physical entrapment of all the components into the graphite-Teflon matrix, the commercial ethanol biosensor was prepared by deposition of the three components onto a gold film sputtered on a stainless steel disk electrode and their co-immobilization by means of a dialysis membrane. A BAS MF-2052 Ag/AgCl/KCl (3 M) reference electrode and a Pt wire counter electrode were also employed. A 20-mL electrochemical cell was used for amperometric measurements in stirred solutions, while a homemade methacrylate 10-mL wall-jet cell and a 40-µL cylindrical cell were employed in the semiautomatic flow systems and with the automated bioanalyzer, respectively. A homemade methacrylate de-bubbler and a gas diffusion based sampling unit were also used. Teflon (PTFE) membranes (Sartorious) with a pore size of 0.45 µm or 0.20 µm were used in the sampling unit. Electronically controlled elements consisted of X112LFB 8 mm switching solenoid valves (Sensortechnics) and WPM peristaltic pumps (Welco).

2.2. Reagents and Solutions

A stock 20% (v/v) ethanol (Scharlab) solution was prepared in 0.05 M phosphate buffer of pH 7.4. More diluted standards were prepared by suitable dilution with the same buffer solution, which was also used as supporting electrolyte. HRP (Type II from horseradish, EC 1.11.1.7, Sigma-Aldrich, 156 U·mg−1), AOD (from Pichia pastoris, EC 1.1.3.13, Sigma-Aldrich, 1.32 U·µL−1), and ferrocene (Fluka), were used for the preparation of ethanol biosensors. All chemicals used were of analytical-reagent grade and were used without further purification. Water was obtained from a Millipore Milli-Q purification system (ρ = 18.4 MΩ cm at 25 °C).

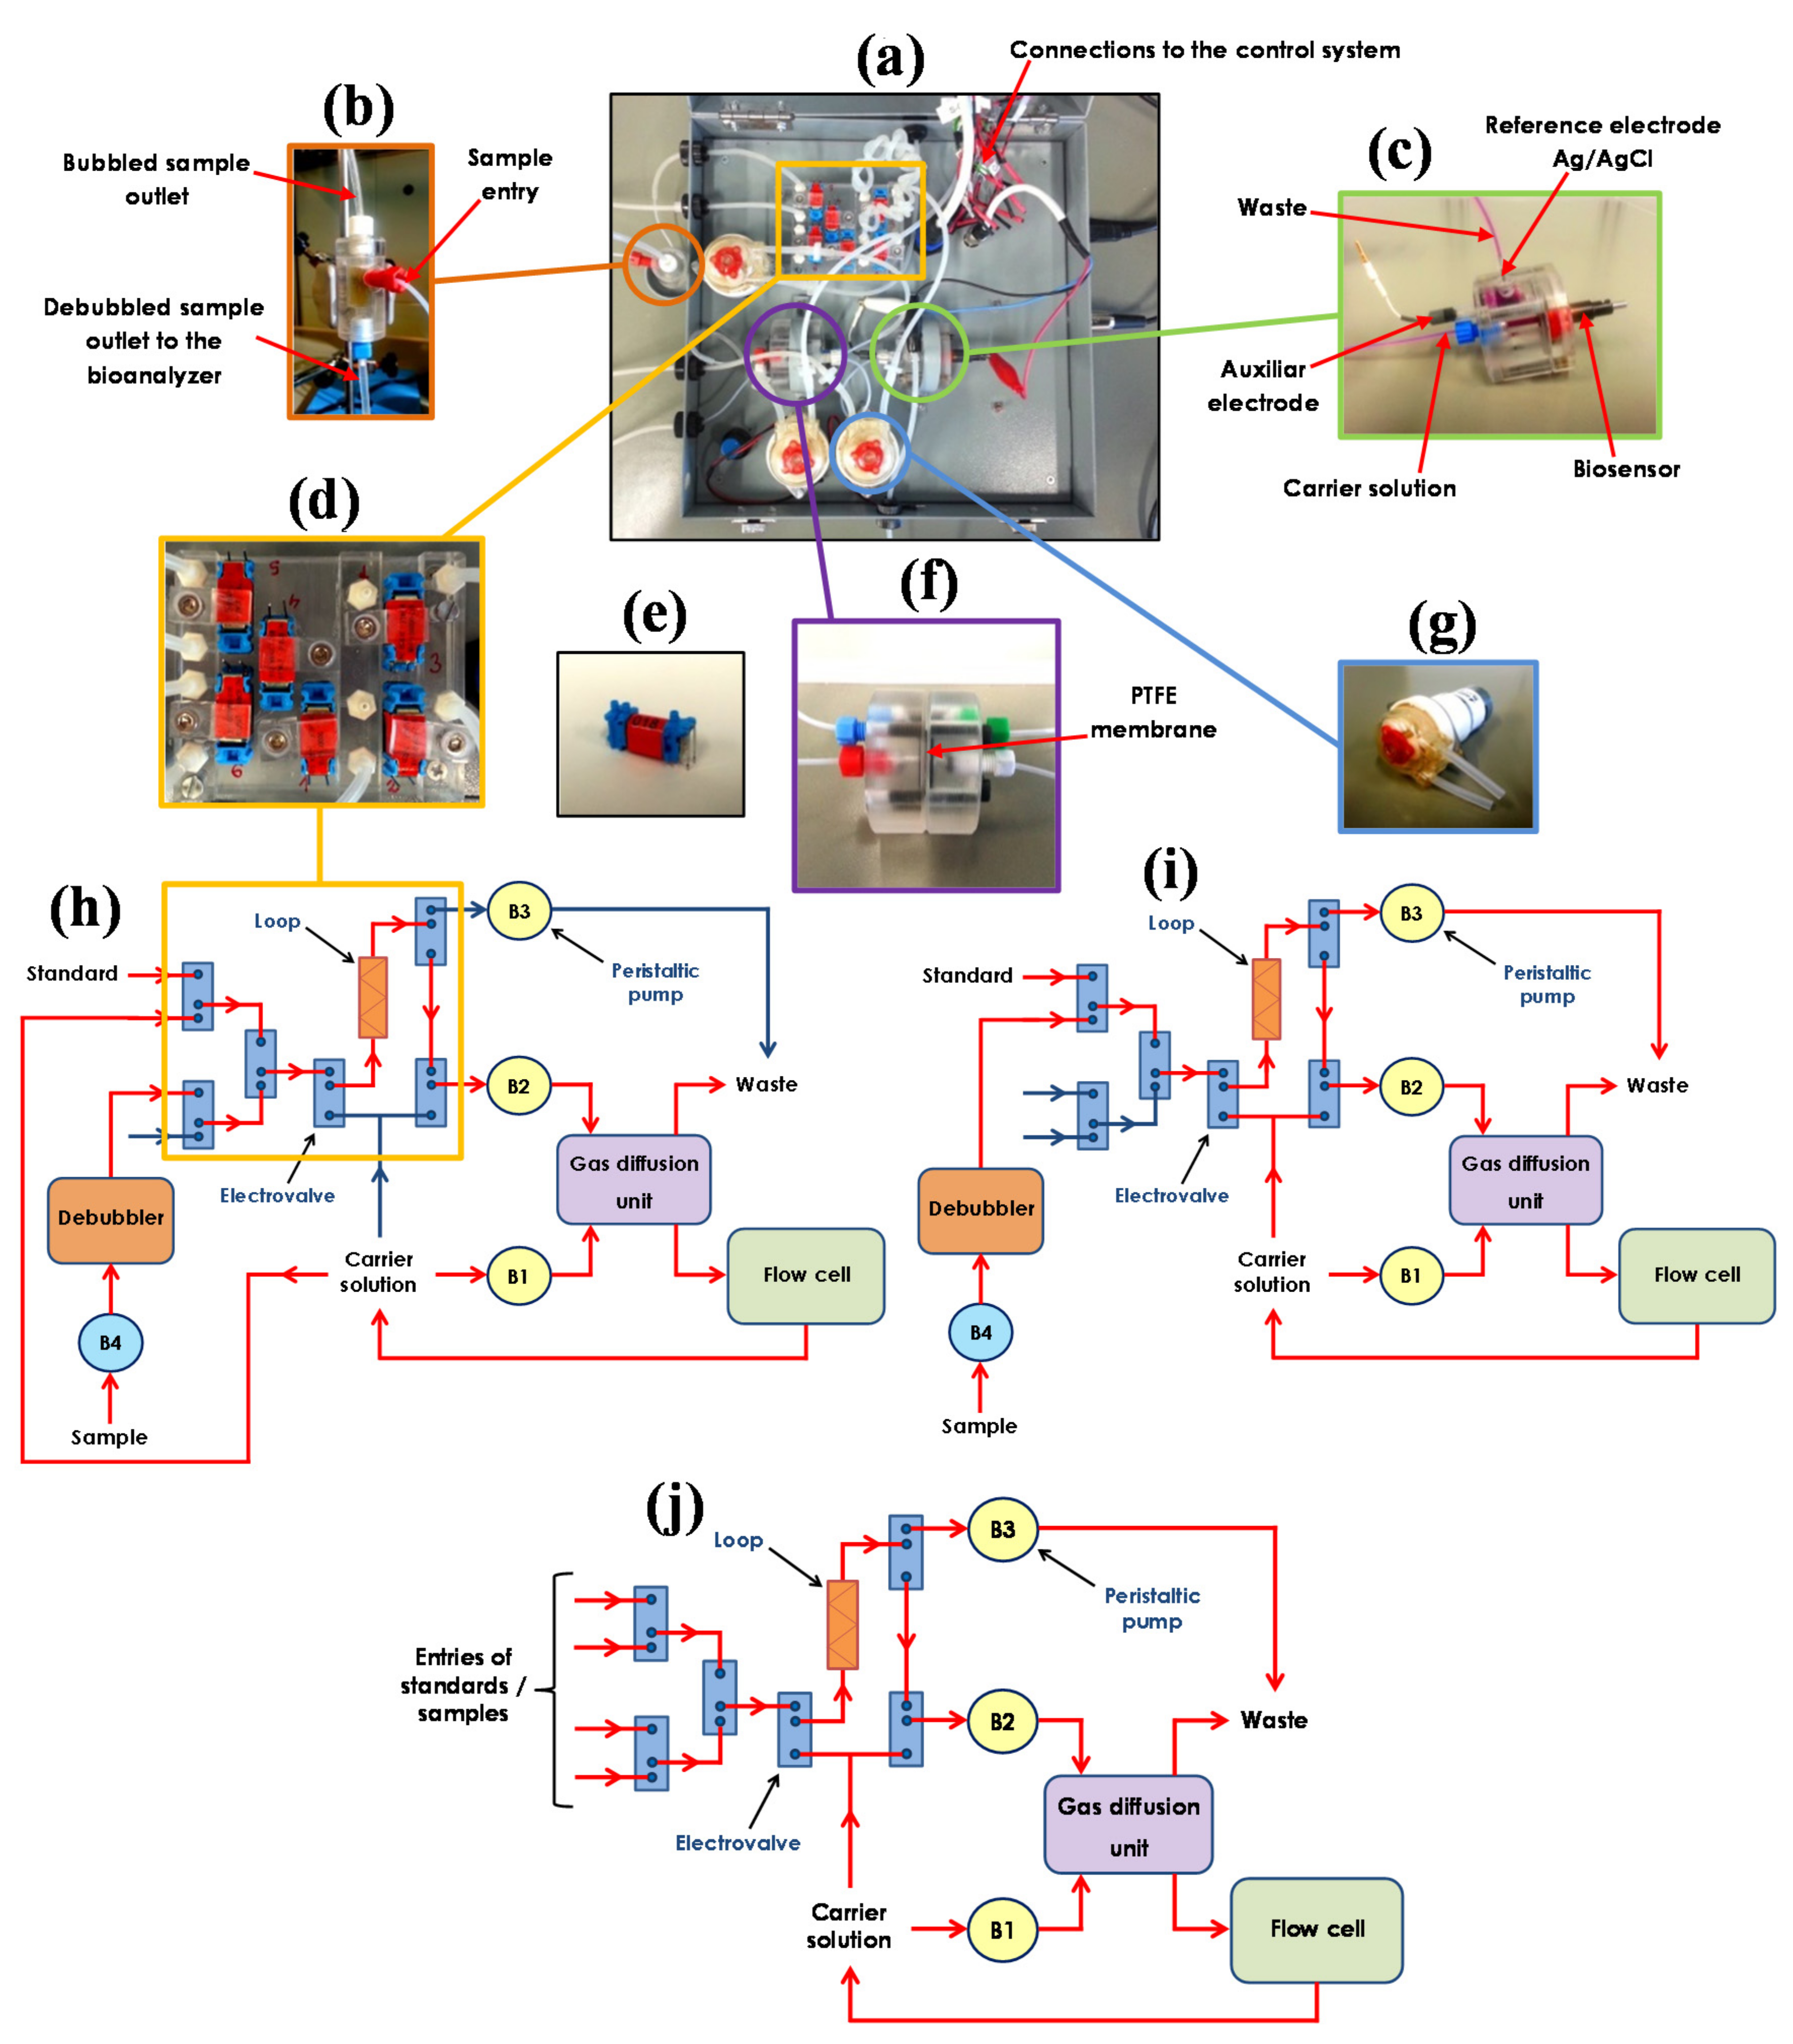
2.3. Automatic Bioanalyzer for Ethanol Determination

Prior to the construction of the automatic bioanalyzer, semiautomatic flow systems were used to optimize the use of a gas diffusion unit for in situ sample dilution and a de-bubbler unit to allow direct introduction of samples into the bioanalyzer without previous removal of the dissolved gas. These semiautomatic systems were composed of a peristaltic pump, a wall-jet type cell (~10 mL) containing the biosensor, reference and auxiliary electrodes, and, for the control of solutions and the insertion of standards and samples into the bioanalyzers, manual three-way valves (Omnifit). Details of these optimization studies are given in the Suplementary Information.
Based on these results, implementation of the automatic bioanalyzer included both the mechanical and electrical designs of the bioanalyzer as well as the development of applications for different operating and control systems for ethanol monitoring in beer. The hardware and the software implemented also required the development of microelectronics and computer applications for the operation and automated control of the bioanalyzer. A detailed description of the electrical design and the developed software applications of the constructed automated prototype is provided in the Supporting Information.

2.4. Procedures

2.4.1. Amperometric Detection

Detection with the Semiautomatic Bioanalyzers

To obtain the amperometric responses, the biosensor, reference, and auxiliary electrodes were introduced into the wall-jet flow cell and the carrier solution (0.05 M phosphate buffer solution of pH 7.4) was passed throughout the system for five minutes to fill the cell. The current was monitored over time under the established working conditions (Eapp = 0.0 V vs. Ag/AgCl, Q = 0.5 mL·min−1). When the background current was stabilized, the standard or sample solution was introduced into the flow system so that the carrier solution swept along it to the flow cell and then recorded the amperometric signal. Once the baseline was reached again, the next measurement could be performed.

Detection with the Automated Bioanalyzer

The analysis method to be executed by the software for the control of the bioanalyzer was previously set from the configuration file and user interface. In the automated prototype, the biosensor and auxiliary electrode were introduced into the cylindrical cell, which already included the reference electrode. The variation of the current with time was recorded under the established working conditions (Eapp = 0.0 V vs. Ag/AgCl, Q = 4.0 mL·min−1), obtaining real-time analytical information of the ethanol content using the programmed method of analysis.

2.4.2. Analysis of Beer Samples

Different commercial low-alcohol beer samples, supplied by a beer factory, were analyzed.
When the automated prototype was used as an on-line analyzer, no sample treatment was required because of the direct introduction of beer samples. Degassing the sample by manual stirring was needed when the automated bioanalyzer were employed as an off-line analyzer. In all cases, the ethanol concentrations in beers with ethanol contents below 1.0% (v/v) were calculated from the measured amperometric signals, which were interpolated into two-point calibration plots constructed with the 0.0 value and one point from the 0.8% and 0.04% (v/v) ethanol standard solutions for the analysis of non-alcoholic beers and beers with an ethanol concentration <1.0% (v/v), respectively.

3. Results and Discussion

3.1. Automated Bioanalyzer Developed for Ethanol Determination

An automated prototype of an ethanol bioanalyzer was constructed. This prototype was designed to work both as a CFA analyzer for on-line ethanol monitoring in the production line and a FIA analyzer able to work both in on-line and off-line modes for ethanol determination in the laboratory. The development process of the automated bioanalyzer comprised the design and optimization of the devices to be implemented in the flow system, mechanical, and electronic designs of the prototype and in the development of software applications for appropriate control and decision making regarding ethanol monitoring in beer samples. The electronic design and developed software are described in the Supporting information.

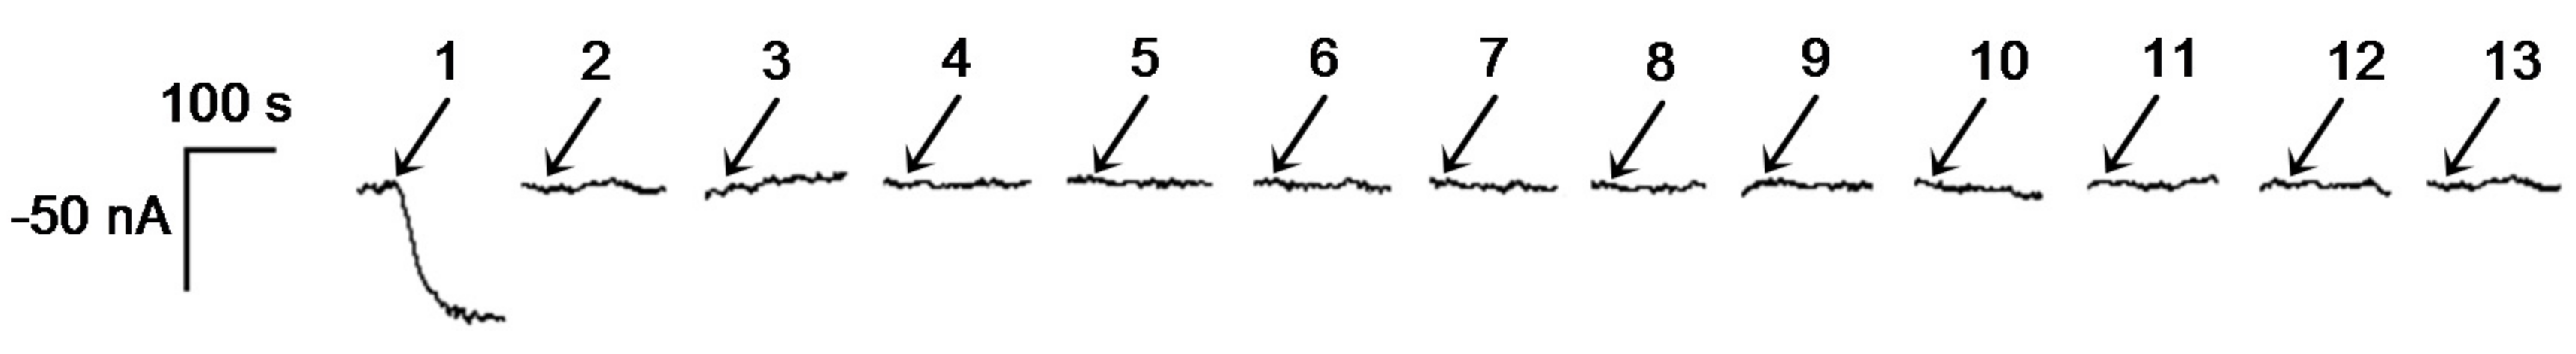
3.1.1. Optimization of Parameters Involved in the Construction of the Automated Bioanalyzer

Two different ethanol biosensors were used as working electrodes. A composite graphite-Teflon ethanol biosensor, developed previously in our research group [25], was employed when the automated bioanalyzer was configured as a CFA analyzer. However, a commercial ethanol biosensor purchased from InBea Biosensores S.L. was used when the automatic bioanalyzer was employed as a FIA analyzer. The biocatalytic scheme involved in the commercial ethanol biosensor, as well as a real picture of it, is displayed in Figure 1. Alcohol oxidase oxidizes ethanol to acetaldehyde using oxygen (O2) as the electron acceptor, producing H2O2 as a byproduct. Subsequently, HRP reduces H2O2 to H2O using ferrocene as an electron donor, producing ferricinium. The measured cathodic current corresponded to the electrochemical reduction of generated ferricinium, and it is proportional to the ethanol concentration.
The high sensitivity achieved with the composite biosensor made it necessary to carry out a dilution of the beer sample before reaching the electrochemical flow cell. Such a dilution step had to be performed in situ by a designed component of the continuous flow system. The volatility of the analyte was exploited by using a sampling unit based on gas diffusion through a PTFE membrane permeable to ethanol and impermeable to water. In this way, the ethanol contained in the sample passed through the membrane and was swept along by the carrier solution to the flow cell. This type of gas diffusion system was described previously for the analysis of wine and beer [16,17,22], as well as for the determination of ethanol in sweat [29].
In view of the final application to the analysis of beers, since the selectivity of the ethanol composite biosensor had previously been evaluated [25], only the effect of substances normally present in low-alcohol beers on the ethanol biosensor response was investigated in this work. Such an effect was evaluated in stirred solutions by adding to the electrochemical cell (containing 20 mL of the supporting electrolyte) 250 μL of standards solutions of d-glucose, d-fructose, l-arabinose, d-galactose, maltose, glycerol, and citric, acetic, and succinic acids at 3 g·L−1; l-malic acid at 56 mg·L−1, l-lactic acid at 58 mg·L−1, and ascorbic acid at 34 mg·L−1. The used concentrations were those usually found in this type of sample. The amperometric responses obtained (shown in Figure 2) clearly demonstrated the appropriate selectivity of the developed biosensor for the selective determination of ethanol in low-alcohol beers. Moreover, it is worth mentioning that, in the case of the continuous bioanalyzers, the use of a gas diffusion sampling unit containing a PTFE membrane ensures that only the ethanol reaches the biosensor, which also minimizes the possible interference of any other substance in the sample.
To assess whether the use of the PTFE membrane-based sampling unit provided an appropriate sample dilution for the analysis of beers with low alcohol content, a semiautomatic continuous flow system, in which the sampling unit was incorporated, was constructed (Figure S1a in the Supporting Information). The sampling unit consisted of two methacrylate blocks incorporating a PTFE membrane in between (Figure S1b,c). The dilution capability of the sampler device was evaluated by comparing the amperometric signals obtained by depositing 1 mL of an ethanol standard solution on the surface of the sampling unit equipped with PTFE membranes of different pore diameters and varying the number of membranes set (see Table S1). As illustrated in Figure S1d, reproducible amperometric signals, which increased with the ethanol concentration tested, were obtained. The optimization of the sampling unit design also involved the evaluation of the contact surface between the sample and carrier solutions (Table S1).
Considering that, as expected, the smaller contact surface between donor and acceptor solutions (data shown in Table S1) provoked a lower amount of ethanol reaching the detector and, accordingly, a lower sensitivity, and taking into account the different alcohol levels presented in low-alcohol beers, the units of two different diameters, 20 and 14 mm, were used for ethanol monitoring in non-alcoholic beer and in beer with an alcohol concentration below 1.0% (v/v), respectively.
Interestingly, significantly different results were obtained with the bioanalyzer depending on the sample temperature. Indeed, the alcohol concentrations determined at 4 °C (temperature at which industrial beer production is carried out) were considerably lower than those calculated at room temperature. Therefore, with the aim to develop a simple flow system unit able to be implemented in the production line of a brewery for continuous monitoring of ethanol, the sampling unit design was improved. This unit should allow the same gas diffusion process for both the analyzed beer and the calibration standard in order to permit a proper calibration and the subsequent interpolation of the recorded current values to calculate the ethanol concentration in the sample. This goal was achieved by implementing a flow system, allowing the analyzed sample to acquire room temperature before reaching the flow cell for measurement, and a sandwich format sampler unit (Figure S2a,b, respectively) so that the sample and standard solutions were measured at the same temperature.
To verify that the designed system enabled to analyze samples at low temperature, the analysis of different ethanol standards at 4 °C was performed (Table S2). The absence of significant differences between the measured concentration and the real ethanol content demonstrated that the distance travelled by the standard solution through the flow system up to the sampling unit was long enough to allow it to reach the temperature of the acceptor solution, which circulates on the other side of the PTFE membrane. Therefore, the process of gas diffusion could be performed in a reproducible way regardless of the sample temperature when introduced into the bioanalyzer.
Moreover, the high content of dissolved gas in beer may cause irreproducibility in the ethanol diffusion process through the membrane, generating considerable variations of the analytical response. To overcome this limitation, a de-bubbler unit, incorporated between the sampling and the inlet to the continuous flow system, was also constructed (Figure S3a). As can be seen in Figure S3b, the de-bubbler allowed the removal of bubbles and, consequently, the source of irreproducibility in the electrochemical measurements. To feed the de-bubbler with the beer sample, an auxiliary pump was used, but it is worth mentioning at this point that the auxiliary pump would not be necessary in the case of sampling at the production line since the pressure generated by the line flow would be enough for the sample to reach the de-bubbler.
The integration of all components into the automated bioanalyzer prototype is shown in Figure 3a. To allow the automatic control of the flow system, three-way electronically controlled solenoid valves (Figure 3e) were used, while to drive the solutions and samples in the automatic flow system, miniaturized electronically controlled peristaltic pumps (Figure 3g) were implemented. A new small volume (40 µL) cylindrical flow cell in which both the biosensor and the reference electrode are in contact with the same carrier solution, was designed to facilitate its integration inside the prototype (Figure 3c). In this cell, the stainless steel auxiliary electrode is the waste outlet channel (see Figure 3c), and the carrier is introduced into the cell through a tube, reaching the surface of the biosensor through a small integrated channel. This design exhibits important advantages with respect to the wall-jet type cell allowing: (1) the gravity displacement of the possible bubbles generated in the flow system and their evacuation outside the cell, thus avoiding irreproducibility in analytical measurements due to the bubbles’ positioning at the biosensor surface; (2) easy insertion of the biosensor into the cell, independent of the operator skills. In addition, to allow the bioanalyzer to be used in a FIA mode, an injection system consisting of three three-way valves and a loop of variable volume was implemented (Figure 3d,h). Furthermore, the system requires the use of two peristaltic pumps, one of them working intermittently to fill the loop with the standard or sample solutions and the other working always to transport the carrier solution or the volume contained in the loop to the detector.
As in Figure 3d, the set of channels and valves forming the flow manager system was integrated into a methacrylate compact device in which all the solenoid valves and connectors required were set. The prototype was designed with nine flow entries, which are configured as inputs or outputs of the solution depending on the instrument working mode. Control of the flow system was possible by connecting electronic components (valves and pumps) to the managing system of the bioanalyzer (see Figure 3a), so that the activation and deactivation of these components is done automatically. For an in situ dilution of beer samples, and taking into account the volatile nature of ethanol, the gas diffusion based sampling unit was used (Figure 3f).
Regarding the flow system, a general configuration of valves, pumps, and flow circuit was designed so that the same prototype could be used to monitor ethanol in beer both as a FIA system, introducing discrete volumes of standards and samples, and as a CFA system, introducing standards and samples uninterruptedly. Depending on the type of analysis to be carried out, different components will be used, activated, and deactivated in the corresponding order to obtain the appropriate analytical response. Schematic configurations of the automated bioanalyzer operating as CFA and FIA (with on-line and off-line applications) systems are shown in Figure 3h–j, respectively. The red arrows indicate the parts of the bioanalyzer that are used for each operation, while blue arrows indicate the parts not used for such operation.

3.1.2. Automated Bioanalyzer Working as a CFA Analyzer

As can be seen in Figure 3h, the automated prototype, when working in the CFA mode, contained one inlet into the flow system for the standard solution and the sample, two inlets for the carrier solution, and one waste outlet. In addition, it was equipped with the de-bubbler unit and a peristaltic pump for feeding the de-bubbler device. If the automated bioanalyzer is used for on-line analysis at the production line in the brewery, the pressure generated by the line flow would be enough to carry the sample to the de-bubbler. Therefore, the peristaltic pump B4 was not included in the flow system of the instrument, and it was not considered as a component to be controlled automatically.
Considering the operational characteristics of the prototype, the high working flow rate provided by the peristaltic pumps (4.0 mL·min−1) implied the consumption of a large volume of carrier solution. Therefore, a recirculation of the outlet from the flow cell into the carrier solution was implemented, as is shown in Figure 3h–j, thus decreasing significantly the waste of the carrier solution. However, following this approach, the amount of ethanol passing through the sampling unit reaching the detector would eventually enrich the carrier solution. Considering 1 L as the initial volume of the carrier solution, and refilling the carrier solution with clean phosphate buffer every 12 h approximately, the ethanol concentrations in the carrier solution after 24 h of operation were found to be 1.60 × 10⁻²% (v/v) when analyzing low alcohol beer and 2.20 × 10⁻³% (v/v) for the analysis of non-alcoholic beer. Therefore, it was concluded that the ethanol enrichment of the carrier solution did not affect significantly the operation of the automated bioanalyzer for ethanol determination.
Under the experimental conditions established for the automated CFA analyzer, calibration curves for ethanol between 0.02 and 0.10% (v/v) (Figure 4a) and 0.25 and 1.25% (v/v) (Figure 4b) were constructed, with prototypes equipped with sampling units of 20 mm and 14 mm, respectively. Table 2 summarizes the analytical characteristics obtained. The limits of detection (LOD) and quantification (LOQ) were calculated according to the 3 × sb/m and 10 × sb/m criteria, respectively, where m is the slope of the calibration graph and sb is the standard deviation of the blank current, which was measured each second for a 300 s period of time before recording the analytical signal (confidence intervals were calculated for α = 0.05).
The repeatability of the amperometric responses was tested by recording successive measurements of 0.04% (v/v) ethanol standard solutions using the 20 mm sampling unit (Figure 4c) and 0.8% (v/v) when the 14 mm sampling unit was employed (Figure 4d). The RSD values obtained were 4.9% and 3.4% (n = 10), respectively.
The response time and sample frequency achieved with the bioanalyzer were also evaluated. The response time is defined as the time taken for recording an analytical signal. In the case of on-line analysis, this is a critical parameter since the detection in real time of an increase in the ethanol concentration in the beer manufacturing line might lead the process being stopped. In the case of off-line analysis, working with a high sampling frequency is not so critical for this parameter. The sampling frequency can be defined as the frequency at which the complete measurement of a sample is carried out. This parameter will depend on the appropriate operation of the biosensor and the analysis method and settings established from the system configuration. In the case of on-line operation, when the automated prototype works as a CFA bioanalyzer, the ethanol concentration is monitored every second in time intervals of 1 h, this being a programmable parameter. The gradual loss of signal of the biosensor as a result of enzyme leaching or deactivation during the course of an analysis was corrected so that the quantification of ethanol concentration was realized truthfully.
The lifetime of the ethanol biosensors employed as sensing systems was evaluated under the established conditions of flow rate and the carrier solution recirculation. The lifetime of the graphite-Teflon composite biosensor in the automated bioanalyzer working on-line in the CFA mode was evaluated by monitoring the response obtained for a 0.04% (v/v) ethanol standard solution during 70 h of continuous analysis of a non-alcoholic beer, with recalibration every hour. The biosensor lost 60% of its initial response after 54 h of use (see Figure S9). Nevertheless, the biosensor response could still recover the baseline, effectively enabling the measurement of ethanol concentration in beer. As no deviation from the baseline was observed during this study, one could conclude that the level of ethanol concentration in the carrier solution due to the recirculation of the waste from the flow cell is not significant. Therefore, the changes in the signals were attributed to loss of stability of the biosensor.
Since the PTFE membrane is continuously in contact with beer samples and, hence, is subject to fouling, this component also presented a limited lifetime, making it necessary to replace it when needed. It was found that a maximum duration of approximately 105 h in 18 working days of ethanol monitoring in beer was possible with the type of membranes used. The cleaning step applied periodically to the flow system at the end of the analysis with 0.1 M NaOH solution and distilled water proved that the lifetime of the membrane was longer than it might be expected, thus preventing a faster deterioration of this component and more frequent replacement.
The ability of the automated bioanalyzer for ethanol determination in the CFA mode was validated by analyzing low-alcohol beers. The 20 mm sampling unit was employed in the analysis of non-alcoholic beers and the 14 mm unit in the analysis of beers with an ethanol concentration <1.0% (v/v). In all cases, a two-point calibration using a 0.04% (v/v) ethanol standard solution for the analysis of non-alcoholic beers and 0.8% (v/v) for the analysis of beers with ethanol concentration <1.0% (v/v), was performed. All samples were analyzed at 4 °C without any previous sample treatment or dilution. The results (Table 3) were compared with those obtained by applying a method validated by InBea Biosensores S.L. using a commercial ethanol amperometric biosensor in stirred solutions.

3.1.3. Automated Bioanalyzer Working as a FIA Analyzer

In this case, a commercial ethanol biosensor purchased from InBea Biosensores S.L., providing higher sensitivity and better stability under FIA operation than the graphite-Teflon composite electrode, was used. The injection system was included in the methacrylate plate with electrovalves for managing the hydrofluidics (Figure 3d) and consisted of three three-way valves and a loop of variable volume. The system also required the use of two peristaltic pumps, one working intermittently to fill the loop with the standard or sample solutions and the other, remaining always operative, to transport the carrier solution or the volume contained in the loop to the detector. Under this working mode, both on-line and off-line measurements were carried out, which implied different control software and operation schemes for each type of analysis.

On-line Analysis

In this operation mode, the flow system (Figure 3i) involved an additional waste outlet corresponding with the injection system waste. The de-bubbler unit, necessary to introduce the beer into the bioanalyzer, was kept in this system together with the auxiliary peristaltic pump for feeding this device.
Calibration curves constructed for ethanol using the sampling units of 20 and 14 mm are shown in Figure 5a,b, exhibiting linear ranges between 0.02 and 0.10% (v/v) and 0.25 and 1.25% (v/v), respectively. The same criteria indicated in Section 3.1.2 were employed to calculate the corresponding limits of detection (LOD) and quantification (LOQ). The analytical characteristics of the automated bioanalyzer working in this particular mode are summarized in Table 4.
The repeatability of the amperometric on-line responses was evaluated by carrying out successive measurements of 0.04% (v/v) and 0.8% (v/v) ethanol standard solutions when working with the 20 mm (Figure 5c) and the 14 mm sampling unit (Figure 5d) respectively. The RSD values obtained were 2.5% and 3.1% (n = 20), respectively.
Under the established operation conditions, the average response time was found to be 4.1 min (15 analytical signals per hour). However, considering that a recalibration was carried out every five sample measurements or when a RSD value for peak intensity (ip) values higher than 10% between measurements occurred, the actual sampling frequency was 10 samples per hour.
The lifetime of the ethanol biosensor used as the amperometric detector was evaluated by monitoring the peak current values measured for a 0.04% (v/v) ethanol standard solution. Figure S10a shows that a loss of 80% of the initial response occurred after approximately 46 h of uninterrupted functioning. Interestingly, Figure S10b shows that this loss could be effectively corrected by recalibration every five measurements, allowing accurate determination of ethanol in non-alcoholic beers during the whole experiment using the same biosensor.
The automated prototype was validated for the determination of ethanol in the FIA on-line mode by analyzing low-alcohol beers at 4 °C without any sample treatment or dilution. Both 20 and 14 mm sampling units were employed, and the methodology was that described in Section 3.1.2. The results shown in Table 5 were compared with those provided by the method validated by InBea Biosensores S.L. using the same alcohol biosensor as the amperometric detector in stirred solutions. No statistically significant differences between the results provided by both methods were found for a 95% confidence level, thus demonstrating the reliability of the analyzer for FIA on-line ethanol determination in low-alcohol beer.

Off-Line Analysis

When the bioanalyzer is used as a FIA analyzer for off-line ethanol monitoring, several entries for standard or beer, a carrier solution input, and two flow outputs were used, as in Figure 3j. In this case, the valve module works as a sample selector.
The lifetime of the ethanol biosensor was evaluated by measuring daily the peak current obtained for 0.04% (v/v) ethanol standard solution. The biosensor lost 46.5% of its initial response after eight days of daily use. However, during this period of time, the biosensor kept enough sensitivity to detect ethanol concentrations lower 0.04% (v/v) and was able to perform 300 sample analyses.
In the case of off-line ethanol monitoring, the bioanalyzer was used in a brewery laboratory where the beer samples were analyzed both at 0 °C and room temperature (RT) and were previously degassed by hand stirring. The obtained results, summarized in Table 6, were compared with those provided by the gas chromatography official method (Table 6).
As can be deduced from Table 6, the statistical comparison (with texp values < ttab) showed that no significant differences were found between the results provided by the automated bioanalyzer and the gas chromatography official method. Moreover, no significant differences were found between the ethanol concentrations determined at both temperatures for the same beer sample.

4. Conclusions

In this work a new automated bioanalyzer for ethanol content determination in low alcohol beers is reported. The bioanalyzer is able to operate both as a CFA analyzer for on-line analysis, if ethanol monitoring is carried out in the production line, and a FIA analyzer, able to be used for on-line and off-line analysis, if the determination is performed at the laboratory. The automatic prototype was demonstrated to possess attractive analytical and operational characteristics in the three working modes, allowing successful application to analyze low-alcohol beers with inherent advantages of simplicity, sensitivity, and assay time. The automated bioanalyzer fulfills amenability to field-based usage with minimal training requirement, showing potential for commercialization as an affordable and useful analytical tool for routine quality control of low-alcohol beer either during the manufacturing process or for the final product. Moreover, the developed system can also find application for quality control in the industry of fermented beverages, for the analysis of beers with regular alcohol content or wines, or for another type of products and analytes of relevance in the food industry, such as fruit juices or soft drinks, by performing appropriate modifications in the design of the sampling device and replacing the biosensor for another specific to the target analyte.

Supplementary Materials

The following are available online at www.mdpi.com/2306-5710/3/2/22/S1: Parameters optimization, Sampling unit design, Table S1, Figure S1, Table S2, Figure S2, De-bubbler unit design, Figure S3, Automated bioanalyzer, Electrical design, Figure S4, Software applications, Figure S5, Figure S6, Figure S7, Figure S8, Figure S9, and Figure S10.

Acknowledgments

The financial support of the CTQ2015-64402-C2-1-R (Spanish Ministerio de Economía y Competitividad Research Project), S2013/MT3029 (NANOAVANSENS Program from the Comunidad de Madrid), and the Art. 83 Project founded by SAN MIGUEL FÁBRICAS DE CERVEZA Y MALTA, S.A.U. are gratefully acknowledged.

Author Contributions

E.V., F.C., M.A.R., S.C., V.R.-V.M., G.G.R., F.L.-C., A.J.R., and J.M.P. conceived and designed the experiments; E.V., F.C., V.R-V.M., and M.A.R. performed the experiments; E.V., F.C., M.A.R., S.C., G.G.R., F.L-C., and A.J.R. analyzed the data; and E.V., F.C., S.C., and J.M.P. wrote the paper.

Conflicts of Interest

The authors declare no conflict of interest. The founding sponsors had no role in the design of the study; in the collection, analyses, or interpretation of data; in the writing of the manuscript; or in the decision to publish the results.

References

  1. Sohrabvandi, S.; Mortazavian, A.M.; Rezaei, K. Advanced analytical methods for the analysis of chemical and microbiological properties of beer. J. Food Drug Anal. 2011, 19, 202–222. [Google Scholar]
  2. Tonelli, D. Methods for Determining Ethanol in Beer. In Beer in Health and Disease Prevention; Preedy, V.R., Ed.; Elsevier: Amsterdam, The Netherlands, 2009; Chapter 102. [Google Scholar]
  3. Sohrabvandi, S.; Mousavi, S.M.; Razavi, A.M.; Mortazavian, A.M.; Rezaei, K. Alcohol-free Beer: Methods of Production, Sensorial Defects, and Healthful Effects. Food Rev. Int. 2010, 26, 335–352. [Google Scholar] [CrossRef]
  4. Catarino, M.; Mendes, A. Non-alcoholic beer—A new industrial process. Sep. Purif. Technol. 2011, 79, 342–351. [Google Scholar] [CrossRef]
  5. Pinho, O.; Ferreira, I.M.P.L.V.O. Method optimization by solid-phase microextraction in combination with gas chromatography with mass spectrometry for analysis of beer volatile fraction. J. Chromatogr. A 2006, 1121, 145–153. [Google Scholar] [CrossRef] [PubMed]
  6. Vautz, W.; Baumbach, J.I.; Jung, J. Beer Fermentation Control Using Ion Mobility Spectrometry—Results of a Pilot Study. J. Inst. Brew. 2006, 112, 157–164. [Google Scholar] [CrossRef]
  7. Ragazzo-Sanchez, J.A.; Chalier, P.; Chevalier, D.; Calderon-Santoyo, M.; Ghommidh, C. Identification of different alcoholic beverages by electronic nose coupled to GC. Sens. Actuators B 2008, 134, 43–48. [Google Scholar] [CrossRef]
  8. Zapata, J.; Mateo-Vivaracho, L.; Lopez, R.; Ferreira, V. Automated and quantitative headspace in-tube extraction for the accurate determination of highly volatile compounds from wines and beers. J. Chromatogr. A 2012, 1230, 1–7. [Google Scholar] [CrossRef] [PubMed]
  9. Kumar, M.A.; Mazlomi, M.A.; Hedström, M.; Mattiasson, B. Versatile automated continuous flow system (VersAFlo) for bioanalysis and bioprocess control. Sens. Actuators B 2012, 161, 855–861. [Google Scholar] [CrossRef]
  10. Gallignani, M.; Ayala, C.; Brunetto, M.R.; Burguera, J.L.; Burguera, M. A simple strategy for determining ethanol in all types of alcoholic beverages based on its on-line liquid–liquid extraction with chloroform, using a flow injection system and Fourier transform infrared spectrometric detection in the mid-IR. Talanta 2005, 68, 470–479. [Google Scholar] [CrossRef] [PubMed]
  11. Iñón, F.A.; Garrigues, S.; de la Guardia, M. Development of a PLS based method for determination of the quality of beers by use of NIR: Spectral ranges and sample-introduction considerations. Anal. Bioanal. Chem. 2005, 382, 1549–1561. [Google Scholar] [CrossRef] [PubMed]
  12. Iñón, F.A.; Garrigues, S.; de la Guardia, M. Combination of mid- and near-infrared spectroscopy for the determination of the quality properties of beers. Anal. Chim. Acta 2006, 571, 167–174. [Google Scholar] [CrossRef] [PubMed]
  13. Lachenmeier, D.W.; Godelmann, R.; Steiner, M.; Ansay, B.; Weigel, J.; Krieg, G. Rapid and mobile determination of alcoholic strength in wine, beer and spirits using a flow-through infrared sensor. Chem. Cent. J. 2010, 4. [Google Scholar] [CrossRef] [PubMed]
  14. Blum, P.; Mohr, G.J.; Matern, K.; Reichert, J.; Spichiger-Keller, U.E. Optical alcohol sensor using lipophilic Reichardt’s dyes in polymer membranes. Anal. Chim. Acta 2001, 432, 269–275. [Google Scholar] [CrossRef]
  15. Pérez-Ruiz, T.; Martínez-Lozano, C.; Tomás, V.; Iniesta, M.T. Flow injection determination of ethanol using online photo-oxidation and spectrophotometric detection. Microchim. Acta 2005, 149, 67–72. [Google Scholar] [CrossRef]
  16. Choengchan, N.; Mantim, T.; Wilairat, P.; Dasgupta, P.K.; Motomizu, S.; Nacaprocha, D. A membraneless gas diffusion unit: Design and its application to determination of ethanol in liquors by spectrophotometric flow injection. Anal. Chim. Acta 2006, 579, 33–37. [Google Scholar] [CrossRef] [PubMed]
  17. Pinyou, P.; Youngvises, N.; Jakmunee, J. Flow injection colorimetric method using acidic ceric nitrate as reagent for determination of ethanol. Talanta 2011, 84, 745–751. [Google Scholar] [CrossRef] [PubMed]
  18. Lachenmeier, D.W.; Frank, W.; Humpfer, E.; Schäfer, H.; Keller, S.; Mörtter, M.; Spraul, M. Quality control of beer using high-resolution nuclear magnetic resonance spectroscopy and multivariate analysis. Eur. Food Res. Technol. 2005, 220, 215–221. [Google Scholar] [CrossRef]
  19. Tarkiainen, V.; Kotiaho, T.; Mattila, I.; Virkajärvi, I.; Aristidou, A.; Ketola, R.A. On-line monitoring of continuous beer fermentation process using automatic membrane inlet mass spectrometric system. Talanta 2005, 65, 1254–1263. [Google Scholar] [CrossRef] [PubMed]
  20. Diamnatis, V.; Melidis, P.; Aivasidis, A. Continuous determination of volatile products in anaerobic fermenters by on-line capillary gas chromatography. Anal. Chim. Acta 2006, 573–574, 189–194. [Google Scholar] [CrossRef] [PubMed]
  21. Vidigal, S.S.M.P.; Tóth, I.V.; Rangel, A.O.S.S. Sequential injection-LOV format for peak height and kinetic measurement modes in the spectrophotometric enzymatic determination of ethanol: Application to different alcoholic beverages. Talanta 2008, 77, 494–499. [Google Scholar] [CrossRef]
  22. Mohns, J.; Künnecke, W. Flow analysis with membrane separation and time based sampling for ethanol determination in beer and wine. Anal. Chim. Acta 1995, 305, 241–247. [Google Scholar] [CrossRef]
  23. Peña, N.; Tárrega, R.; Reviejo, A.J.; Pingarrón, J.M. reticulated vitreous carbon-based composite bienzyme electrodes for the determination of alcohols in beer samples. Anal. Lett. 2002, 35, 1931–1944. [Google Scholar] [CrossRef]
  24. Lapa, R.A.S.; Lima, J.L.F.C.; Pinto, I.V.O.S. Development of a sequential injection analysis system for the simultaneous biosensing of glucose and ethanol in bioreactor fermentation. Food Chem. 2003, 81, 141–146. [Google Scholar] [CrossRef]
  25. Guzmán-Vázquez de Prada, A.; Peña, N.; Mena, M.L.; Reviejo, A.J.; Pingarrón, J.M. Graphite-Teflon composite bienzyme amperometric biosensors for monitoring of alcohols. Biosens. Bioelectron. 2003, 18, 1279–1288. [Google Scholar] [CrossRef]
  26. Valach, M.; Katrlík, J.; Strurdík, E.; Gemeiner, P. Ethanol Gluconobacter biosensor designed for flow injection analysis: Application in ethanol fermentation off-line monitoring. Sens. Actuators B 2009, 138, 581–586. [Google Scholar] [CrossRef]
  27. Reviejo García, A.J.; Pingarrón Carrazón, J.M.; Campuzano Ruiz, S.; Gamella Caballo, M.; García-Echave, V.V.; Manso Lorenzo, J.; Guzmán Vázquez de Prada, A.; Ferrero Martín, F.J.; Campo Rodríguez, J.; Valledor Llopis, M. Biosensor amperométrico desechable, método de fabricación del mismo y método de determinación de la presencia de analitos en alimentos. PTC/ES2009/000381, 18 March 2010. [Google Scholar]
  28. Hansen, E.H.; Miró, M. Flow Injection Analysis in Industrial Biotechnology. Encyclopedia of Industrial Biotechnology; John Wiley & Sons: Hoboken, NJ, USA, 2009. [Google Scholar]
  29. Gamella, M.; Campuzano, S.; Manso, J.; González de Rivera, G.; López-Colino, F.; Reviejo, A.J.; Pingarrón, J.M. A novel non-invasive electrochemical biosensing device for in situ determination of the alcohol content in blood by monitoring ethanol in sweat. Anal. Chim. Acta 2014, 806, 1–7. [Google Scholar] [CrossRef] [PubMed]
Figure 1. Schematic diagram displaying the enzyme and electrode reactions involved in the commercial ethanol biosensor. Inset: real picture of the biosensor.
Beverages 03 00022 g001
Figure 2. Amperometric responses recorded for 250 µL-aliquot additions of 0.002% (v/v) ethanol (1), 3 g·L−1 d-glucose (2), 3 g·L−1 d-fructose (3), 3 g·L−1 l-arabinose (4), 3 g·L−1 d-galactose (5), 3 g·L−1 maltose (6), 3 g·L−1 glycerol (7), 3 g·L−1 citric acid (8), 3 g·L−1 acetic acid (9), 3 g·L−1 succinic acid (10), 56 mg·L−1 l-malic acid (11), 58 mg·L−1 l-lactic acid (12), and 34 mg·L−1 ascorbic acid (13) standard solutions. Supporting electrolyte: 20 mL of 0.05 M phosphate buffer, pH 7.4. Eapp = 0.0 V vs. Ag/AgCl.
Beverages 03 00022 g002
Figure 3. Pictures of the ethanol automated bioanalyzer prototype: (a) top view, (b) de-bubbler unit, (c) cylindrical methacrylate electrochemical flow cell, (d) methacrylate plate with electrovalves for managing the hydrofluidics, (e) electrovalve, (f) gas diffusion unit, and (g) miniaturized peristaltic pump. Schemes of the flow system for on-line analysis of ethanol: (h) bioanalyzer working as CFA and (i) FIA systems, highlighting the active () and inactive () channels configured for the flow systems. (j) Scheme of the FIA system for off-line analysis of ethanol.
Beverages 03 00022 g003
Figure 4. Calibration plots for ethanol constructed with the automated ethanol bioanalyzer working as a continuous flow analysis (CFA) system using samples units of (a) 20 and (b) 14 mm of surface contact diameter. Successive amperometric responses obtained for ethanol standard solutions with the automated bioanalyzer in the CFA mode: (c) 20 mm sampling unit, ethanol 0.04% (v/v) and (d) 14 mm sampling unit, ethanol 0.8% (v/v). Carrier solution: 0.05 M phosphate buffer, pH 7.4. Q = 4.0 mL·min−1. Eapp = 0.0 V vs. Ag/AgCl.
Beverages 03 00022 g004
Figure 5. Calibration plots constructed for ethanol with the automated ethanol bioanalyzer working in the FIA on-line mode. Sampling unit equipped with one Teflon (PTFE) membrane of 0.45 µm pore diameter with (a) 20 mm and (b) 14 mm surface contact diameter. Successive amperometric responses recorded for ethanol standard solutions: 20 mm sampling unit, (c) ethanol 0.04% (v/v); (d) 14 mm sampling unit, ethanol 0.8% (v/v). Carrier solution: 0.05 M phosphate buffer, pH 7.4. Vi = 500 µL. Q = 4.0 mL·min−1. Eapp = 0.0 V vs. Ag/AgCl. Error bars estimated as triple of the standard deviation (n = 3).
Beverages 03 00022 g005
Table 1. Flow analysis methods reported for the determination of ethanol in beer.
Flow TechniqueAutomaticDetectionFlow OperationSample PretreatmentLR, % (v/v)LOD, % (v/v)RSD, %Samples/hReference
FIANoFTIR spectrometryLiquid-liquid extractionNone0–150.031.325[10]
CFANoNIR spectroscopyNoneStirring, filtration[11]
CFANoMIR/NIR spectroscopyNoneStirring, filtration[12]
CFAYesFTIR spectrometryNoneFiltration, ultrasounds0–450.10.4–47[13]
CFANoVIS reflectance spectroscopy (optical sensor)GDNeutralization with alkaline solution0 - 200.1530[14]
FIANoVIS spectrophotometryPhotochemical reaction3 × 10−5–6 × 10−31 × 10−51.560[15]
FIANoVIS spectrophotometryGD with membraneNone1.0–300.680.5518[16]
GD without membraneNone0.5–300.270.5016
FIANoColorimetry (optical sensor)GD1:20 dilution0.1–100.030.3–1.220[17]
FIAYesNMR spectroscopyNoneFiltration, ultrasounds, 9:10 dilution5[18]
FIAYesMass spectrometryFiltration6 × 10−41.8–9.860[19]
CFAYesGC-FIDFiltration, dilution with a solution of reagentsNone4[20]
SIA-LOVNoUV spectrophotometry (enzyme ADH immobilized)None1:400 dilution0–0.043 × 10−3127[21]
CFANoAmperometry (enzyme AOD immobilized)Degassing, GDNone0–0.6 (550 µm membrane)
0–7.0 (500 µm membrane)
1 × 10⁻⁴ (1500 µm membrane)230[22]
FIANoAmperometry (AOD/HRP/Fc biosensor)None1.2 × 10−4–1.5 × 10−25.8 × 10−55.624[23]
SIAYesAmperometry (enzyme AOD immobilized)Filtration, dialysisNone0.02–3.792.250[24]
FIANoAmperometry (AOD/HRP/Fc biosensor)None1:1000 dilution (beers with alcohol)
56:100 (beers without alcohol)
6.0 × 10⁻⁴–2.4 × 10−26.0 × 10−42.6–6.050[25]
FIANoAmperometry (Gluconobacter oxydans microbial biosensor)NoneCentrifugation, dilution to 6 × 10⁻³% (v/v)6 × 10−5–9 × 10−32 × 10−520[26]
CFA/FIAYes (automated)Amperometry (AOD/HRP/Fc biosensor)Degassing, GD (if on-line analysis)None (if on-line analysis)CFA:20 mm GD unit: (6.00–100) × 10−31.8 × 10−34.9CFA: continuous samplingThis work
14 mm GD unit: (7.8–10) × 10−22.3 × 10−33.4
GD (if off-line analysis)Degassing (if off-line analysis)FIA:20 mm GD unit: (2.600–1250) × 10−37.9 × 10−42.5FIA: 10
14 mm GD unit: (3.00–125) × 10−28.9 × 10−33.1
Abbreviations: ADH: alcohol dehydrogenase; AOD: alcohol oxidase; CFA: continuous flow analysis; Fc: ferrocene; FIA: flow injection analysis; FID: flame ionization detector; FTIR: Fourier transform infrared spectroscopy; GC: gas chromatography; GD: gas diffusion; HRP: peroxidase; IR: infrared; LOD: limit of detection; LOV: lab-on-valve; LR: linear range; MIR: mid-infrared; NIR: near infrared; NMR: nuclear magnetic resonance; RSD: relative standard deviation; SIA: sequential injection analysis; UV: ultraviolet; VIS: visible.
Table 2. Figures of merit obtained for the automated ethanol bioanalyzer working in CFA mode.
ModeSamplerSlope, nA% (v/v)−1Intercept, nArLOD, % (v/v)LOQ, % (v/v)
CFA20 mm(6.98 ± 0.06) × 102−0.4 ± 0.40.99991.8 × 10−36.0 × 10⁻³
14 mm(3.00 ± 0.07) × 1020 ± 60.99882.3 × 10−27.8 × 10⁻²
Table 3. Determination of ethanol in low-alcohol beers with the automated bioanalyzer working in CFA mode. The results are compared with those obtained by a validated method developed by InBea Biosensores S.L. using amperometry in stirred solutions.
Beer TypeSample[EtOH], % (v/v)texpttab
BioanalyzerInBea’s Method
≤0.04%1(0.0070 ± 0.0009)
RSDn=3 = 5.0%
(0.0069 ± 0.0008)
RSDn=3 = 4.9%
1.9992.447
2(0.011 ± 0.002)
RSDn=3 = 6.7%
(0.0093 ± 0.0008)
RSDn=3 = 3.6%
3(0.030 ± 0.001)
RSDn=3 = 2.0%
(0.027 ± 0.001)
RSDn=3 = 2.0%
4(0.015 ± 0.003)
RSDn=3 = 9.0%
(0.0135 ± 0.0003)
RSDn=3 = 0.8%
<1.0%1(0.82 ± 0.02)
RSDn=3 = 0.9%
(0.80 ± 0.07)
RSDn=3 = 3.7%
2(0.96 ± 0.02)
RSDn=3 = 0.9%
(0.91 ± 0.08)
RSDn=3 = 3.3%
3(0.89 ± 0.02)
RSDn=3 = 0.7%
(0.87 ± 0.05)
RSDn=3 = 2.2%
Table 4. Figures of merit calculated for the automated ethanol bioanalyzer working in the flow injection analysis (FIA) on-line analysis mode.
ModeSamplerSlope, nA% (v/v)−1Intercept, nArLOD, % (v/v)LOQ, % (v/v)
FIA20 mm(2.54 ± 0.06) × 103−3 ± 40.99877.9 × 10−42.6 × 10⁻³
14 mm(7.0 ± 0.2) × 102−26 ± 280.99828.9 × 10−33.0 × 10⁻²
Table 5. Determination of ethanol in low-alcohol beers with the automated bioanalyzer working in the FIA on-line analysis mode. Comparison of the results with those provided by the method validated by InBea Biosensores S.L. using the same biosensor as the amperometric detector in stirred solutions.
Beer TypeSample[EtOH], % (v/v)texpttab
BioanalyzerStirred Solutions
≤0.04%1(0.0109 ± 0.0006)
RSDn=22 = 12.5%
(0.011 ± 0.001)
RSDn=3 = 5.3%
0.2252.447
2(0.0133 ± 0.0006)
RSDn=45 = 16.1%
(0.0135 ± 0.0007)
RSDn=5 = 4.0%
0.5002.064
3(0.013 ± 0.001)
RSDn=19 = 16.3%
(0.0128 ± 0.0005)
RSDn=3 = 3.2%
0.3852.074
4(0.0122 ± 0.0009)
RSDn=21 = 16.8%
(0.0122 ± 0.0003)
RSDn=3 = 1.0%
0.0012.080
5(0.0038 ± 0.0004)
RSDn=38 = 19.1%
(0.0036 ± 0.0008)
RSDn=3 = 9.1%
0.8982.776
6(0.0262 ± 0.0006)
RSDn=49 = 7.4%
(0.025 ± 0.002)
RSDn=5 = 6.3%
1.5852.571
<1.0%1(0.88 ± 0.05)
RSDn=18 = 11.8%
(0.92 ± 0.03)
RSDn=5 = 2.7%
1.4882.080
2(0.93 ± 0.03)
RSDn=72 = 13.0%
(0.91 ± 0.04)
RSDn=5 = 3.9%
0.9382.160
Table 6. Determination of ethanol in non-alcoholic beers with the automated bioanalyzer working in the FIA off-line analysis mode and the official method using gas chromatography.
Sample[EtOH], % (v/v) Gas ChromatographySample Temperature[EtOH], % (v/v) Automated Bioanalyzertexp attab atexp bttab b
10.005RT(0.005 ± 0.001)
RSDn=4 = 12.3%
0.4723.1821.2722.447
0 °C(0.006 ± 0.001)
RSDn=4 = 13.0%
2.067
20.004RT(0.0038 ± 0.0008)
RSDn=4 = 13.5%
0.5770.590
0 °C(0.0037 ± 0.0004)
RSDn=4 = 7.8%
2.263
a texp for the statistical comparison between the mean obtained with the automated bioanalyzer and the concentration value obtained by gas chromatography; b texp for the statistical comparison between the mean obtained with the automated bioanalyzer in the analysis of samples at different temperatures.

