Application of a Pivot Profile Variant Using CATA Questions in the Development of a Whey-Based Fermented Beverage

Área Evaluación Sensorial, Departamento de Ciencia y Tecnología de Alimentos, Facultad de Química, Universidad de la República, General Flores 2124, Montevideo CP 11800, Uruguay
*
Author to whom correspondence should be addressed.
Beverages 2018, 4(1), 11; https://0-doi-org.brum.beds.ac.uk/10.3390/beverages4010011
Submission received: 15 November 2017
/
Revised: 20 December 2017
/
Accepted: 9 January 2018
/
Published: 1 February 2018
(This article belongs to the Special Issue Beverage Sensory Modification)
Abstract
:During the development of a food product, the application of rapid descriptive sensory methodologies is very useful to determine the influence of different variables on the sensory characteristics of the product under development. The Pivot profile (PP) and a variant of the technique that includes check-all-that-apply questions (PP + CATA) were used for the development of a milk drink fermented from demineralised sweet whey. Starting from a base formula of partially demineralised sweet whey and gelatin, nine samples were elaborated, to which various concentrations of commercial sucrose, modified cassava starch, and whole milk powder were added. Differences in sucrose content affected the sample texture and flavour and the modified starch was able to decrease the fluidity and increase the texture of creaminess and firmness, of the samples. The two applied sensory methodologies achieved good discrimination between the samples and very similar results, although the data analysis was clearly simplified in relation to the difficulty and time consumed in the PP + CATA variant.
1. Introduction
One of the main problems in environmental management of the small and medium dairy industry is the destination of by-products generated in the industrial activities, such as milk whey. Thus, in recent decades, there has been an increase in interest in the use of this by-product [1]. The high content in lactose makes milk whey a raw material (from the industrial viewpoint) with significant potential for the development of fermented products [2]. This application has the advantage that the production process is very similar to the production of, for example, a conventional yoghurt, so the start-up and production cost is not high for a dairy company. The use of lactic acid bacteria in the fermentation of whey is associated with intense bacterial metabolic activity with respect to the carbohydrates, lipids, proteins, and allergenic peptides present in it. Thus, bacteria promote digestibility and preservation. In addition, their action increases the content of lactic acid and other metabolites, such as aromatic compounds that contribute to the flavour, texture, and sweetness of the final product [3]. The sweet whey in its pure form presents a low sensory acceptability, which is due to the unpleasant flavour caused by the high content of mineral salts. Although the fermentation process considerably improves the sensory profile and acceptability of the product, it is not sufficient to achieve acceptability values comparable to those obtained with milk drinks made with milk [4]. In this sense, it is also interesting to use the previously demineralised sweet whey as an input for fermentation, to obtain a product with greater acceptability. To solve this drawback, some authors have produced fermented beverages from sweet whey with the addition of milk at different levels, significantly improving its aroma and flavour characteristics, thus causing an increase in the acceptability of the products [5,6,7,8]. In these articles, fermented beverages were made with a different degree of milk substitution with sweet whey. The main limitation found was that, sensorially, the substitution of milk with sweet whey is only viable up to an average of 50% since the acceptability of the product falls afterwards because the texture of the product is not adequate, and unwanted flavour is detected. Regarding the nutritional aspects, fermented milk is an important source of nutrients and provides beneficial health effects, such as stimulation of the immune system, cholesterol reduction, appetite regulation, and a decreased risk of some types of cancer [9,10]. In addition, the organic acids generated during the fermentation process, such as lactic acid, help the absorption of iron from other foods [11].
The sensory profile in the development of a food product is traditionally obtained using a descriptive analysis through a panel of trained assessors [12]. This methodology provides very accurate and reproducible results; however, it has the disadvantage of consuming significant amounts of time and is relatively costly [13]. In this context, several rapid sensory characterisation methodologies have been developed in recent years. These have the advantage of reducing the time needed to obtain results and lower associated costs, in addition to being able to be performed by individuals without prior training [14]. Pivot profile (PP) is a rapid descriptive methodology developed by Thuillier [15] to obtain descriptive information based on the free description technique and is very commonly used in that area. The methodology has been used in the sensory characterisation of champagnes [16] and dairy products, such as chocolate ice cream [17] and Greek yoghurts [18]. Although this methodology allows a very good description of the products evaluated, the data analysis is often very difficult and slow because all the text generated by the assessors must be analysed and interpreted [19]. Check-all-that-apply (CATA) questions are a quick and practical descriptive method to obtain information about how the characteristics of the products are perceived. These questions consist of a list from which individuals choose words or phrases that they consider appropriate for the product they are evaluating [20]. This methodology has been widely used in sensory analysis due to its simplicity and because it is easy, intuitive, and requires less cognitive effort from the participants compared to other techniques [14,21].
In this context, the objective of this work was to compare the results of the PP technique applications and a variant of the PP technique using CATA questions (PP + CATA) with panels of semi-trained assessors in the development of a fermented milk drink from demineralised sweet whey. In this way, we sought to automize the data analysis and avoid the generated text analysis stage, since the terms used to describe the samples in this variant of the technique would be selected in advance and all the assessors would use the same vocabulary.
2. Materials and Methods
2.1. Formulations
For the processing of the samples as a base formula, the following were used: 8% partially demineralised (40% mineral content reduced) and dehydrated sweet whey (Conaprole, Montevideo, Uruguay) and 0.3% gelatin (Boom 220, Bloom, Leiner Davis, NY, USA). Nine samples were developed varying the concentrations of commercial sucrose, modified cassava starch (SuperCorp 75, Horizonte Amidos, PR, Brazil), and whole milk powder (Conaprole, Uruguay), following a factorial design of three variables and two levels (Table 1). In each formulation, drinking water treated through reverse osmosis was used to make up the solutions to 100%. The concentration ranges were selected based on preliminary trials. Sucrose concentrations were chosen to reflect those usually found in commercial fermented beverages, and reported articles in which milk was added to the whey as a method for increasing the acceptability of fermented whey products [8,22,23,24]. In this way, samples with different sensory characteristics were obtained, both in texture and flavour.
In the present work, sample P was randomly selected (Table 1) as the Pivot. According to [16], the selection of the Pivot sample generates a minimal effect on the results obtained using this methodology and therefore is not a key aspect for the good performance of the method. This criterion was used in a sensory characterisation study of ice cream, in which the Pivot sample was selected at random [17].
2.2. Elaboration Process
The water required for each formulation was heated at 50 °C and then mixed with the solid ingredients for 5 min at 100 rpm. Next, the heat treatment was carried out, bringing the mixture to a temperature of 85 °C, which was maintained for 5 min, stirring at 200 rpm. The mixture was then placed in 1000 mL Durham glass bottles with sterile lids and cooled in a water bath until reaching a temperature of 42 °C. Then, the mixture was inoculated with a lactic ferment dispersion (Yo-Mix 205 LYO 250 DCU, Danisco, France) to obtain an initial concentration in the mixture of 0.2 direct culture units/L. It was gently shaken manually with care so as not to add air. Fermentation was carried out in a temperature controlled oven at 42 ± 1° C. The process was monitored by means of pH and ended when a value of 4.5 was reached. The fermentation time depended on the corresponding formula and was approximately 4 to 5 h. Then, the mixture was cooled to 25 °C in a water bath. Once that temperature was reached, each sample was agitated at 100 rpm for 3 min. Subsequently, it was stored at 4 °C until its evaluation, which was carried out 24 h after. Both the heat treatment and the agitation of the mixture was performed using a Taurus My cook kitchen robot (Taurus S.A., Spain).
2.3. Panels of Semi-Trained Assessors
Twenty individuals were selected who had previous experience in participation as sensory assessors of panels of descriptive analysis of different foods. These individuals were divided into two groups according to the previous experience of each individual in sensory evaluation. This was done so that there would be no difference in their sensory evaluation experience between both groups. Both panels evaluated the samples, but followed two different methodologies. One panel evaluated the samples following the PP methodology, while the other used PP + CATA. All evaluations were conducted in duplicate in two different sessions in a standardised sensory evaluation room according to [25]. RedJade software (RedJade, Redwood Shores, CA, USA) was used as an interface for data collection.
2.4. Pivot Profile
Each panellist received samples in pairs (one identified as the Pivot and another coded with three-digit numbers in alternate presentation order). For each pair, they were asked to write down (in the assessor´s own words) the sensory attributes that they thought the sample had in greater and lesser intensity than the pivot sample, focusing on the texture and flavour attributes. Between the evaluation of samples, each panellist had to drink a little water and wait 30 s before continuing with the next one.
2.5. Pivot Profile + CATA
The form of evaluation following this variant of the methodology was similar to that of PP except that the panellists did not have to write the attributes. Each panellist received two lists of 23 sensory attributes of flavour and texture (Table 2). In the first list, the assessor had to select the attributes they thought the sample had in greater intensity than the pivot. Then, in the second list, the panellist had to select the attributes they thought the sample had in lesser intensity than the pivot.
The attributes were selected based on a literature review on possible sensory descriptors present in fermented milk drinks and yogurts, both traditional and with added dairy whey [22,23,26]. To evaluate the reproducibility of both panels, the Pivot sample was used as a blind sample and is observed in the results as P’ [27].
2.6. Data Analysis
2.6.1. Pivot Profile
The data were analysed according to [16]; all the attributes generated were grouped semantically into two categories: flavour and texture. Then, words with the same meaning (synonyms) were grouped within the same attribute, for example: astringent, rough, and shrivelled, using a dictionary to identify them. Next, a data table was created as follows. For each sensory attribute defined in the previous stage, we quantified the number of times that the attribute was mentioned as being more intense than the pivot (positive frequency) and the times it was mentioned as less intense than the pivot (negative frequency). The negative frequency was subtracted from the positive frequency, resulting in a data table containing positive and negative values. To obtain a contingency table containing only positive values, the lowest value of the table was added to each value of the table. Thus, the lowest value of the table was transformed into absolute zero and all data in the table were converted to a positive value or zero. From this table, a correspondence analysis (CA) was performed.
2.6.2. Pivot Profile + CATA Data Analysis
In this case, it was not necessary to perform the grouping and classification of attributes because they were already established when using the CATA questions. The frequency of selection of each term of the CATA question used to describe the sample was calculated as more intense than the pivot (positive frequency) and as less intense than the pivot (negative frequency). The negative frequency was subtracted from the positive frequency and the table was transformed so that it only contains values greater than or equal to zero. Then, from the obtained table, a CA was conducted.
2.6.3. Comparison of Obtained Sensory Maps
To compare the results obtained using the PP methodology and its variant using CATA questions, the correlation coefficient Rv between the coordinate matrices of the samples was determined in the first two dimensions of the respective correspondence analysis [28]. In addition, the significance of the Rv coefficient was determined using a permutation test [29]. To visually compare the similarity between the sensory configurations of the samples obtained through both methodologies, a multi factorial analysis (MFA) was performed on the coordinates of the samples in the first two dimensions of the corresponding CA. All statistical analyses were performed using XL-Stat 2017 software (Addinsoft, Paris, France).
3. Results
3.1. Pivot Profile
Figure 1 shows the representation of the samples and attributes generated by the assessors in the description of the samples using the PP technique in the first two factors of the CA. In this case, the first two factors explained almost 91% of the variability of the experimental data obtained.
The attributes that explain the flavour differences found in the samples are the sourness and sweetness. As for the texture, they differed due to their creaminess, firmness, and fluidity.
The first factor, which explained 48.8% of the variability, was associated positively with the fluidity or liquid texture of the samples and negatively regarding creaminess and firmness. These results show coherence in the sensory descriptions obtained, since they are opposing characteristics. On the other hand, the second factor was associated positively with sourness, while negatively with the sweetness of the samples, explaining a variability percentage of 42.1%. As observed in the first factor, the results show relative coherence. As shown in Figure 1, the other attributes are located very close to the origin of the graph coordinates, so these attributes did not serve to discriminate the samples.
Evident differences can be observed in the evaluated samples, since they are dispersed in the four quadrants of the sensory map obtained from the CA (Figure 1). Samples A and B were the most liquid, least creamy, and least firm. In turn, they differed in terms of flavour, with being A the same as C and with E being more sour than B. In addition, sample B was sweeter than the others. These results are consistent with the formulation of the samples shown in Table 1. Samples A and B were prepared with a low level of milk (2.5%) and without modified starch; the only difference was in the sucrose content, which was higher in sample B. Regarding samples C and D, both were characterised as fluid but not as much as for samples A and B. Their difference was also given by the sweetness and sourness, which is consistent because these samples differed in their formulation only in their sucrose content. The difference in the sucrose content used in this study influences the sensory profile of the product. Moreover, the modified starch used reduces fluidity and increases the feeling of creaminess and firmness of the samples. Regarding the texture of samples G and H, these were those of a greater creaminess and firmness and less fluidity. This shows that the samples, when elaborated with a high level of milk (5%) and modified starch, have those characteristics. In turn, sample H was perceived as having a greater sweetness intensity than G, which is consistent with the sucrose content of both samples.
In this case, sample P’ is almost in the same position as the Pivot sample (P). The panel seemingly behaved in a reproducible way.
3.2. Pivot Profile + CATA
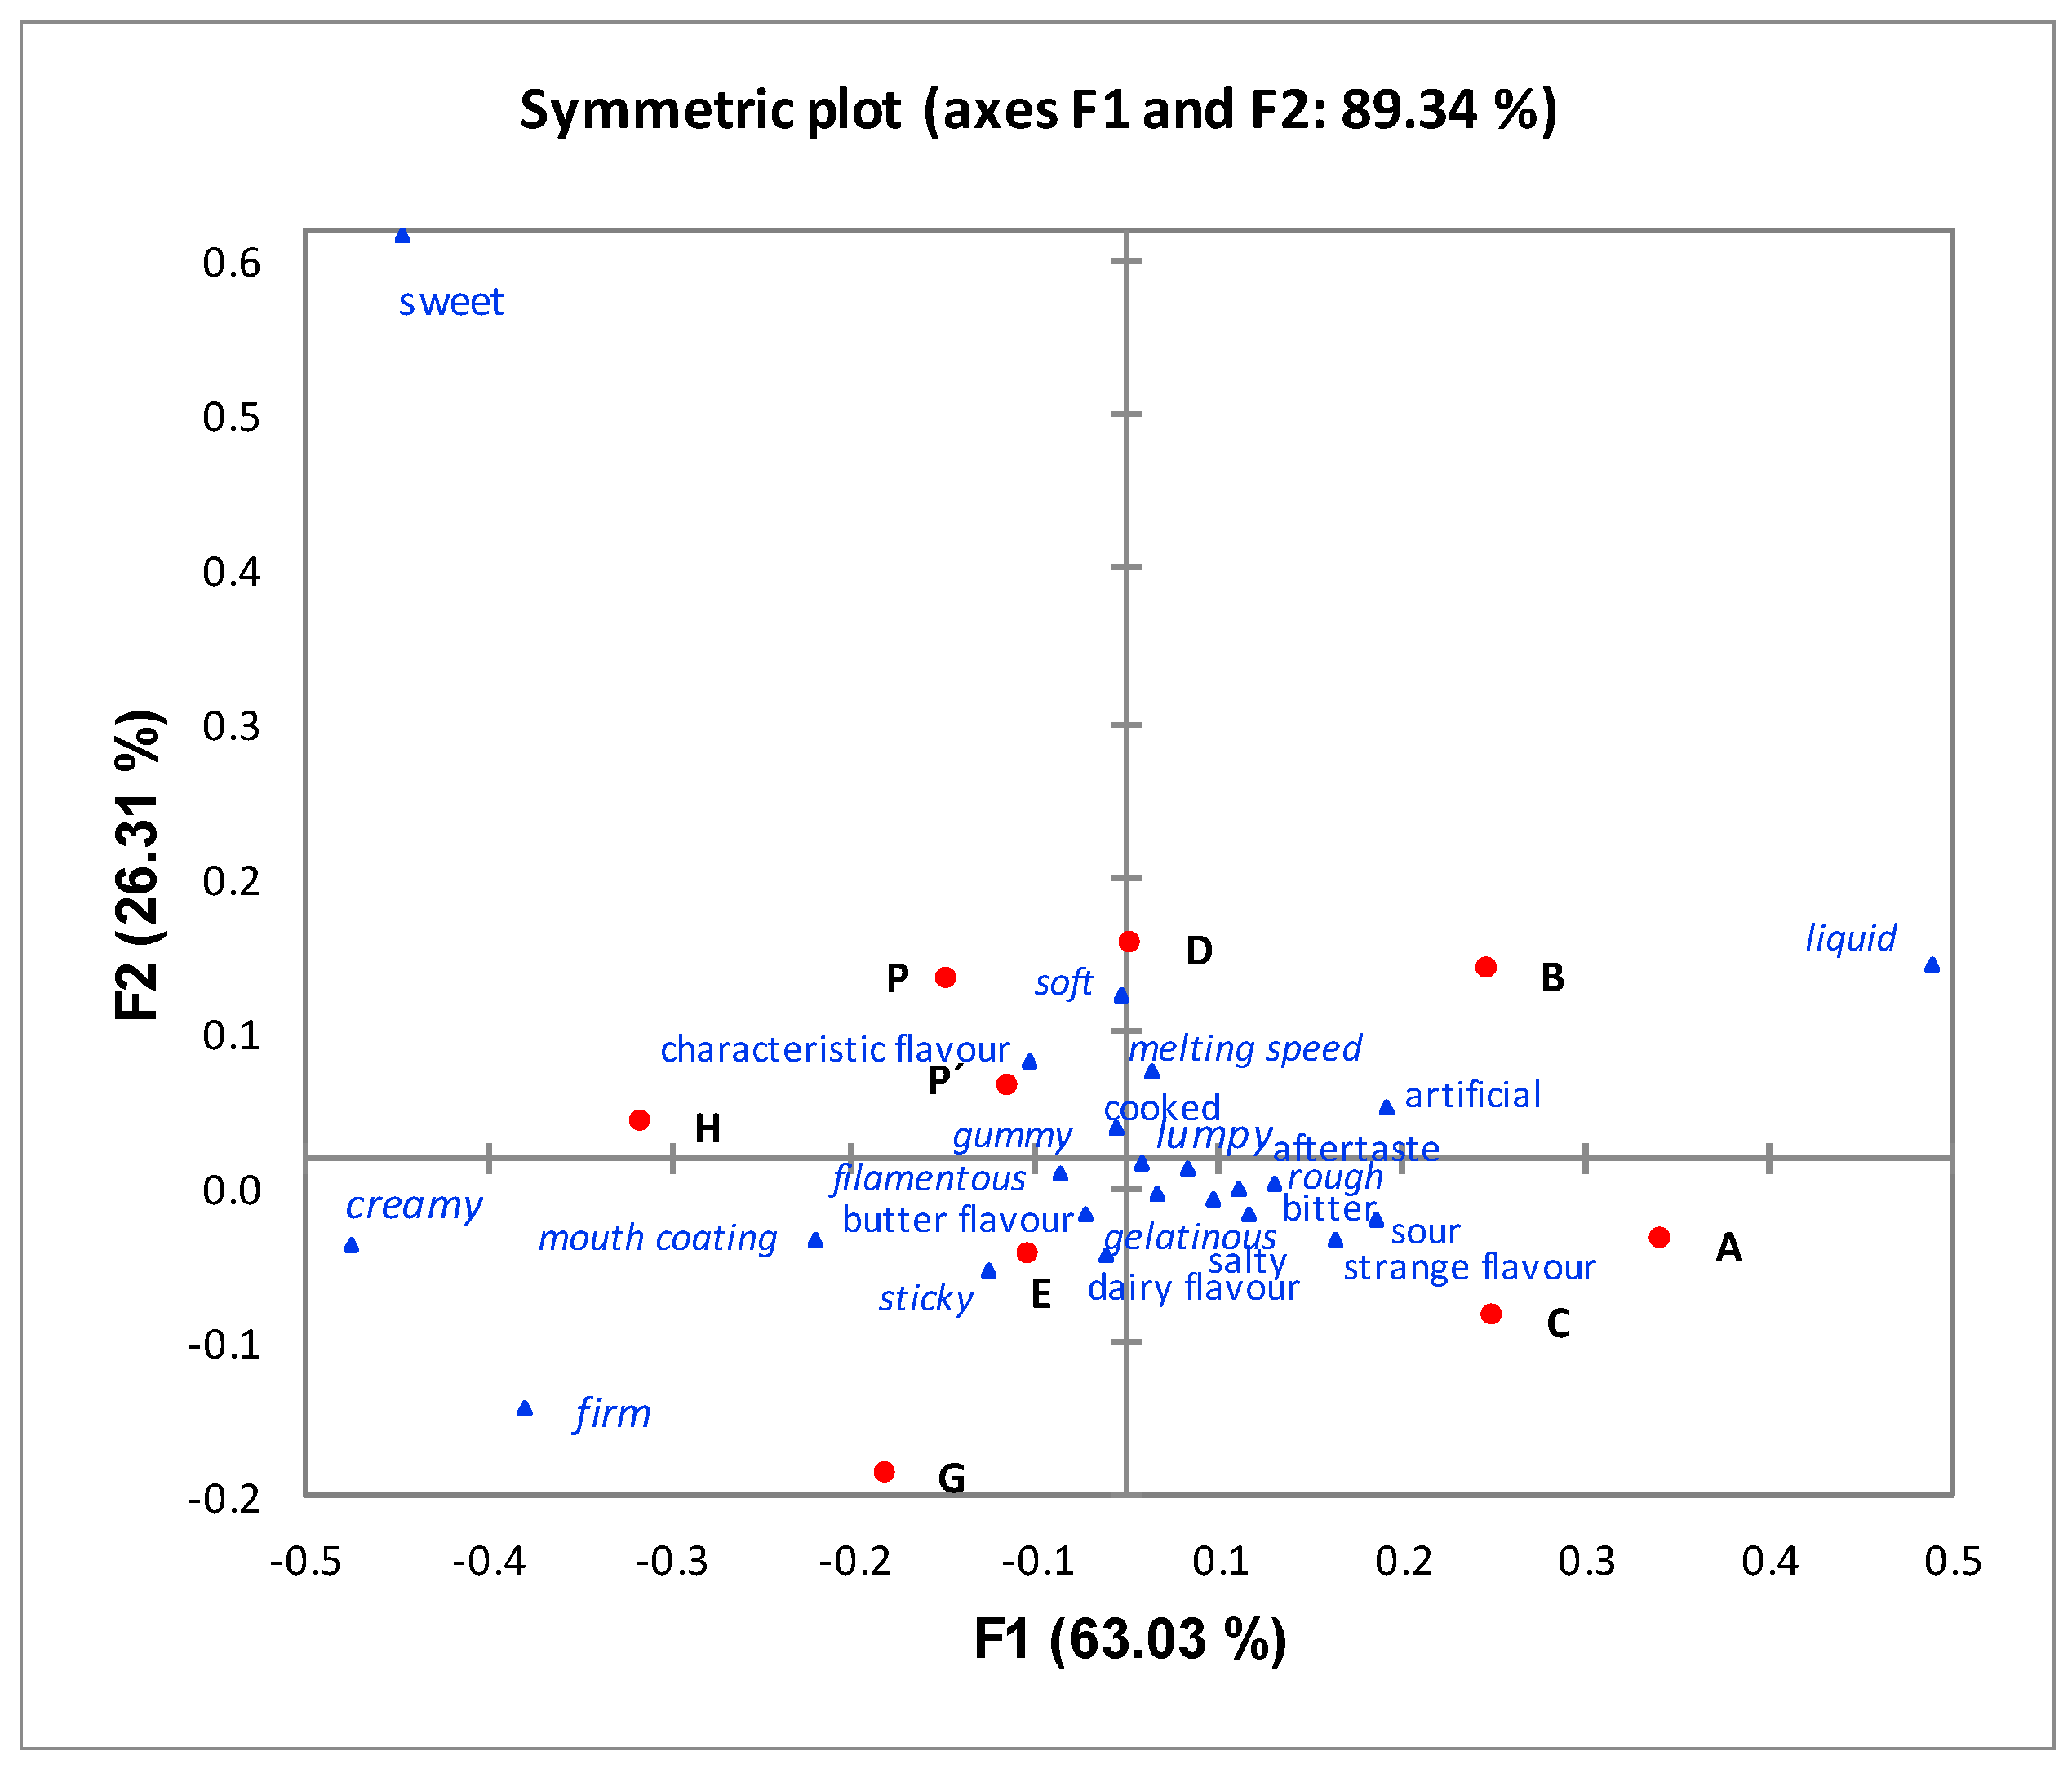
The results obtained using the PP + CATA methodology are illustrated in Figure 2. The first two factors explained 89.4% of the variability of the data. The first factor explained 63% of the variability in this case, while the second factor explained 26.3% of the variability.
The attributes that most differentiated the samples in this case were liquid, creamy, firm, and sweet. The first factor was associated positively with the liquid texture attribute and negatively with the creamy and firm attributes, while the second factor was associated positively with sweetness. With respect to the sensory description obtained from the samples, the methodology achieved good discrimination between the samples because they are distributed in the four quadrants of the graph, and their sensory characterization is very similar to that obtained using PP. On the other hand, the positions of samples P and P’ are very close in the map; therefore, the panel behaved in a reproducible way when using this sensory methodology.
3.3. Comparison of Obtained Sensory Maps
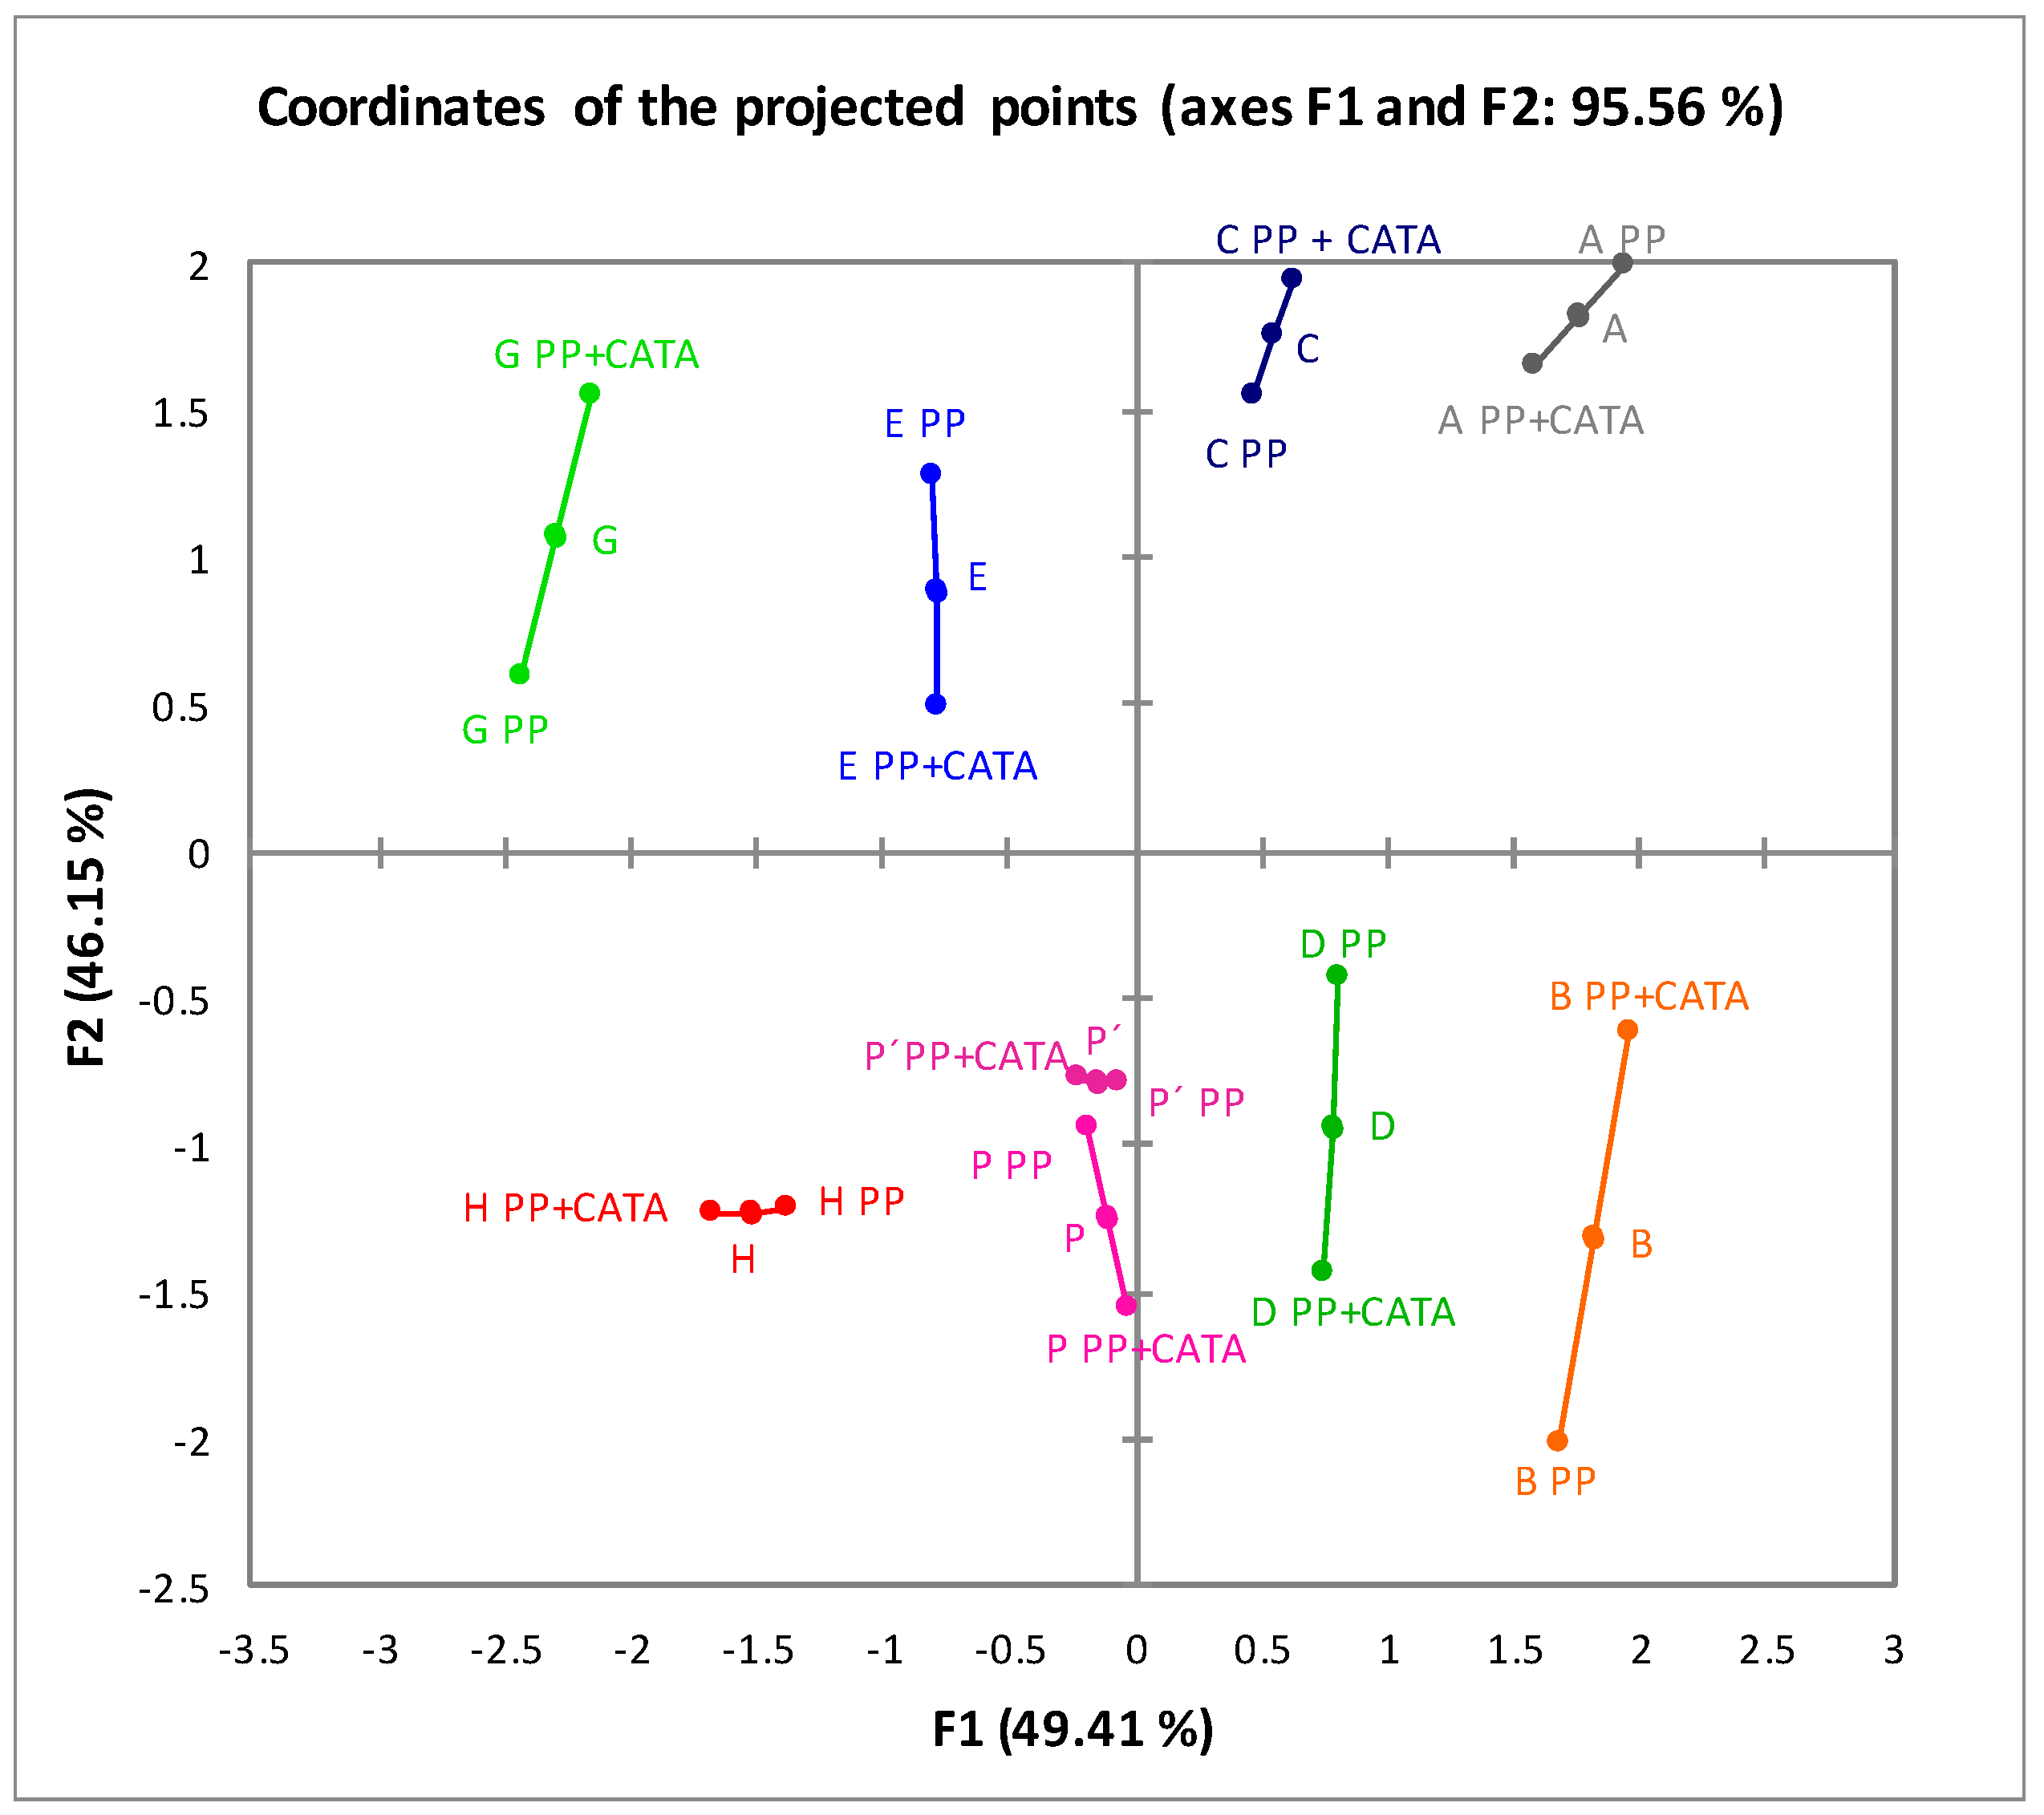
The sensory configurations obtained in both sessions are shown in Figure 3. They illustrate that the sensory spaces established through both methodologies are very similar because the samples in both methodologies are located near one another in the plan. On the other hand, a highly significant (p = 0.001) value was obtained in the Rv coefficient (0.89) between both configurations.
4. Discussion
The results obtained through both methodologies were very good in terms of the power of discrimination of the samples. With the PP methodology, it was possible to explain 90.9% of the variability obtained, while this figure was 89.4% when using PP + CATA. At the same time, the attributes by which the samples were discriminated in both methodologies were practically the same. For PP, these were sweetness, sourness, fluidity, creaminess, and consistency. For PP + CATA, the samples were discriminated by these same attributes except for sourness. In this case, the sourness was not very well explained by any of the factors of the CA.
However, in both methodologies, the samples were perceived in a similar way from the sensory point of view and the configurations obtained in both CAs were also similar, which is evident, considering the obtained Rv value herein, 0.89. The Rv coefficient is used as a way of comparing two different factorial configurations. When the value is closer to 1, the correlation these configurations will have is higher, and the closer to 0, the lower it will be. This coefficient depends on the relative position of the points in the configuration and is independent of the rotation and translation [28]. The minimum value to assert that two configurations are relatively similar that has been used in different articles when performing comparisons is between 0.65 and 0.90 and has been widely used in the comparison of data obtained with consumers through PP, CATA questions and Napping [18], PP and free comments [17], Napping in different conditions [30], questions [23,31], different instances of word associations [32], and in performance evaluations of panels of trained sensory assessors [33].
One of the advantages of the use of open response methodologies, such as PP, is the freedom in the language used to describe the samples by the evaluators and the richness in their variety [34]. In this sense, this methodology has an advantage over the variant used in this study using CATA questions (PP + CATA) because, in the latter, it is very important to correctly select the attributes, which is something typical of the CATA question methodology. In contrast, PP has a disadvantage in that the analysis of the generated text to describe the sample stage can be complex and time-consuming, and it has some degree of subjectivity due to researchers’ interpretation and categorisation of terms written by assessors [32]. This problem could be solved using the proposed variant (PP + CATA) because the data analysis is clearly simplified, as it is not necessary to perform any text analysis due to the use of the previously predefined language.
The results obtained in this study are similar in terms of the sensory description of the samples and the factorial spaces obtained using semi-trained judges; thus, the proposed PP variant is likely to be useful for the evaluation of dairy products, such as those used in this study.
5. Conclusions
The application of a rapid descriptive sensory methodology, such as PP, enables the evaluation of the influence of different ingredients and concentrations of them in the sensory characteristics of the samples. With the variant used, which combines PP with CATA questions, the results were very similar to those obtained when using PP, but the data analysis was clearly simplified by eliminating the text analysis. Notwithstanding, future studies that compare the results obtained when using PP and the proposed variant (PP + CATA) in other products that compare the results of both techniques obtained with semi-trained assessors and with consumers should be conducted.
Author Contributions
M.M. and A.G. conceived and designed the experiments; M.M. and N.H. performed the experiments; M.M. and N.H. analyzed the data; M.M. and A.G. wrote the paper.
Conflicts of Interest
The authors declare no conflict of interest.
References
- Ganju, S.; Gogate, P.R. A review on approaches for efficient recovery of whey proteins from dairy industry effluents. J. Food Eng. 2017, 215, 84–96. [Google Scholar] [CrossRef]
- Sanmartín, B.; Díaz, O.; Rodríguez-Turienzo, L.; Cobos, A. Composition of caprine whey protein concentrates produced by membrane technology after clarification of cheese whey. Small Rumin. Res. 2012, 105, 186–192. [Google Scholar] [CrossRef]
- Mauriello, G.; Moio, L.; Moschetti, G.; Piombino, P.; Addeo, F.; Coppola, S. Characterization of lactic acid bacteria strains on the basis of neutral volatile compounds produced in whey. J. Appl. Microbiol. 2001, 90, 928–942. [Google Scholar] [CrossRef] [PubMed]
- Soares, D.S.; Fai, A.E.; Oliveira, A.M.; Pires, E.M.; Stamford, T.L. Aproveitamento de soro de queijo para produção de iogurte probiótico. Arq. Bras. Med. Vet. Zootec. 2011, 63, 996–1002. [Google Scholar] [CrossRef]
- Caldeira, L.A.; Ferrão, S.P.B.; Fernandes, S.A.D.A.; Magnavita, A.P.A.; Santos, T.D.R. Desenvolvimento de bebida láctea sabor morango utilizando diferentes níveis de iogurte e soro lácteo obtidos com leite de búfala. Ciência Rural 2010, 40, 2193–2198. [Google Scholar] [CrossRef]
- Moreira, R.W.M.; Madrona, G.S.; Branco, I.G.; Bergamasco, R.; Pereira, N.C. Avaliação sensorial e reológica de uma bebida achocolatada elaborada a partir de extrato hidrossolúvel de soja e soro de queijo. Acta Sci. Technol. 2010, 32, 435–438. [Google Scholar]
- Oliveira, G.I.C.; Resende, L.M.; Soares, E.M.; Matos, S.P. Alimentação e suplementação de ferro em uma população de lactentes carentes. Pediatria (Säo Paulo) 2006, 28, 18–25. [Google Scholar]
- Rakin, M.; Bulatovic, M.; Zaric, D.; Stamenkovic-Djokovic, M.; Krunic, T.; Boric, M.; Vukasinovic-Sekulic, M. Quality of fermented whey beverage with milk. Hem. Ind. 2016, 70, 91–98. [Google Scholar] [CrossRef]
- Haug, A.; Høstmark, A.T.; Harstad, O.M. Bovine milk in human nutrition—A review. Lipids Health Dis. 2007, 6, 25. [Google Scholar] [CrossRef] [PubMed] [Green Version]
- Wolf, I.V.; Vénica, C.I.; Perotti, M.C. Effect of reduction of lactose in yogurts by addition of β-galactosidase enzyme on volatile compound profile and quality parameters. Int. J. Food Sci. Technol. 2015, 50, 1076–1082. [Google Scholar] [CrossRef]
- Branca, F.; Rossi, L. The role of fermented milk in complementary feeding of young children: Lessons from transition countries. Eur. J. Clin. Nutr. 2002, 56, S16–S20. [Google Scholar] [CrossRef] [PubMed]
- Delarue, J.J.; Lawlor, B.; Rogeaux, M. Rapid Sensory Profiling Techniques and Related Methods, Applications in New Product Development and Consumer Research; Woodhead Publishing: Sawston, UK, 2015; ISBN 9781845694760. [Google Scholar]
- Varela, P.; Ares, G. Novel Techniques in Sensory Characterization and Consumer Profiling; CRC Press: Boca Raton, FL, USA, 2014; ISBN 978-1-4665-6630-9. [Google Scholar]
- Varela, P.; Ares, G. Sensory profiling, the blurred line between sensory and consumer science. A review of novel methods for product characterization. Food Res. Int. 2012, 48, 893–908. [Google Scholar] [CrossRef]
- Thuillier, B. Rôle du CO2 dans L’appréciation Organoleptique des Champagnes—Expérimentation et Apports Méthodologiques; Université de Reims: Reims, France, 2007. [Google Scholar]
- Thuillier, B.; Valentin, D.; Marchal, R.; Dacremont, C. Pivot© profile: A new descriptive method based on free description. Food Qual. Prefer. 2015, 42, 66–77. [Google Scholar] [CrossRef]
- Fonseca, F.G.A.; Esmerino, E.A.; Filho, E.R.T.; Ferraz, J.P.; da Cruz, A.G.; Bolini, H.M.A. Novel and successful free comments method for sensory characterization of chocolate ice cream: A comparative study between pivot profile and comment analysis. J. Dairy Sci. 2016, 99, 3408–3420. [Google Scholar] [CrossRef] [PubMed]
- Esmerino, E.A.; Tavares Filho, E.R.; Thomas Carr, B.; Ferraz, J.P.; Silva, H.L.A.; Pinto, L.P.F.; Freitas, M.Q.; Cruz, A.G.; Bolini, H.M.A. Consumer-based product characterization using Pivot Profile, Projective Mapping and Check-all-that-apply (CATA): A comparative case with Greek yogurt samples. Food Res. Int. 2017, 99, 375–384. [Google Scholar] [CrossRef] [PubMed]
- Valentin, D.; Chollet, S.; Lelie, M.; Lelièvre, M.; Abdi, H. Quick and dirty but still pretty good: A review of new descriptive methods in food science. Int. J. Food Sci. Technol. 2012, 47, 1563–1578. [Google Scholar] [CrossRef]
- Ares, G.; Jaeger, S.R. Check-all-that-apply (CATA) questions with consumers in practice: Experimental considerations and impact on outcome. In Rapid Sensory Profiling Techniques; Elsevier: Amsterdam, The Netherlands, 2015; pp. 227–245. ISBN 9781782422488. [Google Scholar]
- Dos Santos, B.A.; Bastianello Campagnol, P.C.; da Cruz, A.G.; Galvão, M.T.E.L.; Monteiro, R.A.; Wagner, R.; Pollonio, M.A.R. Check all that apply and free listing to describe the sensory characteristics of low sodium dry fermented sausages: Comparison with trained panel. Food Res. Int. 2015, 76, 725–734. [Google Scholar] [CrossRef] [PubMed]
- Bruzzone, F.; Ares, G.; Giménez, A. Temporal aspects of yoghurt texture perception. Int. Dairy J. 2013, 29, 124–134. [Google Scholar] [CrossRef]
- Cadena, R.S.; Caimi, D.; Jaunarena, I.; Lorenzo, I.; Vidal, L.; Ares, G.; Deliza, R.; Giménez, A. Comparison of rapid sensory characterization methodologies for the development of functional yogurts. Food Res. Int. 2014, 64, 446–455. [Google Scholar] [CrossRef]
- Zoellner, S.S.; Cruz, A.G.; Faria, J.A.F.; Bolini, H.M.A.; Moura, M.R.L.; Carvalho, L.M.J.; Sant’ana, A.S. Whey beverage with acai pulp as a food carrier of probiotic bacteria. Aust. J. Dairy Technol. 2009, 64, 177. [Google Scholar]
- International Organization Standardization. Sensory Analysis: General Guidance for the Design of Test Rooms; International Organization Standardization: Geneva, Switzerland, 1988. [Google Scholar]
- Gallardo-Escamilla, F.J.; Kelly, A.L.; Delahunty, C.M. Influence of starter culture on flavor and headspace volatile profiles of fermented whey and whey produced from fermented milk. J. Dairy Sci. 2005, 88, 3745–3753. [Google Scholar] [CrossRef]
- Liu, J.; Grønbeck, M.S.; Di Monaco, R.; Giacalone, D.; Bredie, W.L.P. Performance of Flash Profile and Napping with and without training for describing small sensory differences in a model wine. Food Qual. Prefer. 2016, 48, 41–49. [Google Scholar] [CrossRef]
- Robert, P.; Escoufier, Y. A unifying tool for linear multivariate statistical methods: The RV-coefficient. Appl. Stat. 1976, 25, 257–265. [Google Scholar] [CrossRef]
- Josse, J.; Pagès, J.; Husson, F. Testing the significance of the RV coefficient. Comput. Stat. Data Anal. 2008, 53, 82–91. [Google Scholar] [CrossRef]
- Miraballes, M.; Fiszman, S.; Gámbaro, A.; Varela, P. Consumer perceptions of satiating and meal replacement bars, built up from cues in packaging information, health claims and nutritional claims. Food Res. Int. 2014, 64, 456–464. [Google Scholar] [CrossRef]
- Bruzzone, F.; Ares, G.; Giménez, A. Consumers’ texture perception of milk desserts. Comparison with trained assessors’ data. J. Texture Stud. 2012, 43, 214–226. [Google Scholar] [CrossRef]
- Pontual, I.; Amaral, G.V.; Esmerino, E.A.; Pimentel, T.C.; Freitas, M.Q.; Fukuda, R.K.; Sant’Ana, I.L.; Silva, L.G.; Cruz, A.G. Assessing consumer expectations about pizza: A study on celiac and non-celiac individuals using the word association technique. Food Res. Int. 2017, 94, 1–5. [Google Scholar] [CrossRef] [PubMed]
- Blancher, G.; Clavier, B.; Egoroff, C.; Duineveld, K.; Parcon, J. A method to investigate the stability of a sorting map. Food Qual. Prefer. 2012, 23, 36–43. [Google Scholar] [CrossRef]
- Ten Kleij, F.; Musters, P.A. Text analysis of open-ended survey responses: A complementary method to preference mapping. Food Qual. Prefer. 2003, 14, 43–52. [Google Scholar] [CrossRef]
Figure 1.
Representation of the samples and attributes in the first two factors of the correspondence analysis of sensory data obtained using Pivot profile (PP). Texture attributes are shown in italics and flavour attributes in regular type.
Figure 1.
Representation of the samples and attributes in the first two factors of the correspondence analysis of sensory data obtained using Pivot profile (PP). Texture attributes are shown in italics and flavour attributes in regular type.

Figure 2.
Representation of the samples and attributes in the first two factors of the correspondence analysis of sensory data obtained using PP + CATA. Texture attributes are shown in italics and flavour attributes in regular type.
Figure 2.
Representation of the samples and attributes in the first two factors of the correspondence analysis of sensory data obtained using PP + CATA. Texture attributes are shown in italics and flavour attributes in regular type.

Figure 3.
Representation of the superimposed samples in the MFA of both methodologies. All the samples are represented by two points corresponding to each applied methodology (PP and PP + CATA). In turn, a third point, which corresponds to the consensus representation and considers both instances of evaluation, is presented.


Table 1.
Concentrations used in the formulation of samples 1.
| Samples | Milk Powder (%) | Starch (%) | Sugar (%) |
|---|---|---|---|
| A | 2.5 | 0 | 4 |
| B | 2.5 | 0 | 6 |
| C | 2.5 | 1 | 4 |
| D | 2.5 | 1 | 6 |
| E | 5.0 | 0 | 4 |
| P | 5.0 | 0 | 6 |
| G | 5.0 | 1 | 4 |
| H | 5.0 | 1 | 6 |
1 Each formulation contained 8% partially demineralised and dehydrated sweet whey and 0.3% gelatin.
Table 2.
Attributes used in the PP + CATA methodology.
| Flavour | Texture |
|---|---|
| Aftertaste | Rough |
| Butter flavour | Firmness |
| Cooked | Liquid |
| Characteristic flavour | Melting speed |
| Artificial | Mouth coating |
| Dairy flavour | Sticky |
| Strange flavour | Soft |
| Salty | Lumpy |
| Sour | Filamentous |
| Bitter | Gummy |
| Sweet | Gelatinous |
| Creamy |
© 2018 by the authors. Licensee MDPI, Basel, Switzerland. This article is an open access article distributed under the terms and conditions of the Creative Commons Attribution (CC BY) license (http://creativecommons.org/licenses/by/4.0/).
Share and Cite
MDPI and ACS Style
Miraballes, M.; Hodos, N.; Gámbaro, A. Application of a Pivot Profile Variant Using CATA Questions in the Development of a Whey-Based Fermented Beverage. Beverages 2018, 4, 11. https://0-doi-org.brum.beds.ac.uk/10.3390/beverages4010011
AMA Style
Miraballes M, Hodos N, Gámbaro A. Application of a Pivot Profile Variant Using CATA Questions in the Development of a Whey-Based Fermented Beverage. Beverages. 2018; 4(1):11. https://0-doi-org.brum.beds.ac.uk/10.3390/beverages4010011
Chicago/Turabian StyleMiraballes, Marcelo, Natalia Hodos, and Adriana Gámbaro. 2018. "Application of a Pivot Profile Variant Using CATA Questions in the Development of a Whey-Based Fermented Beverage" Beverages 4, no. 1: 11. https://0-doi-org.brum.beds.ac.uk/10.3390/beverages4010011
Note that from the first issue of 2016, this journal uses article numbers instead of page numbers. See further details here.