The Quality of Mulberry Juice as Affected by Enzyme Treatments

Food Technology Department, Biotechnology School, International University, Vietnam National University, Ho Chi Minh City 700000, Vietnam
*
Author to whom correspondence should be addressed.
†
These authors contributed equally to this work.
Beverages 2018, 4(2), 41; https://0-doi-org.brum.beds.ac.uk/10.3390/beverages4020041
Submission received: 26 April 2018
/
Revised: 18 May 2018
/
Accepted: 23 May 2018
/
Published: 30 May 2018
(This article belongs to the Special Issue Enzymes in Beverages Processing)
Abstract
:This study was conducted to investigate the effects of commercial enzymes on the extraction yield and the quality of mulberry juice. A mulberry mash was separately treated with two enzymes, namely Pectinex Ultra SP-L and Viscozyme L for different incubation times from 60 to 240 min. Determination of juice yield, total phenolic content, total anthocyanin content, antioxidant capacity, l-ascorbic acid content, total soluble solids, and titratable acidity of juice were carried out. Overall, in comparison with the non-enzymatic treated juice, the juice incubated with Pectinex Ultra SP-L and Viscozyme L was significantly (p < 0.05) higher in all quality attributes. Moreover, samples incubated with Pectinex Ultra SP-L for 120 min had the highest results in extraction yield (87.1%), total soluble solids (11.9°Bx), titratable acidity (1.4%), l-ascorbic acid content (35.5 mg/100 mL), total phenolic content (160.6 mg GAE/100 mL), and antioxidant capacity (82.6%). For both enzymatic treatments, a prolongation of incubation period from 60 min to 120 min resulted in higher antioxidant values for the juice; however, longer 180 min, they were reduced, except total anthocyanin content. Two-way analysis showed that the impacts of the types of enzyme and treatment duration cannot be separated. Positive correlations between total phenolic content and antioxidant capacity indicated that phenolic compounds were the main antioxidants in the beverages.
1. Introduction
Mulberry (Morus spp.), which belongs to the Moraceae family, is grown worldwide. Mulberries are widely distributed in many regions in Southern Europe, the Middle East, Northern Africa, the Indian subcontinent, East Asia, and the Americas. There are 24 species of Morus and one subspecies, with at least 100 known varieties [1]. The three most common commercial mulberry species include white mulberry (Morus alba), black mulberry (Morus nigra), and red mulberry (Morus rubra). Previous studies have found that there are significantly high amounts of phenolic flavonoid phytochemicals called anthocyanins in mulberry that bring positive health effects against cancer, aging, and bacterial infections [2,3,4,5]. Mulberries also contain several nutritive compounds such as fatty acids, amino acids, vitamins, minerals, and bioactive compounds, including anthocyanins, rutin, quercetin, chlorogenic acid, and polysaccharides [6]. Furthermore, mulberries are also an excellent source of iron, which is a rare feature among berries. Iron, being a component of hemoglobin inside the red blood cells, determines the oxygen-carrying capacity of the blood [7]. However, due to ripening processes, fresh mulberry fruits are deteriorated quickly after harvesting; therefore, processing the fruit into food products is necessary.
In juice processing, enzymes are a key tool in terms of quality improvement and cost saving. The use of enzymes such as pectinases and cellulases not only help in softening the plant tissue but also lead to the release of cell contents that may be recovered with high yield [8]. The disaggregation of plant tissue also enhances the extraction of phytochemical compounds towards juice production [9]. Several researchers have reported that pectinase and cellulase enzymatic treatments can significantly enhance the recovery of phenolics, anthocyanins, and improve its functional properties. Enzymatic treatment was found to significantly enhance the total anthocyanin contents in black currant juice [10], blueberry waste [11], and blackberry juice [12]. It has been known that both Pectinex Ultra SP-L and Viscozyme L have been used in order to increase juice yield during mash pressing as well as antioxidant properties. In research of red dragon fruit juice and asparagus juice, Pectinex Ultra SP-L as well as Viscozyme L have shown a great impact on the physical and chemical properties [13,14]. However, when pectolytic enzymes were used in the production of elderberry and strawberry juice for clarification, a decrease of anthocyanins and thus a pigment loss were observed due to the side glycosidase activities [15,16]. Therefore, this study aimed to investigate the effects of the two commercial enzymes at different incubation times on the extraction yield and the quality attributes of mulberry juice.
2. Materials and Methods
2.1. Sample Preparation
Fifteen kg of fresh mulberries fruits (Morus rubra) used in this study were collected at a farm in Lam Dong Province, Vietnam and divided into separate bulks for three replications. All fruits were carefully inspected for damages before being washed, then packed in plastic bag and stored at −20 °C until processed. The two enzymes used in this study were from Novozymes (Bagsvaerd, Denmark) and are as follows: Pectinex Ultra SP-L from Aspergillus aculeatus, with the following specifications: claimed activity (9500 PGU/mL), density 1.16 (g/mL), optimum temperature (20–50 °C), and pH (3.0–4.5); Viscozyme L from Aspergillus aculeatus, containing a wide range of carbohydrate hydrolyzing enzymes, such as arabanase, cellulase, hemicellulase, and xylanase, with the following specifications: claimed activity (100 FBG/g), density 1.21 (g/mL), optimum temperature (40–50 °C), and pH (3.3–4.5).
2.2. Juice Extraction
Juice processing was based on the procedure of Cassano et al. [17] with minor modifications. In detail, selected mulberries with the same maturity, free from insects and damage, were washed with tap water to remove the skin dirt and then separated into two groups: one was used for making juice by pressing and another one was used for enzymatic extraction. Each juice sample was collected from 100 g of mulberry fresh fruit. Pressed mulberry juice was prepared using a home juicer (Panasonic MJ-68MWRA, Panasonic, Malaysia). Meanwhile, for making enzyme-treated juice, the fruits were blended for 3 min and placed into 250 mL beakers. The beakers were covered with aluminum-foil papers to prevent the oxidative change from light. Then, Pectinex Ultra SP-L and Viscozyme L were separately added into the beakers with the ratio of 1:5 (v/w) [18] and incubated at 50 °C, pH 4.5 for 60, 120, 180, and 240 min. The mixtures were held at 90 °C for 5 min to inactivate the enzymes before being filtered through four layers of cheesecloth to remove pomace and obtain the juice. The obtained juice was pasteurized at 90 °C for 10 s and refrigerated at 4 °C until analyses could commence. All treatments were carried out in three replications.
2.3. Analytical Methods
2.3.1. Determination of Juice Yield
Juice yield (%) was calculated according to the following equation [19]
where:
- m1: weight of mulberry fruit mash, g
- m2: weight of mulberry juice, g
- C: concentration of soluble solid compounds in the obtained juice, % (w/w)
- w: moisture of initial mulberry mash, %
2.3.2. Measurement of Total Soluble Solids (°Bx) and Titratable Acidity (%)
Total soluble solids were measured using a digital refractometer (Antago RX-5000, Atago Co, Ltd, Tokyo, Japan) and the results were reported as degree Brix (°Bx).
Titratable acidity was established according to the titration method of Nielsen [20] using 0.1 M sodium hydroxide (NaOH) to the titration end point of pH 8.2. The titratable acidity was calculated as the following formula:
where:
- N of NaOH = 0.1 M
- Eq.wt. citric acid = 64.04
- mL of sample = 10 mL
2.3.3. Extraction of Total Phenolics
For the extraction of total phenolics, the procedure of Vinson et al. [21] with minor modifications was followed. In detail, 5 mL of each juice sample was mixed with 20 mL of 1.2 M HCl in 50% methanol (v/v) (Merck, Darmstadt, Germany) at 60 °C in the dark for 2 h and shaken in a shaking incubator (IKA KS4000ic Control, IKA, Staufen, Germany). The extracts were centrifuged at 3000 g for 15 min at 4 °C using a refrigerated centrifuge (Z326 K, Hermle Labortechnik GmbH, Wehingen, Germany). The supernatants were kept at −40 °C until measurement of total phenolic compounds and antioxidant capacity.
2.3.4. Measurement of Total Phenolic Contents
Total phenolic contents was determined by Folin–Ciocalteu assay as described by Singleton et al. [22] with some modifications. Briefly, 0.5 mL of 100-fold diluted extract was mixed with 2.5 mL of 2 N Folin–Ciocalteu reagent (Sigma-Aldrich, Steinheim, Germany) and 2 mL of 7.5% sodium carbonate (Merck, Darmstadt, Germany). The mixture was vortexed and incubated at room temperature for 5 min, then quickly cooled and vortexed again. The absorbance was recorded at 760 nm with a UV-visible spectrophotometer (Jas.co V730, Jasco Internaional Co, Ltd., Tokyo, Japan). Gallic acid standards were prepared by dissolving 99.99% gallic acid (Merck, Darmstadt, Germany) in 1.2 M HCl in 50% methanol (v/v) (Merck, Darmstadt, Germany) to make the following concentrations 0.01–0.05 mg/mL. The results obtained were expressed as mg of gallic acid equivalents per 100 mL juice (mg GAE/100 mL).
2.3.5. Determination of Antioxidant Capacities
DPPH assay was modified from a method of Lim et al. [23]. Typically, 1 mL of extracts was mixed with 3 mL of 0.1 mM methanolic DPPH solution (Sigma-Aldrich, St. Louis, MO, USA). The mixture was vortexed and allowed to stand in the dark at room temperature for 30 min. The absorbance was measured against a blank at 517 nm with a UV-Visible spectrophotometer (Jas.co V730, Jasco Internaional Co, Ltd., Tokyo, Japan). The experiment was performed in triplicate. The percentage of the free radical scavenging effect was calculated as:
where, A0 was the absorbance of the control solution (containing all reagents except the sample extract) and A was the absorbance of the DPPH solution containing the sample extract at 517 nm.
2.3.6. Measurement of Total Anthocyanin Contents
Total anthocyanin content was determined by the pH differential method of Giusti et al. [24] using a UV spectrophotometer (Jas.co V730, Jasco Internaional Co, Ltd., Tokyo, Japan). Briefly, 1 mL of extracts was leveled off to 10 mL of two buffers; 0.025 M potassium chloride pH 1.0 (Merck, Darmstadt, Germany) and 0.4 M sodium acetate pH 4.5 (Merck, Darmstadt, Germany), respectively. The flasks were left at room temperature for 15 min, and then the absorbance was determined at λ = 520 nm, and λ = 700 nm. Distilled water was used as a blank. Data was expressed as mg cyanidin-3-glucoside equivalents per 100 mL of juice (mg cyanidin-3-glucoside/100 mL). The absorbance of each sample was calculated as follows:
where:
- A = (A520nm − A700nm)pH 1.0 − (A520nm − A700nm)pH 4.5
- MW (molecular weight) = 449.2 g/mol for cyanidin-3-glucoside
- DF = dilution factor established in D
- l = 1 cm
- ε = 26,900 molar extinction coefficient, in L/mol·cm, for cyanidin-3-glucoside
2.3.7. Measurement of l-Ascorbic Acid Contents
Ascorbic acid was determined according to the method of Rahman et al. [25] with minor modifications. Mulberry juice was extracted with a mixture of 5% metaphosphoric acid and 10% acetic acid (Merck, Darmstadt, Germany) for 30 min at room temperature. Then, the extracts were mixed with 3% bromine water (Sigma-Aldrich, St. Louis, MO, USA) and 10% thiourea (Sigma-Aldrich, St. Louis, MO, USA). After that, 2,4-dinitrophenylhydrazine solution (Sigma-Aldrich) was added to the mixture. The samples were incubated at 37 °C for 3 h in a water bath before adding chilled 85% sulfuric acid (Merck, Darmstadt, Germany). The absorbance at 521 nm was measured using a UV-Visible spectrophotometer (Jas.co V730, Jasco Internaional Co, Ltd., Tokyo, Japan). The content of the ascorbic acid was calculated on the basis of the calibration curve of standard l-ascorbic acid. An ascorbic acid standard curve (0.005–0.05 mg/mL) was made by dissolving 99.99% ascorbic acid (Prolabo, Paris, France) in 5% metaphosphoric acid and 10% acetic acid mixture. The results obtained were expressed as mg of l-ascorbic acid per 100 mL sample (mg AA/100 mL).
2.4. Statistical Analysis
All experiments were performed in triplicate. Data were expressed as the mean values ± standard deviation (SD) derived from three replications. The statistical analysis of the data was done by analysis of variance (ANOVA) using the software Minitab® version 16 (Minitab Ltd., Coventry, UK). The results were considered statistically significant for p-values below 0.05.
3. Results and Discussion
3.1. Juice Yield
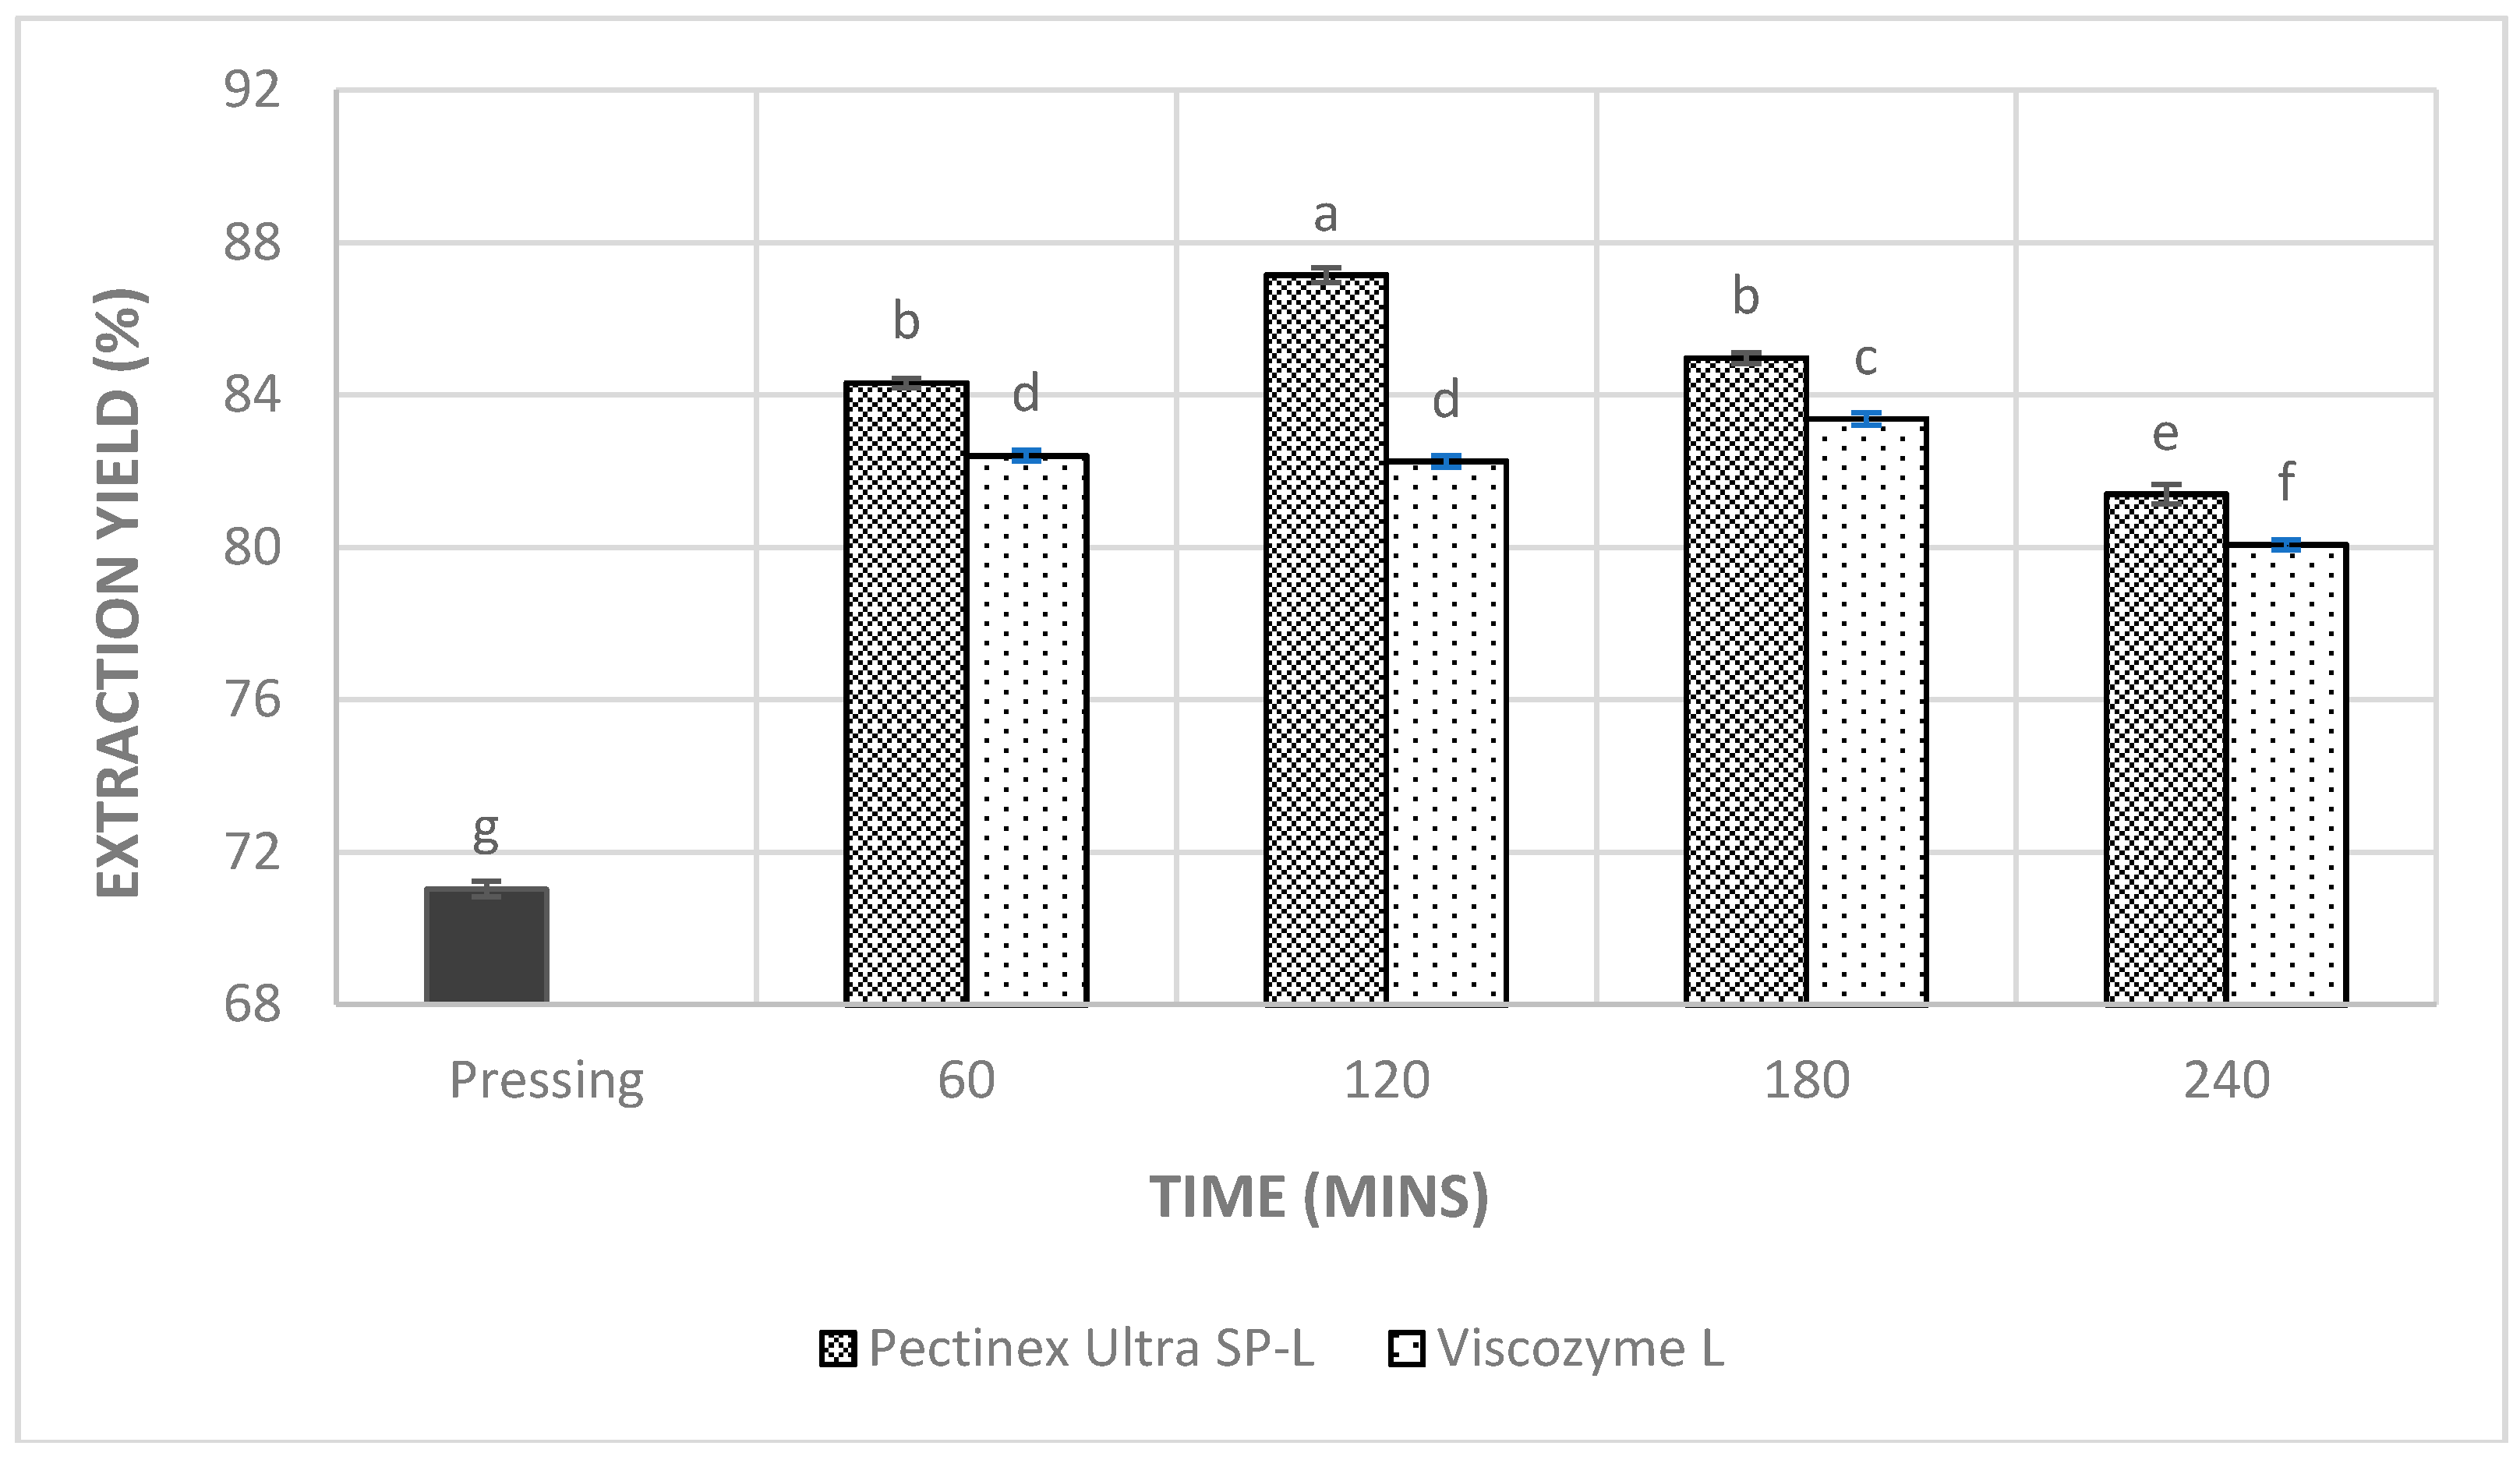
Figure 1 shows that both types of enzyme and incubation times significantly impacted on the yield of mulberry juice. There was a large increase in the extraction yield when applying enzymes in mulberry juice processing as compared with pressing only. After the enzyme application in the juice processing, the juice yield increased significantly [26,27], a finding in agreement with those reported in the current study.
In both enzymes, the extraction yield was found to be highest at the initial stages (60–180 min) ranging from 84.3% to 87.1%, and from 82.3% to 83.4% for Pectinex Ultra SP-L and Viscozyme L, respectively. However, applying Pectinex Ultra SP-L proved to give a significantly (p < 0.05) higher juice yield after mash maceration for 120 min (87.1 ± 0.19%). When incubating time increased, the yield decreased significantly (p < 0.05) as shown in 180 min (84.9 ± 0.14%) and 240 min (81.4 ± 0.26%) (Figure 1). This phenomenon was similar with those observed from the previous studies carried on jamaica pulp and asparagus [28]. Although the highest yield of Viscozyme L samples was at 180 min (83.4 ± 0.16%), this value was significantly lower than that of Pectinex Ultra SP-L. Upon enzyme treatment, degradation of the pectin led to a reduction in the water holding capacity of the pectin, which released more juice into the mixture and consequently juice yield increased [29,30].
The obtained data were higher than the reported results by Joshi et al. [31] in which the enzyme treatment of plum, peach, pear, and apricot have increased the juice yield from 52% (plum), 38% (peach), 60% (pear), and 50% (apricot) to 78% (plum), 63% (peach), 72% (pear), and 80% (apricot), respectively.
3.2. Total Soluble Solids and Titratable Acidity
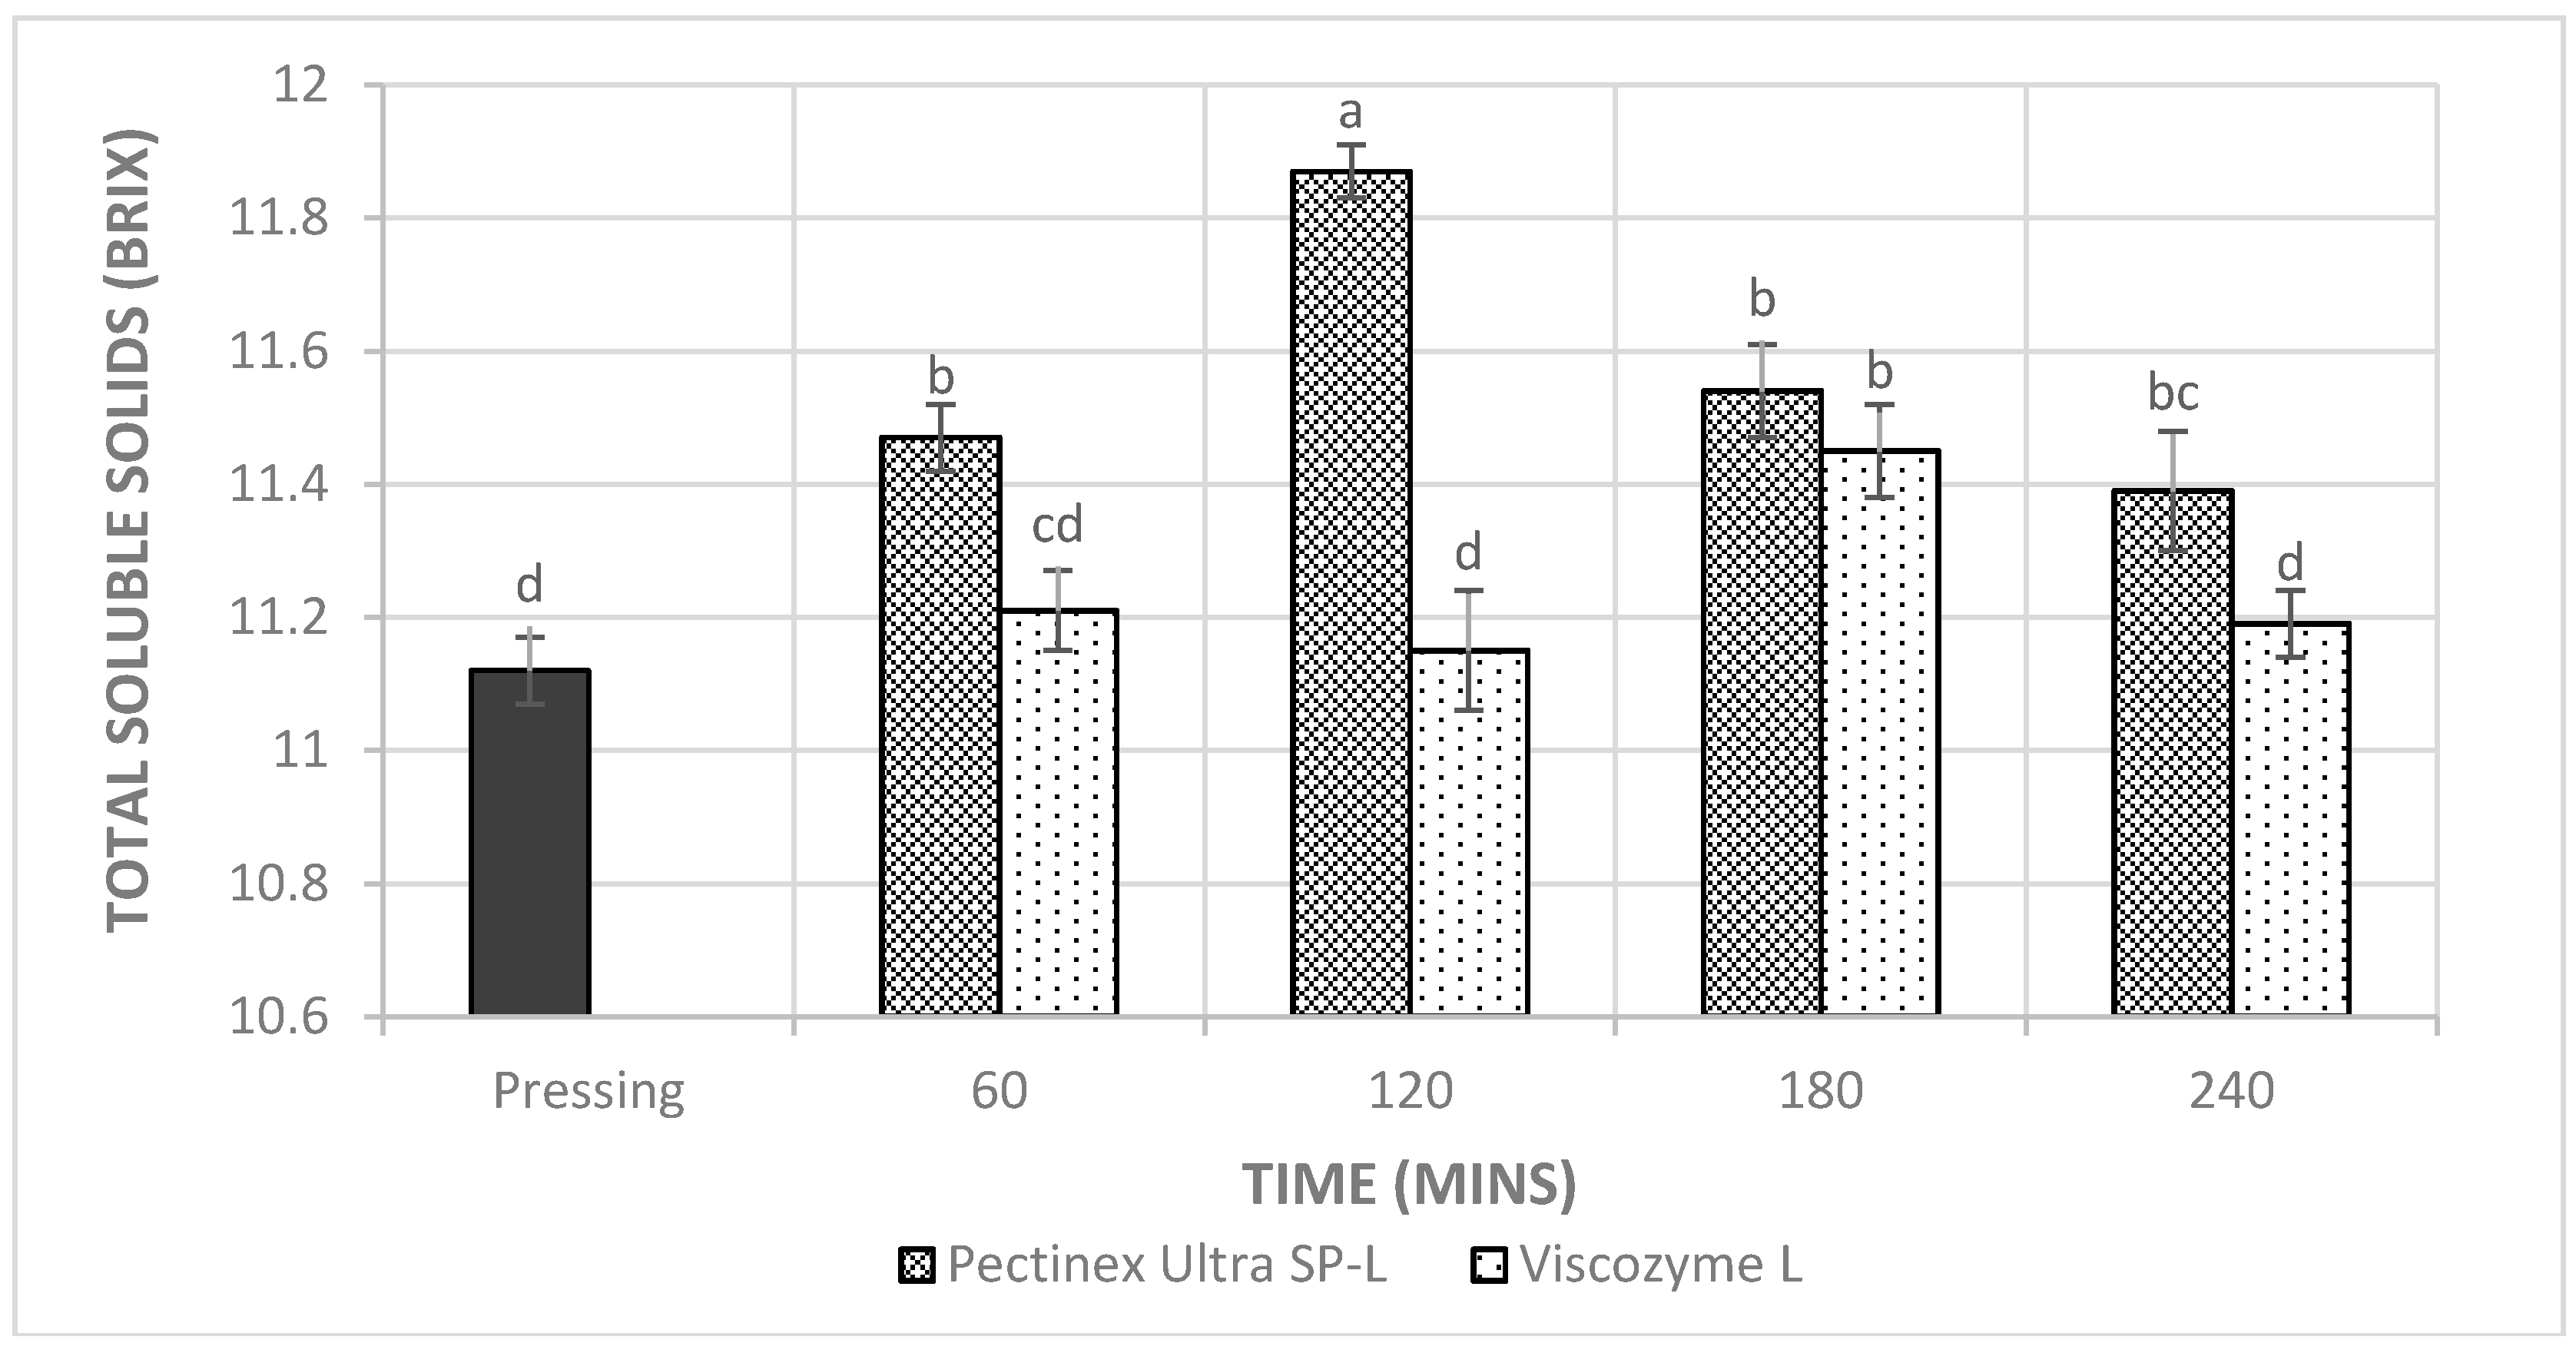
Enzymatic extraction also increased the total soluble solids of the mulberry juice as compared to the pressing method (Figure 2). After 120 min of incubating, the mulberry juice that used Pectinex Ultra SP-L had the highest value, increasing by approximately 6.7% as compared to that of the pressed juice. Nevertheless, total soluble solids results started to reduce in both enzymes as time passed due to the fermentation of sugars. Similarly, Yusof et al. [32] found that the use of enzyme for soursop significantly increased the soluble solids content from 6.8 to 7.3°Brix within 120 min of incubation. Increasing the incubation time from 180 to 240 min did not cause any significant increase in the total soluble solids content [32]. The increase in total soluble solids is related to a greater degree of tissue breakdown, releasing more compounds such as sugars [8], which contribute to soluble solids.
As can be seen from Figure 3, mulberry juice treated with enzyme shows a significantly higher TA than pressed juice. Moreover, titratable acidity of juice applying pectinase also reached the highest value (1.57%) after 120 min of incubation in comparison with Viscozyme L. According to Akesowan et al. [33], the obtained guava juice was also high in titratable acidity value after a 120 min treatment with pectinase. This can be explained because pectinase, which includes pectin methyl esterase and polygalacturonase, assists in pectin hydrolysis. Their reactions cause a release of carboxylic acids and galacturonic acids. This leads to an increase in titratable acidity. Moreover, total titratable acidity for enzymatically extracted juice from soursop increased significantly from 0.41% to 0.49% for 60 and 120 min of incubation, respectively [32]. This was explained by the increasing of citric acid released during enzymatic extraction and the liberation of galacturonic acid inducted by pectinase adjunction. As the incubation time increased from 180 to 240 min, there were no significant changes in the titratable acidity values for both enzyme applications.
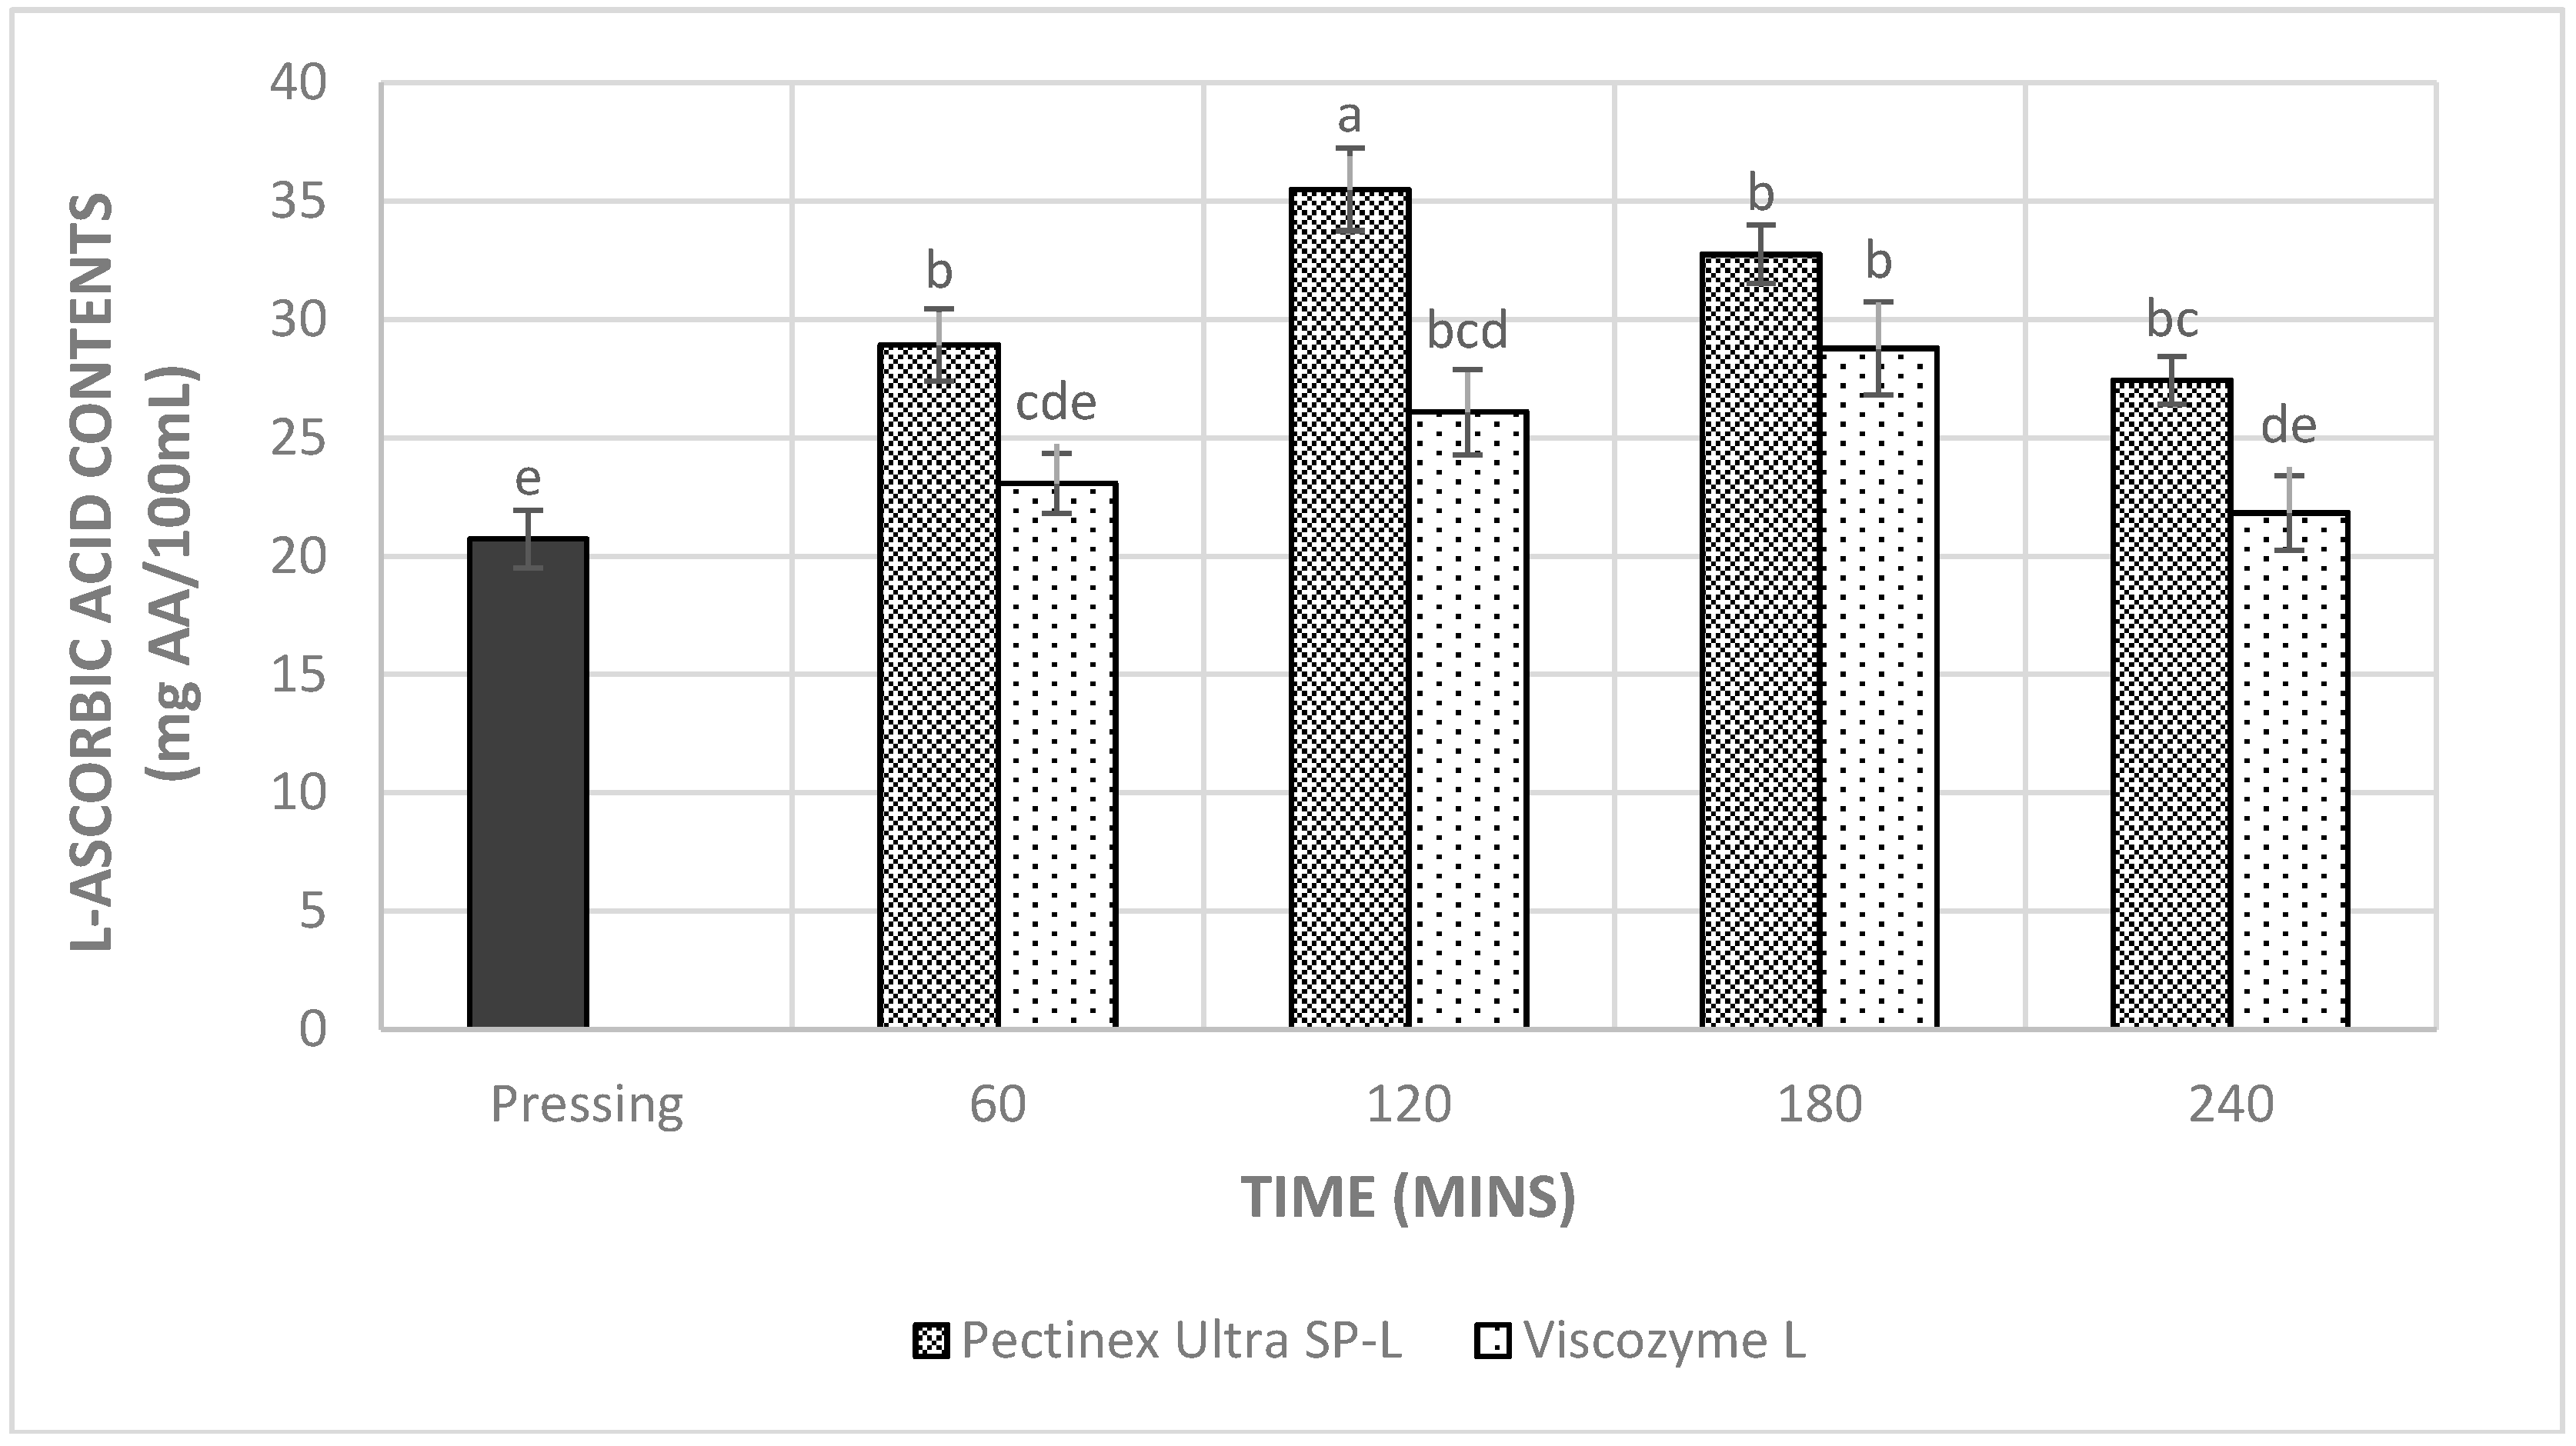
3.3. l-Ascorbic Acid Contents
In this study, it was noted that there were significant increases (p < 0.05) in ascorbic acid contents when applying enzymatic treatments as compared to non-enzyme treated juice (Figure 4).
Compared to Pectinex Ultra SP-L, Viscozyme L showed lower results in ascorbic acid contents (Figure 4). Indeed, the ascorbic acid contents of mulberry juice using Pectinex Ultra SP-L at the initial stages (60–180 min) increased from 28.9 to 35.5 mg AA/100 mL. Meanwhile, for Viscozyme L, the values were lower. It could be seen that prolonging the incubation after 180 min for the Pectinex Ultra SP-L and 240 min for Viscozyme L, the ascorbic acid content began to decrease significantly (Figure 4). Ascorbic acid is known as a sensitive chemical that is promptly degradable by oxygen, temperature, and light. Hence, the contents of ascorbic acid in both enzymes reduced over time and the mulberry juice incubated with Pectinex Ultra SP-L for 120 min was likely to give better results.
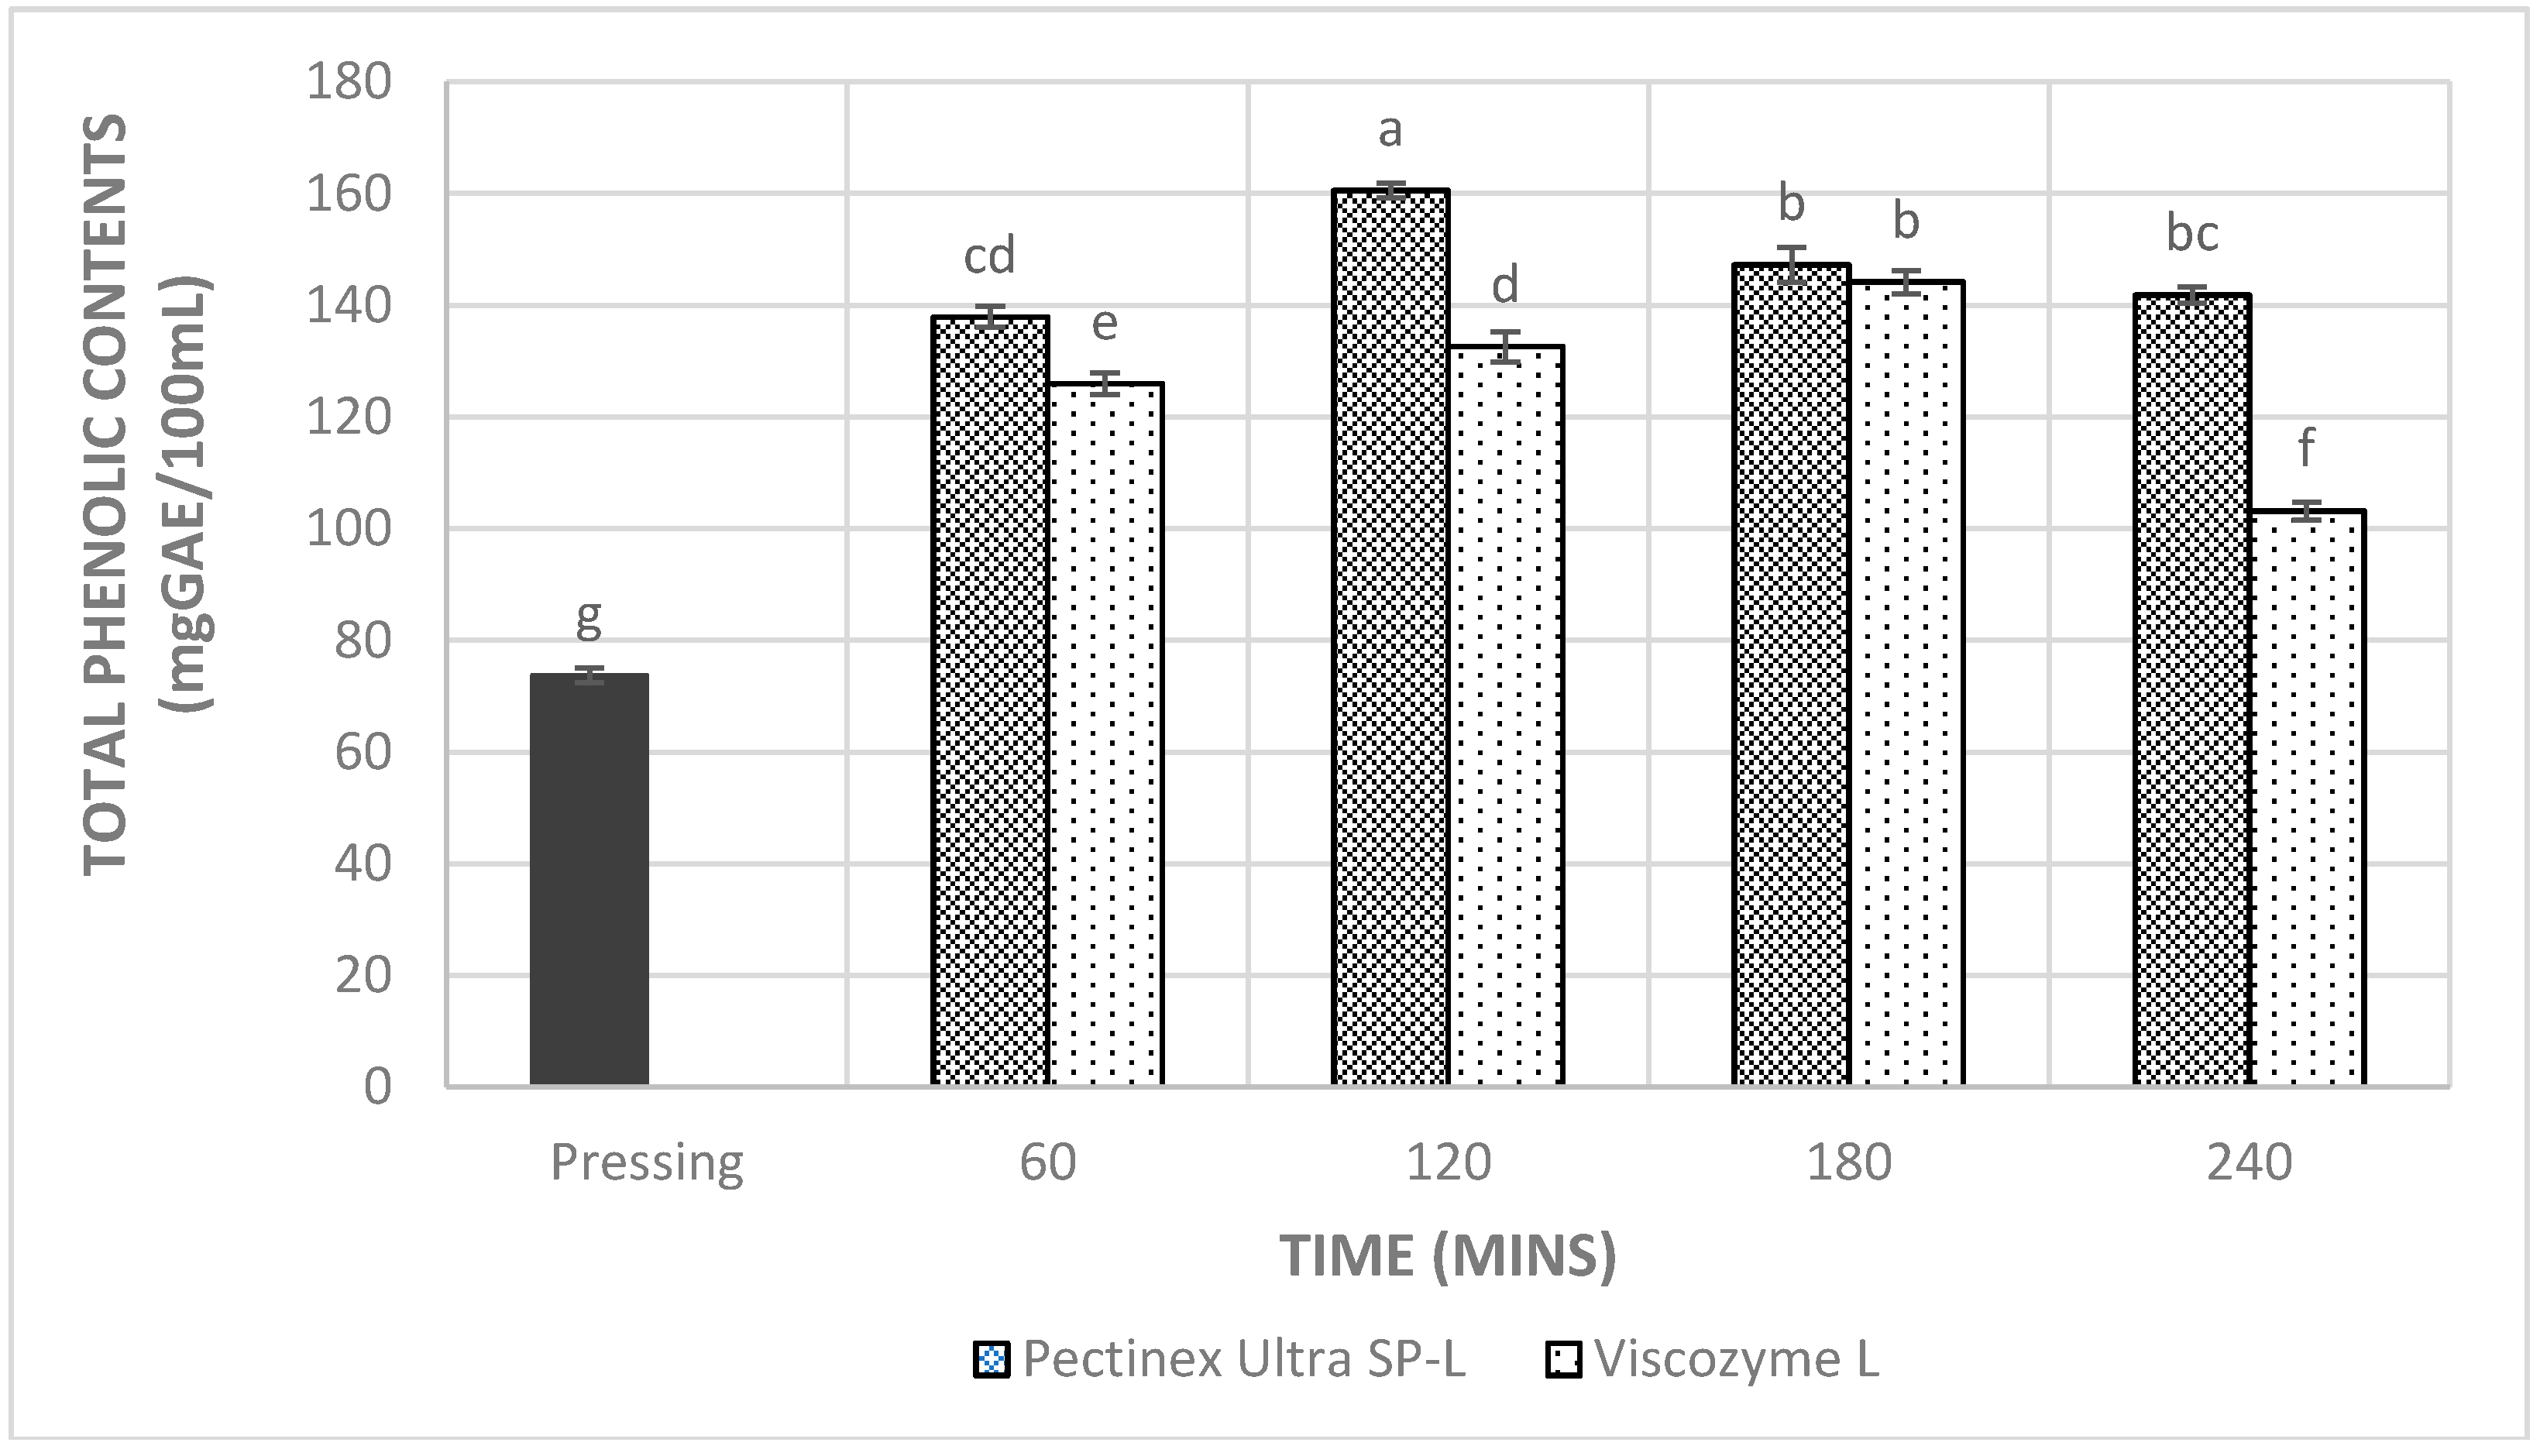
3.4. Total Phenolic Content, Total Anthocyanin Content, and Antioxidant Capacities
In general, applying enzymes at 50 °C significantly increased the total phenolic and total anthocyanin contents twice when compared to the non-enzyme treated juice (Figure 5). This could be due to pectinases degraded pectins in the middle lamella of the fruit tissue and the enhanced extraction of the antioxidants from the cellular cytoplasm [34]. In addition, samples treated with Pectinex Ultra SP-L demonstrated higher levels of total phenolics and anthocyanins than those obtained from the Viscozyme L treatment (Figure 5 and Figure 6).
The anthocyanin content in mulberry juice tended to increase with increased enzyme maceration time. According to Joshi et al. [31], pectinase treatment increased the release of anthocyanins more so than other enzyme treatments in grape juice. Moreover, Versari et al. [15] proved that the pectolytic enzymes help to release a stationary high level of total anthocyanins over time and there was a clear decrease in total anthocyanins after 4 h (67.8 ± 1.86 mg cy-3-glc/100 mL).
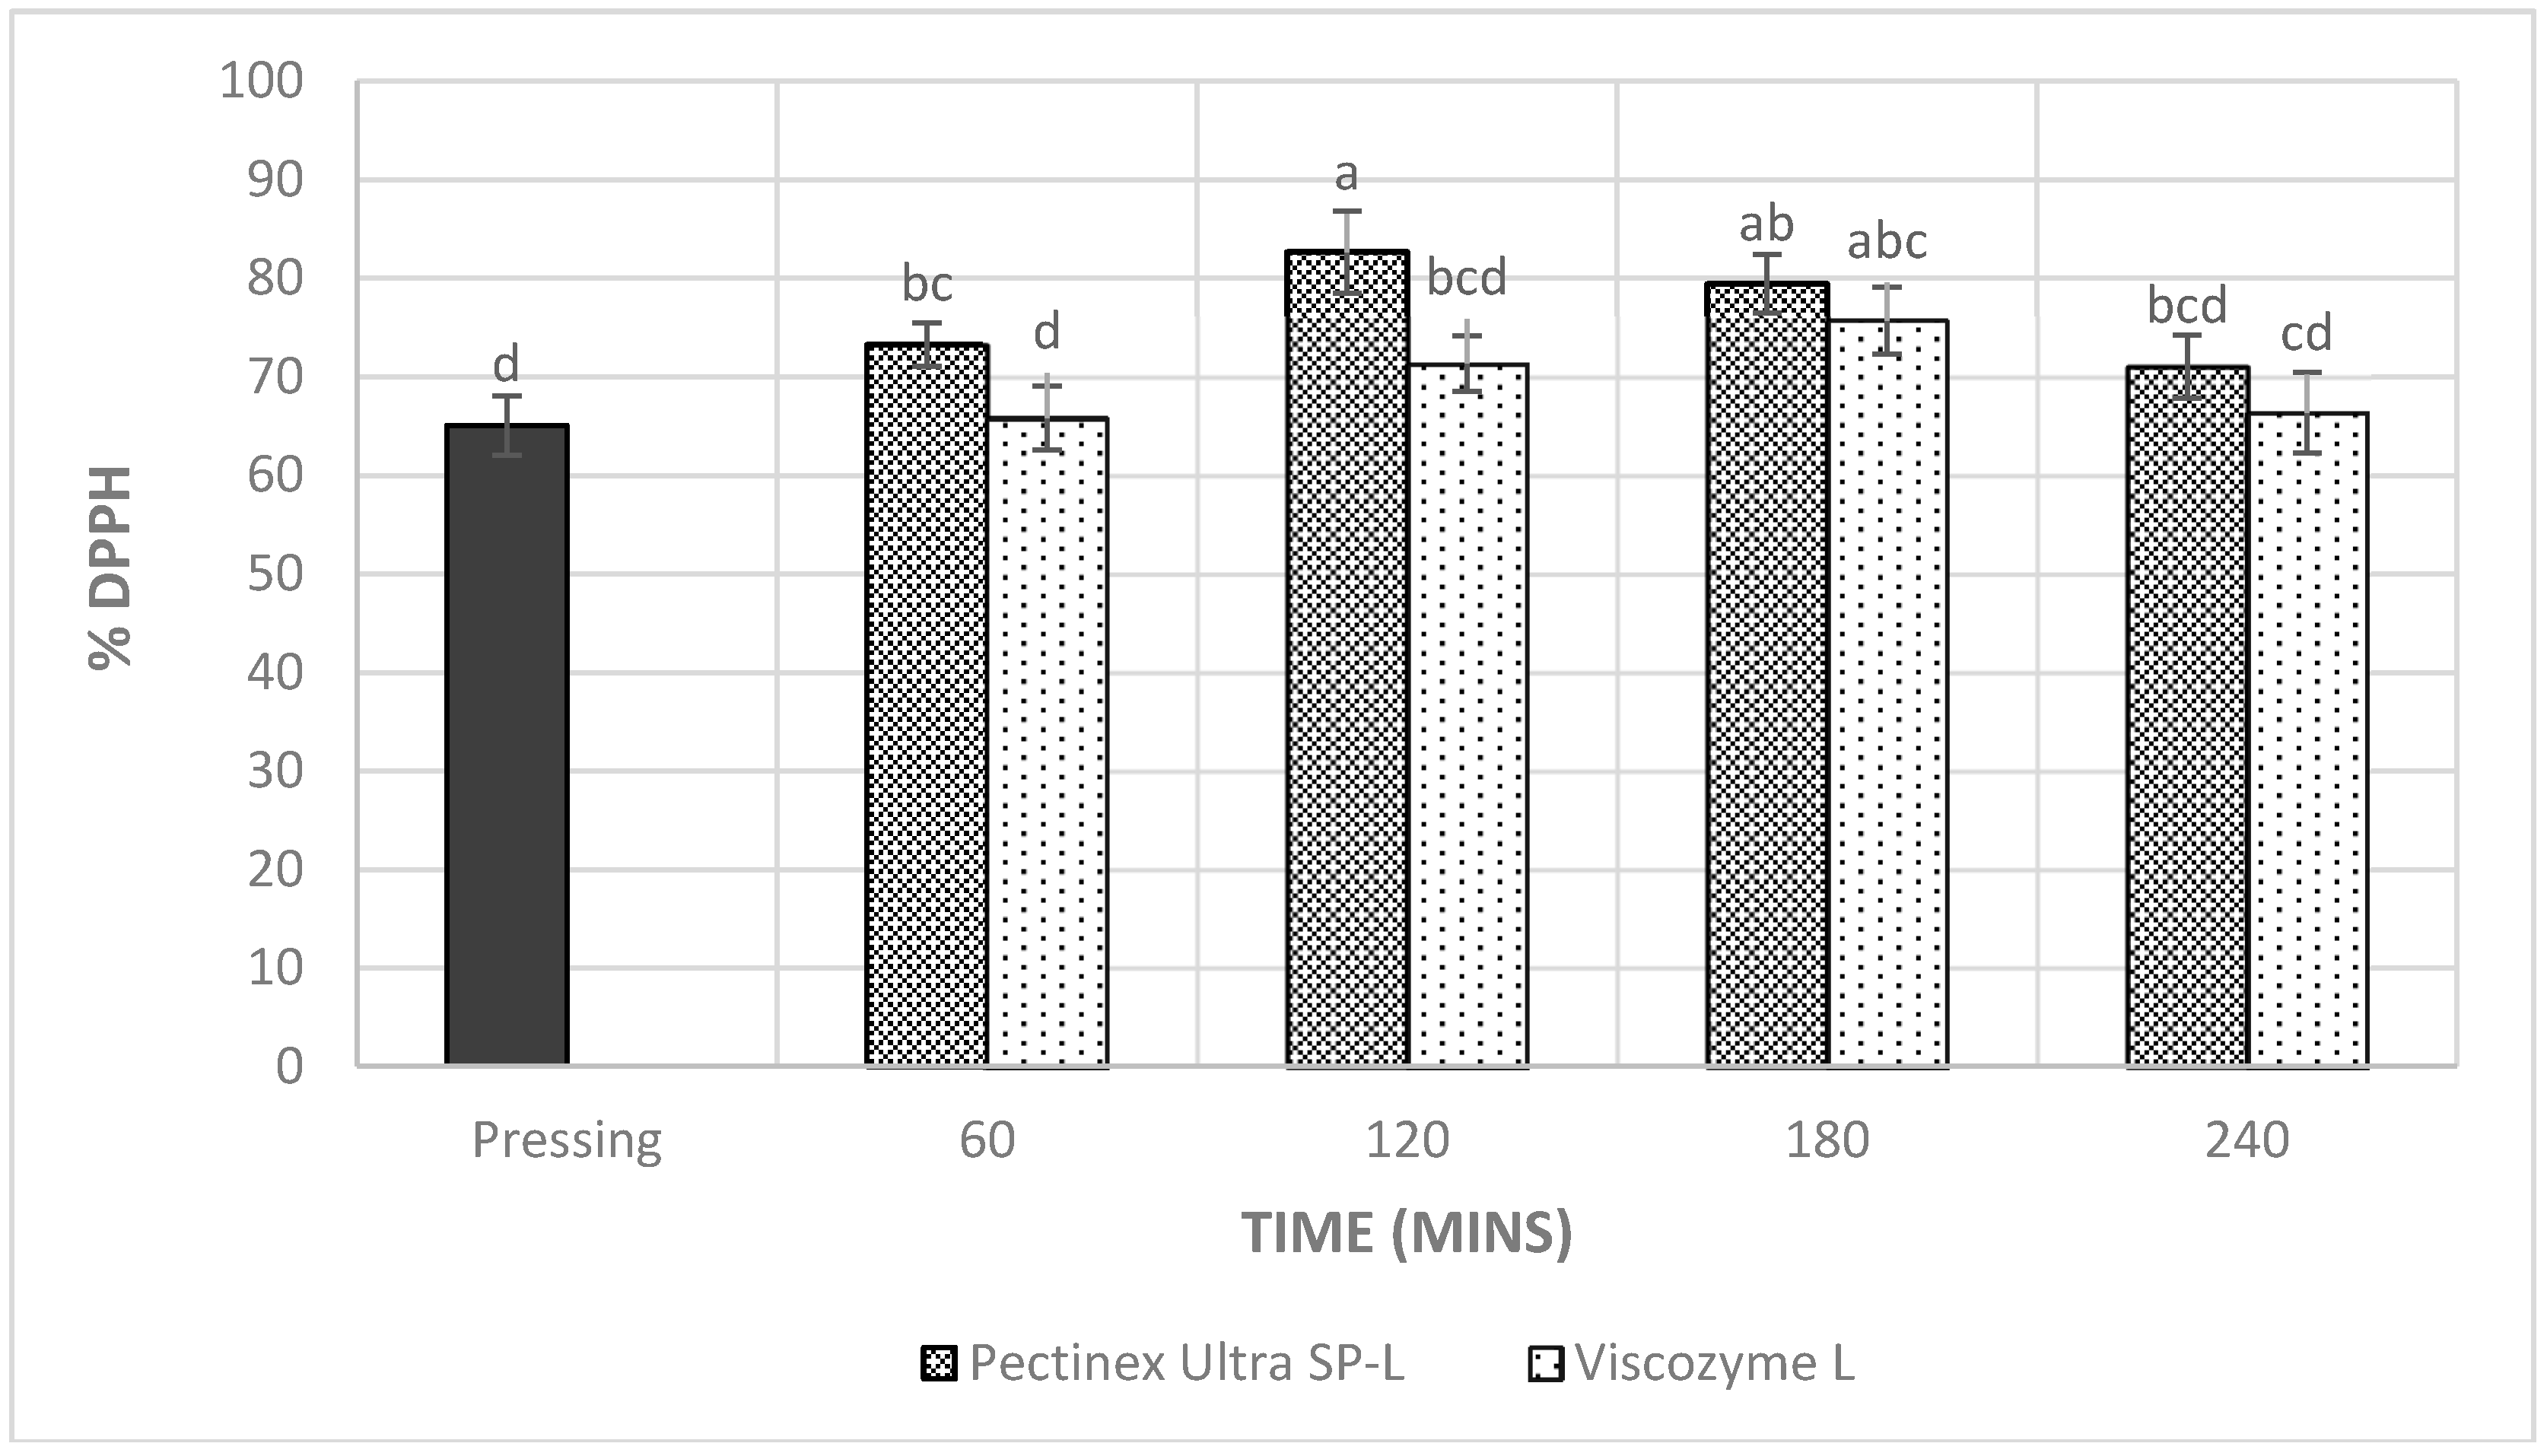
The antioxidant capacity of treated mulberry juice was examined by % DPPH inhibition (Figure 7). As the results of increasing total phenolic and anthocyanin contents in mulberry juice and the free radical scavenging capacity also increased during the enzymatic treatment. Pectinase facilitated the degradation of the cell middle lamella and primary wall, thereby releasing polyphenolic compounds located in the cell vacuoles. Increasing antioxidant capacities were found when applying pectinase to produce several fruit juices, such as blackcurrants [35] and pomegranate [36].
The reduction of total phenolic, anthocyanin contents and the DPPH scavenging effect in some samples (Figure 5, Figure 6 and Figure 7) could be resulted from the hydrolysis of the side glycosidic chains of the flavonoids by pectinase. This process resulted in less oxidation-stable polyphenols [37] and consequently, less polyphenols were found in the products. In addition, pectinase preparation could also contain some other enzymes produced by Aspergillus sp. under sub-optimal conditions, such as rutinase, quercetinase [13], and laccase [28]. In fact, laccase was reported to cause a loss of antioxidant capacity in asparagus juice as it oxidized most of the rutin in the samples [28]. These authors further concluded that this observation could happen to any juice because many phenolic compounds other than rutin could also be oxidized by laccase. Furthermore, phenolic acids could bind to plant cell walls, specifically pectin and cellulose, when both of them were released from broken cells, or when phenolic acids diffused through the plant cell walls, which affects the extract ability of the phenolic acids [38]. On the other hand, the formation of pores within dextran gels from the interaction between the hydroxyl groups of phenols and oxygen atoms of the cross links the ether bonds and retains more polyphenols inside [39]. Hence, polyphenol contents were reduced as the time extended from 180 to 240 min.
3.5. Statistical Analysis
To determine the contribution of ascorbic acid, total phenolics, and total anthocyanin contents to the antioxidant capacities of mulberry juice, the correlations between each of these components and the DPPH radical scavenging activity were evaluated (Table 1).
For mulberry juice treated with Pectinex Ultra SP-L, there was a strong linear correlation between the total phenolic content and antioxidant capacities measured by the percentage of DPPH inhibition (r2 = 0.837, p < 0.05). There were weaker correlations between the inhibition and l-ascorbic acid content (r2 = 0.649, p < 0.05) and total anthocyanin content of mulberry juice (r2 = 0.682, p < 0.05).
On the other hand, the correlations of Viscozyme L treated juice between each of these components and antioxidant capacity were lower than those obtained in Pectinex Ultra SP-L (Table 1). From Table 1, it could be concluded that polyphenols accounted for a large part of the antioxidants in mulberry juice in this study.
There were significant interactions (p < 0.05) between enzymes and incubation times for the juice yield and the other quality attributes of the mulberry juice (Table 2). This indicates that the effects of these two factors cannot be separated and each enzyme has its own suitable treatment time. It is suggested that Pectinex Ultra SP-L and 120 min of incubation should be applied for processing mulberry juice because of the significantly higher extraction yield and the amounts of antioxidant compounds that are maintained.
4. Conclusions
In this study, enzymatic treatments showed the increased extraction efficiencies for processing an antioxidant rich juice from mulberry fruit. Moreover, the significant interactions between enzymes and incubation times in mulberry juice processing indicated that the effects of these two factors cannot be separated and each enzyme has its own suitable treatment time. Enzymatic maceration with Pectinex Ultra SP-L in 120 min and Viscozyme L in 180 min increased the juice yield as much as 15.8% and 12.3%, respectively, in comparison with the non-enzyme one. A high positive correlation between the antioxidant capacities of mulberry juice and the content of total phenolic indicates that polyphenols were responsible for the antioxidant activity in this product.
Author Contributions
Methodology: C.L.N. and H.V.H.N.; Writing-Original Draft Preparation: C.L.N.; Writing-Review & Editing: H.V.H.N.
Conflicts of Interest
The authors declare no conflicts of interest.
References
- Ercisli, S.; Orhan, E. Chemical composition of white (Morus alba), red (Morus rubra) and black (Morus nigra) mulberry fruits. Food Chem. 2007, 103, 1380–1384. [Google Scholar] [CrossRef]
- Huang, H.P.; Ou, T.T.; Wang, C.J. Mulberry (Sang Shèn Zǐ) and its bioactive compounds, the chemoprevention effects and molecular mechanisms in vitro and in vivo. J. Tradit. Complement. Med. 2013, 3, 7–15. [Google Scholar] [CrossRef] [PubMed]
- Kim, Y.R.; Lee, J.S.; Lee, K.R.; Kim, Y.E.; Baek, N.I.; Hong, E.K. Effects of mulberry ethanol extracts on hydrogen peroxide-induced oxidative stress in pancreatic β-cells. Int. J. Mol. Med. 2014, 33, 128–134. [Google Scholar] [CrossRef] [PubMed]
- Skrovankova, S.; Sumczynski, D.; Mlcek, J.; Jurikova, T.; Sochor, J. Bioactive compounds and antioxidant activity in different types of berries. Int. J. Mol. Sci. 2015, 16, 24673–24706. [Google Scholar] [CrossRef] [PubMed]
- Salih, N.D.; Hazir, N.S.M.; Hamid, M.H.A. The effect of mulberry (Morus sp.) tea supplement on acetaminophen induced renal failure in rats. World J. Pharm. Pharm. Sci. 2015, 4, 111–125. [Google Scholar]
- Yuan, Q.; Zhao, L. The Mulberry (Morus alba L.) Fruit—A review of characteristic components and health benefits. J. Agric. Food Chem. 2017, 65, 10383–10394. [Google Scholar] [CrossRef] [PubMed]
- Eyduran, S.P.; Ercişli, S.; Akın, M.; Beyhan, Ö.; Geçer, M.K.; Eyduran, E.; Ertürk, Y.E. Organic acids, sugars, vitamin C, antioxidant capacity, and phenolic compounds in fruits of white (Morus alba L.) and black (Morus nigra L.) mulberry genotypes. J. Appl. Bot. Food Qual. 2015, 88, 134–138. [Google Scholar]
- Sreenath, H.; Frey, M.; Radola, B.; Scherz, H. Degradation of a washed carrot preparation by cellulases and pectinases. Biotechnol. Bioeng. 1984, 26, 788–796. [Google Scholar] [CrossRef] [PubMed]
- Puri, M.; Sharma, D.; Barrow, C.J. Enzyme-assisted extraction of bioactives from plants. Trends Biotechnol. 2012, 30, 37–44. [Google Scholar] [CrossRef] [PubMed]
- Landbo, A.K.; Meyer, A.S. Effects of different enzymatic maceration treatments on enhancement of anthocyanins and other phenolics in black currant juice. Innov. Food Sci. Emerg. Technol. 2004, 5, 503–513. [Google Scholar] [CrossRef]
- Lee, J.; Wrolstad, R. Extraction of anthocyanins and polyphenolics from blueberry processing waste. J. Food Sci. 2004, 69, 564–573. [Google Scholar] [CrossRef]
- Wang, W.D.; Xu, S.Y.; Jin, M.K. Effects of different maceration enzymes on yield, clarity and anthocyanin and other polyphenol contents in blackberry juice. Int. J. Food Sci. Technol. 2009, 44, 2342–2349. [Google Scholar] [CrossRef]
- Sun, T.; Tang, J.; Powers, J.R. Effect of pectolytic enzyme preparations on the phenolic composition and antioxidant activity of asparagus juice. J. Agric. Food Chem. 2005, 53, 42–48. [Google Scholar] [CrossRef] [PubMed]
- Truong, N.; Dang, Q.T. Application of hydrolytic enzymes for improvement of red dragon fruit juice processing. Asia-Pac. Conf. Chem. Ecol. 2016, 4, 1–4. [Google Scholar]
- Versari, A.; Biesenbruch, S.; Barbanti, D.; Farnell, P.; Galassi, S. Effects of pectolytic enzymes on selected phenolic compounds in strawberry and raspberry juices. Food Res. Int. 1997, 30, 811–817. [Google Scholar] [CrossRef]
- Pricelius, S.; Murkovic, M.; Souter, P.; Guebitz, G.M. Substrate specificities of glycosidases from Aspergillus species pectinase preparations on elderberry anthocyanins. J. Agric. Food Chem. 2009, 57, 1006–1012. [Google Scholar] [CrossRef] [PubMed]
- Cassano, A.; Donato, L.; Drioli, E. Ultrafiltration of kiwifruit juice: Operating parameters, juice quality and membrane fouling. J. Food Eng. 2007, 79, 613–621. [Google Scholar] [CrossRef]
- Munoz, O.; Sepulveda, M.; Schwartz, M. Effects of enzymatic treatment on anthocyanic pigments from grapes skin from Chilean wine. Food Chem. 2004, 87, 487–490. [Google Scholar] [CrossRef]
- Lee, W.; Yusof, S.; Hamid, N.; Baharin, B. Optimizing conditions for hot water extraction of banana juice using response surface methodology (RSM). J. Food Eng. 2006, 75, 473–479. [Google Scholar] [CrossRef] [Green Version]
- Nielsen, S.S. Standard Solutions and Titratable Acidity. In Food Analysis Laboratory Manual, 2nd ed.; Springer: New York, NY, USA, 2003; Chapter 12; p. 602. [Google Scholar]
- Vinson, J.A.; Hao, Y.; Su, X.; Zubik, L. Phenol antioxidant quantity and quality in foods: Vegetables. J. Agric. Food Chem. 1998, 46, 3630–3634. [Google Scholar] [CrossRef]
- Singleton, V.L.; Rossi, J.A. Colorimetry of total phenolics with phosphomolybdic-phosphotungstic acid reagents. Am. J. Enol. Vitic. 1965, 16, 144–158. [Google Scholar]
- Lim, Y.Y.; Lim, T.T.; Tee, J.J. Antioxidant properties of several tropical fruits: A comparative study. Food Chem. 2007, 103, 1003–1008. [Google Scholar] [CrossRef]
- Giusti, M.M.; Wrolstad, R.E. Characterization of red radish anthocyanins. J. Food Sci. 1996, 61, 322–326. [Google Scholar] [CrossRef]
- Rahman, M.M.; Khan, M.M.R.; Hosain, M.M. Analysis of vitamin C (ascorbic acid) contents in various fruits and vegetables by UV-spectrophotometry. Bangladesh J. Sci. Ind. Res. 2007, 42, 417–424. [Google Scholar] [CrossRef]
- Huynh, N.K.; Nguyen, H.V. Effects of juice processing on oxalate contents in Carambola juice products. Plant Foods Hum. Nutr. 2017, 72, 236–242. [Google Scholar] [CrossRef] [PubMed]
- Nguyen, H.V.H.; Savage, G. Oxalate contents of kiwifruit (Actinidia deliciosa) juice extracted by pressing or enzyme extraction. J. Food Agric. Environ. 2013, 11, 228–230. [Google Scholar]
- Sun, T.; Powers, J.R.; Tang, J. Effect of enzymatic macerate treatment on rutin content, antioxidant activity, yield, and physical properties of asparagus juice. J. Food Sci. 2007, 72, 267–271. [Google Scholar] [CrossRef] [PubMed]
- Kashyap, D.; Vohra, P.; Chopra, S.; Tewari, R. Applications of pectinases in the commercial sector: A review. Bioresour. Technol. 2001, 77, 215–227. [Google Scholar] [CrossRef]
- Lee, W.C.; Yusof, S.A.L.M.A.H.; Hamid, N.S.A.; Baharin, B.S. Optimizing conditions for enzymatic clarification of banana juice using response surface methodology (RSM). J. Food Eng. 2006, 73, 55–63. [Google Scholar] [CrossRef] [Green Version]
- Joshi, V.K.; Parmar, M.; Rana, N. Purification and characterization of pectinase produced from apple pomace and evaluation of its efficacy in fruit juice extraction and clarification. Indian J. Nat. Prod. Resour. 2011, 2, 189–197. [Google Scholar]
- Yusof, S.; Ibrahim, N. Quality of Soursop juice after pectinase enzyme treatment. Food Chem. 1994, 51, 83–88. [Google Scholar] [CrossRef]
- Akesowan, A.; Choonhahirun, A. Effect of enzyme treatment on guava juice production using response surface methodology. J. Anim. Plant Sci. 2013, 23, 114–120. [Google Scholar]
- Oszmiański, J.; Wojdyło, A.; Kolniak, J. Effect of pectinase treatment on extraction of antioxidant phenols from pomace, for the production of puree-enriched cloudy apple juices. Food Chem. 2011, 127, 623–631. [Google Scholar] [CrossRef] [PubMed]
- Jorgensen, B.R.; Meyer, A.S. Effects of different enzymatic pre-press maceration treatments on the release of phenols into blackcurrant juice. Eur. Food Res. Technol. 2004, 219, 620–629. [Google Scholar] [CrossRef]
- Rinaldi, M.; Caligiani, A.; Borgese, R.; Palla, G.; Barbanti, D.; Massini, R. The effect of fruit processing and enzymatic treatments on pomegranate juice composition, antioxidant activity and polyphenols content. LWT Food Sci. Technol. 2013, 53, 355–359. [Google Scholar] [CrossRef]
- Butnariu, M.; Raba, D.; Grozea, I.; Virteiu, A.; Stef, R. The impact of physical processes and chemicals of the antioxidants (bioactivity compounds). J. Bioequiv. Availab. 2013, 5, e44. [Google Scholar] [CrossRef]
- Padayachee, A.; Netzel, G.; Netzel, M.; Day, L.; Zabaras, D.; Mikkelsen, D.; Gidley, M. Binding of polyphenols to plant cell wall analogues–Part 2: Phenolic acids. Food Chem. 2012, 135, 2287–2292. [Google Scholar] [CrossRef] [PubMed]
- Haglund, A.C. Atsorption of manosubstituted phenols on sephadex G-15. J. Chromatogr. A 1978, 156, 317–322. [Google Scholar] [CrossRef]
Figure 1.
The effects of enzyme treatments on the extraction yield of mulberry juice. The values are mean ± SD (n = 3). Means sharing the different letters are significantly different (p < 0.05).
Figure 1.
The effects of enzyme treatments on the extraction yield of mulberry juice. The values are mean ± SD (n = 3). Means sharing the different letters are significantly different (p < 0.05).

Figure 2.
The effects of enzyme treatments on the total soluble solids of mulberry juice. The values are mean ± SD (n = 3). Means sharing different letters are significantly different (p < 0.05).
Figure 2.
The effects of enzyme treatments on the total soluble solids of mulberry juice. The values are mean ± SD (n = 3). Means sharing different letters are significantly different (p < 0.05).

Figure 3.
The effects of enzyme treatments on the titratable acidity of mulberry juice. The values are mean ± SD (n = 3). Means sharing different letters are significantly different (p < 0.05).
Figure 3.
The effects of enzyme treatments on the titratable acidity of mulberry juice. The values are mean ± SD (n = 3). Means sharing different letters are significantly different (p < 0.05).
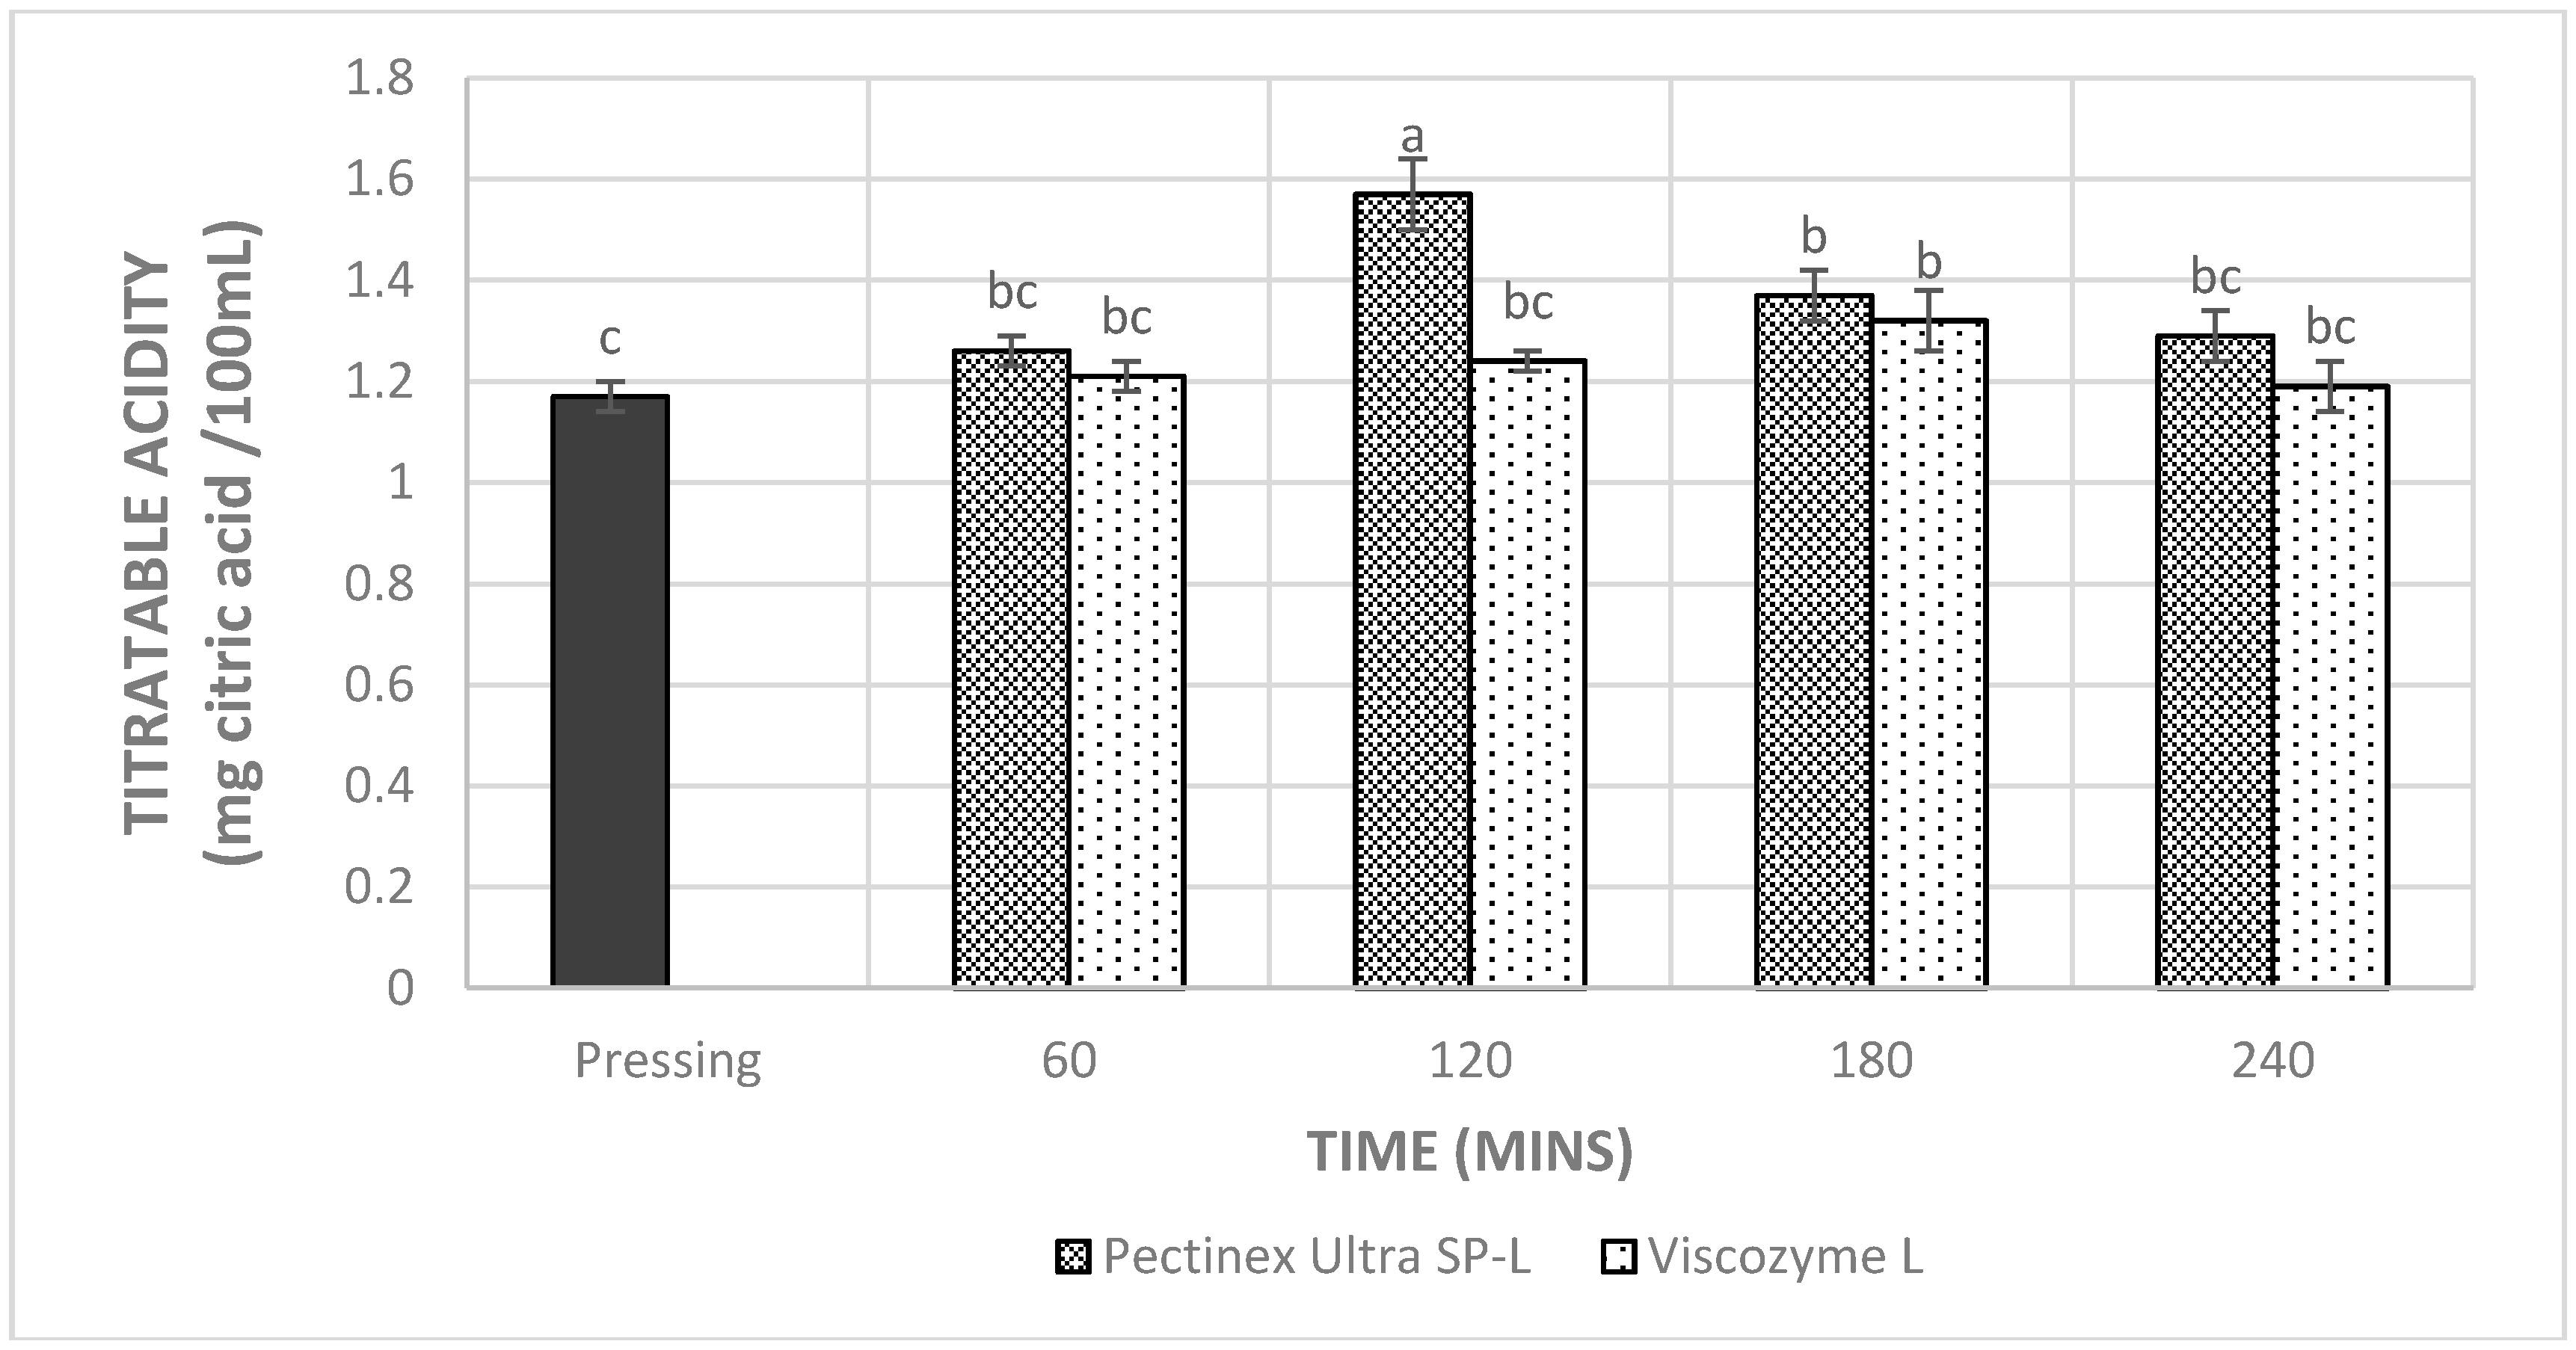
Figure 4.
The effects of enzyme treatments on the l-ascorbic acid contents of mulberry juice. The values are mean ± SD (n = 3). Means sharing different letters are significantly different (p < 0.05).
Figure 4.
The effects of enzyme treatments on the l-ascorbic acid contents of mulberry juice. The values are mean ± SD (n = 3). Means sharing different letters are significantly different (p < 0.05).

Figure 5.
The effects of enzyme treatments on the total phenolic content of mulberry juice. The values are mean ± SD (n = 3). Means sharing different letters are significantly different (p < 0.05).
Figure 5.
The effects of enzyme treatments on the total phenolic content of mulberry juice. The values are mean ± SD (n = 3). Means sharing different letters are significantly different (p < 0.05).

Figure 6.
The effects of enzyme treatments on the total anthocyanin content of mulberry juice. The values are mean ± SD (n = 3). Means sharing different letters are significantly different (p < 0.05).
Figure 6.
The effects of enzyme treatments on the total anthocyanin content of mulberry juice. The values are mean ± SD (n = 3). Means sharing different letters are significantly different (p < 0.05).
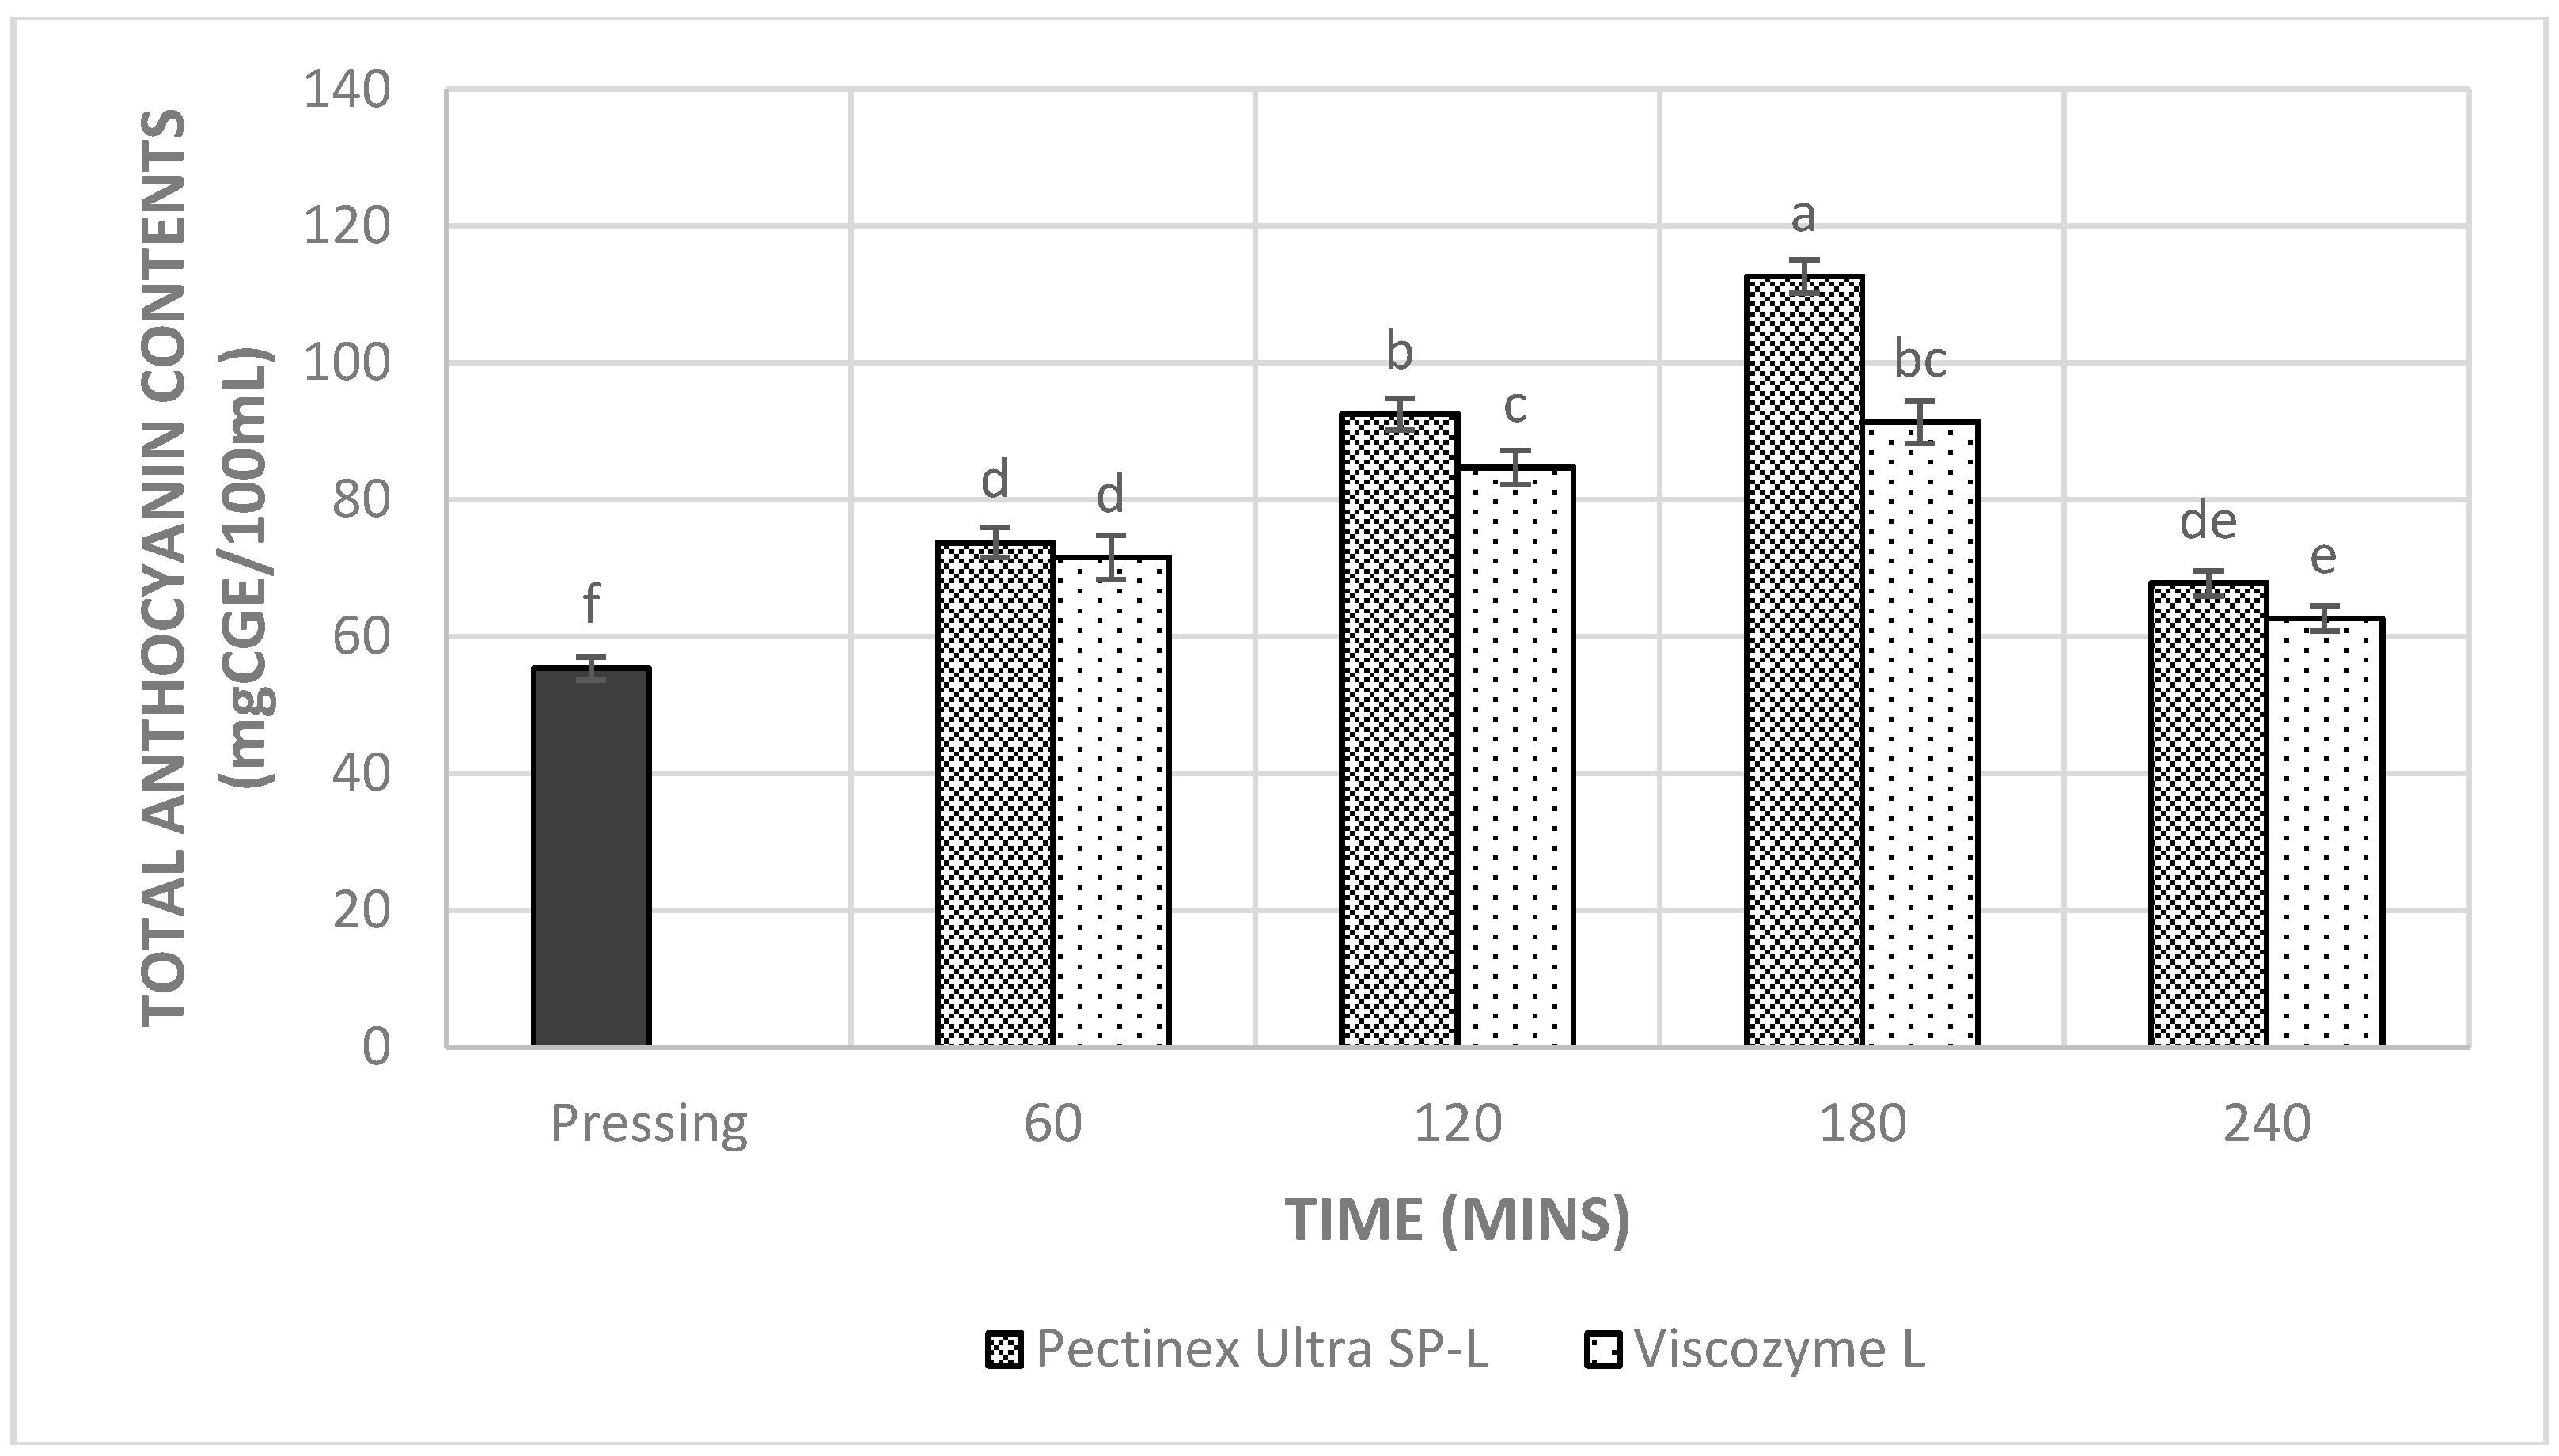
Figure 7.
The effects of enzyme treatments on the antioxidant capacity of mulberry juice. The values are mean ± SD (n = 3). Means sharing different letters are significantly different (p < 0.05).
Figure 7.
The effects of enzyme treatments on the antioxidant capacity of mulberry juice. The values are mean ± SD (n = 3). Means sharing different letters are significantly different (p < 0.05).


Table 1.
Correlation coefficients (r2) between antioxidant capacities (% DPPH inhibition), total phenolics, total anthocyanins and ascorbic acid contents in the mulberry juice.
Table 1.
Correlation coefficients (r2) between antioxidant capacities (% DPPH inhibition), total phenolics, total anthocyanins and ascorbic acid contents in the mulberry juice.
| Enzymes | l-Ascorbic Acid Contents (mg/100 mL) | Total Phenolic Contents (mgGAE/100 mL) | Total Anthocyanin Contents (mg Cyanidin-3-Glucoside/100 mL) | |
|---|---|---|---|---|
| Pectinex Ultra SP-L | Antioxidant capacities (%DPPH inhibition) | 0.649 * | 0.837 * | 0.682 * |
| Viscozyme L | 0.465 * | 0.632 * | 0.552 * |
Significance: * p < 0.05.
Table 2.
Results of two-way ANOVA for the different analytical parameters measured in mulberry juice.
Table 2.
Results of two-way ANOVA for the different analytical parameters measured in mulberry juice.
| Yield (%) | Total Soluble Solid (oBrix) | Total Acidity (%) | l-Ascorbic Acid Contents (mg/100 mL) | Total Phenolic Contents (mgGAE/100 mL) | Total Anthocyanin Contents (mg Cyanidin-3-Glucoside/100 mL) | Antioxidant Capacity (%DPPH Inhibition) | |
|---|---|---|---|---|---|---|---|
| Significance | |||||||
| Enzymes | * | * | * | * | * | * | * |
| Incubation time | * | * | * | * | * | * | * |
| Interactions | * | * | * | * | * | * | * |
Significance: * p < 0.05.
© 2018 by the authors. Licensee MDPI, Basel, Switzerland. This article is an open access article distributed under the terms and conditions of the Creative Commons Attribution (CC BY) license (http://creativecommons.org/licenses/by/4.0/).
Share and Cite
MDPI and ACS Style
Nguyen, C.L.; Nguyen, H.V.H. The Quality of Mulberry Juice as Affected by Enzyme Treatments. Beverages 2018, 4, 41. https://0-doi-org.brum.beds.ac.uk/10.3390/beverages4020041
AMA Style
Nguyen CL, Nguyen HVH. The Quality of Mulberry Juice as Affected by Enzyme Treatments. Beverages. 2018; 4(2):41. https://0-doi-org.brum.beds.ac.uk/10.3390/beverages4020041
Chicago/Turabian StyleNguyen, Chi L., and Ha V. H. Nguyen. 2018. "The Quality of Mulberry Juice as Affected by Enzyme Treatments" Beverages 4, no. 2: 41. https://0-doi-org.brum.beds.ac.uk/10.3390/beverages4020041
Note that from the first issue of 2016, this journal uses article numbers instead of page numbers. See further details here.