The Effects of Storage Temperature on the Aroma of Whole Bean Arabica Coffee Evaluated by Coffee Consumers and HS-SPME-GC-MS


1
Department of Food Science, The Pennsylvania State University, 202 Food Science Building, State College, PA 16802, USA
2
Sensory Evaluation Center, The Pennsylvania State University, 202 Food Science Building, State College, PA 16802, USA
*
Author to whom correspondence should be addressed.
Beverages 2018, 4(3), 68; https://0-doi-org.brum.beds.ac.uk/10.3390/beverages4030068
Submission received: 15 August 2018
/
Revised: 30 August 2018
/
Accepted: 4 September 2018
/
Published: 6 September 2018
(This article belongs to the Special Issue Coffee and its Consumption: Benefits and Risks)
Abstract
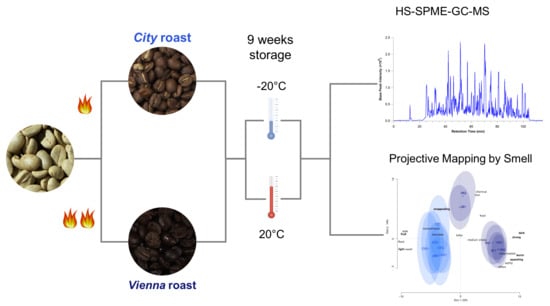
:Although from a food safety point, coffee is considered a shelf-stable product, changes in volatiles over time due to out-gassing and chemical reactions lead to perceivable differences in coffee aroma and “freshness”. Previous studies have looked at the impact of storage conditions on ground or brewed coffee. This study seeks to answer the question of how coffee consumers perceive the smell of coffee grounds of whole beans that have been stored under different conditions: freezer vs. room temperature for 9 weeks compared to a newly roasted control (stored for 1 day). Green beans from the same production lot were roasted to two different levels to also evaluate the impact of roast level on aroma changes. Using projective mapping (PM) followed by ultra-flash profiling (UFP), 48 coffee consumers evaluated, using only smell, 6 different freshly ground coffee samples presented in blind duplicates. In parallel, the profiles of 48 previously reported important coffee volatiles were measured by headspace-solid phase microextraction-gas chromatography-mass spectrometry (HS-SPME-GC-MS) to relate chemical changes to perceivable sensory aroma changes. Overall, consumer product maps mimicked the instrumental measurements in that the lighter roast coffees showed smaller changes due to storage conditions compared to the dark roast samples. Consumers also perceived the frozen dark roast samples to be more similar to the newly roasted control than the samples stored at room temperature.
1. Introduction
Coffee consumption is a common ritual among a variety of cultures throughout the world. Aside from the energizing effects of caffeine, brewed coffee contains a complex mixture of tastes and aromas that make up the sensory experience of its unique flavor [1]. Many of the chemical compounds that contribute to the flavor of coffee are produced during roasting. Maillard reaction products, which are created by reactions between free amines and reducing sugars when they are heated, make a major contribution to the aroma and color of roasted coffee [2,3]. The specific products of these reactions depend on the chemical makeup of the coffee beans and parameters in the roasting process, such as time and temperature.
There is a growing industry of coffee producers who focus on roasting single-origin beans with specific roast parameters in order to highlight flavors and aromas that are unique to those beans. Generally, producers of these specialty coffees suggest that their product is consumed within a few weeks in order to experience some aromas that can quickly dissipate during storage [4,5]. Although coffee beans are a shelf-stable product, the loss of and change in aroma during storage creates a unique challenge for specialty coffee producers and consumers who view the freshness of coffee as an indicator of quality [6].
There is a large body of research on coffee aroma. Several studies have been conducted to narrow down the over 700 different volatiles identified in roasted and brewed coffee into a shorter list of key odorants [2,7]. It has also been demonstrated that gas diffusion out of roasted coffee beans leads to an overall decrease in the level of specific volatile compounds that are correlated with “fresh” smelling coffee [6,8,9], and that this loss of volatiles is correlated with a decrease in consumer liking [4].
Anecdotally, to combat the loss of aroma that occurs during prolonged storage due to out-gassing and chemical reactions, such as oxidation [6,9,10], some consumers have adopted the practice of storing their coffee beans in the freezer. In theory, this practice should slow down any staling reactions or loss of volatiles and, therefore, preserve the aroma of the beans when compared to room temperature storage. Several studies have investigated this practice using brewed coffee [3] and ground coffee pads [5] as models, and have shown that low-temperature storage does preserve the headspace concentration of some volatile compounds when compared to room temperature storage. Despite this previous work, only a few studies used roasted, whole bean coffee as a model [11]. Investigating this practice using freshly ground whole beans could provide more applicable information for producers and consumers of specialty coffees, as well as cafés that often buy whole bean coffee in bulk for service. Further, using coffee consumers instead of relying on instrumental measurements or trained panels provides further ecological validity and uncovers how the reported changes in coffee aroma composition and/or sensory attributes affect consumer perception of coffee freshness and acceptability.
Projective mapping (PM) is a holistic sensory technique that is often employed to detect degrees of difference and similarity between products [12]. Trained or untrained participants evaluate a product set either overall or for a specific sensory attribute (taste, aroma, texture, etc.) and arrange the samples on a two-dimensional map in a manner that places similar samples in close proximity to one another, while dissimilar samples are placed further away [13]. PM has been applied to a variety of food products including juices [14], wine [15], and yogurt [16], as well as non-food products (e.g., [17]), but no studies could be found that applied PM to coffee beans.
The current study seeks to answer the question of whether storing roasted, whole bean coffee in the freezer is an effective way to preserve its aroma, using coffee consumers that evaluate freshly ground coffee by smell. Further, light and dark roast samples made from the same green coffee beans were investigated side-by-side to determine how the rate of aroma loss during storage is affected by the roast level.
2. Materials and Methods
2.1. Experimental Design
The study included a total of six samples corresponding to different roast levels (a light “City” and a dark “Vienna” roast; see Figure 1) and different post-roasting storage temperatures: (i) 9 weeks at −20 °C (freezer F); (ii) 9 weeks at 25 °C (room temperature R); and (iii) a freshly roasted control stored for 1 day at 25 °C prior to evaluation (newly roasted N). All samples were removed from their respective storage conditions 1 day before the evaluation and allowed to reach room temperature overnight.
2.2. Roasting and Storage Conditions
Zambia Kasama Estates green coffee (10 kg from the same bag) was purchased from SweetMaria’s.com due to comments regarding its ability to be roasted across a wide range of levels. The coffee was roasted in five batches of 250.0 g ± 0.1 g for 16 min for a light roast (“City”; ejected 20–30 s after first crack ended; average mass loss 14.6 ± 0.1% (w/w) (n = 5)) and 18 min for a dark roast (“Vienna”; ejected after second crack ended; average mass loss 18.6 ± 0.1% (w/w) (n = 5)) with a home coffee roaster (Hottop USA, Cranston, RI, USA). The color of the two different roasts was measured with a colorimeter (Minolta, Ramsey, NJ, USA; 2° observer, D65 illuminant): City (n = 6): L* = 21.2 ± 1.83, a* = 11.2 ± 0.251; b* = 23.5 ± 0.374; Vienna (n = 6): L* = 14.3 ± 0.522, a* = 10.1 ± 0.286; b* = 17.4 ± 0.587. After roasting, each coffee batch rested for 15 hours in open paper bags before being combined and transferred to amber glass containers for storage. Room temperature-stored coffees were stored in a dark cabinet, undisturbed until the day before the sensory analysis. Freezer temperature-stored coffees were stored at the bottom of a chest freezer set at −18 °C, and were left undisturbed until the day before the sensory analysis. Control samples for both roast levels were roasted, using the same parameters, the day before the sensory testing and rested for 15 h in open paper bags. For all roast batches, oven temperature, fan speed, and heater intensity data were collected every minute to ensure comparable roasting profiles. Time to first crack and first crack duration (all batches) and time to second crack and second crack duration (dark roast batches) were collected to ensure consistency between batches.
2.3. Sensory Analysis
Sensory procedures were deemed exempt by the Penn State Institutional Review Board (IRB) based on the wholesome food exemption (IRB protocol # 33164). All panelists provided consent and were compensated for their time. Potential participants, recruited from an online database from the State College area, were screened with an online questionnaire for coffee consumption habits and general demographic information, selected if they drank coffee at least 4×/week, and invited to the Sensory Evaluation Center (SEC) for one projective mapping (PM) session. The PM task was set up similarly to Nestrud et al. [14] and Hopfer and Heymann [13], providing only limited instructions:
“In front of you are 12 samples of ground coffee beans. Your task is to evaluate the aroma (smelling ONLY) of each sample according to your own criteria. There are no right or wrong answers. For each sample, remove the lid and smell the contents of the glass. You may take notes about the aroma of each sample on the notepad provided. Once you have smelled each sample, place the glasses on the large paper in front of you in a manner that positions very similar smelling samples close to each other: the more similar the samples, the closer they should be to one-another. You may group samples together if they smell very similar or the same. Samples that are very different should be placed far apart. Do not hesitate to make use of the entire area of the sheet provided. There are no restrictions as to the size of the groups or the total number of groups you make.”
Each of the six different coffees was freshly ground the day of the sensory test, and a 1 tbsp (~5 g) sample was portioned into black wine tasting glasses to remove biasing from sample color and facilitate aroma evaluation of the coffee grounds. All glasses were covered with an odor-free cardboard lid, and samples were freshly prepared every 2 h in a separate room.
Participants (n = 48; 14 males; 18–66 years) were presented with the six coffee samples in blind duplicates for a total of 12 samples that were identified by three-digit blinding codes. Panelists were asked to arrange them by smell only on a 63 cm × 63 cm sheet of white paper. After the panelists were satisfied with the placement of their samples, they were asked to remove the wine glasses from the paper one at a time and write the three-digit blinding code of the sample in the space that the wine glass occupied. Finally, the panelists were asked to circle any groups of similar samples and provide descriptors for each group before they entered responses to demographic and coffee consumption questions into an iPad running Compusense Cloud (Guelph, ON, Canada). In previous studies, it was noted that some participants were not able to transfer their product map accurately to a computer screen (e.g., [13,17]). Therefore, to ensure consistency, one researcher transferred the product arrangements of each participant from the paper to the Compusense Cloud using an iPad.
2.4. Instrumental Analysis with HS-SPME-GC-MS
In addition to the human evaluation of the ground coffee samples, volatile profiles of each sample were collected in analytical triplicate by headspace-solid phase microextraction-gas chromatography-mass spectrometry (HS-SPME-GC-MS). Then, 2.00 ± 0.05 g of freshly ground coffee was weighed into a 20 mL amber HS vial (Restek, Bellefonte, PA, USA) and capped with a bi-metal magnetic crimp cap (Supelco, Bellefonte, PA, USA). Method parameters were optimized based on prior work and included a 5 min equilibration at 37 °C, followed by 30 min extraction with a 2 cm DVB/Car/PDMS SPME fiber (Supelco) and an MPS robotic autosampler (Gerstel U.S., Linthicum Heights, MD, USA). Using a 7890B-5977B GC-MS (Agilent Technologies, Wilmington, DE, USA), extracted volatiles were injected into the 250 °C hot inlet equipped with a SPME inlet liner (Supelco) in splitless mode (1.2 min) and separated on a Rtx-WAX capillary column (30 m × 0.25 mm × 0.25 μm; Restek) operated at a constant helium carrier gas flow of 1 mL/min, using an oven program as follows: 30 °C for 3 min, ramp of 3 °C/min to 150 °C, a second ramp of 30 °C/min to 250 °C with a final hold time of 14 min. The MS transfer line, quadrupole, and detector temperatures were set to 250 °C, 200 °C, and 150 °C, respectively. EI spectra were collected in scan mode from 32 to 350 amu, with 5.14 scans per second. From the collected GC-MS data, 48 previously reported coffee aroma compounds were identified based on their spectral and retention index match with libraries. Peak areas (selected ion chromatograms; Table S1) were used for further data analysis.
2.5. Data Analysis
For each panelist’s PM map, x- and y-coordinates for each sample, as well as descriptors and sample groupings, were recorded. Data were analyzed with multi-factor analysis (MFA), using the x- and y-coordinates, as well as frequencies for descriptors [18]. Confidence ellipses were simulated based on a parametric bootstrapping algorithm [19], and Hotelling’s T2-test was used to determine whether samples show significant multivariate differences [20]. Descriptors provided by the panelists were semantically grouped before analysis [21], and frequencies for each category and coffee sample were used for analysis. Descriptor frequencies were also analyzed by Cochrane’s Q-test for significant differences across products. R (v. 3.3.3, Vienna, Austria) and RStudio (v. 1.0.136, Boston, MA, USA) with the additional packages FactoMineR, SensoMineR, agricolae, and RVAideMemoire [22,23,24] were used.
3. Results
3.1. Coffee Consumers Group Identical Samples and Separate Coffees Based on Roast Level and Storage Condition
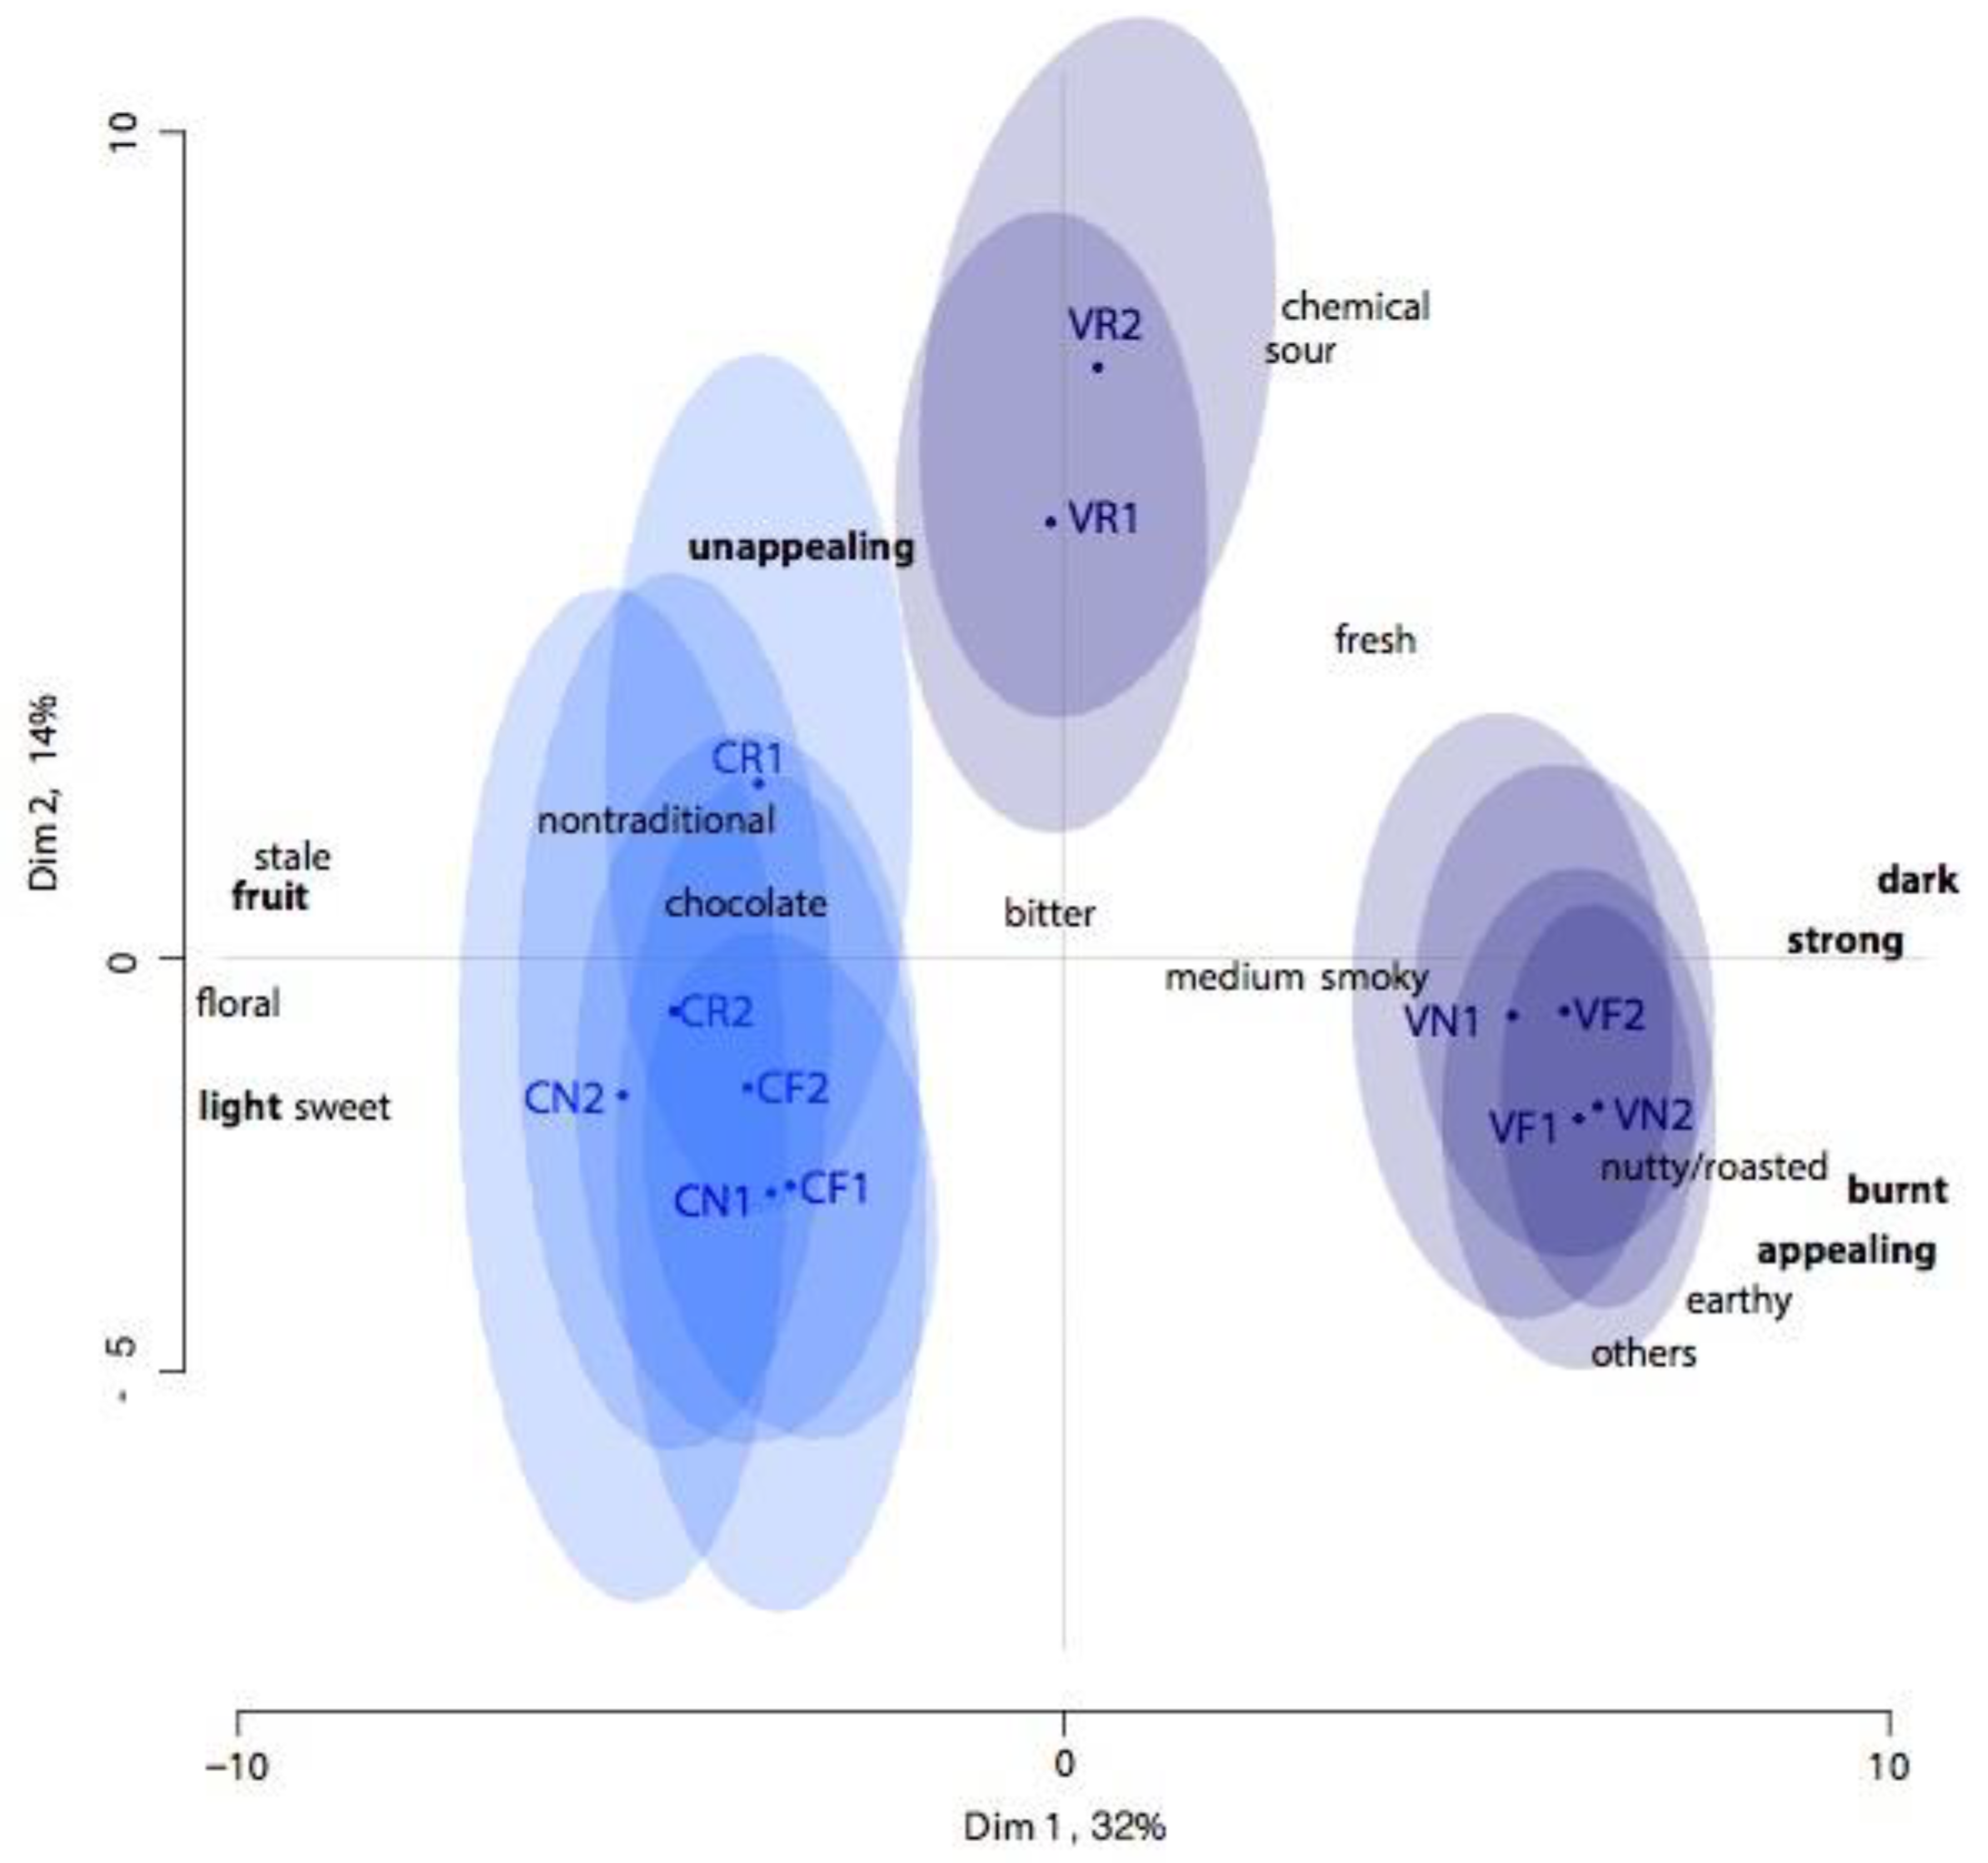
In Figure 2, the consensus product map for the 12 evaluated coffee samples shows that coffee consumers were able to discriminate between light and dark roast coffees, as all light roast “City” samples are positioned on the left-hand side of the MFA map while all dark roast “Vienna” coffee samples are positioned on the right-hand side. Further, the 95% confidence ellipses obtained via a bootstrapping algorithm do not overlap between the two roast levels, indicating that the coffee samples smelled perceivably different. Overall, coffee consumers were also able to place the blind duplicate samples close to each other, with all blind duplicated samples showing overlapping confidence ellipses. This indicates that participants perceived the duplicated samples as similar and that participants were able to execute the PM task.
Roast level separates the samples along the first dimension, explaining 32% of the overall variance, with the lighter roast “City” samples on the left-hand side and the darker roast “Vienna” coffees on the right-hand side of the map. Along the second dimension, explaining another 14% of the total variance, samples are separated due to storage conditions, with freshly roasted and freezer-stored samples positioned at the bottom of the map and room temperature-stored coffee samples positioned towards the center or top of the map.
Looking within the two different roast levels, it becomes apparent that differences due to storage conditions are more dramatic for the dark roast “Vienna” samples than the light roast “City” samples. All “City” roast samples are placed close to each other with overlapping confidence ellipses, indicating that the changes due to storage conditions (fresh roast CN vs. freezer storage CF vs. room temperature storage CR) are less apparent for the lighter roast coffee. In contrast, for the dark roast “Vienna” samples, storage conditions led to perceivable and clear differences with consumers positioning the room temperature-stored samples (VR) far from the freshly roasted VN and freezer-stored VF “Vienna” samples. These differences are also statistically significant as the confidence ellipses of the VR samples do not overlap with any of the other dark roast (VN, VF) or light roast (CN, CF, CR) samples.
3.2. Coffee Consumers Are Able to Describe Aroma Differences That Reflect Changes in Aroma Composition
As panelists were asked to provide descriptors for each of the groups, insight into the qualitative differences between the samples was obtained. Out of the 48 participants, 45 provided descriptors for at least one of the samples. The descriptors included both hedonic (e.g., appealing, unappealing) and descriptive (e.g., dark, light, floral, roasted) terms and were semantically grouped into 21 categories. Of the 21 categories, dark, light, unappealing, appealing, strong, burnt, and fruit differed significantly between the samples (p < 0.1) by Cochrane’s Q-test. These descriptors also align with the product separation as seen in Figure 2. Along the first dimension, dark roast samples VF and VN on the right are significantly more often described as dark, strong, and burnt while light roast samples CN, CF, and, to some degree, CR are described by light and fruit aromas. Along the second dimension, driven by the storage conditions, samples are described as appealing on the negative axis and unappealing on the positive axis. The room temperature-stored dark roast samples VR and, to some degree, the light roast equivalent CR are both described by participants as unappealing, indicating that room temperature storage led to coffee aroma that was not attractive to coffee consumers.
Of further note is that participants used basic tastes, such as sweet, sour, and bitter, to describe the aromas of the coffee samples, demonstrating once again that consumers associate certain aromas with particular tastes, such as the smell of caramel with sweet and the smell of lemon with sour [25,26].
Overall, participants provided both hedonic and qualitative terms to describe the aromas of the coffee samples. These terms aided in the interpretation of the projective map and support the PM findings that (i) participants differentiated samples both with regard to roast level as well as storage conditions; and (ii) were able to describe those differences with both hedonic and descriptive terms.
3.3. Instrumental Volatile Analysis Separates Coffees Based on Roast Level and Storage Conditions
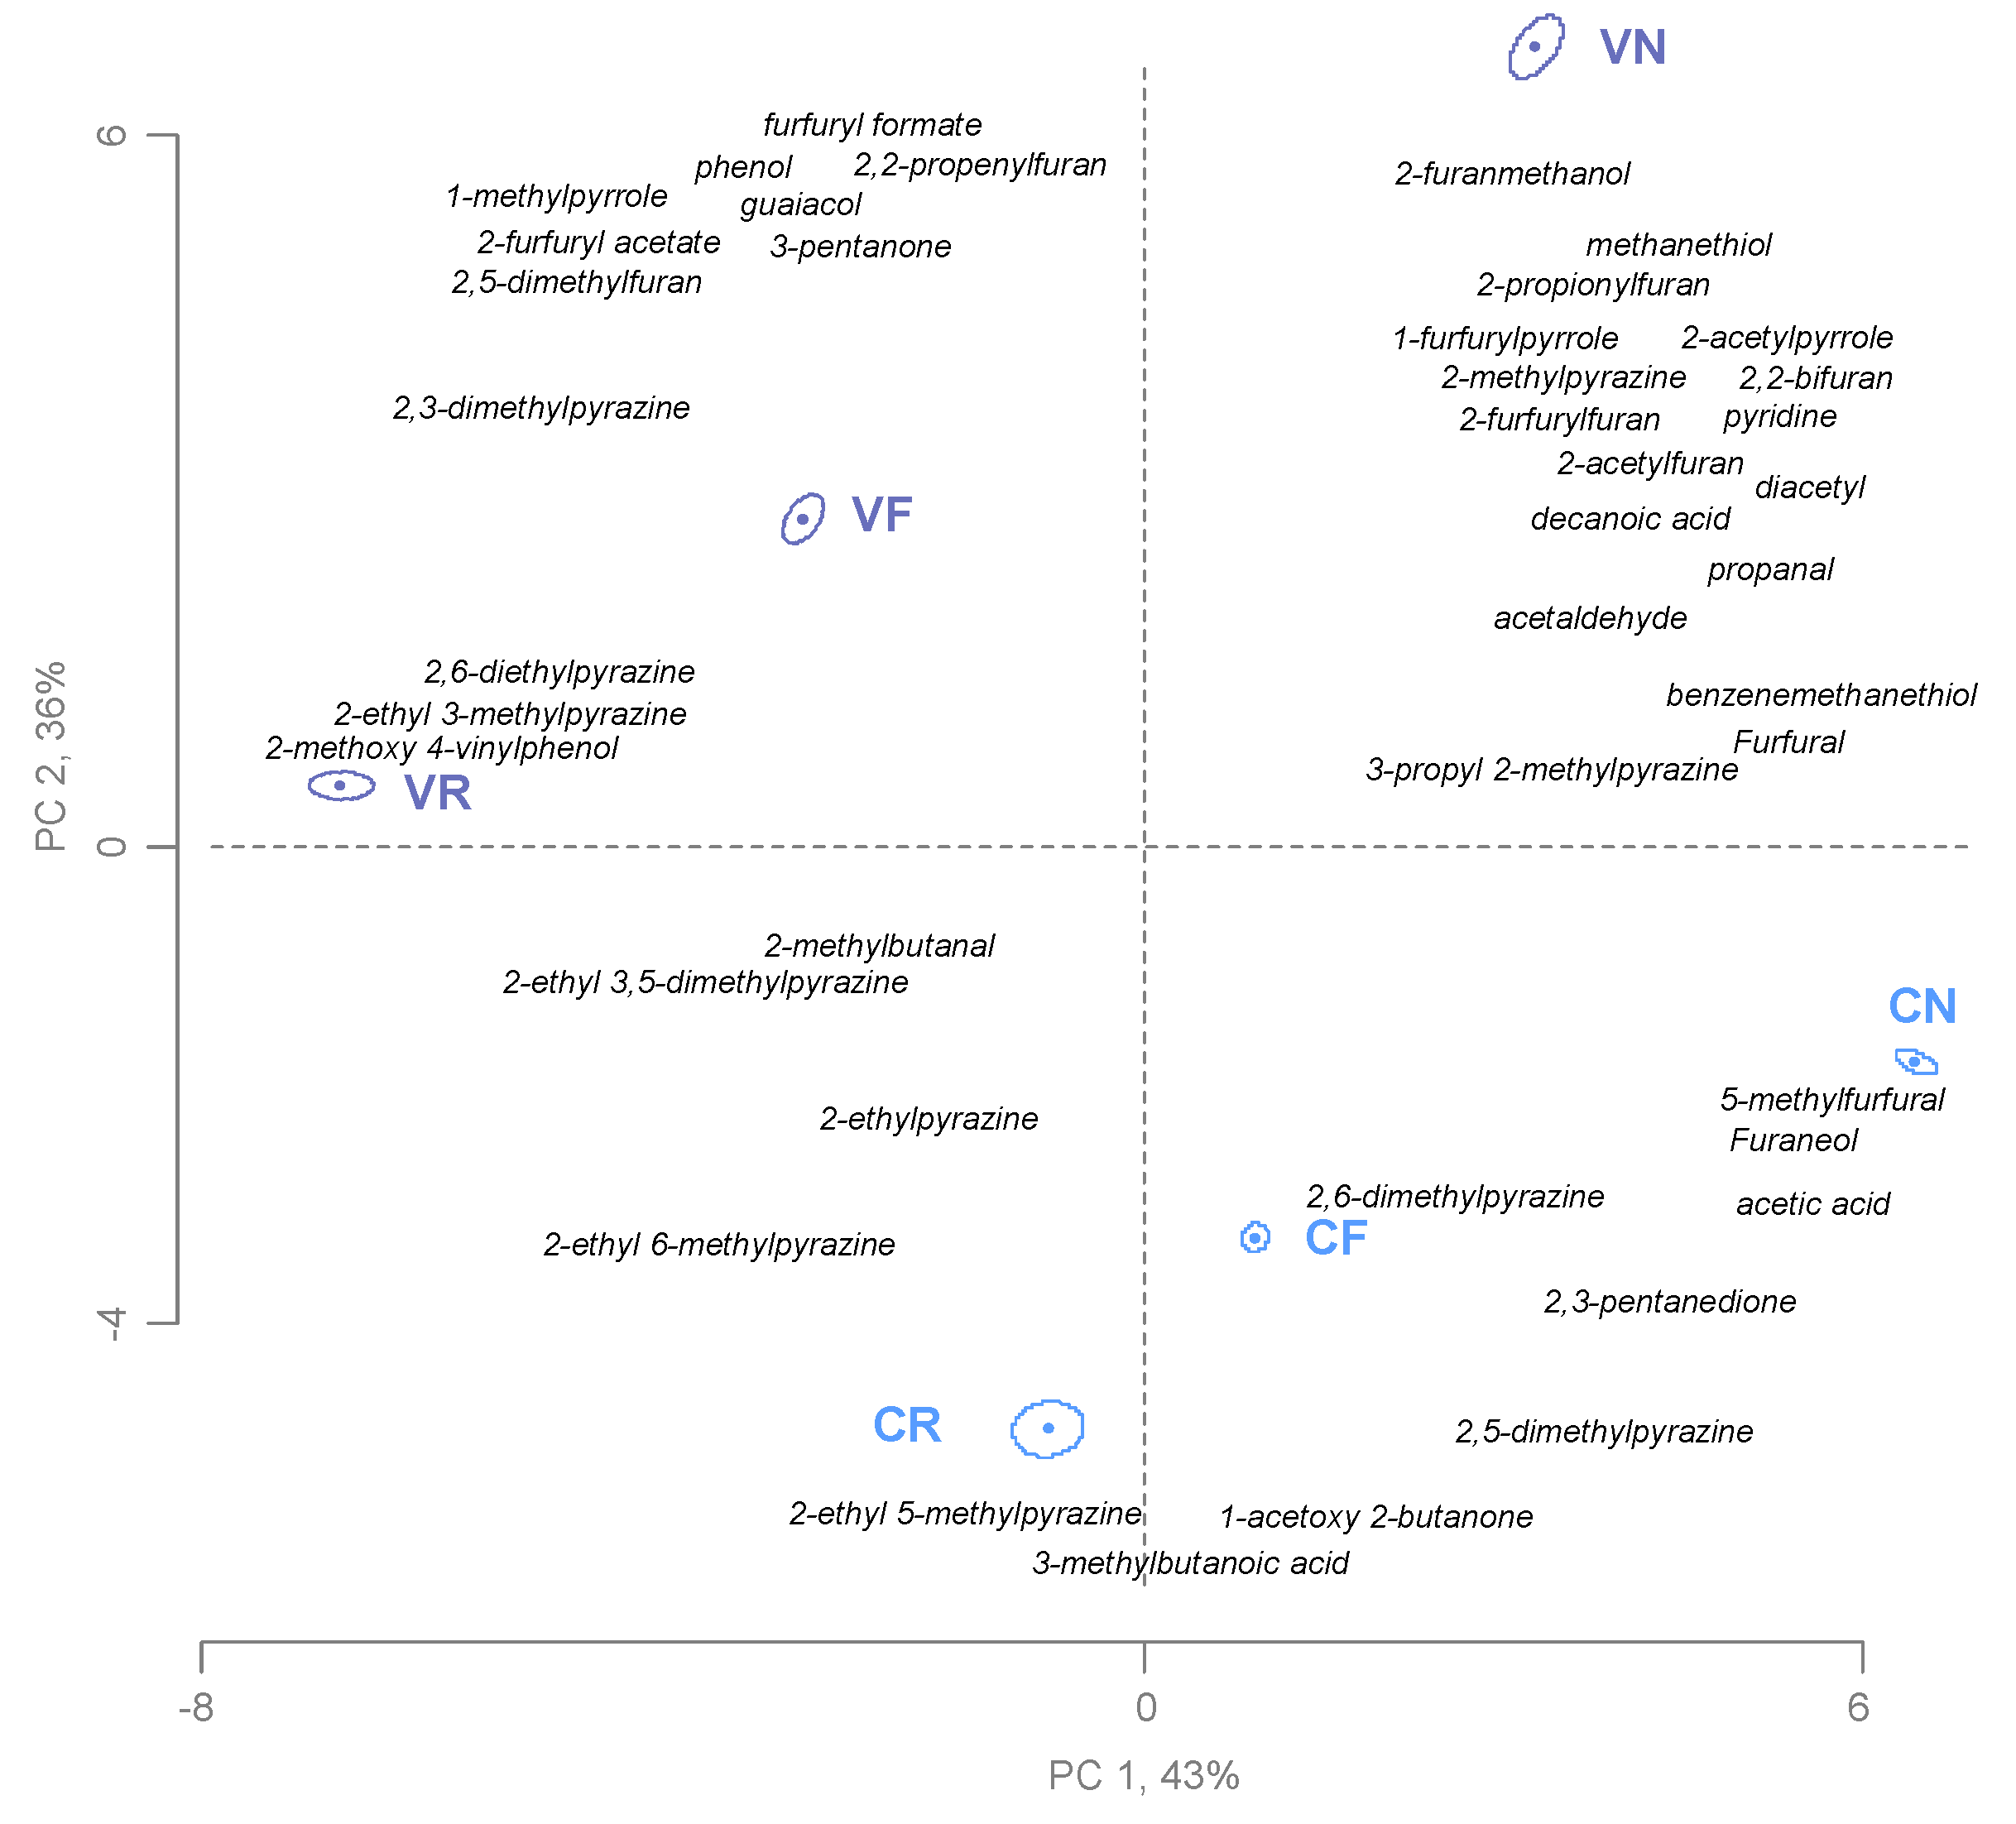
Figure 3 displays the principal component analysis (PCA) biplot of the HS-SPME-GC-MS analysis of coffee volatiles. Similar to the PM task, samples are again separated by both roast level and storage conditions with dark roast “Vienna” samples in the top two quadrants and the light roast “City” samples in the bottom half of the PCA plot. Larger sample differences compared to the PM are found as the 95% confidence intervals are small and do not overlap for any of the samples. Samples are also all significantly different from each other (p < 0.05) by the Hotelling T2-test.
In contrast to the sensory evaluation where samples are separated along the first dimension due to roast level, in the volatile analysis samples are separated by storage conditions along the first principal component (PC 1), explaining 43% of the total variance. Another 36% of the total variance is explained by PC 2, which separates coffees by roast level. Similar to the PM task, differences within the roast level seem to be larger for the dark roast “Vienna” samples as they are positioned further apart from each other than the light roast “City” coffees. Especially, the newly roasted dark roast coffee VN is positioned very far from the two stored coffees, VF and VR.
Looking into the individual differences of aroma compounds, it becomes apparent that storage leads to a loss of lighter volatiles, such as methanethiol, 2-acetylfuran, diacetyl, propanal, and acetaldehyde, as these compounds show higher abundance in the newly roasted samples VN and CN (Table S1). This is in agreement with other studies, such as Bröhan et al. [5] who found a decrease in these lighter volatiles over a storage period of 21 days, with higher losses for storage at room temperature compared to 4 °C. Significant loss to non-detectable levels after a 9-week storage period was found for 2,2-bifuran, 2-acetylpyrrole, 2-furfurylfuran, 2-furfurylmethylsulfide, benzenemethanethiol, diacetyl, decanoic acid, furfural, and methanethiol, with the latter being present at about 50% of the original levels in the freezer-stored samples VF and CF, but not detected in the room temperature-stored CR and VR (Table S1).
The stored coffees, especially the dark “Vienna” roast samples stored at room temperature VR, are characterized by higher levels of larger pyrazines, pyrroles, and furans, besides some phenolic compounds. Dark roast “Vienna” coffee stored in the freezer (VF) or at room temperature (VR) showed the highest level in phenol and 2,5-dimethylfuran, two compounds that have recently been suggested as markers for dark roast and baked roast defect [27]. As both compounds are present in all coffees (Table S1), this would imply a loss of other volatiles during storage, allowing these defects and their associated markers to become more readily detectable.
Generally, dark roast coffees showed higher abundance of most compounds, except for 1-acetoxy-2-butanone, 2,3-pentanedione, 2,5-dimethylpyrazine, 2,6-dimethylpyrazine, 2-ethyl 5-methylpyrazine, 5-methylfurfural, acetaldehyde, and acetic acid, which showed significantly higher levels in the light roast “City” samples (Table S1). This agrees with previous reports of overall higher volatile levels in darker roast samples due to increased Maillard reactions and lipid degradation, but lower levels of organic acids (e.g., acetic acid) [27].
Overall, the instrumental analysis of coffee aroma volatiles reflects the sensory perception captured by the PM task in that the 48 selected aroma compounds previously reported in coffee were able to capture significant changes in the roasted coffee samples due to roast level and storage conditions. The observed differences due to storage conditions were larger in the dark roast “Vienna” samples with dramatic losses of aroma compounds considered important for fresh coffee aroma (e.g., methanethiol, 2-acetylfuran, 1-furfurylpyrrole; Table S1).
4. Discussion and Conclusions
Although from a food safety point, coffee is considered a shelf-stable product, changes in roasted coffee aroma over time due to out-gassing and chemical reactions lead to perceivable differences in coffee aroma and “freshness” [4,6]. While previous studies looked at the impact of storage conditions on ground or brewed coffee, this study used coffee consumers to determine the impact of the roast level and storage conditions on the aroma of freshly ground coffee beans. Consumers arranged a total of 12 samples (6 different coffees presented in blind duplicates) in a PM task and provided descriptors for the groups and samples. The created product consensus maps showed high agreement among the consumers in how they perceived the coffees, with a clear separation between light and dark roast samples. Light roast coffees were described by the consumers as light, sweet, floral, fruit, chocolate, and non-traditional while dark roast coffees elicited terms such as dark, strong, smoky, nutty/roasted, earthy, burnt, and appealing.
Changes in coffee aroma due to storage conditions were also picked up by the consumers as newly roasted, freezer-stored, and room temperature-stored coffees were separated. The light roast samples seem to differ to a smaller degree among the three storage conditions while the dark roast coffees showed less perceivable differences between the newly roasted and freezer-stored coffees, but those two samples clearly differed from the room temperature-stored dark roast coffee. This could be explained by differences in overall volatile content. Previous studies showed that light roast coffees overall show lower levels of instrumentally measured aroma volatiles [27], which could explain less aroma resulting from lightly roasted beans. This observation was substantiated by the instrumental measurements of 48 previously reported important coffee volatiles, which showed more volatiles decreasing to a larger extent in the dark roast coffees from the newly roasted to the stored samples.
Based on these findings, we recommend storing newly roasted beans in a freezer and refrain from storing at room temperature. This is especially important for dark roast coffee where the changes were much more dramatic compared to the light roast samples.
While this study provides some first important insights, future work is needed to determine whether these findings transfer to other single origins or roast levels, as coffee roasting is a very complex processing step and the outcome is highly dependent on the green bean starting material, as well as the roasting conditions. Secondly, in this study, consumers only smelled the freshly ground beans but did not taste the brewed coffee. Although many coffee consumers smell coffee, it would be important to test whether similar trends would be found if the coffees were tasted. Third, it would be worthwhile to test whether a more focused test, such as a discrimination test, would allow consumers to pick up smaller differences between the samples. Especially for the light roast samples that were perceived as being more similar, independent of the storage condition, a discrimination test could lead to better product differentiation. Last, it would also be interesting to test whether the level of expertise or involvement matter in how small a difference between coffee samples could be picked up by consumers in a PM task. For example, beer enthusiasts showed higher agreement with beer professionals than beer novices in a PM task of premium Danish beers [21] and, similarly, Italian wine consumers with high knowledge displayed similar perception of similarities as wine professionals (winemakers, enologists) [28].
Overall, consumer product maps mimicked the instrumental measurements in that the lighter roast coffees showed smaller changes due to storage conditions compared to the dark roast samples. In addition, consumer evaluation results showed that the frozen dark roast sample was perceived as being more similar to the newly roasted control than the sample stored at room temperature.
Supplementary Materials
The following are available online at https://0-www-mdpi-com.brum.beds.ac.uk/2306-5710/4/3/68/s1, Table S1: Peak areas (n = 3) of selected volatiles detected by HS-SPME-GC-MS in the coffee samples. Rows that share the same letter are not significantly different by Tukey’s post-hoc means comparison (p < 0.05) (freezer storage “F”; room temperature storage “R”; and newly roasted “N”).
Author Contributions
Conceptualization, Methodology, Investigation, Data Analysis, Writing and Reviewing: A.R.C. and H.H.
Funding
This research was funded by a College of Agricultural Sciences Undergraduate Research award and USDA National Institute of Food and Agriculture Federal Appropriations under Project PEN04624 and Accession number 1013412.
Acknowledgments
We thank all sensory participants as well as all students and staff of the Sensory Evaluation Center for their help with this project. We thank Scott Frost for valuable comments on earlier versions of this manuscript.
Conflicts of Interest
The authors declare no conflict of interest. The founding sponsors had no role in the design of the study; in the collection, analyses, or interpretation of data; in the writing of the manuscript, and in the decision to publish the results.
References
- Sunarharum, W.B.; Williams, D.J.; Smyth, H.E. Complexity of coffee flavor: A compositional and sensory perspective. Food Res. Int. 2014, 62, 315–325. [Google Scholar] [CrossRef]
- Blank, I.; Sen, A.; Grosch, W. Potent odorants of the roasted powder and brew of Arabica coffee. Z. Lebensm. Unters. Forsch. 1992, 195, 239–245. [Google Scholar] [CrossRef]
- López-Galilea, I.; Fournier, N.; Cid, C.; Guichard, E. Changes in headspace volatile concentrations of coffee brews caused by the roasting process and the brewing procedure. J. Agric. Food Chem. 2006, 54, 8560–8566. [Google Scholar] [CrossRef] [PubMed]
- Anese, M.; Manzocco, L.; Nicoli, M.C. Modeling the secondary shelf life of ground roasted coffee. J. Agric. Food Chem. 2006, 54, 5571–5576. [Google Scholar] [CrossRef] [PubMed]
- Bröhan, M.; Huybrighs, T.; Wouters, C.; Van der Bruggen, B. Influence of storage conditions on aroma compounds in coffee pads using static headspace GC-MS. Food Chem. 2009, 116, 480–483. [Google Scholar] [CrossRef]
- Yeretzian, C.; Blank, I.; Wyser, Y. Protecting the flavors-freshness as a key to quality. In The Craft and Science of Coffee; Britta, F., Ed.; Academic Press: Cambridge, MA, USA, 2017. [Google Scholar]
- Maeztu, L.; Sanz, C.; Andueza, S.; Paz De Peña, M.; Bello, J.; Cid, C. Characterization of espresso coffee aroma by static headspace GC-MS and sensory flavor profile. J. Agric. Food Chem. 2001, 49, 5437–5444. [Google Scholar] [CrossRef] [PubMed]
- Marin, K.; Požrl, T.; Zlatić, E.; Plestenjak, A. A new aroma index to determine the aroma quality of roasted and ground coffee during storage. Food Technol. Biotechnol. 2008, 46, 442–447. [Google Scholar]
- Yeretzian, C. Coffee. In Springer Handbook of Odor; Springer: Cham, Switzerland, 2017; pp. 107–128. [Google Scholar]
- Kreuml, M.T.L.; Majchrzak, D.; Ploederl, B.; Koenig, J. Changes in sensory quality characteristics of coffee during storage. Food Sci. Nutr. 2013, 1, 267–272. [Google Scholar] [CrossRef] [PubMed] [Green Version]
- Glöss, A.N.; Schönbächler, B.; Rast, M.; Deuber, L.; Yeretzian, C. Freshness indices of roasted coffee: Monitoring the loss of freshness for single serve capsules and roasted whole beans in different packaging. Chimia 2014, 68, 179–182. [Google Scholar] [CrossRef] [PubMed]
- Risvik, E.; McEwan, J.A.; Rødbotten, M. Evaluation of sensory profiling and projective mapping data. Food Qual. Prefer. 1997, 8, 63–71. [Google Scholar] [CrossRef]
- Hopfer, H.; Heymann, H. A summary of projective mapping observations—The effect of replicates and shape, and individual performance measurements. Food Qual. Prefer. 2013, 28, 164–181. [Google Scholar] [CrossRef]
- Nestrud, M.A.; Lawless, H.T. Perceptual mapping of citrus juices using projective mapping and profiling data from culinary professionals and consumers. Food Qual. Prefer. 2008, 19, 431–438. [Google Scholar] [CrossRef]
- Heymann, H.; Hopfer, H.; Bershaw, D. An exploration of the perception of minerality in white wines by projective mapping and descriptive analysis. J. Sens. Stud. 2014, 29, 1–13. [Google Scholar] [CrossRef]
- Cruz, A.G.; Cadena, R.S.; Castro, W.F.; Esmerino, E.A.; Rodrigues, J.B.; Gaze, L.; Faria, J.A.F.; Freitas, M.Q.; Deliza, R.; Bolini, H.M.A. Consumer perception of probiotic yogurt: Performance of check all that apply (CATA), projective mapping, sorting and intensity scale. Food Res. Int. 2013, 54, 601–610. [Google Scholar] [CrossRef]
- Mielby, L.H.; Hopfer, H.; Jensen, S.; Thybo, A.K.; Heymann, H. Comparison of descriptive analysis, projective mapping and sorting performed on pictures of fruit and vegetable mixes. Food Qual. Prefer. 2014, 35, 86–94. [Google Scholar] [CrossRef]
- Kostov, B.; Bécue-Bertaut, M.; Husson, F. Multiple factor analysis for contingency tables in the FactoMineR package. Rencontres 2013, 5, 29–38. [Google Scholar]
- Dehlholm, C.; Brockhoff, P.B.; Bredie, W.L.P. Confidence ellipses: A variation based on parametric bootstrapping applicable on Multiple Factor Analysis results for rapid graphical evaluation. Food Qual. Prefer. 2012, 26, 278–280. [Google Scholar] [CrossRef]
- Le, S.; Husson, F. Sensominer: A package for sensory data analysis. J. Sens. Stud. 2008, 23, 14–25. [Google Scholar] [CrossRef]
- Giacalone, D.; Ribeiro, L.; Frøst, M. Perception and description of premium beers by panels with different degrees of product expertise. Beverages 2016, 2, 5. [Google Scholar] [CrossRef] [Green Version]
- Lê, S.; Josse, J.; Husson, F. FactoMineR: An R package for multivariate analysis. J. Stat. Softw. 2008, 25, 1–18. [Google Scholar] [CrossRef]
- De Mendiburu, F. Agricolae: Statistical Procedures for Agricultural Research. Available online: https://cran.r-project.org/package=agricolae (accessed on 5 February 2018).
- Maxime, H. RVAideMemoire: Diverse Basic Statistical and Graphical Functions. 2016. Available online: https://CRAN.R-project.org/package=RVAideMemoire (accessed on 15 March 2018).
- Rozin, P. “Taste-smell confusions” and the duality of the olfactory sense. Percept. Psychophys. 1982, 31, 397–401. [Google Scholar] [CrossRef] [PubMed] [Green Version]
- Stevenson, R.J.; Prescott, J.; Boakes, R.A. Confusing tastes and smells: How odours can influence the perception of sweet and sour tastes. Chem. Senses 1999, 24, 627–635. [Google Scholar] [CrossRef] [PubMed]
- Yang, N.; Liu, C.; Liu, X.; Degn, T.K.; Munchow, M.; Fisk, I. Determination of volatile marker compounds of common coffee roast defects. Food Chem. 2016, 211, 206–214. [Google Scholar] [CrossRef] [PubMed]
- Torri, L.; Dinnella, C.; Recchia, A.; Naes, T.; Tuorila, H.; Monteleone, E. Projective Mapping for interpreting wine aroma differences as perceived by naïve and experienced assessors. Food Qual. Prefer. 2013, 29, 6–15. [Google Scholar] [CrossRef] [Green Version]
Figure 1.
Visuals of the six coffee samples evaluated by coffee consumers and by headspace-solid phase microextraction-gas chromatography-mass spectrometry (HS-SPME-GC-MS).
Figure 1.
Visuals of the six coffee samples evaluated by coffee consumers and by headspace-solid phase microextraction-gas chromatography-mass spectrometry (HS-SPME-GC-MS).
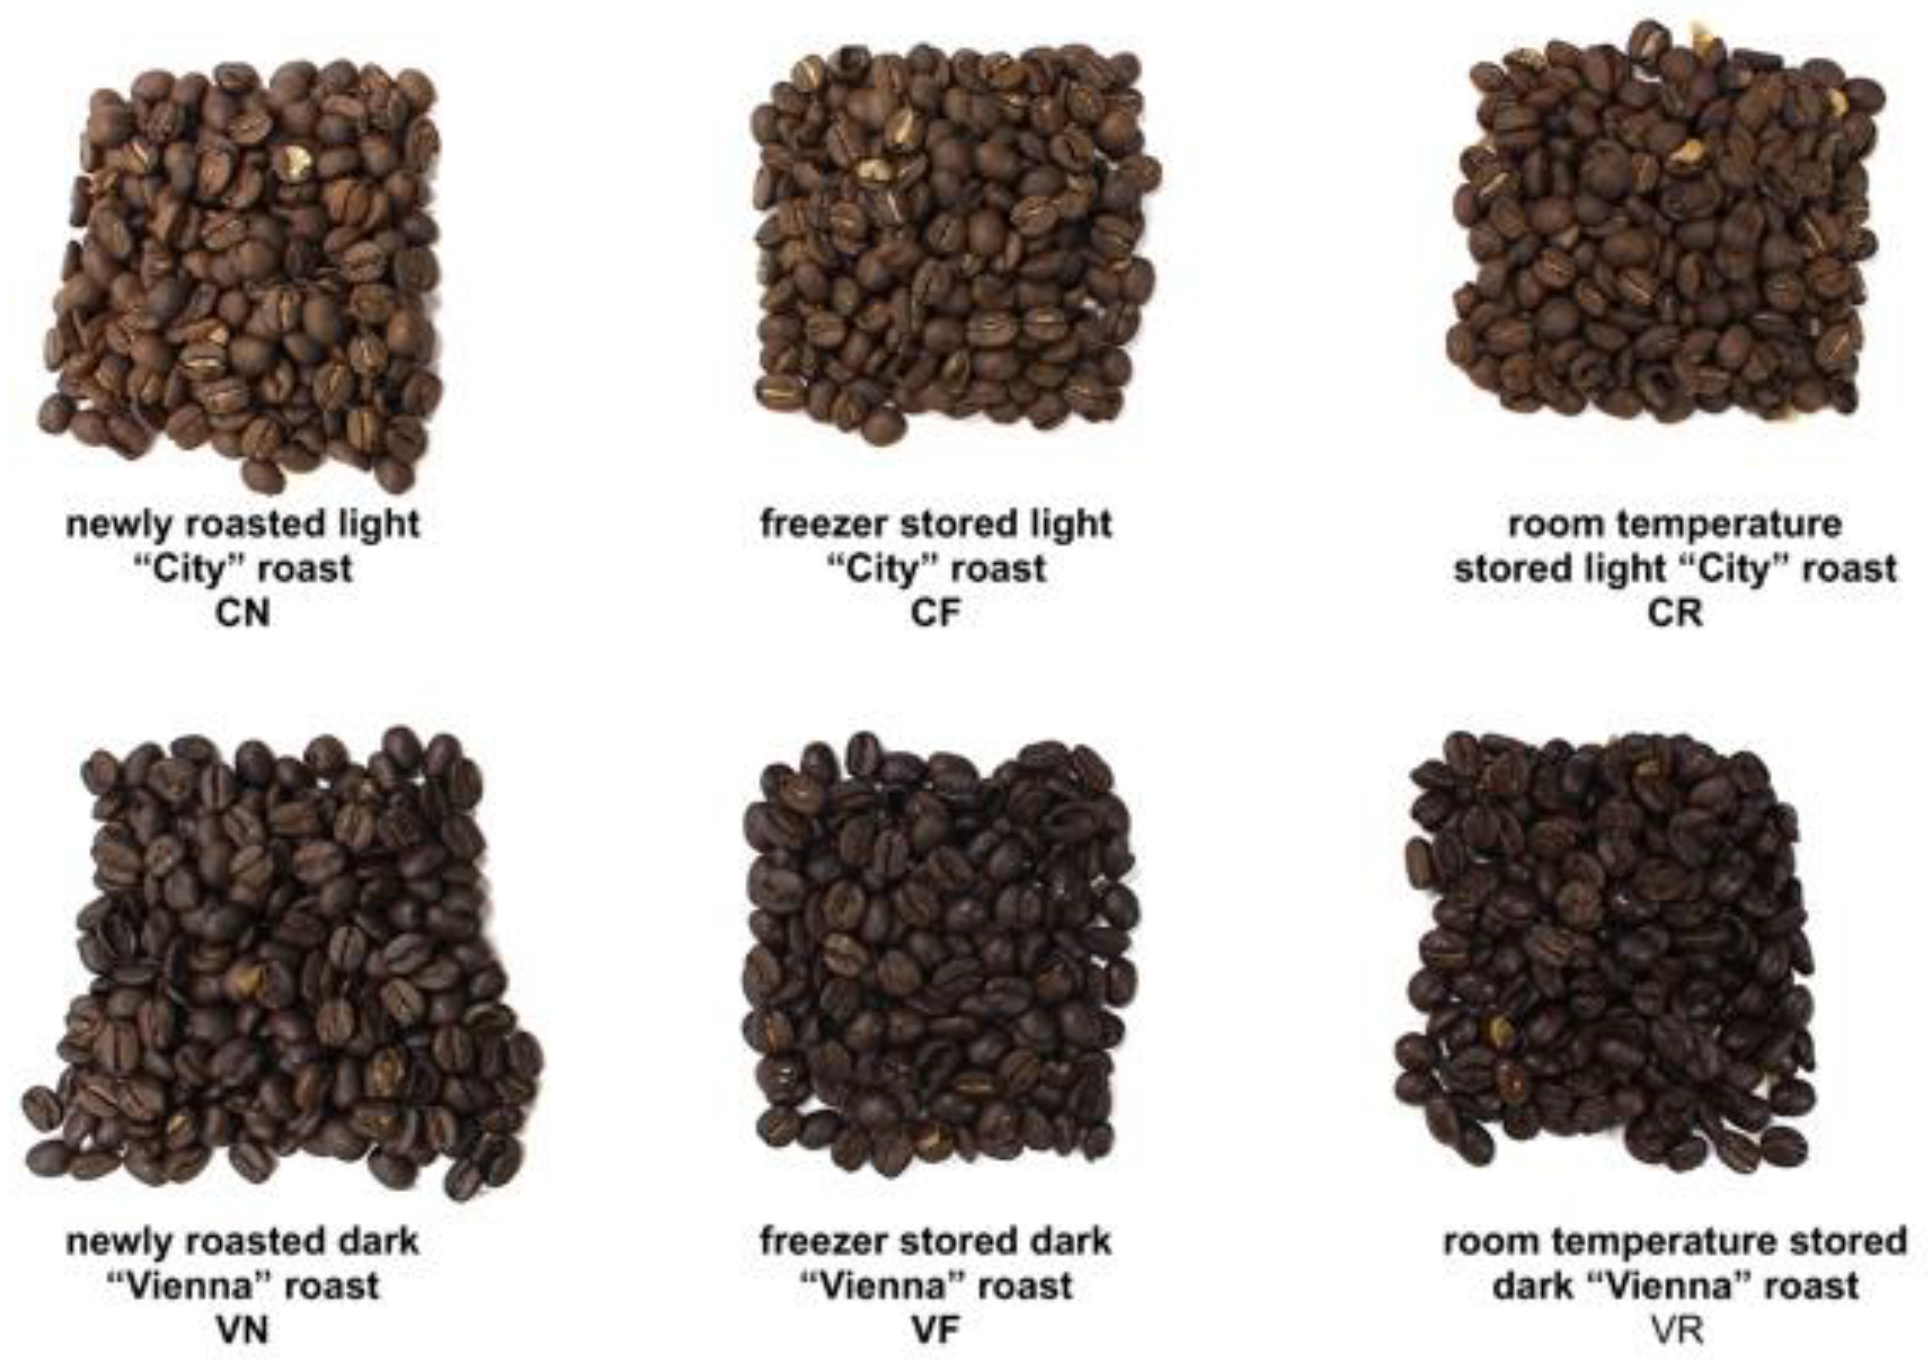
Figure 2.
Projective mapping (PM) consensus product map of the coffee samples with their 95% confidence ellipses. Descriptors are projected onto the product space. Samples are coded by roast level (dark “Vienna” roast “V”; light “City” roast “C”) and storage condition (freezer storage “F”; room temperature storage “R”; and newly roasted “N”). Numbers indicate blind duplicates presented to the panelists. Descriptors in bold differ significantly among the samples by Cochrane’s Q-test (p < 0.1).

Figure 3.
Principal component analysis (PCA) biplot from the HS-SPME-GC-MS analysis of the coffee samples with their 95% confidence intervals. Volatiles that showed significant sample differences (p < 0.05) are projected onto the product space. Samples are coded by roast level (dark “Vienna” roast “V”; light “City” roast “C”) and storage condition (freezer storage “F”; room temperature storage “R”; and newly roasted “N”).

© 2018 by the authors. Licensee MDPI, Basel, Switzerland. This article is an open access article distributed under the terms and conditions of the Creative Commons Attribution (CC BY) license (http://creativecommons.org/licenses/by/4.0/).
Share and Cite
MDPI and ACS Style
Cotter, A.R.; Hopfer, H. The Effects of Storage Temperature on the Aroma of Whole Bean Arabica Coffee Evaluated by Coffee Consumers and HS-SPME-GC-MS. Beverages 2018, 4, 68. https://0-doi-org.brum.beds.ac.uk/10.3390/beverages4030068
AMA Style
Cotter AR, Hopfer H. The Effects of Storage Temperature on the Aroma of Whole Bean Arabica Coffee Evaluated by Coffee Consumers and HS-SPME-GC-MS. Beverages. 2018; 4(3):68. https://0-doi-org.brum.beds.ac.uk/10.3390/beverages4030068
Chicago/Turabian StyleCotter, Andrew R., and Helene Hopfer. 2018. "The Effects of Storage Temperature on the Aroma of Whole Bean Arabica Coffee Evaluated by Coffee Consumers and HS-SPME-GC-MS" Beverages 4, no. 3: 68. https://0-doi-org.brum.beds.ac.uk/10.3390/beverages4030068
Note that from the first issue of 2016, this journal uses article numbers instead of page numbers. See further details here.