Article

Comparative Study of a Cell-Based and Electrochemical Biosensor for the Rapid Detection of 2,4,6-Trichloroanisole in Barrel Water Extracts

1
Laboratory of Cell Technology, Department of Biotechnology, Agricultural University of Athens, 75 Iera Odos St., 11855 Athens, Greece
2
TN Coopers, Cerrillos, Ruta G-68 No 34.500, 9630000 Curacavi, Chile
*
Author to whom correspondence should be addressed.
Submission received: 20 November 2018 / Revised: 7 December 2018 / Accepted: 19 December 2018 / Published: 25 December 2018
(This article belongs to the Special Issue Current Trends in Analytical Techniques for Beverage Analysis)

Abstract

:
(1) Background: Fungal metabolites such as haloanisoles (especially 2,4,6-tribromoanisole/ 2,4,6-TCA) are contaminants of cork and wood barrels, materials that are widely used in the wine industry. Thus, the accurate and timely detection of these substances is very important for this sector of beverage industry. (2) Methods: Potentiometry was used for the Bioelectric Recognition Assay (BERA)-based experimental approach, where changes in the electric properties of the Vero cells modified with anti-TCA antibodies were recorded in response to the presence of 2,4,6-TCA in different concentrations. Furthermore, a second electrochemical biosensor system based on the cyclic voltammetric (CV) measurement of a reaction taking place on a screen printed electrode was developed in parallel to the customized application and configuration of the cell-based system. (3) Results: The BERA cell-based biosensor was able to quantitatively differentiate among the lower 2,4,6-TCA concentrations (control, 0.25 and 1.25 ng/L) from spiked oak barrel water extracts in an entirely distinct and reproducible manner. In contrast, the CV method was not sensitive enough to differentiate between the samples. (4) Conclusions: The present study indicates that the BERA-based biosensor after further development and optimization could be used for the routine, high throughput detection of 2,4,6-TCA in oak barrel water extracts.

1. Introduction

Global sales of wine barrels are estimated to be valued at more than US$3330 million in 2017 and are expected to reach more than US$5260 million by the end of 2027, increasing at a CAGR of 4.7% over the forecast period [1]. Sales revenue of the global wine barrel market is expected grow by 1.65× over the same time span, during which the global wine barrel market is estimated to represent an incremental opportunity of more than US$2000 million [2].
Haloanisoles, mostly 2,4,6-trichloanisole (2,4,6-TCA) and 2,4,6-tribromoanisole (2,4,6-TBA) as well as the precursor compound 2,4,6-trichlorophenol (TCP), are fungal secondary metabolites detected in cork, mainly of species of the genus Aspergillus [3]. This phenomenon is often observed in corks, since several sources of unpredictable contamination with 2,4,6-TCA occur also in oak wood. Furthermore, staves in the same barrel are rarely contaminated with 2,4,6-TCA, whereas the few areas of wood surface contamination may reach several millimeters in depth [4].
Conventional and routine methods for the determination of halonanisoles are quite sensitive, but at the same time expensive, time-consuming, and can be only applied in a dedicated laboratory, requiring considerable investment in sophisticated equipment and trained personnel [5]. The current golden standard in 2,4,6-TCA analytics is gas chromatography coupled with mass spectrometry (GC-MS) or an electron capture detector (GC-μECD), the latter approach being more suitable for quantification [6]. A major drawback of the chromatographic approach is the requirement for considerable sample pretreatment and extract concentration, in order to yield as much as possible releasable 2,4,6-TCA from samples. For example, in cork, a 24 h extraction in 12% aqueous-alcoholic solution or white wine of similar alcoholic strength is considered to be the acceptable protocol, as defined by both ISO20752:2014(E) [7] and OIV-MA-AS315-16 [8] standards. This is not necessarily the case in oak barrels, where sample extracts can be derived by treating barrels with boiling water as a general quality control test (sealing integrity test). Even in this case, however, determination by chromatography or electrochemical biosensors (according to the limited literature on this subject) requires prolonged (at least one hour long) boiling, which would render the process inapplicable on a large, routine scale [9,10]. On the other hand, novel improvements in the quantification of heat-releasable 2,4,6-TCA, including headspace solid-phase microextraction (HS-SPME), are considerably costly, and probably not suitable for any matrix other than cork [11].
Bioelectric recognition assay (BERA) is a method that is based on the measurement of the bioelectric properties of a cluster of engineered, specifically-responding cells [12,13]. Previous studies have shown the capability of BERA-based biosensor assays for detecting 2,4,6-TCA either directly on cork tissue or in cork alcoholic extracts and wine at a very low limit of detection (0.1 ppt), very rapidly (3–5 min), and with a highly competitive cost under conditions of high throughput testing [14,15]. However, the method has never been tested in water solutions in 2,4,6-TCA, considering the very low solubility of the analyte as a possible major limitation. In addition, matrix effects beyond materials such as cork and wine constituents have not been accessed. This was one of the challenges met in the present study.
For the abovementioned reasons, a proof-of-concept investigation was performed regarding the feasibility of developing of a point-of-test (POT) system for the detection of 2,4,6-trichloroanisole (2,4,6-TCA) in water extracts from oak barrels, according to the established extraction process applied at a commercial barrel (TN Coopers) factory [16]. The aim and scope of the study was to access the technical feasibility of developing a dedicated POT system for 2,4,6-TCA detection, with the following specifications:
  • To be able to detect the presence of 2,4,6-TCA below or above the cut-off concentration of 2.5 ng/L.
  • To be operable in a rapid and cost-effective manner.
  • To become the basis, within the framework of further development, of a high throughput device that can be used in line with the production chain.
Moreover, a second electrochemical biosensor system was developed in parallel to the customized application and configuration of the BERA-based system. This comparative system was based on the cyclic voltammetric measurement of a reaction cell, where the total current amplitude was associated with the quantitative interaction between the working electrode and the analyte (2,4,6-TCA) itself.

2. Materials and Methods

2.1. Reagents

2,4,6-Trichloroanisole (2,4,6-TCA) and tetrabutylammonium perchlorate (TBAP) were purchased from Aldrich (Munich, Germany) and Fluka (Buchs, Switzerland), respectively, with a minimum purity of 99%. Anti-TCA monoclonal antibody was obtained from an exclusive contracted immunochemistry research laboratory in Athens, Greece. Hydrogen peroxide was purchased from Sigma-Aldrich Chemical Co. (St. Louis, MO, USA), as well as solvents and salts. Hydrogen peroxide and 2,4,6-TCA were prepared daily. Monkey African green kidney (Vero) cells cultures were originally provided from LGC Promochem (Teddington, UK). All other reagents were purchased from Fluka (Buchs, Switzerland). All reagents were of analytical grade, unless stated otherwise.

2.2. Sample Source, Composition, and Processing

Oak barrel water extracts, which were determined to be haloanisole-free, were prepared by the commercial barrel manufacturer TN Coopers (Cerrillos, Curacavi, Chile), according to the established extraction process [16].

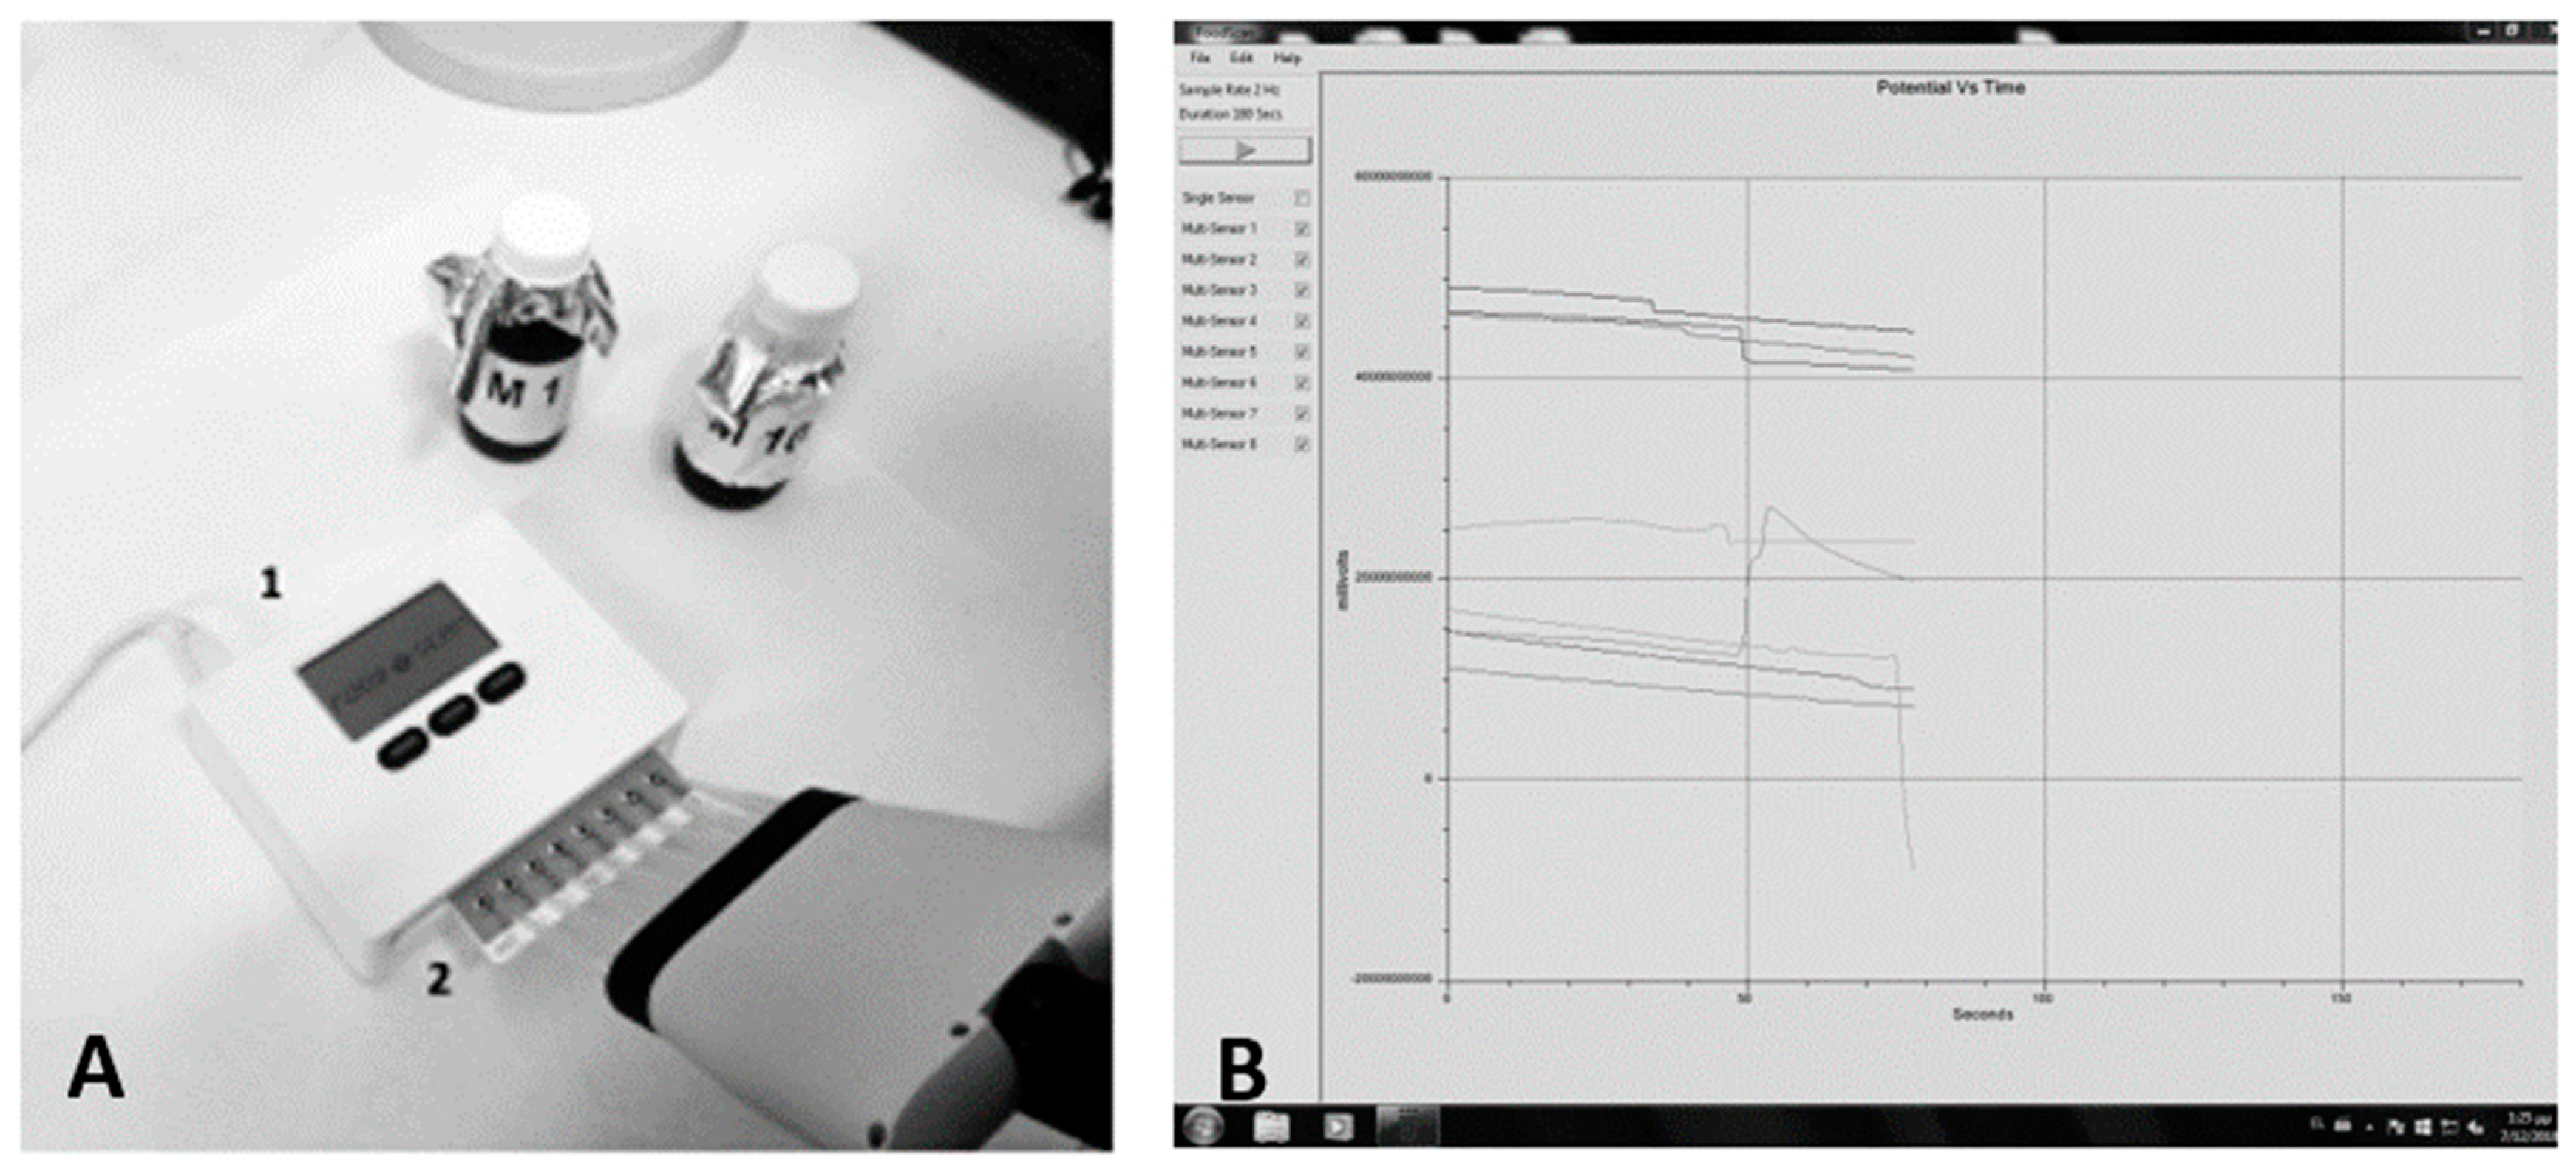
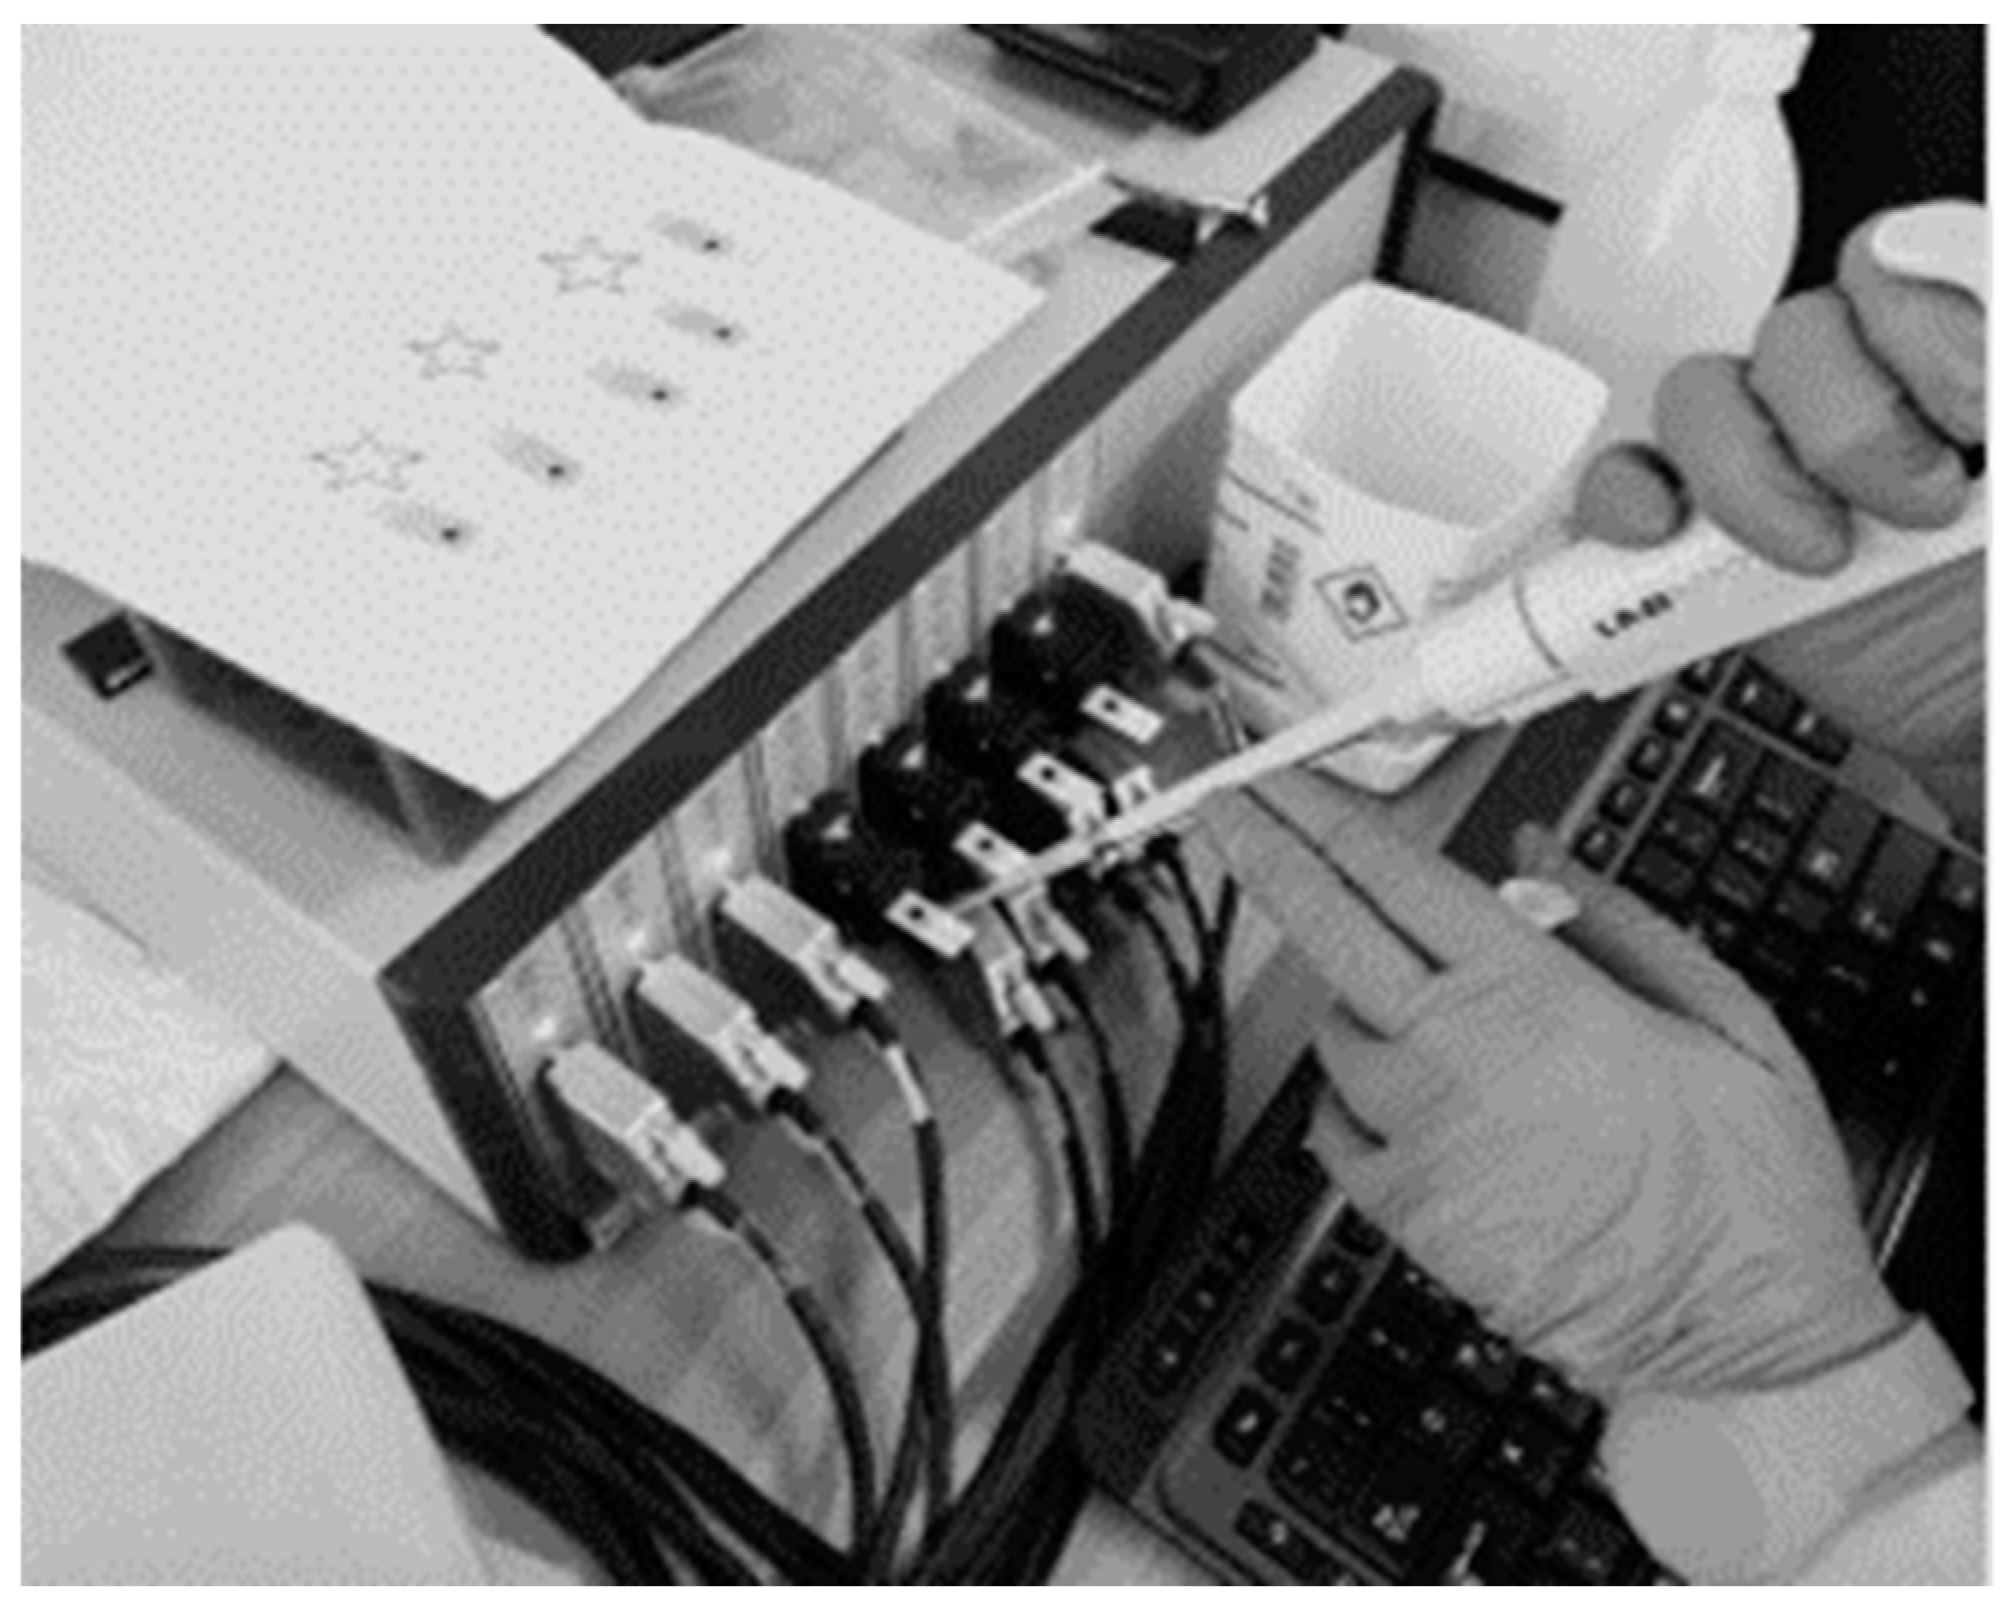
2.3. Biosensor Device

A customized biosensor, previously used specifically for BERA-based tests, was employed, allowing for either potentiometric or cyclic voltammetric measurements [17,18]. Using either approach, different concentrations of 2,4,6-TCA will produce a unique pattern of biosensor response, like a ‘signature’.
Potentiometry was used for the BERA-based (main) experimental approach, where changes in the electric properties of the cellular biorecognition elements were recorded in response to the presence of 2,4,6-TCA in different concentrations.
Cyclic voltammetry was used for the alternative approach, where the current is measured that develops in the electrochemical cell-TCA nanoenvironment under conditions where the voltage is in excess of that predicted by the Nernst equation. The assay was performed by cycling the potential of the working electrode and measuring the resulting current of the sensor, which is characteristic and specific for 2,4,6-TCA at different concentrations.
The portable potentiometric biosensor device was an 8× channel potentiostat. The system allowed for measuring electric signals from biorecognition elements immobilized on screen-printed working electrodes, and allowing for high throughput screening and a high speed of assay (duration: 3–5 min). A connection interface, including a replaceable guide, allowed for the insertion of electrode strips directly into the instrument, utilizing one electrode strip per channel. The sensor strips plug directly into the front panel of the instrument channels via a bespoke sensor connector (Figure 1). Each electrode strip comprised a 0.5 mm thick ceramic substrate with three screen-printed electrodes (working electrode—WE, reference electrode—RE and counter electrode—CE). In order to facilitate high throughput screening, DRP-8X110 disposable sensor strips (WE: carbon, RE: Ag/AgCl) bearing eight electrode pairs (corresponding to eight measurement channels) were purchased from DropSens (Llanera, Asturias, Spain). For cyclic voltammetric measurements a desktop, and a modified version of the potentiometric device was developed (Figure 2).

2.4. Assay Setup

2.4.1. Potentiometry Approach

Cell Culture and Manufacturing of Biorecognition Elements

Vero cells were cultured in Dulbecco’s medium with 10% fetal bovine serum (FBS), 10% antibiotics (streptomycin–penicillin) and 1% l-alanine and glutamine. The cell detachment from the culture vessel was achieved by adding trypsin/EDTA for 10 min at 37 °C. Cells were concentrated by centrifugation (2 min, 1200 rpm). According to the established protocol, Vero cells were modified by electroinserting the TCA antibody into their membrane [14]. Briefly, 2.5 × 10⁶ mL cells in 40 μL Phosphate Buffer Saline (PBS) were incubated with 400 μL of 0.5 μg/mL antibody for 20 min on ice. After incubation, the mixture was transferred to an electric field at 1800 V/cm, and two square electric pulses were applied. Finally, after modification, the cells were stored at 37 °C with 5% CO2. The next day, the cells were counted, and experiments were performed with barrel water extract samples. In a separate set of experiments, membrane-engineered cells were prepared by electroinserting lower or higher concentrations of antibody (see Section 3.2 for more information).

Spiking Haloanisole-Free Water Extract Samples

A stock solution of 0.1 mg/mL 2,4,6-TCA was prepared in methanol. For the preparation of the final concentration of interest, dilution series were performed by using water haloanisole-free samples. Prior to dilutions, the water extract samples were incubated at 65 °C in a water bath, and ultrasonication was applied in order to achieve a major dilution of 2,4,6-TCA in water. The final concentrations that we used for system calibration were: 0.25 ng/L, 1.25 ng/L, 2.5 ng/L, 5 ng/L, and 10 ng/L. Also, the haloanisole-free samples were used as controls.

Assay Procedure

Membrane-engineered cells were counted and calculated at a density of 50 × 103 cells/45 μL. A drop of 45 μL cells was placed on the top of each of the eight carbon screen-printed electrodes, and with the help of an automatic pipette, another 5 μL of sample was added. The response of the cells to the different samples (control and positive sample) was recorded as a time-series of potentiometric measurements. The duration of each measurement was 300 s and 600 values/sample were recorded at a sampling rate of 2 Hz.

2.4.2. Cyclic Voltammetry Approach

The cyclic voltammetry-based determination of 2,4,6-TCA was obtained from a protocol of Freitas et al. [19], modified with screen-printed electrodes. The relative volumetric proportion of Methanol/water (MeOH/H2O water) and Acetonitrile/water (ACN/H2O) water tested was 1:1 and 3:2 (v/v). TBAP (0.1 M) was used as the supporting electrolyte, since ammonium salts have been reported to increase the maximum current intensity when using silver working electrodes. The use of ACN/water as a solvent was mainly due to solubility reasons of 2,4,6-TCA and TBAP, which have low solubility in water, whereas water was used as a co-solvent since the samples collected from the oak barrel extraction process are aqueous solutions.

Sample Preparation

The aqueous samples provided were used after being diluted with either MeOH or ACN containing 0.17 M TBAP, in order to obtain a volumetric proportion of 1:1 or 3:2 and a final solution with 0.1 M TBAP. The 2,4,6-TCA concentrations, before and after standard solution addition were calculated by using a similar procedure as that described in the previous section for ACN/water solutions, but taking into account the standard addition calibration method with volume correction, due to the dilution factor [20]. Thus, a linear relationship was established between the total current amplitude multiplied by the final volume after each addition of the standard solution and the total added volume of the standard 2,4,6-TCA in ACN/water with 0.1 M of TBAP. Then, using the regression line parameters (slope and intercept values) and the intercept value with the abscissa axis, the 2,4,6-TCA concentration in each aqueous sample of the oak barrel extraction process was calculated. Thus, for an intra-day repeatability evaluation, three aqueous samples with low, middle, and high 2,4,6-TCA concentrations were selected. Each sample, after dilution step, was analyzed in triplicate on the same day under working voltammetric conditions. Intra-day variability was assessed by calculating the RSD%. The accuracy of the proposed CV method was studied by using aqueous samples from the cork plank boiling process.

Electrochemical Measurements

Electrochemical measurements were carried out in triplicates by using a new strip in a non-deaerated and unstirred solution. Measurements were performed using a PG581 potentiostat (Bio-Logic Science Instruments, Seyssinet-Pariset, France). The measurements data were processed by UiEChemTM software V3.62 (Seyssinet-Pariset, France). Cyclic voltammetric measurements were carried out by scanning at 50 mV s−1 between −2 V and 1.6 V relative to an on-board Ag–AgCl reference electrode. Stock solutions of 50 mM potassium ferrocyanide were prepared in 0.1 M KCl.

Calibration Plot and the Interpretation of Results

Immunosensor calibration curves were fitted by non-linear regression using the following four parameter logistic function [21]:
F(x) = (a − d)/[1 + (x/c)b] + d
where parameters a and d are the asymptotic maximum and minimum values of the calibration curves, respectively, x is the concentration at the EC50 value, c is the analyte concentration, and b is the hill slope. EC50 is an effective concentration for 50% value.
The limit of detection (LOD) was defined as the concentration of 2,4,6-TCA equivalent to three times the value of standard deviation (σ). This was calculated based on the following equation:
LOD = x [a − d/(a − d) − 3σ] − 1/b
where σ is the standard deviation of the zero value.

2.5. Statistical Design

Experiments were setup in a completely randomized design. Each sample (sample barrel extract spiked with six different 2,4,6-TCA concentrations, including control) was assayed eight times, and each experiment was replicated three times at different time periods. Results were assessed by a standard analysis of variance for a randomized complete block design.

3. Results

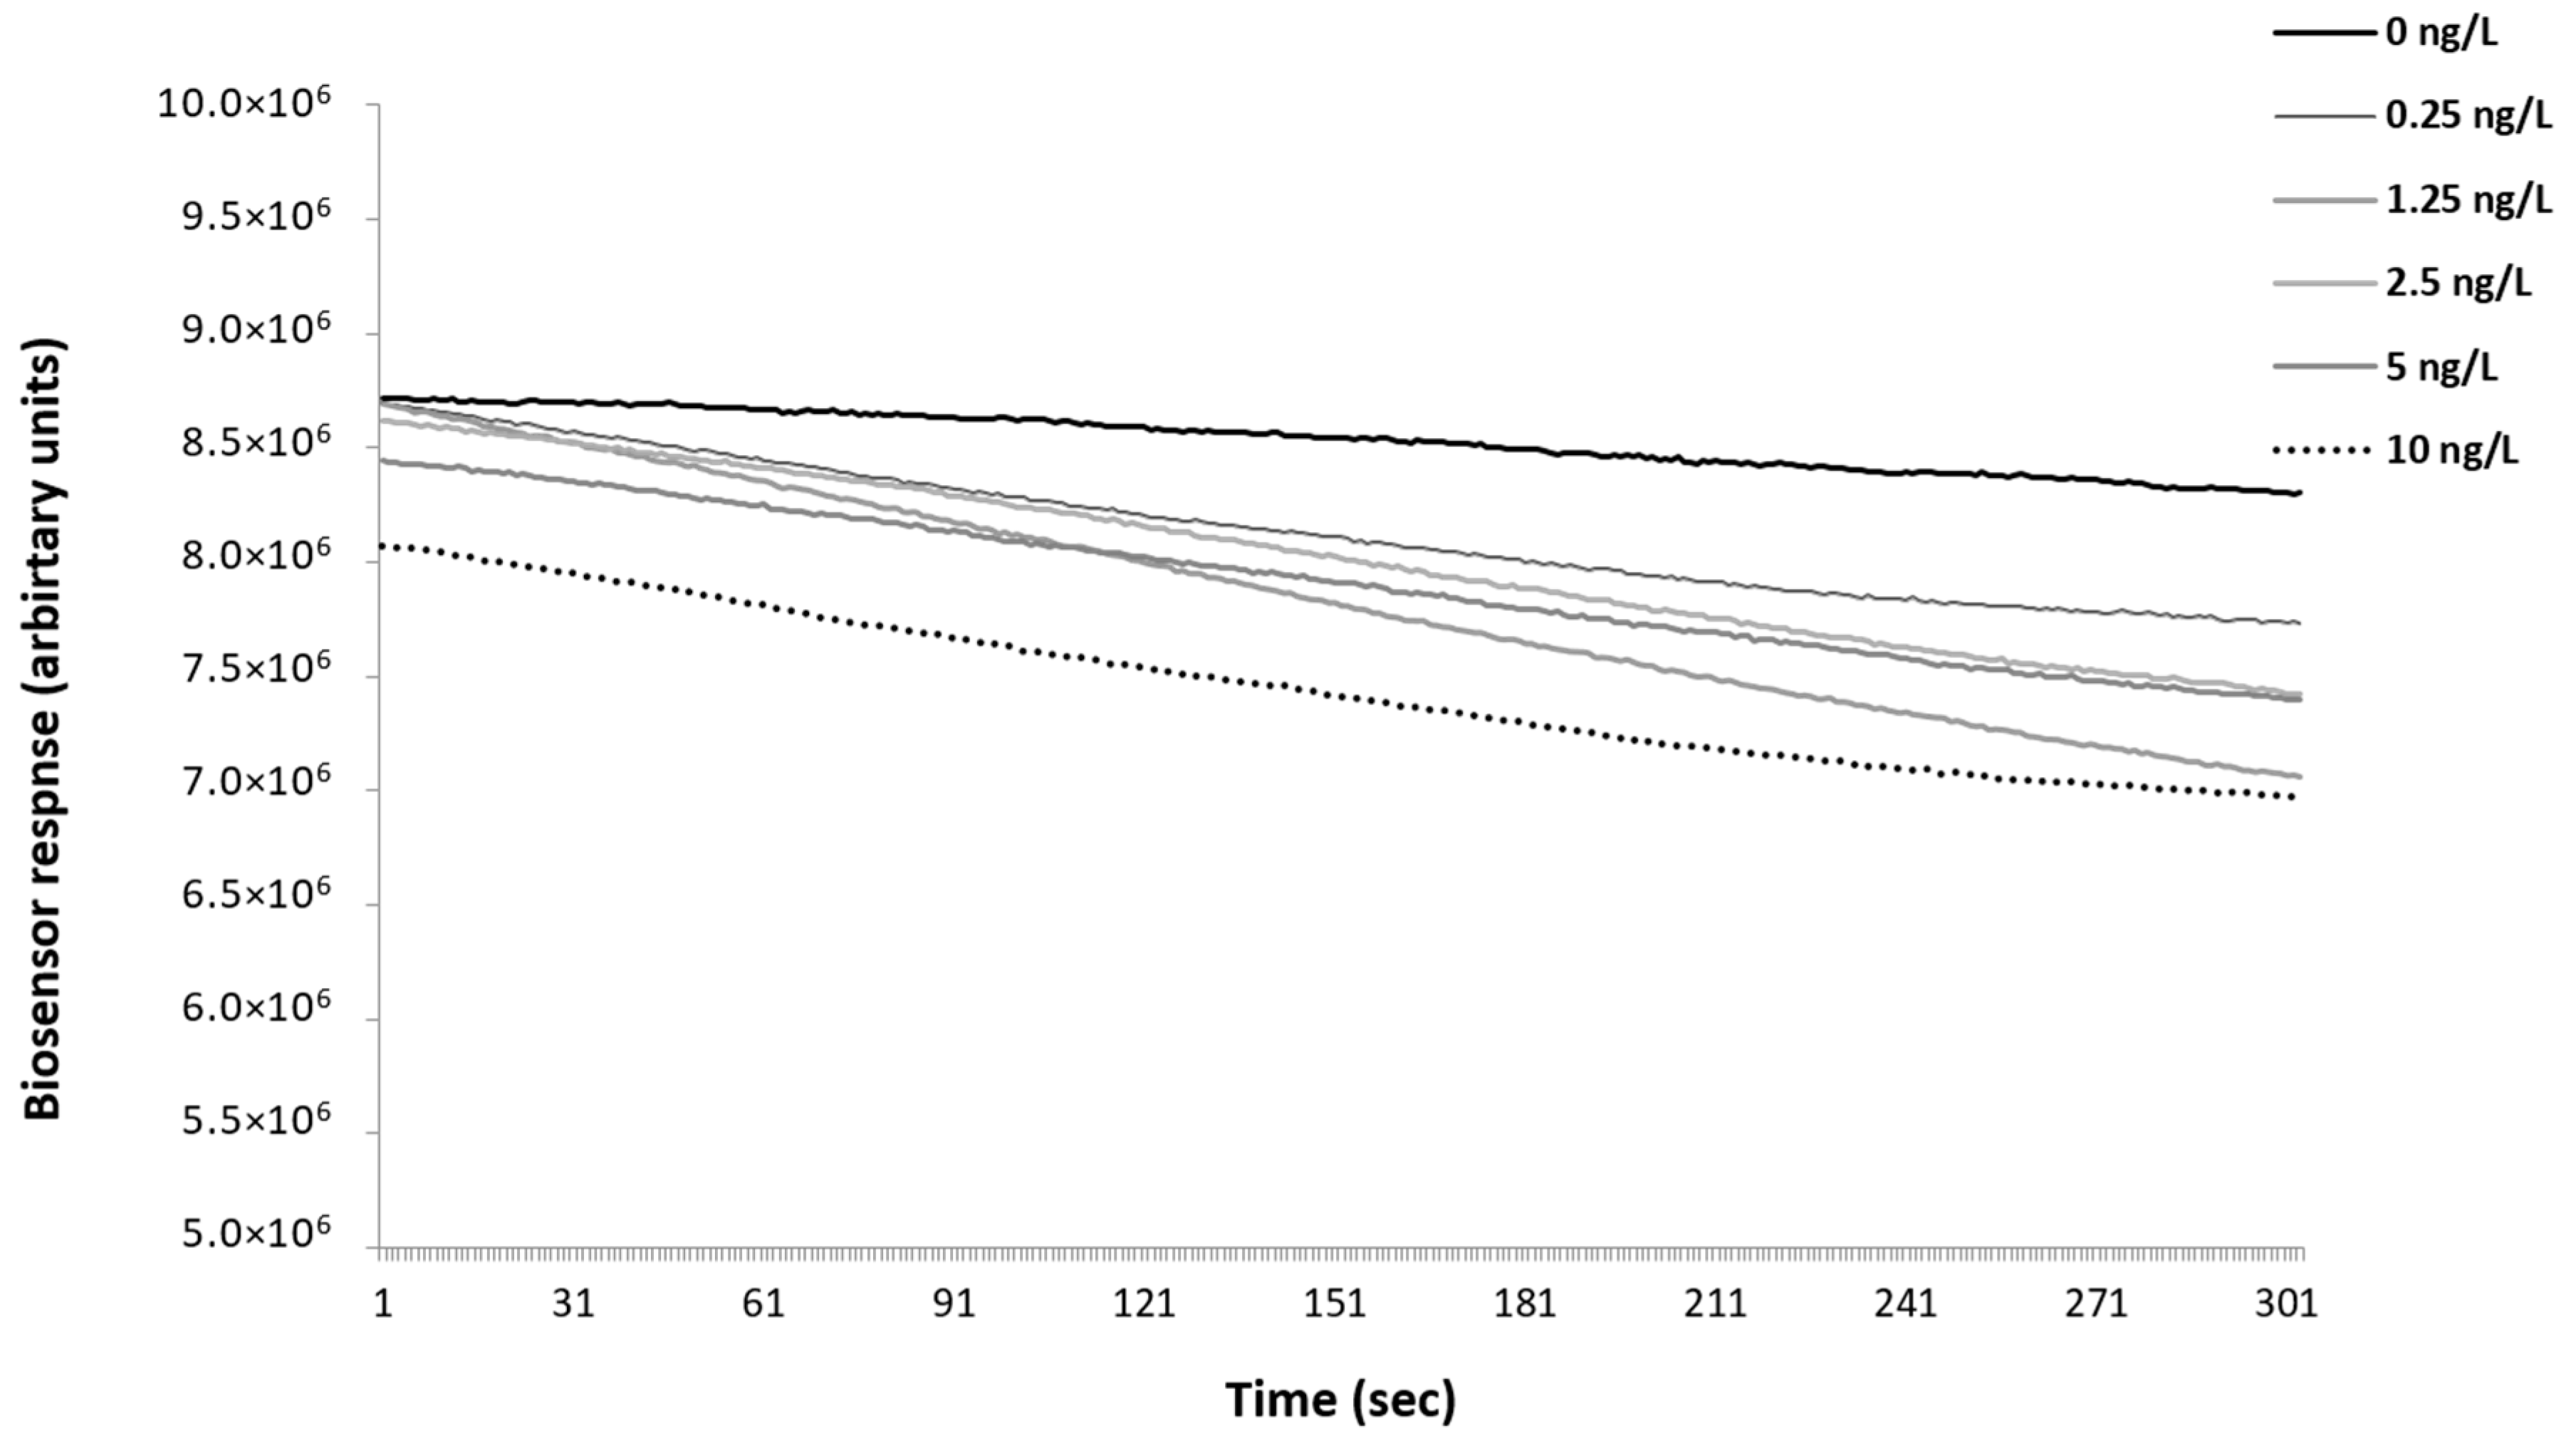
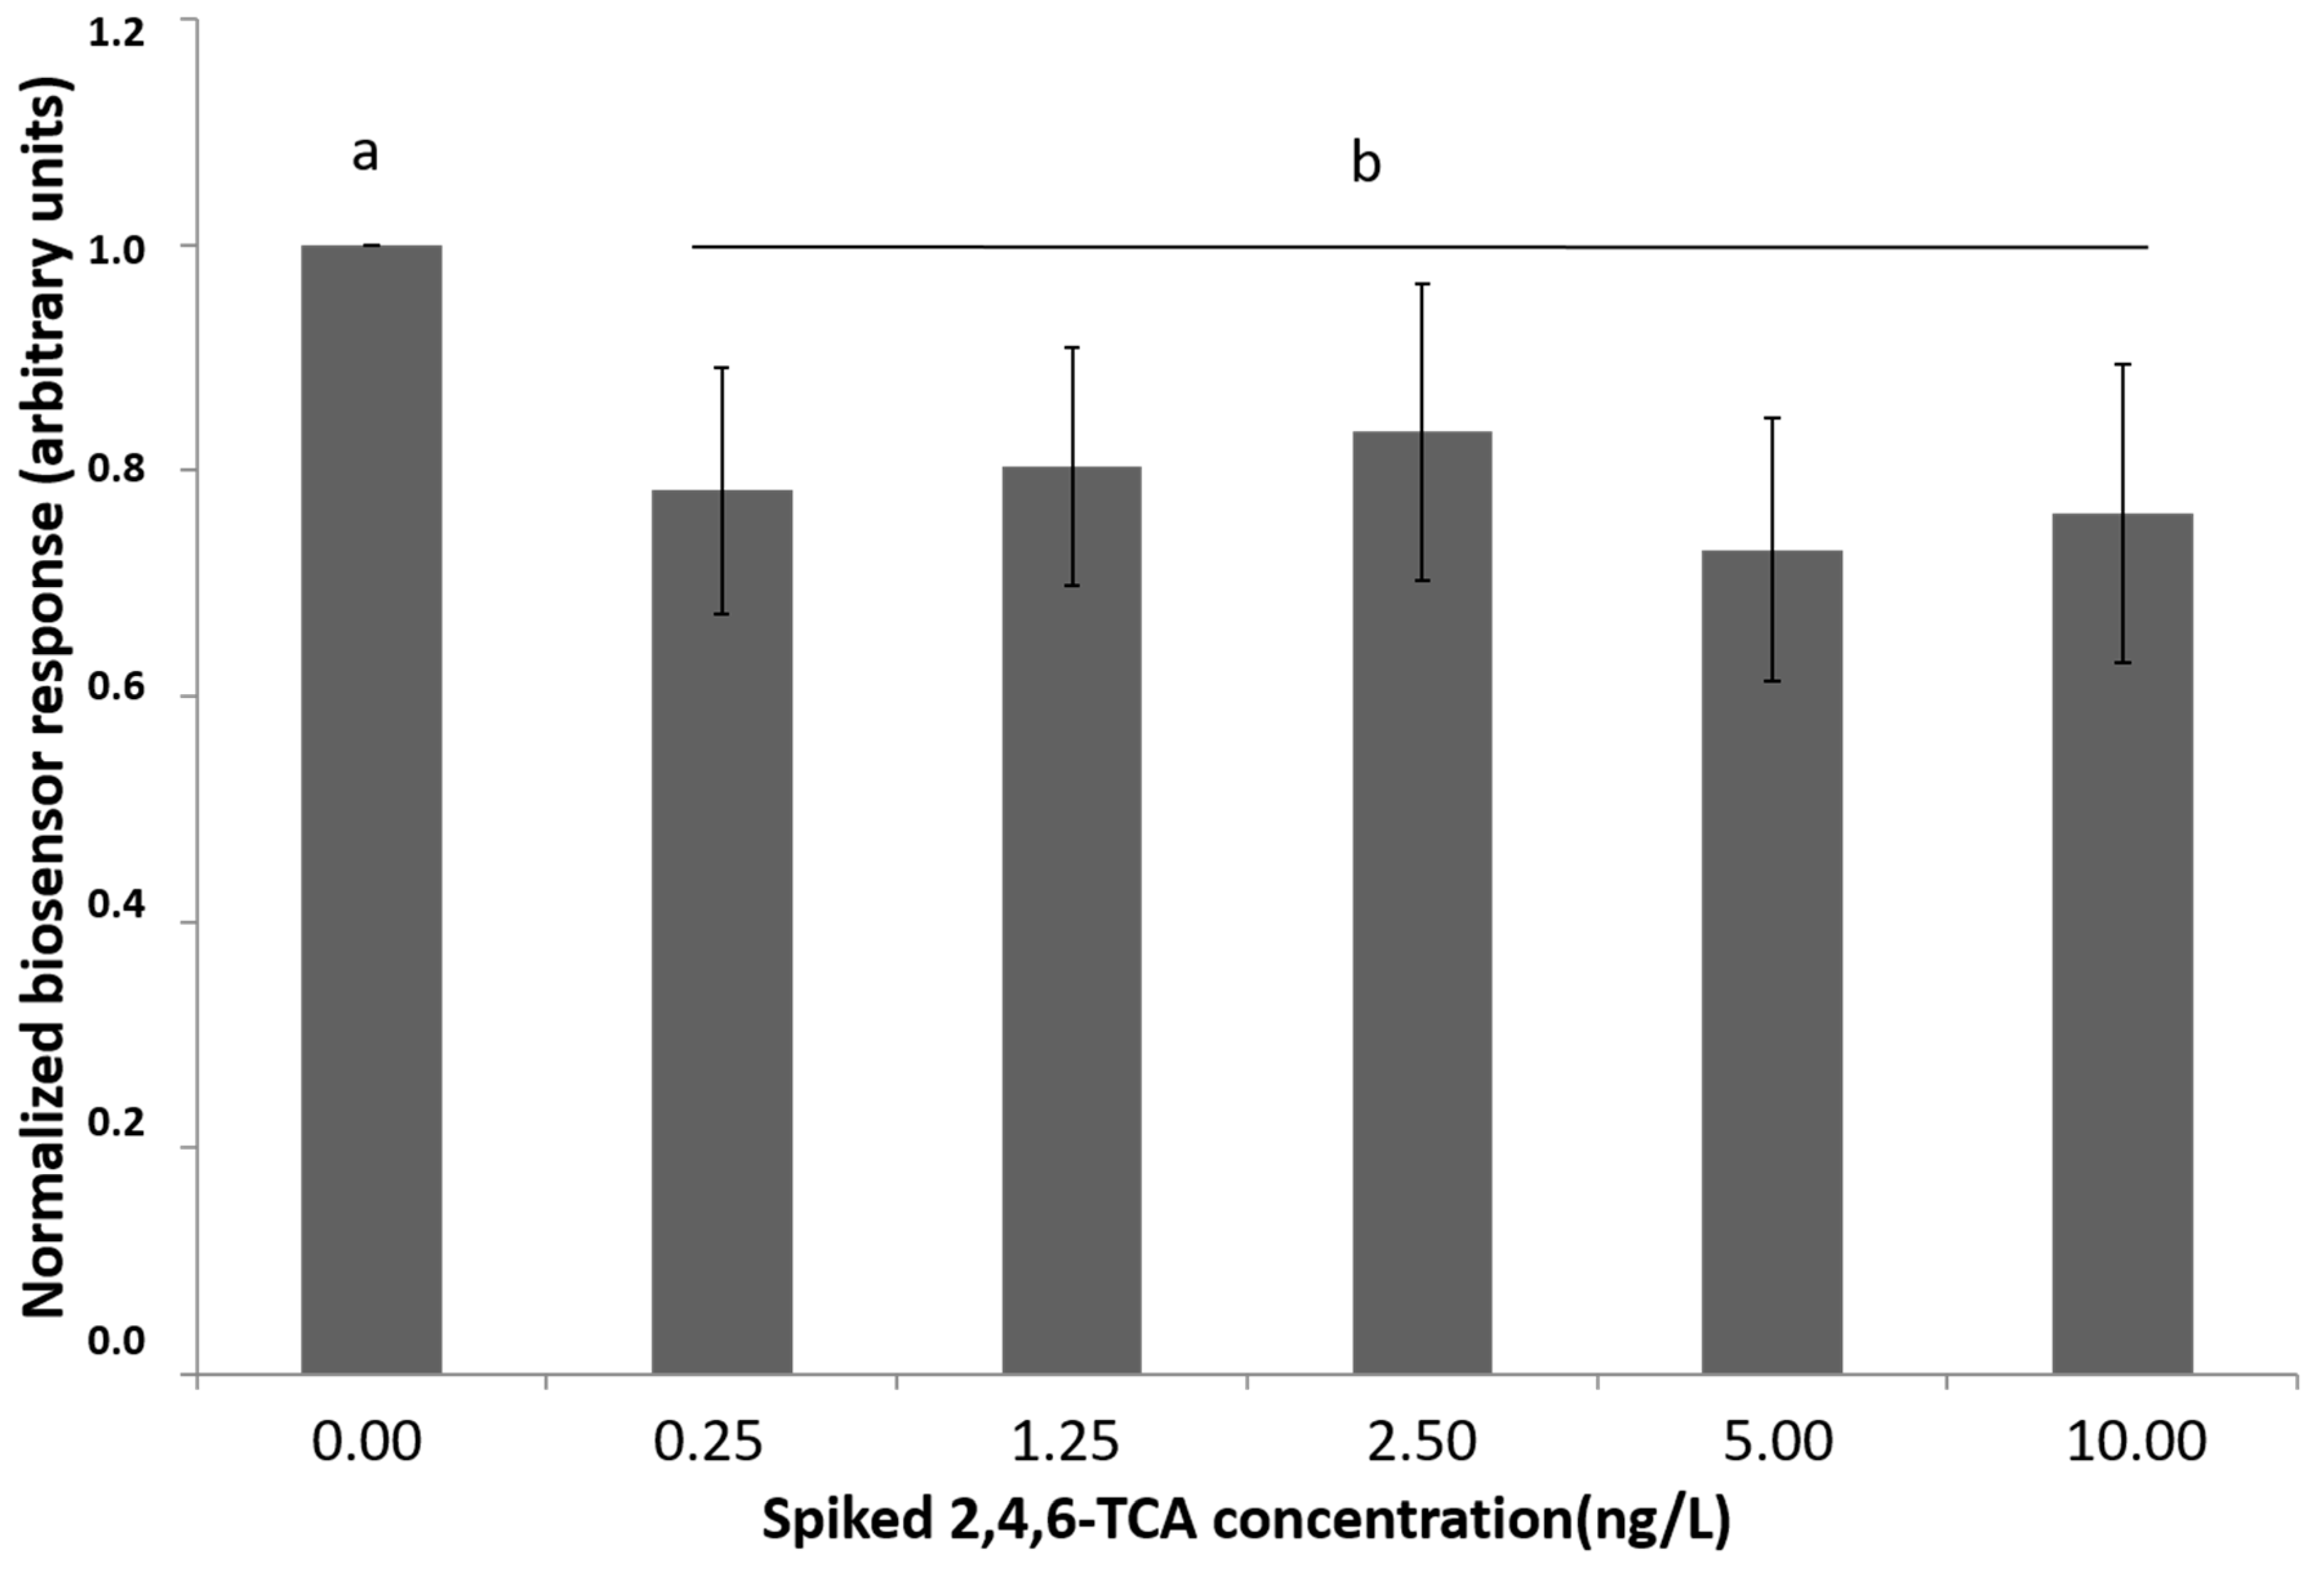
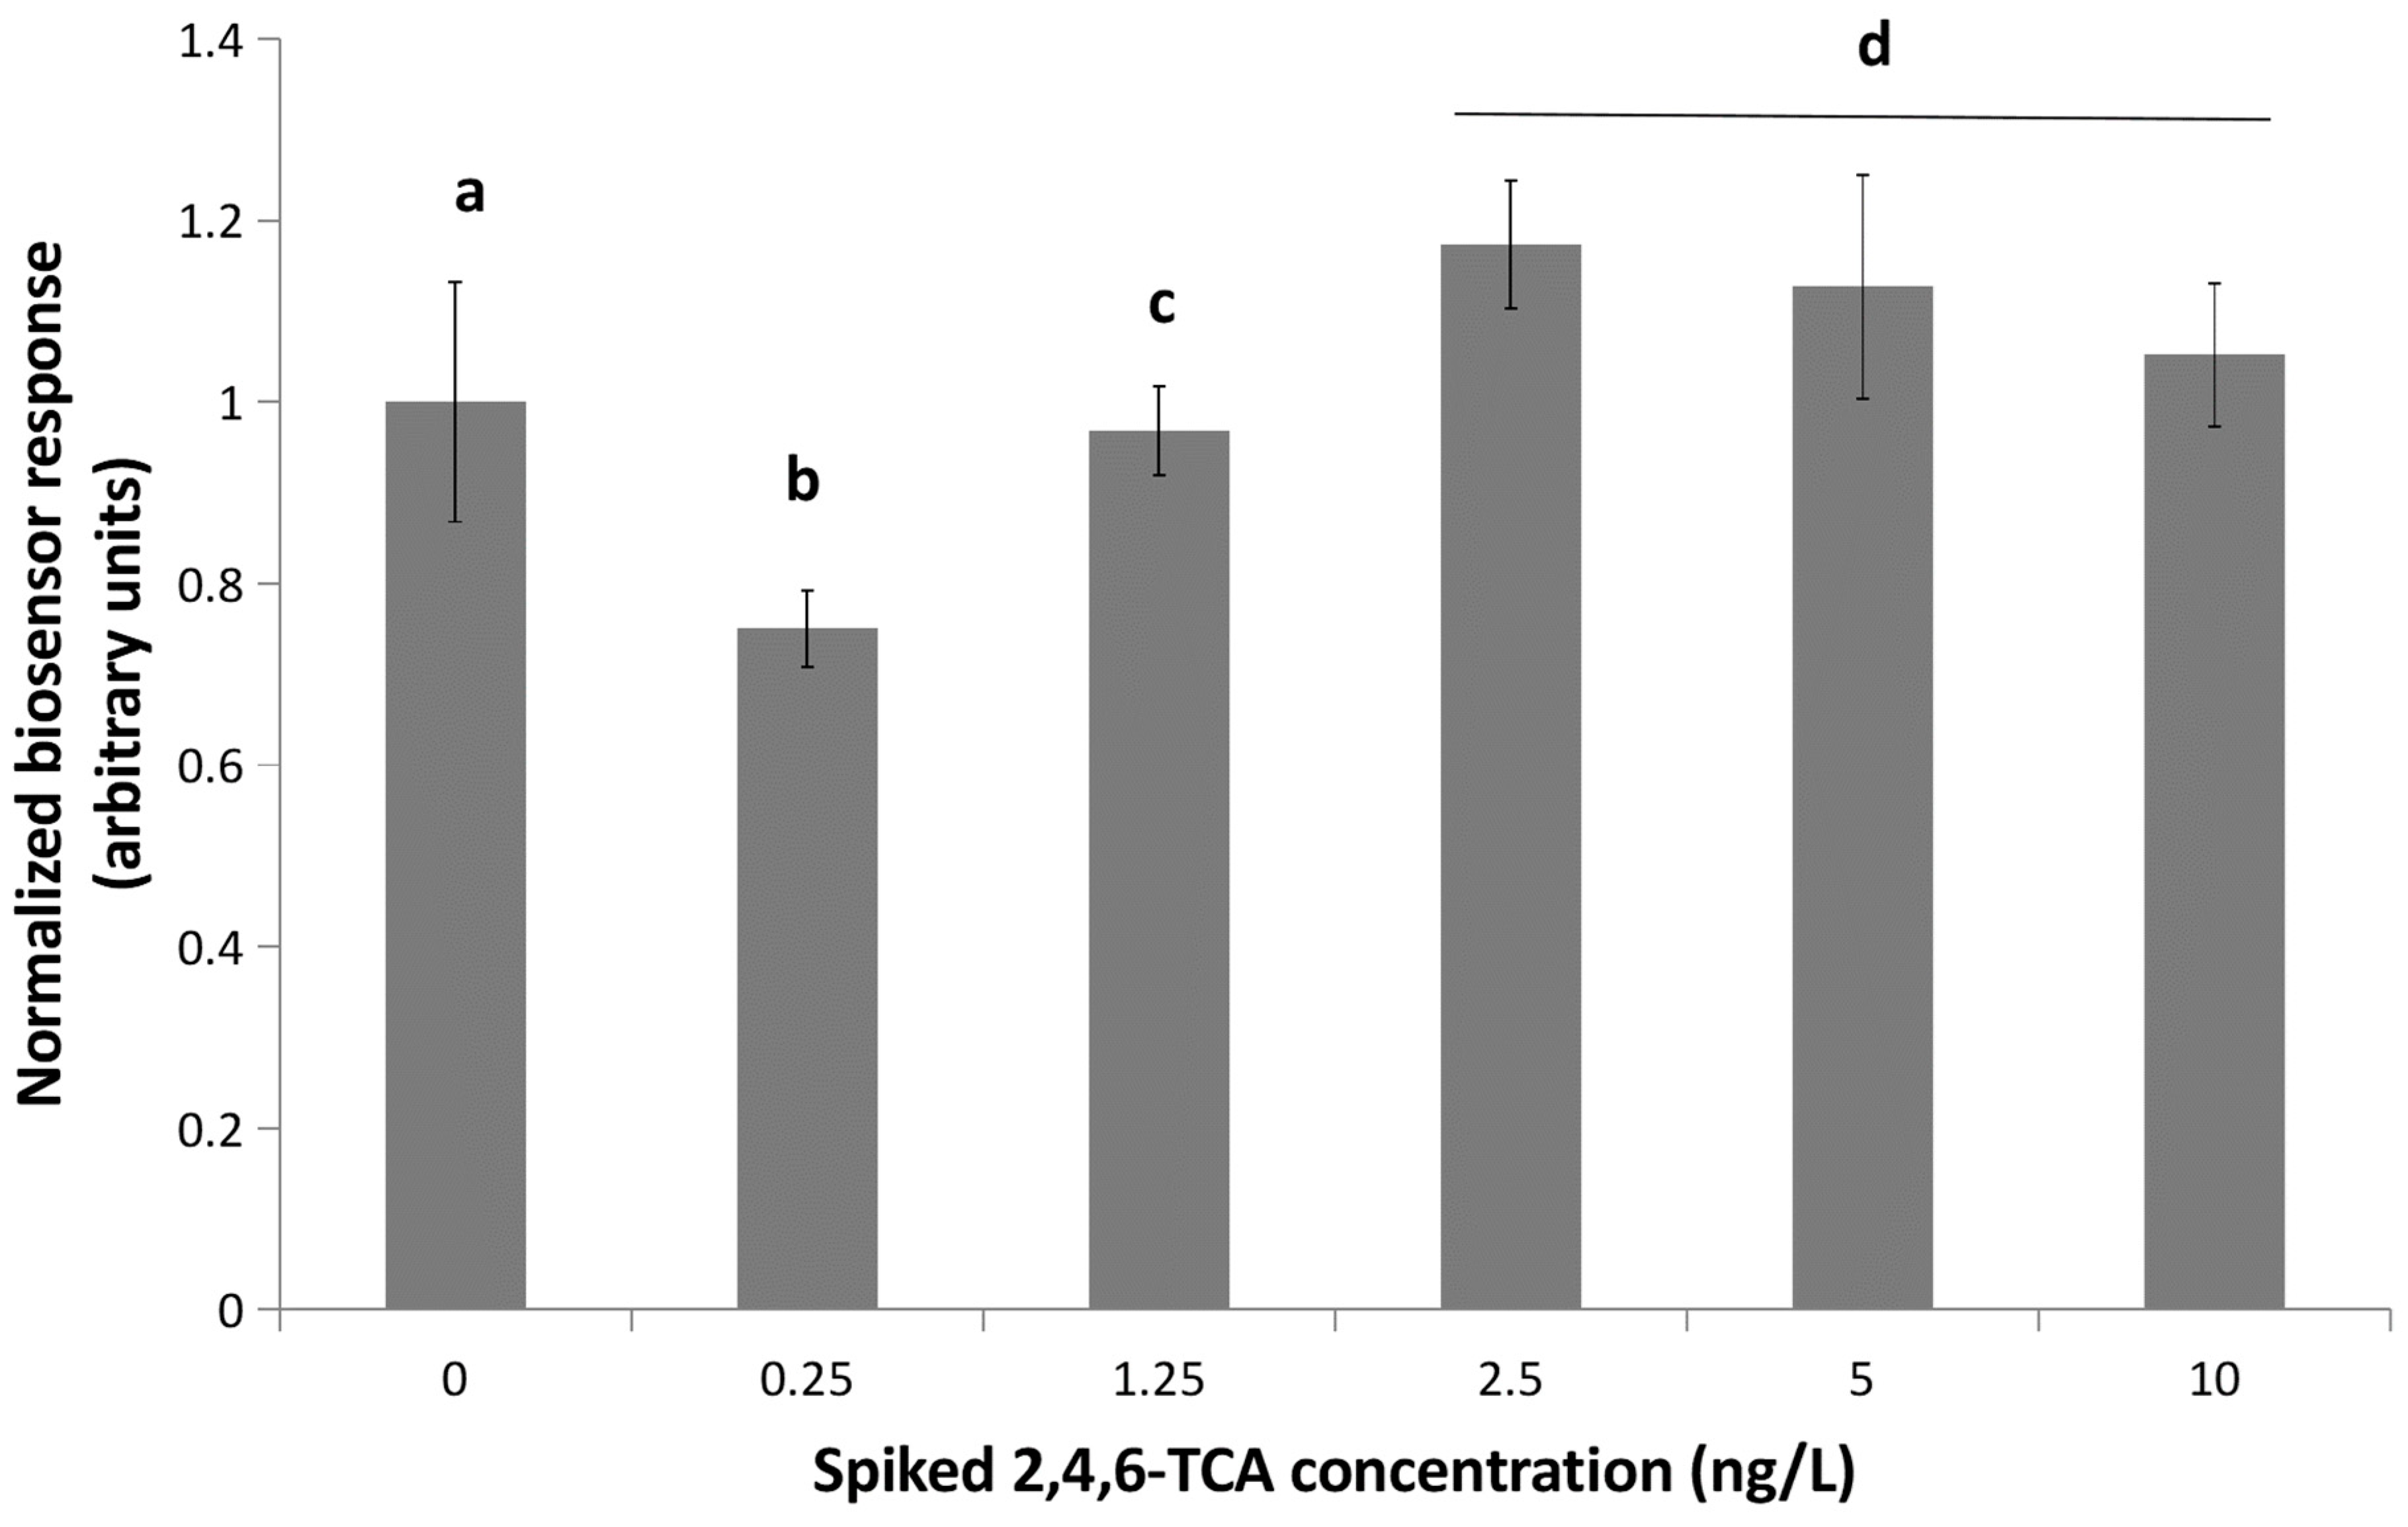
3.1. Biosensor Response to the Presence of 2,4,6-TCA in Oak Barrel Water Extracts

The biosensor system developed for the purpose of the present study utilized Vero cells which were membrane-engineered in such way to present a large copy of anti-TCA antibodies on the outward-facing side of their membrane. According to the principle of molecular recognition through membrane engineering [13], binding of 2,4,6-TCA molecules on the respective antibodies would cause the reconfiguration of the local cell membrane geometry and a change of the cell membrane potential. The latter would be recorded by the BERA-compatible biosensor system used for the bioelectric profiling of the membrane-engineered cells.
Indeed, the biosensor was able to detect 2,4,6-TCA at any concentration, as documented by the time-dependent response of the sensor against TCA-free and TCA-positive samples. As shown in Figure 3, a totally different and distinct response was recorded against TCA-negative (0 ng/L) and samples containing 2,4,6-TCA at different concentrations (0.25–10 ng/L). While the time-dependent response of Vero cells membrane-engineered with the anti-TCA antibody against a TCA-free oak barrel extract sample was essentially stable and constant over the assay period (five min), the presence of 2,4,6-TCA at an even very low concentration (0.25 ng/L) caused clear and explicit membrane hyperpolarization, as a result of the interaction between 2,4,6-TCA and the electroinserted anti-TCA antibodies onto the Vero cell membrane. This was observed as a time-dependent shift of the biosensor response towards negative values. At each 2,4,6-TCA concentration, the recorded response was very reproducible between individual assays of the same sample.
By calculating the average biosensor response over all experimental replications, it is quite explicit that the biosensor was able to detect 2,4,6-TCA at all five different spiked concentrations, in a way entirely distinct from the control (TCA-free extracts) and quite reproducible (Figure 4). However, at this stage, it was not possible to differentiate the response among the different concentrations in spiked samples. Statistically significant resolution was achieved between the control and the different 2,4,6-TCA concentrations (p < 0.01); however, not among the different 2,4,6-TCA concentrations. In other words, the biosensor performed successfully as a qualitative screening test for 2,4,6-TCA in oak barrel water extracts. That said, it is worth observing a non-significant increased shift of the biosensor response to negative values (indicating the expected cell membrane depolarization) at the two highest 2,4,6-TCA concentrations (5 and 10 ng/L).

3.2. Results of Potentiometric Biosensor Testing with Other Versions of the Cell Biorecognition Elements

In a separate set of experiments, cellular biorecognition elements were prepared by the means of membrane engineering, using higher or lower anti-TCA antibody concentrations, instead of the original concentration of 0.5 μg/mL. More analytically, 2.5 × 10⁶ mL cells in 40 μL PBS were incubated with 400 μL of antibody at a concentration of either 0.3 (low) or 0.7 (high) μg/mL.
Although the results of detecting 2,4,6-TCA using 0.7 instead of 0.5 μg/mL antibody did not differ essentially between them (analytical results not shown), a different pattern of response was observed by using cellular biorecognition elements membrane-engineered with the lower 0.3 μg/mL antibody concentration (Figure 5). In this case, the biosensor was able to quantitatively differentiate among the lower 2,4,6-TCA concentrations (control, 0.25 and 1.25 ng/L), as well as samples belonging either to control, <2.5, and >2.5 ng/L groups.
Statistically significant resolution was achieved between the control and the lower 2,4,6-TCA concentrations (p < 0.05), between lower and higher 2,4,6-TCA concentrations (p < 0.01), as well as between the different lower concentrations (p < 0.01).

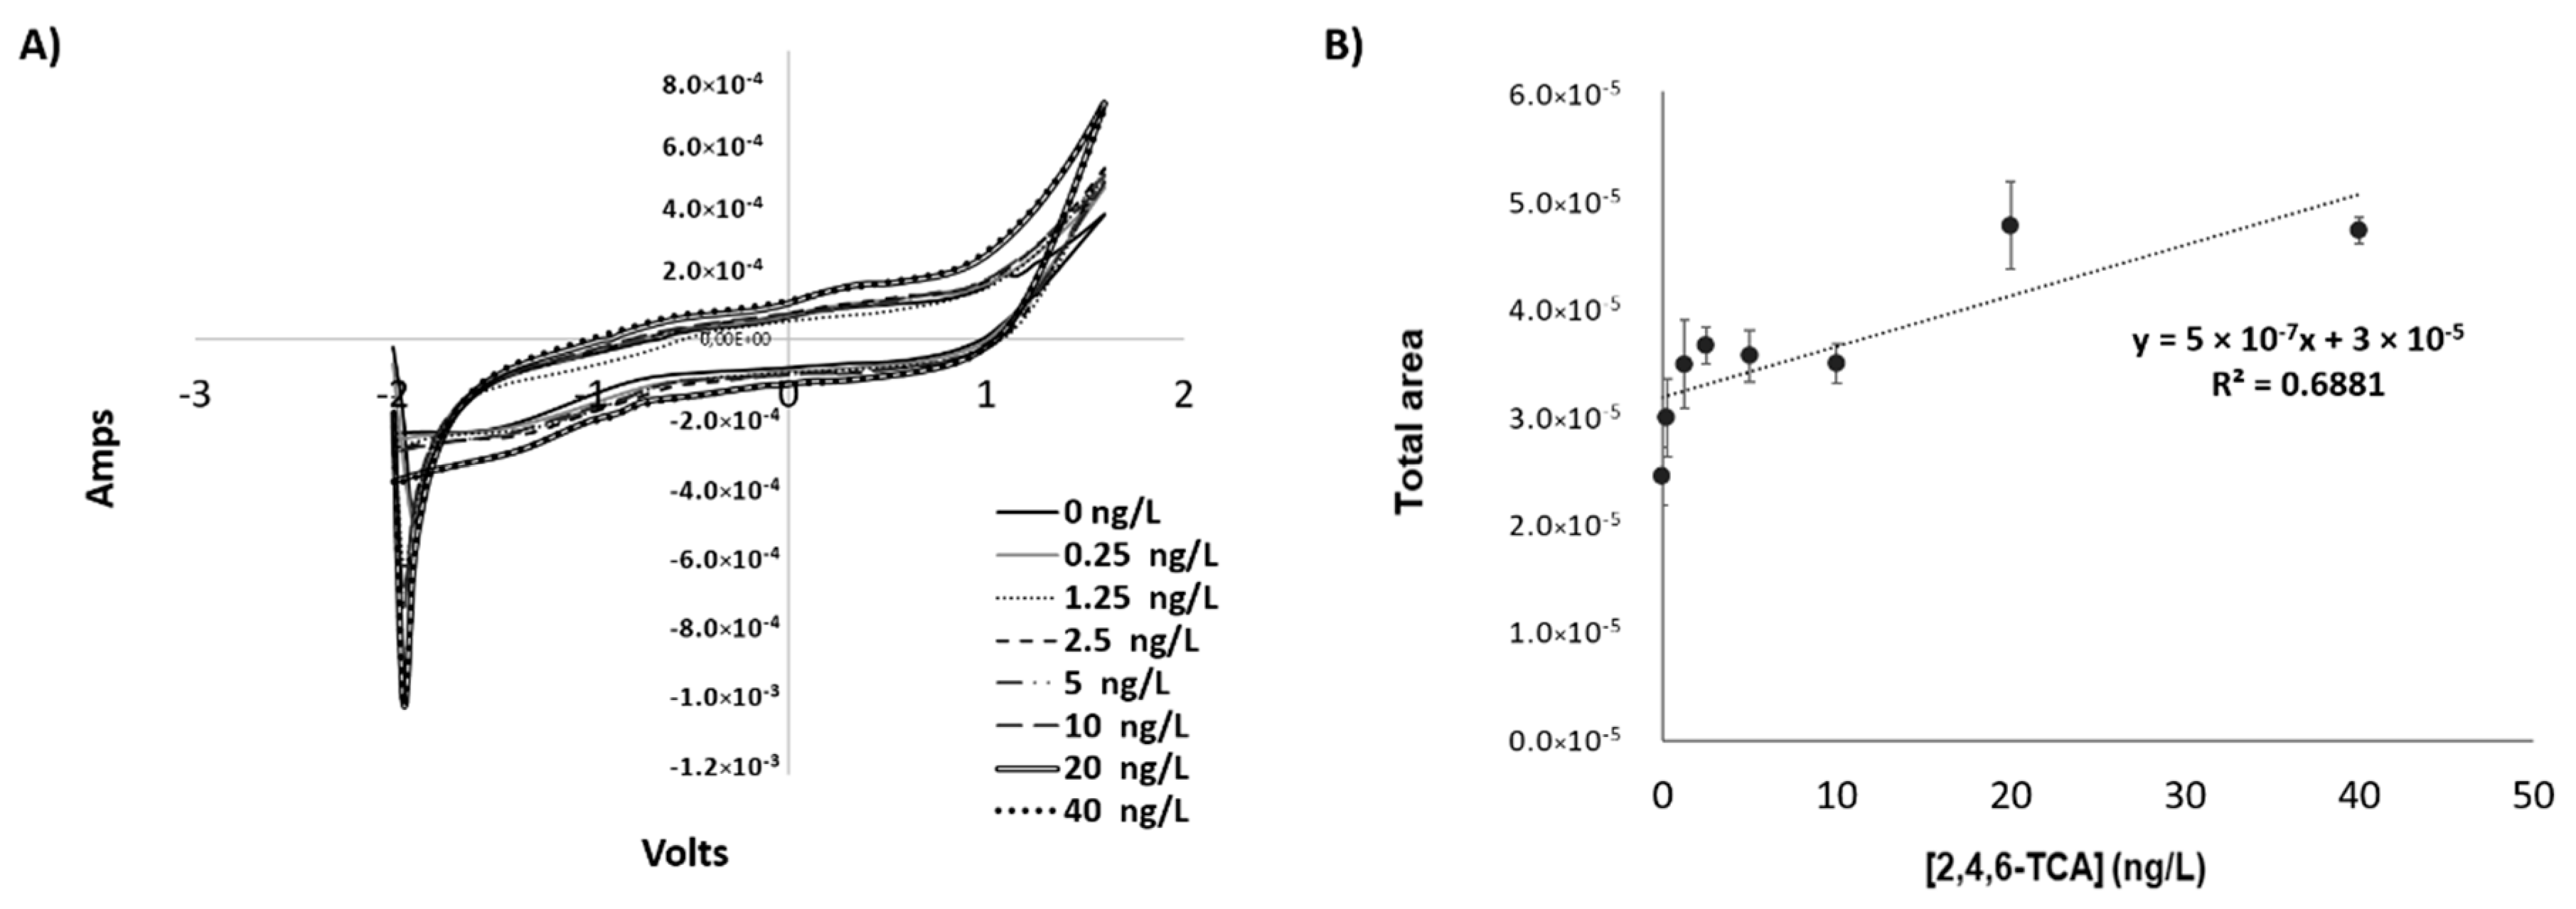
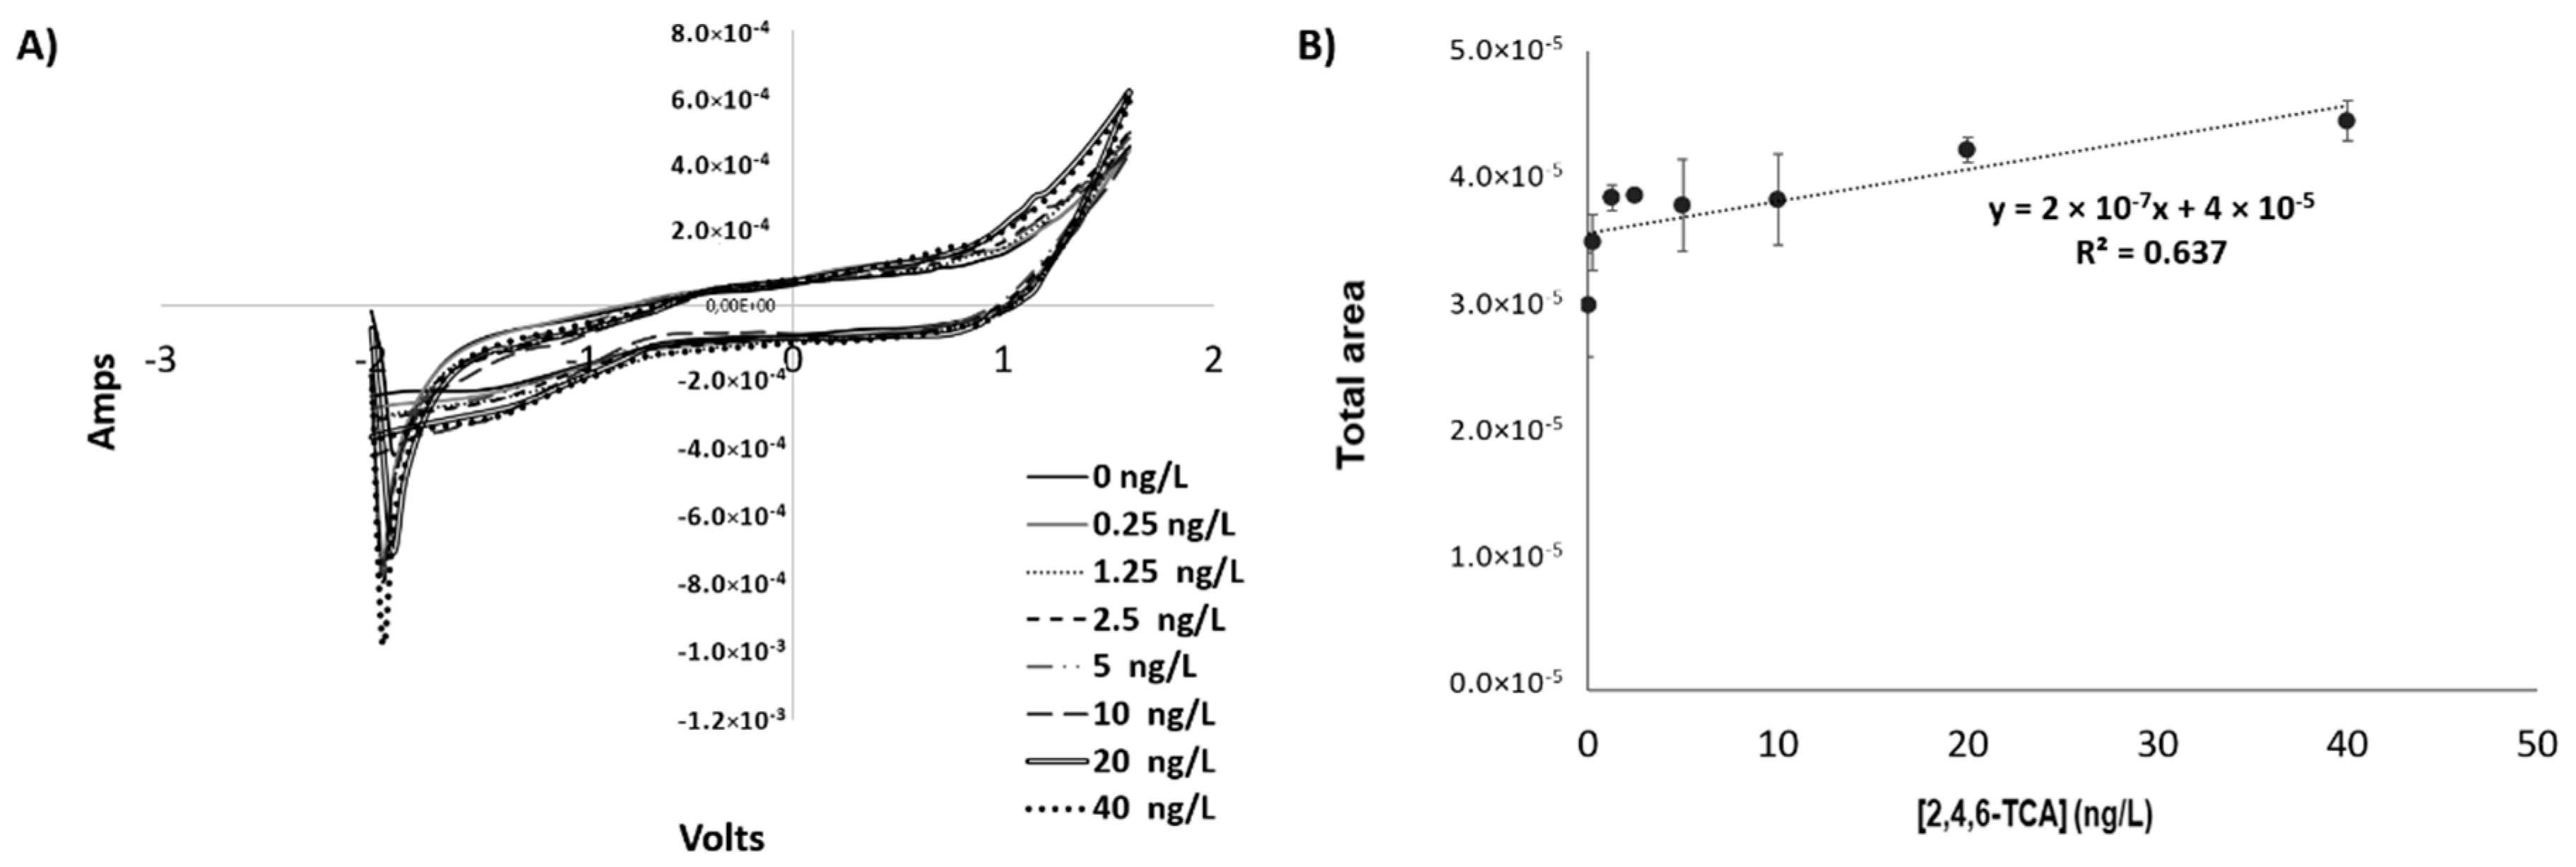
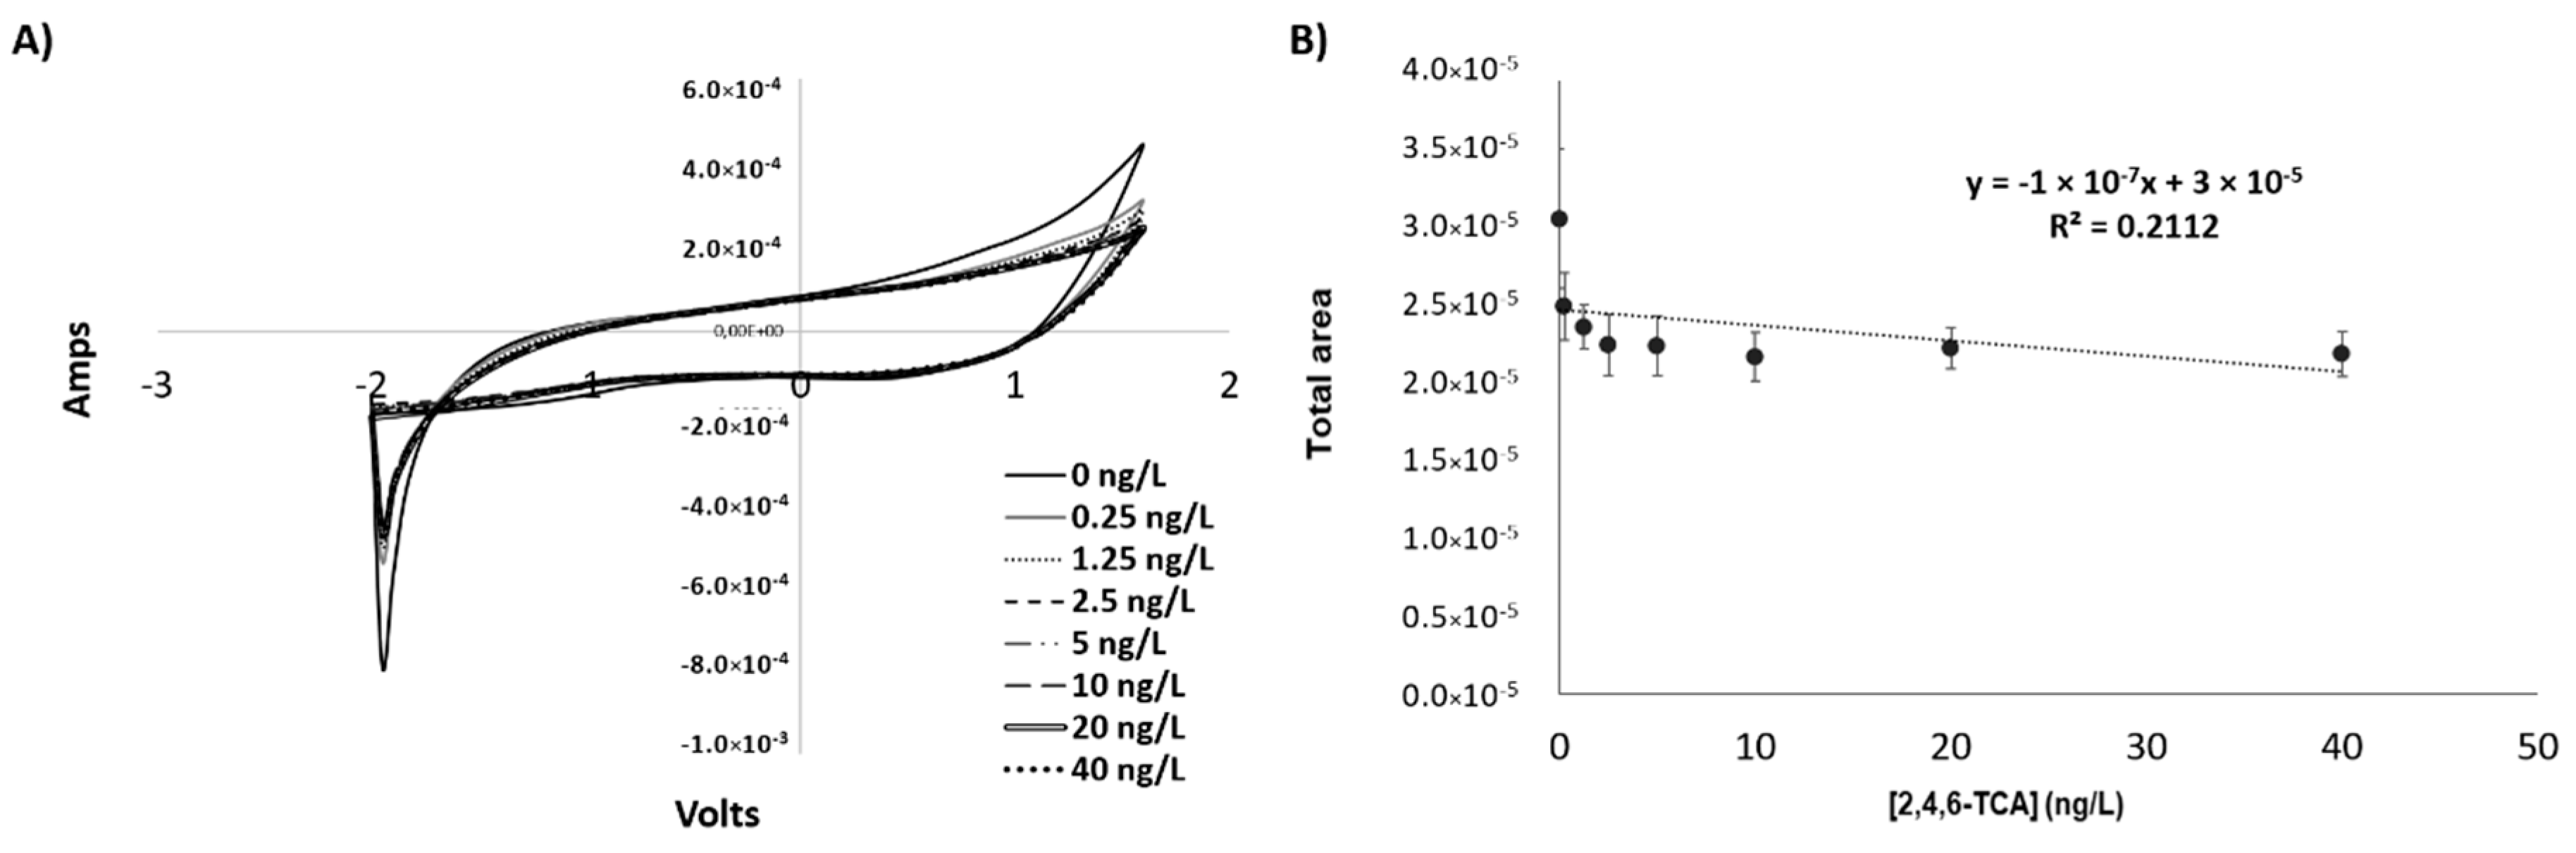
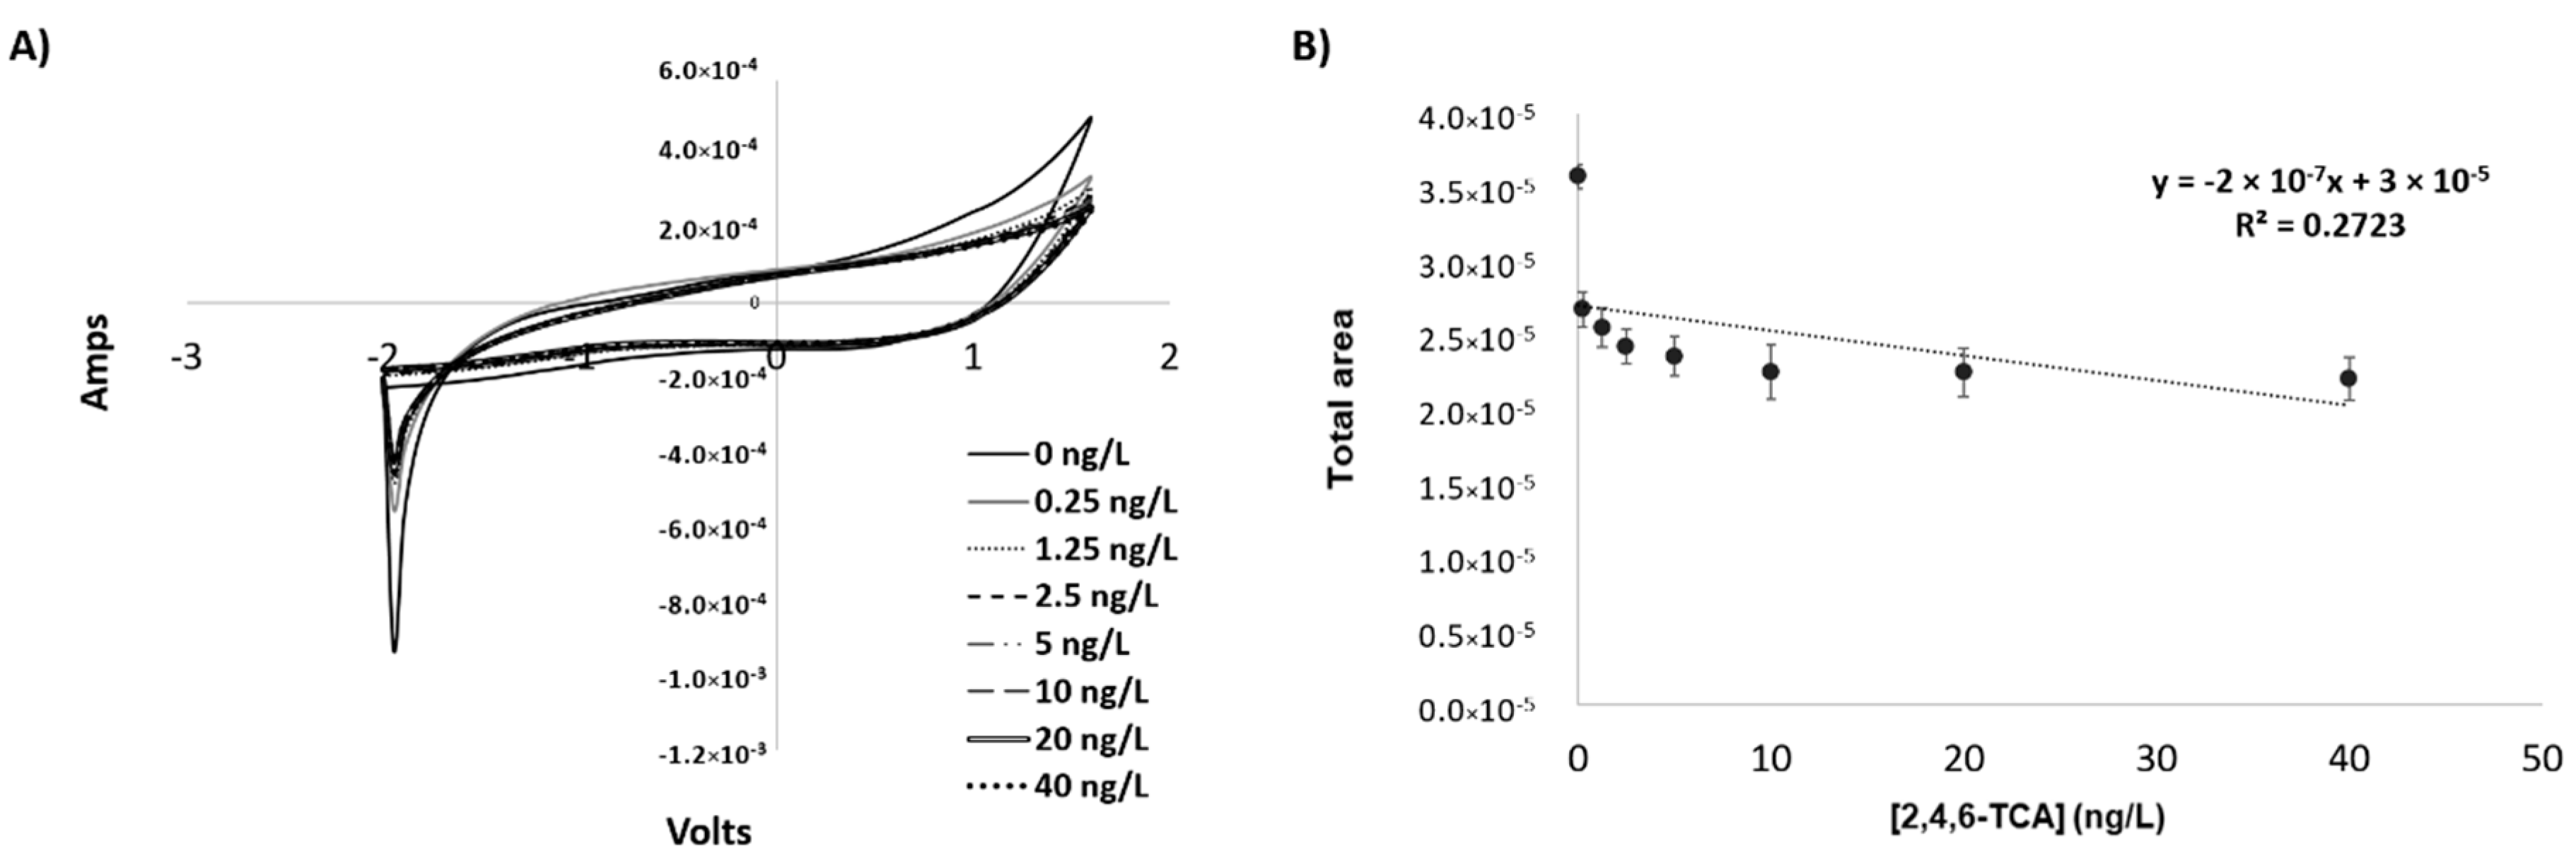
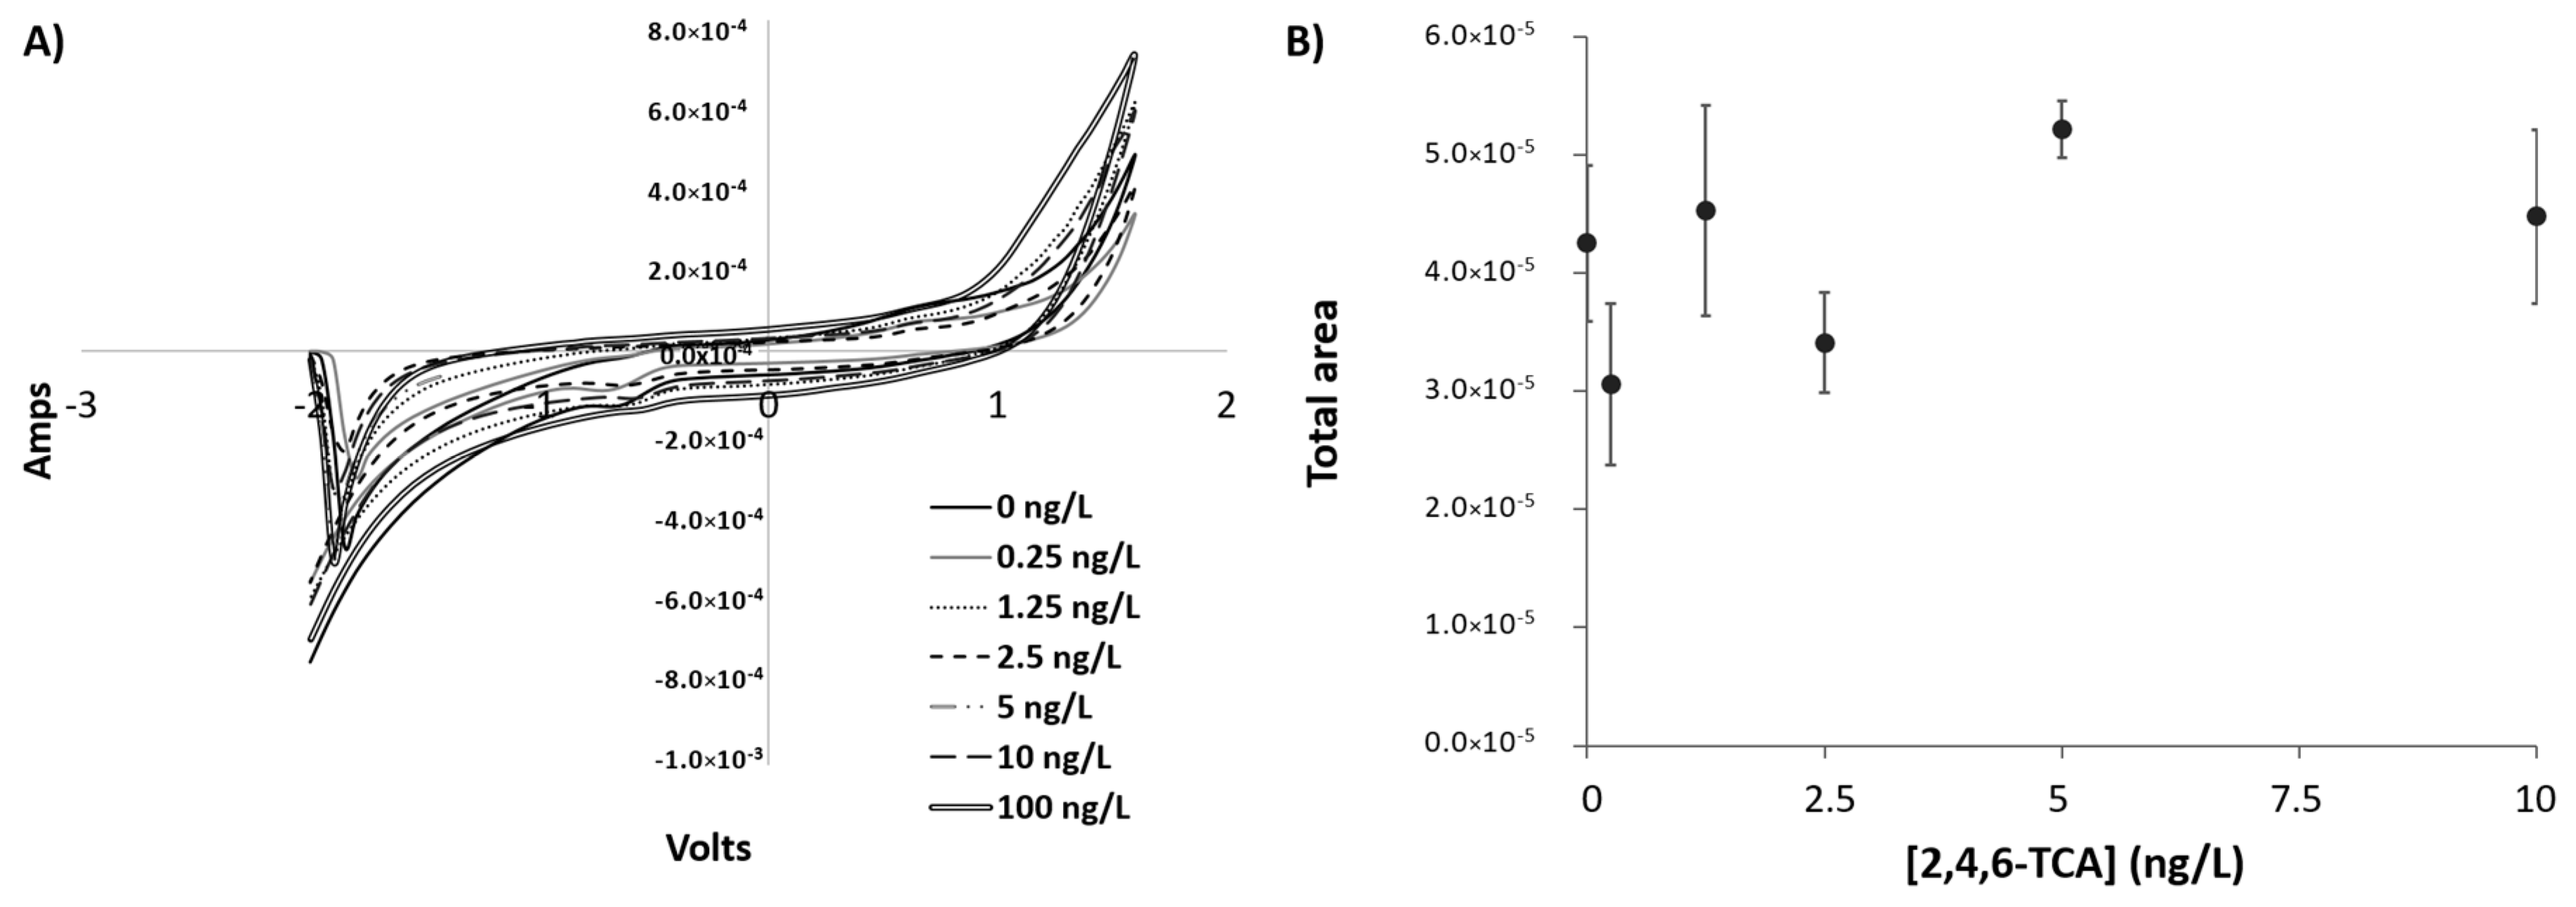
3.3. Cyclic Voltammetry Analysis

The performance of the CV device coupled with a carbon working electrode, a platinum counter electrode and a silver reference electrode, to detect and quantify the 2,4,6-TCA concentration in 0.1 M TBAP ACN/water standard solutions, was evaluated. Firstly, the possible influence of the solvent composition in the voltammetric signal profiles was investigated. Voltammograms of real aqueous samples from cork planks boiling treatment with various 2,4,6-TCA concentrations (0.25, 1.25, 2.5, 5, 10, 20, 40 ng/L) were recorded between −2.0 and 1.6 V, at a potential scan rate of 100 mV/s. The cyclic voltammetric signal profiles obtained (Figure 6A) showed that water was not an appropriate solvent for 2,4,6-TCA quantification (Figure 6B).
For this reason, different solvent mixtures—methanol–water MeOH/H2O (1:1 and 3:2 v/v), acetonitrile–water ACN/H2O (1:1 and 3:2 (v/v))—with tetrabutylammonium perchlorate (TBAP) were tested in the same measurement parameters. The relative volumetric proportion of MeOH/H2O ACN/H2O (3:2, v/v) and the final TBAP concentration (0.1 M), which were used as the supporting electrolytes, have been reported to increase the maximum current intensity when using silver working electrodes [22]. The use of MeOH and ACN as solvents was mainly due to the solubility properties of 2,4,6-TCA and TBAP, which have low solubility in water. Water was used as a co-solvent, since the samples collected from the cork plank boiling process are aqueous solutions.
Figure 7A and Figure 8A show the cyclic voltammograms obtained, with an Ag screen-printed working electrode of different 2,4,6-TCA concentrations, expressed as ng/L, for 0.1 M of TBAP in MeOH/H2O (1:1 and 3:2; v/v). The profiles recorded show, in general, an increasing voltammetric signal with increasing 2,4,6-TCA concentrations in both cathodic and anodic regions. The calibration curves were established (one for each solvent mixture) (Figure 7B and Figure 8B) by relating the amplitude of the current intensity and the 2,4,6-TCA concentrations. The equations resulting from the calibration were y = 5 × 10⁻⁷x + 3 × 10⁻⁵ and y = 2 × 10⁻⁷x + 4 × 10⁻⁵ for MeOH/H2O mixtures 1:1 and 3:2 (v/v), respectively.
Freitas et al. [19] have proposed a technique to detect 2,4,6-TCA with a silver working electrode, a platinum counter electrode, and an Ag/AgCl double-junction reference electrode through CV in acetonitrile/water mixtures with the addition of TBAP. In addition, in another study, they suggested that this technique was suitable for 2,4,6-trichloroanisole quantification in aqueous samples from an industrial cork plank boiling process [21].
Figure 9A and Figure 10A depict the cyclic voltammograms obtained, with an Ag screen-printed working electrode of different 2,4,6-TCA concentrations, expressed as ng/L, for 0.1 M of TBAP in ACN/H2O (1:1 and 3:2; (v/v)). The profiles recorded show a decreasing voltammetric signal with increasing 2,4,6-TCA concentrations, in both cathodic and anodic regions, in contrast to MeOH/H2O mixtures. The calibration curves were established (one for each solvent mixture) (Figure 9B and Figure 10B) by relating the amplitude of the current intensity and 2,4,6-TCA concentrations. The equations resulting from the calibration were y = −1 × 10⁻⁷x + 3 × 10⁻⁵ and y = −2 × 10⁻⁷x + 3 × 10⁻⁵ for ACN/H2O mixtures 1:1 and 3:2 (v/v), respectively, and R2 were lower than 0.25 for both ACN/H2O mixtures.
After the comparison of the average responses of the standard 2,4,6-TCA concentrations over all four solvent ratios (MeOH/water, ACH/water, 1:1, 3:2 (v/v)), no significant differences between the samples could be observed in the no-solvent ratio.

4. Discussion

The BERA-based biosensor developed in the framework of the present study is the first approach towards the establishment of a rapid and portable screening test for 2,4,6-TCA in water extracts from oak barrels. In the past, very few attempts to develop such a test have been reported, while the majority of biosensors and similar technologies for the determination of 2,4,6-TCA were focused on cork or wine as the sample matrices. An extensive review on this subject is provided by Mavrikou and Kintzios [23].
Τhe majority of reported biosensor-based approaches for 2,4,6-TCA detection and determination require considerable validation and optimization before being used as official screening tools. According to recent reports, the wine matrix significantly alters the results of the immunoassay-based methods [24]. Biosensors developed for 2,4,6-TCA detection must be improved in terms of selectivity and sensitivity [9,11]. However, in comparison with conventional analytical methods, they have many advantages, such as extremely high speed, low cost, and ease of handling [17,25].
The results obtained by testing the innovative biosensor system against control samples spiked with different 2,4,6-TCA concentrations clearly indicate that it is possible to detect the target analyte qualitatively, i.e., to distinguish between a TCA-free and a TCA-contaminated sample. As also shown in the present study, partial qualitative determination of 2,4,6-TCA above the cut-off concentration of 2.5 ng/L is possible by electroinserting 0.3 ng/mL anti-TCA antibody into the sensory cells. In other words, different versions of the biorecognition element (varying concentrations of electroinserted antibodies in membrane-engineered cells) allowed for different biosensor performances. It is, therefore, theoretically possible to improve quantitative determination by choosing the optimal concentration of electroinserted antibody. This hypothesis should be tested in further experiments. Moreover, the specificity of the BERA-approach combined with cells membrane-engineered with anti-TCA antibodies against other, possibly interfering haloanisoles (2,4,6-TCP, 2,4,6-TBA, 2,6-DCA, 2,3-DCA, 3,5-DCA and 2,3,4,5-TeCA) has already been tested and reported previously [15].
Compared with more conventional cyclic voltammetric electrochemical approach, which was also investigated in the present study, we observed that the BERA approach allowed for a much better resolution between different concentrations in the range between 0 and 10 ng/L. In addition, the BERA approach required lesser sample preparation compared to CV. Both methods were characterized by very high speed (BERA: 5 min, CV: 1 min), and were equally adaptable to portable devices. However, the samples measurements with the CV method did not fit the proposed standard curve models, possibly due to low sensitivity (lack of a biorecognition element), and no differences were observed between the samples.

5. Conclusions

In conclusion, we feel that the present study can be potentially used as the basis for the further development of a POT biosensor device for the routine, high throughput detection of 2,4,6-TCA in oak barrel water extracts. Areas needing further study and possible improvement to the BERA-TCA system include:
  • The validation of the method with actual samples in the framework of a double-blind trial
  • The investigation of the extent of possible interference by compounds structurally related to 2,4,6-TCA (e.g., other haloanisoles)
  • The establishment of the range of quantitative determination

Author Contributions

Conceptualization, S.K.; Investigation, S.M., G.M. and D.V.; Methodology, S.M. and G.M.; Resources, D.V.; Supervision, S.K.; Writing—Original draft, S.M. and G.M.; Writing—Review & Editing, S.K.

Funding

This research received no external funding and it has been solely funded by the authors’ organizations.

Conflicts of Interest

The authors declare no conflict of interest.

References

  1. Bhisey, R. Wine Barrel Market—Rising Demand for Wine to Be the Key Driving Factor. Available online: http://www.techyounme.com/wine-barrel-market-rising-demand-wine-key-driving-factor/ (accessed on 28 June 2018).
  2. Anonymous. Medium Plus Toast Segment by Toast Level Type to Witness the Fastest Revenue Growth in the Global Wine Barrel Market; Future Market Insights: Valley Cottage, NY, USA; London, UK, 2017. [Google Scholar]
  3. Bai, X.; Zhang, T.; Qu, Z.; Li, H.; Yang, Z. Contribution of filamentous fungi to the musty odorant 2,4,6-trichloroanisole in water supply reservoirs and associated drinking water treatment plants. Chemosphere 2017, 182, 223–230. [Google Scholar] [CrossRef] [PubMed]
  4. Chatonnet, P.; Fleury, A.; Boutou, S. Identification of a new source of contamination of Quercus sp. oak wood by 2,4,6-trichloroanisole and its impact on the contamination of barrel-aged wines. J. Agric. Food Chem. 2010, 58, 10528–10538. [Google Scholar] [CrossRef] [PubMed]
  5. Fontana, A. Analytical methods for determination of cork-taint compounds in wine. Trends Anal. Chem. 2012, 37, 135–147. [Google Scholar] [CrossRef]
  6. Vlachos, P.; Kampioti, A.; Kornaros, M.; Lyberatos, G. Matrix effect during the application of a rapid method using HS-SPME followed by GC–ECD for the analysis of 2,4,6-TCA in wine and cork soaks. Food Chem. 2007, 105, 681–690. [Google Scholar] [CrossRef]
  7. Anonymous. Cork Stoppers—Determination of Releasable 2,4,6-Trichloroanisol (TCA); ISO20752:2014(E); International Organization for Standardization: Geneva, Switzerland, 2014. [Google Scholar]
  8. Anonymous. Determination of releasable 2,4,6 trichloroanisole in wine by cork stoppers. Compendium of International Analysis of Methods 2009, Method OIV-MA-AS315-16.
  9. Slabizki, P.; Fischer, C.; Legrum, C.; Schmarr, H. Characterization of Atypical Off-Flavor Compounds in Natural Cork Stoppers by Multidimensional Gas Chromatographic Techniques. J. Agric. Food Chem. 2015, 63, 7840–7848. [Google Scholar] [CrossRef] [PubMed]
  10. Tarasov, A.; Rauhut, D.; Jung, R. “Cork taint” responsible compounds. Determination of haloanisoles and halophenols in cork matrix: A review. Talanta 2017, 175, 82–92. [Google Scholar] [CrossRef] [PubMed]
  11. Pizarro, C.; Pérez-del-Notario, N.; González-Sáiz, J. Optimisation of a microwave-assisted extraction method for the simultaneous determination of haloanisoles and halophenols in cork stoppers. J. Chromatogr. A 2007, 1149, 138–144. [Google Scholar] [CrossRef] [PubMed]
  12. Kintzios, S.; Pistola, E.; Konstas, J.; Bem, F.; Matakiadis, T.; Alexandropoulos, N.; Biselis, I.; Levin, R. Application of the Bioelectric recognition assay (BERA) for the detection of human and plant viruses: Definition of operational parameters. Biosens. Bioelectron. 2001, 16, 467–480. [Google Scholar] [CrossRef]
  13. Kintzios, S.; Pistola, E.; Panagiotopoulos, P.; Bomsel, M.; Alexandropoulos, N.; Bem, F.; Biselis, I.; Levin, R. Bioelectric recognition assay (BERA). Biosens. Bioelectron. 2001, 16, 325–336. [Google Scholar] [CrossRef]
  14. Apostolou, T.; Pascual, N.; Marco, M.P.; Moschos, A.; Petropoulos, A.; Kaltsas, G.; Kintzios, S. Extraction-less, rapid assay for the direct detection of 2,4,6-trichloroanisole (TCA) in cork samples. Talanta 2014, 125, 336–340. [Google Scholar] [CrossRef] [PubMed]
  15. Varelas, V.; Sanvicens, N.; Pilar-Marco, M.; Kintzios, S. Development of a cellular biosensor for the detection of 2,4,6-trichloroanisole (TCA). Talanta 2011, 84, 936–940. [Google Scholar] [CrossRef] [PubMed]
  16. Chatonnet, P.; Boutou, S. Process of Monitoring the Contamination of Barrel. U.S. Patent 2011/0113868 A1, 2011. [Google Scholar]
  17. Ferentinos, K.P.; Yialouris, C.P.; Blouchos, P.; Moschopoulou, G.; Tsourou, V.; Kintzios, S. Pesticide Residue Screening Using a Novel Artificial Neural Network Combined with a Bioelectric Cellular Biosensor. BioMed Res. Int. 2013. [Google Scholar] [CrossRef] [PubMed]
  18. Moschopoulou, G.; Dourou, A.M.; Fidaki, A.; Kintzios, S. Assessment of pesticides cytoxicity by means of bioelectric profiling of mammalian cells. Environ. Nanotechnol. Monit. Manag. 2017, 8, 254–260. [Google Scholar] [CrossRef]
  19. Freitas, P.; Dias, L.G.; Peres, A.M.; Castro, L.M.; Veloso, A.C.A. Determination of 2,4,6-Trichloroanisole by Cyclic Voltammetry. Procedia Eng. 2012, 47, 1125–1128. [Google Scholar] [CrossRef] [Green Version]
  20. Peres, A.M.; Freitas, P.; Dias, L.G.; Sousa, M.E.B.C.; Castro, L.M.; Veloso, A.C.A. Cyclic voltammetry: A tool to quantify 2,4,6-trichloroanisole in aqueous samples from cork planks boiling industrial process. Talanta 2013, 117, 438–444. [Google Scholar] [CrossRef] [PubMed] [Green Version]
  21. Warwick, M.J. Standardisation of immunoassay. In Immunoassay, A Practical Guide; Brian, L., Ed.; Taylor & Francis Ltd.: London, UK, 1996; p. 160. ISBN 9781482272857. [Google Scholar]
  22. Fry, A.J.; Britton, E. Solvent and supporting electrolytes. In Laboratory Techniques in Electroanalytical Chemistry; Kissinger, P.T., Heineman, W.R., Eds.; Marcel Dekker: New York, NY, USA; Basel, Switzerland, 1996; pp. 467–485. ISBN 9780824794453. [Google Scholar]
  23. Mavrikou, S.; Kintzios, S. Biosensor-based approaches for detecting ochratoxin A and 2,4,6-trichloroanisole in beverages. Beverages 2018, 4, 24. [Google Scholar] [CrossRef]
  24. Jeleń, H.; Dziadas, M.; Majcher, M. Different headspace solid phase microextraction--gas chromatography/mass spectrometry approaches to haloanisoles analysis in wine. J. Chromatogr. A 2013, 1313, 185–193. [Google Scholar] [CrossRef] [PubMed]
  25. Moore, E.; Pravda, M.; Guilbault, C. Development of a biosensor for the quantitative detection of 2,4,6-trichloroanisole using screen printed electrodes. Anal. Chim. Acta 2003, 484, 15–24. [Google Scholar] [CrossRef]
Figure 1. (A) The cell-based, BERA-compatible portable potentiometric biosensor (1) with a custom-designed sensor strip-connection interface (2) allowed for measurements of up to eight channels synchronously or independently; (B) Testing results are displayed in real time on screen, and also stored for later processing.
Beverages 05 00001 g001
Figure 2. The cyclic voltammetric version of the biosensor, allowing for measurements of up to eight channels synchronously or independently. Stars indicate a group of disposable screen-printed electrodes.
Beverages 05 00001 g002
Figure 3. Representative patterns of time-dependent bioelectric responses of Vero cells membrane-engineered with the anti-TCA antibody against increasing concentrations of 2,4,6- trichloroanisole (2,4,6-TCA) spiked in TCA-free oak barrel water extract. Note the increasing cell membrane hyperpolarization (decline to negative values) with increasing 2,4,6-TCA concentrations.
Beverages 05 00001 g003
Figure 4. Average normalized biosensor responses against the different spiked 2,4,6-TCA concentrations using cellular biorecognition elements membrane-engineered with 0.5 ng/L anti-TCA antibody (n = 24 replications for each concentration, and error bars represent the standard errors of the average value of all replications with each range of concentration). Different letters (a, b) indicate statistically significant different values (p < 0.01).
Beverages 05 00001 g004
Figure 5. The average normalized biosensor responses against the different spiked 2,4,6-TCA concentrations using cellular biorecognition elements membrane-engineered with 0.3 ng/mL anti-TCA antibody (n = 24 replications for each concentration, and error bars represent the standard errors of the average value of all replications with each range of concentration). Different letters (a, b, c, d) indicate statistically significant different values (p < 0.01).
Beverages 05 00001 g005
Figure 6. Cyclic voltammograms for H2O (100% v/v) without (0 ng/L, black line) and with 2,4,6-TCA addition (0.25 to 100 ng/L) (A); Schematic representation of different 2,4,6-TCA concentrations in real aqueous samples from cork planks boiling treatment, estimated by the proposed CV method (B).
Beverages 05 00001 g006
Figure 7. Cyclic voltammograms for MeOH/H2O mixtures (1:1 (v/v) with 0.1 M of TBAP) without (0 ng/L, black line) and with 2,4,6-TCA addition (0.25 to 40 ng/L) (A); Schematic representation of the calibration curve obtained for different 2,4,6-TCA concentrations in MeOH/H2O mixtures (1:1 (v/v) with 0.1 M of TBAP) (B).
Beverages 05 00001 g007
Figure 8. Cyclic voltammograms for MeOH/H2O mixtures (3:2 (v/v) with 0.1 M of TBAP) without (0 pg/mL, black line) and with 2,4,6-TCA addition (0.25 to 40 ng/L) (A); Schematic representation of the calibration curve obtained for different 2,4,6-TCA concentrations in MeOH/H2O mixtures (3:2 (v/v) with 0.1 M of TBAP) (B).
Beverages 05 00001 g008
Figure 9. Cyclic voltammogram for ACN/H2O mixtures (1:1 (v/v) with 0.1 M of TBAP) without (0 ng/L, black line) and with 2,4,6-TCA addition (0.25 to 40 ng/L) (A); Schematic representation of the calibration curve obtained for different 2,4,6-TCA concentrations in ACN/H2O mixtures (1:1 (v/v) with 0.1 M of TBAP) (B).
Beverages 05 00001 g009
Figure 10. Cyclic voltammogram for ACN/H2O mixtures (3:2 (v/v) with 0.1 M of TBAP) without (0 ng/L, black line) and with 2,4,6-TCA addition (0.25 to 40 ng/L) (A), Schematic representation of the calibration curve obtained for different 2,4,6-TCA concentrations in ACN/H2O mixtures (3:2 (v/v) with 0.1 M of TBAP) (B).
Beverages 05 00001 g010

