Computer Vision Method in Beer Quality Evaluation—A Review
by
 , , , and
Jasmina Lukinac
1 ,
,
Kristina Mastanjević
1,* ,
,
Krešimir Mastanjević
1 ,
,
Gjore Nakov
2 and
Marko Jukić
1 1
Faculty of Food Technology Osijek, Josip Juraj Strossmayer University of Osijek, Franje Kuhača 20, 31000 Osijek, Croatia
2
Department of Biotechnology and Food Technology, University of Ruse Angel Kanchev, Branch Razgrad, Aprilsko vastanie Blvd. 47, Razgrad 7200, Bulgaria
*
Author to whom correspondence should be addressed.
Beverages 2019, 5(2), 38; https://0-doi-org.brum.beds.ac.uk/10.3390/beverages5020038
Submission received: 8 April 2019
/
Revised: 27 April 2019
/
Accepted: 16 May 2019
/
Published: 1 June 2019
(This article belongs to the Special Issue Brewing and Craft Beer)
Abstract
:Beers are differentiated mainly according to their visual appearance and their fermentation process. The main quality characteristics of beer are appearance, aroma, flavor, and mouthfeel. Important visual attributes of beer are foam appearance (volume and persistence), as well as the color and clarity. To replace manual inspection, automatic, objective, rapid and repeatable external quality inspection systems, such as computer vision, are becoming very important and necessary. Computer vision is a non-contact optical technique, suitable for the non-destructive evaluation of the food product quality. Currently, the main application of computer vision occurs in automated inspection and measurement, allowing manufacturers to keep control of product quality. This paper presents an overview of the applications and the latest achievements of the computer vision methods in determining the external quality attributes of beer.
1. Introduction
Beer is one of the oldest (low) alcoholic beverages in the world and the third most widely-consumed drink (after water and tea). Today, besides industrial commercial beers, craft beer has gained great popularity among consumers [1]. Beer is produced in a brewing process from malt, water, brewer’s yeast, and hops. The basic quality characteristics of beer are divided into visual and sensory attributes. Appearance is the first attribute that consumer experiences (and evaluates) when he/she gets a glass of beer. Important visual characteristics of beer are foam appearance (volume and persistence), as well as color and clarity of the beer. Perception and acceptability of beer are also determined by other properties e.g., the alcohol content (expressed as Alcohol by volume, ABV or Alcohol by weight, ABW), carbon dioxide content, the presence/absence of off-flavors in bottled beer [2,3,4], aroma, mouthfeel and bitterness (listed in International Bitterness Units, or IBUs).
The main collections of the standard methods of beer analysis used worldwide are methods of the Institute of Brewing and Distilling (IBD), American Society of Brewing Chemists (ASBC), European Brewery Convention (EBC), and Central European Commission for Brewing Analysis (MEBAK). Beers are differentiated mainly according to their visual appearance (depends on its color and turbidity) and their fermentation process. Regarding the yeast used and the fermentation temperature, beer can be categorized in the three main categories: top-fermented (ale), bottom-fermented (lager), and naturally fermented beer. Beer classification can be done regarding the color during the production process. Beer color is determined by the malt color that develops during the Maillard reactions and caramelization in the malting and roasting process [5]. Therefore, it is possible to distinguish bright, red, dark and black beer color. The aforementioned beer color is actually different shades of yellow, red, brown and black; the most common color is a pale amber produced from pale malts. Commonly used methods for beer classification are flame atomic spectroscopy, linear discriminant analysis [6], nuclear magnetic resonance and multivariate analysis [7,8], and Fourier transform infrared spectroscopy analysis [9]. Trained human inspectors usually perform an inspection of food sensory quality, but this method is unreliable because the results may vary due to subjective evaluations by the inspectors.
Given the unreliability of the human inspectors, there is a need for a precise, objective, and reproducible instrumental method that could imitate human testing methods. Based on this assumption, researches try to develop an instrumental method to evaluate the external and internal appearance of the product non-destructively. Due to a visual inspection, monitoring the external quality attributes is time-consuming, and the computer vision method enables to perform this task automatically. Remembering that a way to improve brewing techniques, rapid feedback from quality control is required. Therefore, the development and implementation of new methods are of great importance in the beer industry. This paper covers an overview of the current achievements in applying the computer vision methods to determine the external quality attributes of beer.
2. Computer Vision and Image Analysis-Basics
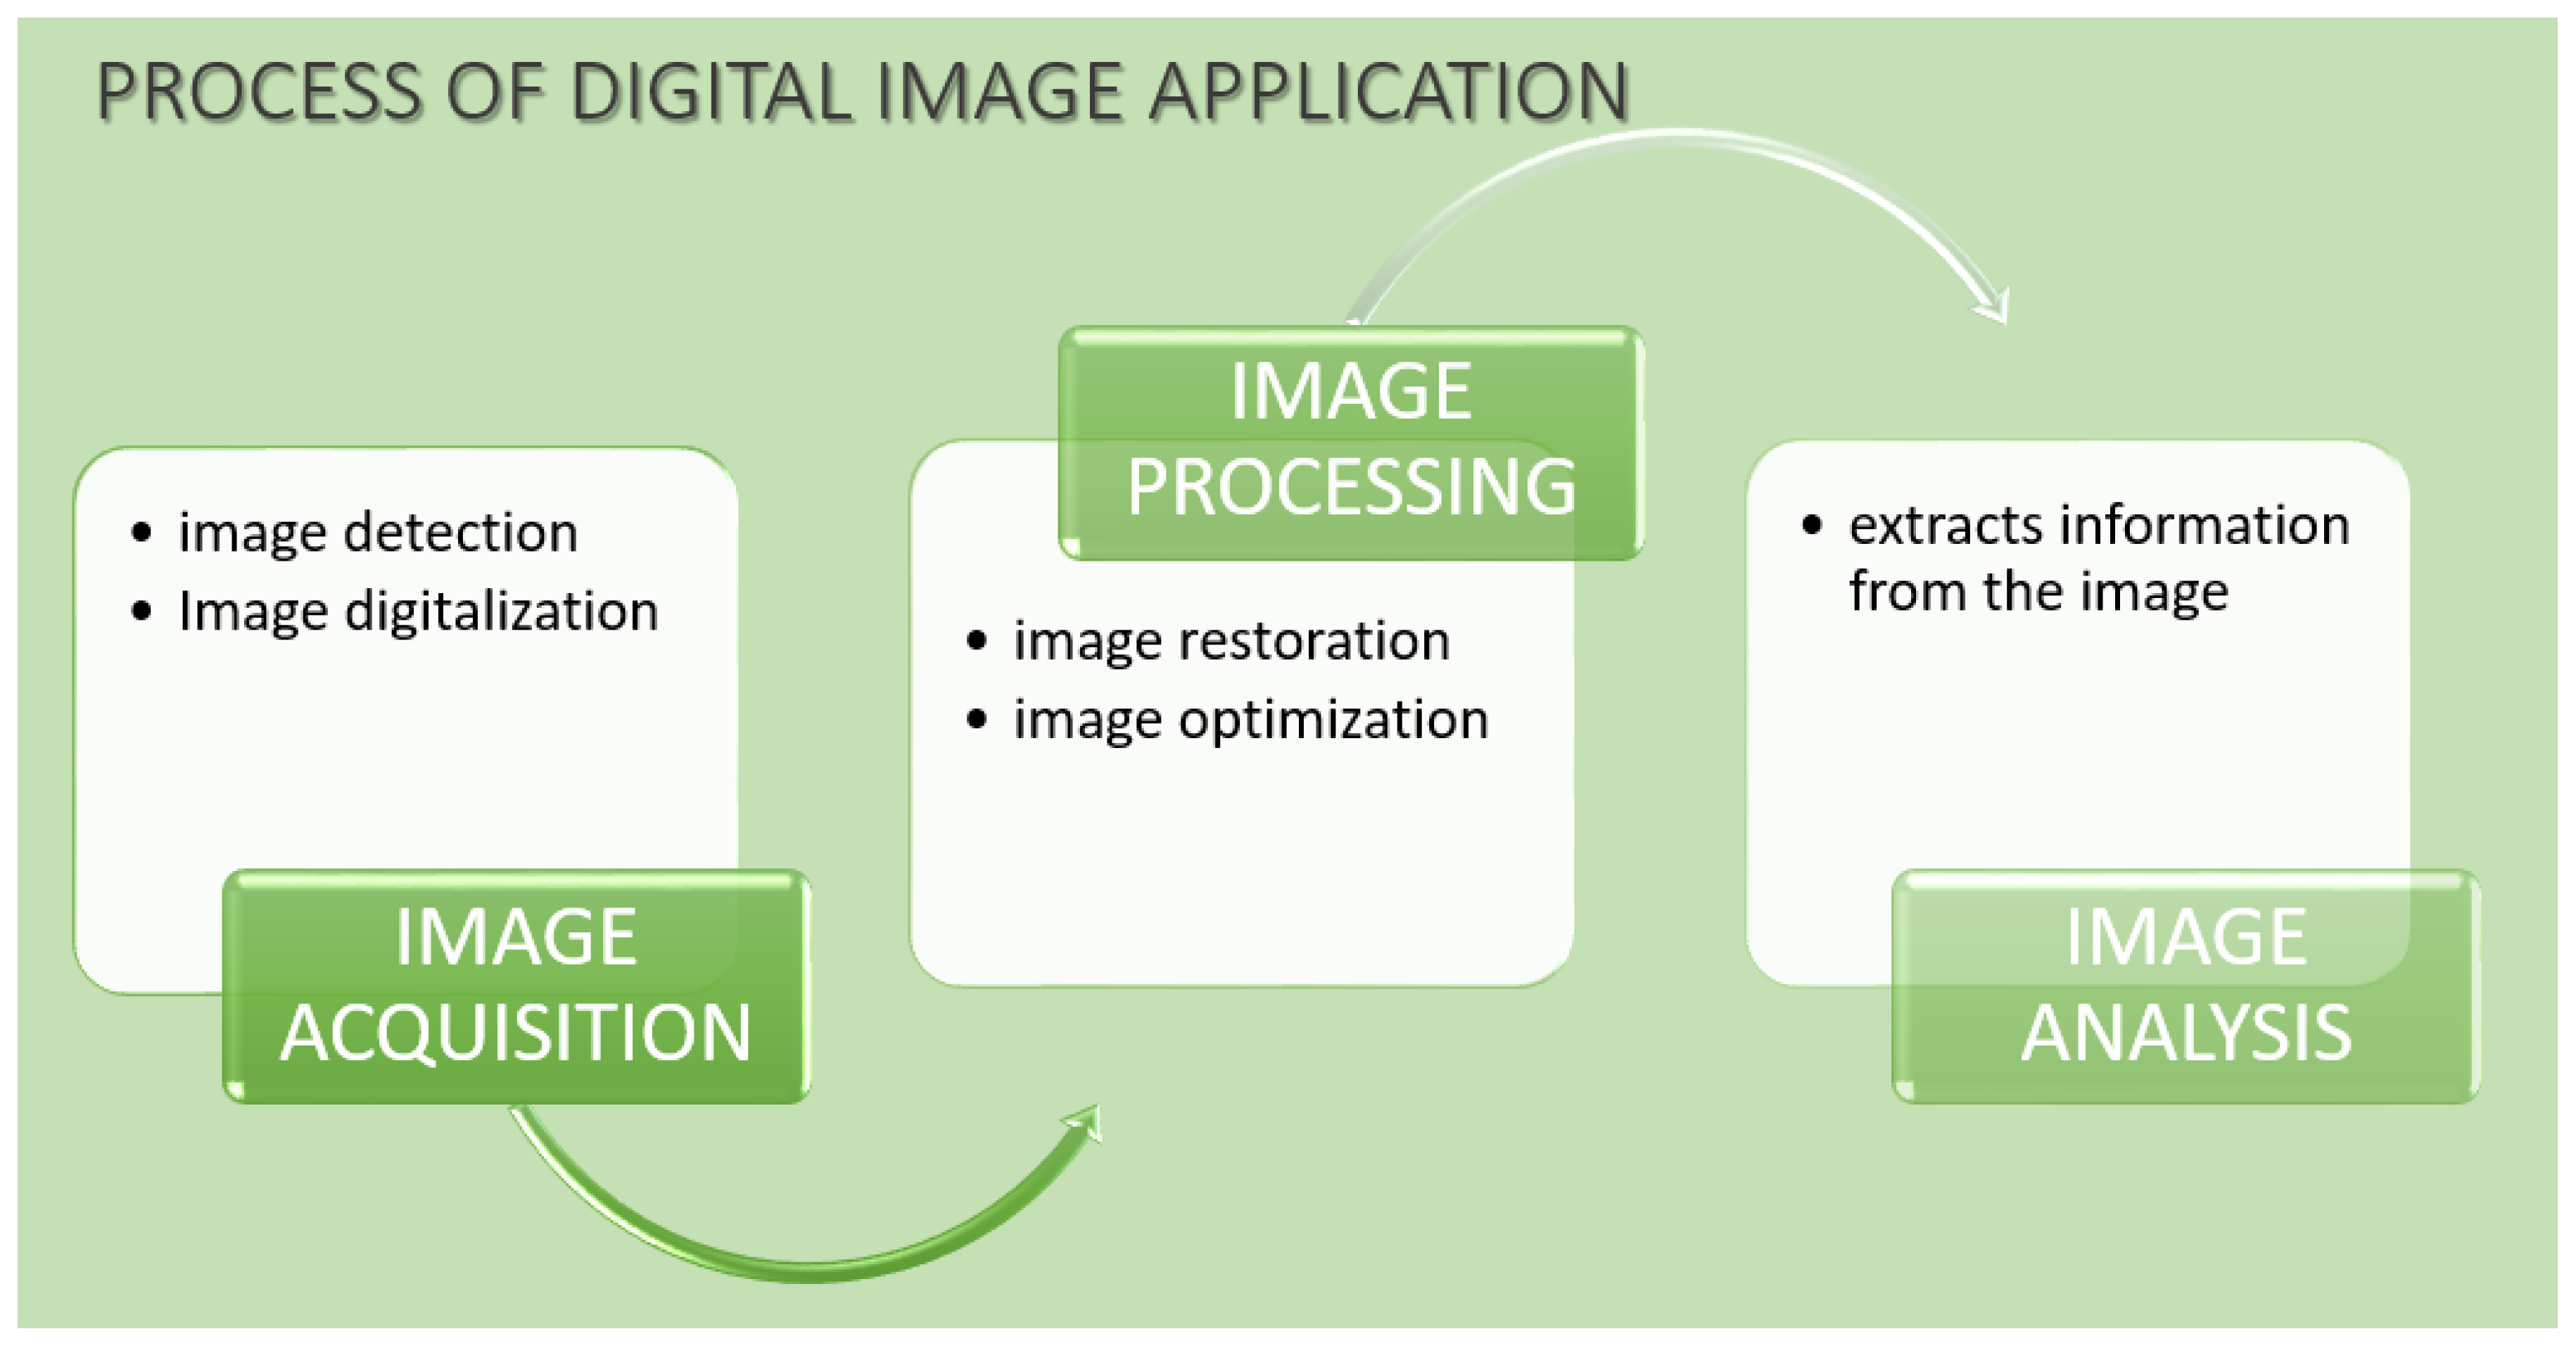
Computer vision system (CVS) is a non-destructive technique that includes several different technologies, e.g., optical, mechanical and electromagnetic instrumentation, and digital image processing [10]. CVS is the automatic extraction of information from digital images. CVS is a rapid, objective and effective alternative over the destructive methods [11,12]. Computer vision includes several operations: image capturing, processing and image analysis (Figure 1). After image capture, there is a process of digitization (transformation images into numbers) [13,14].
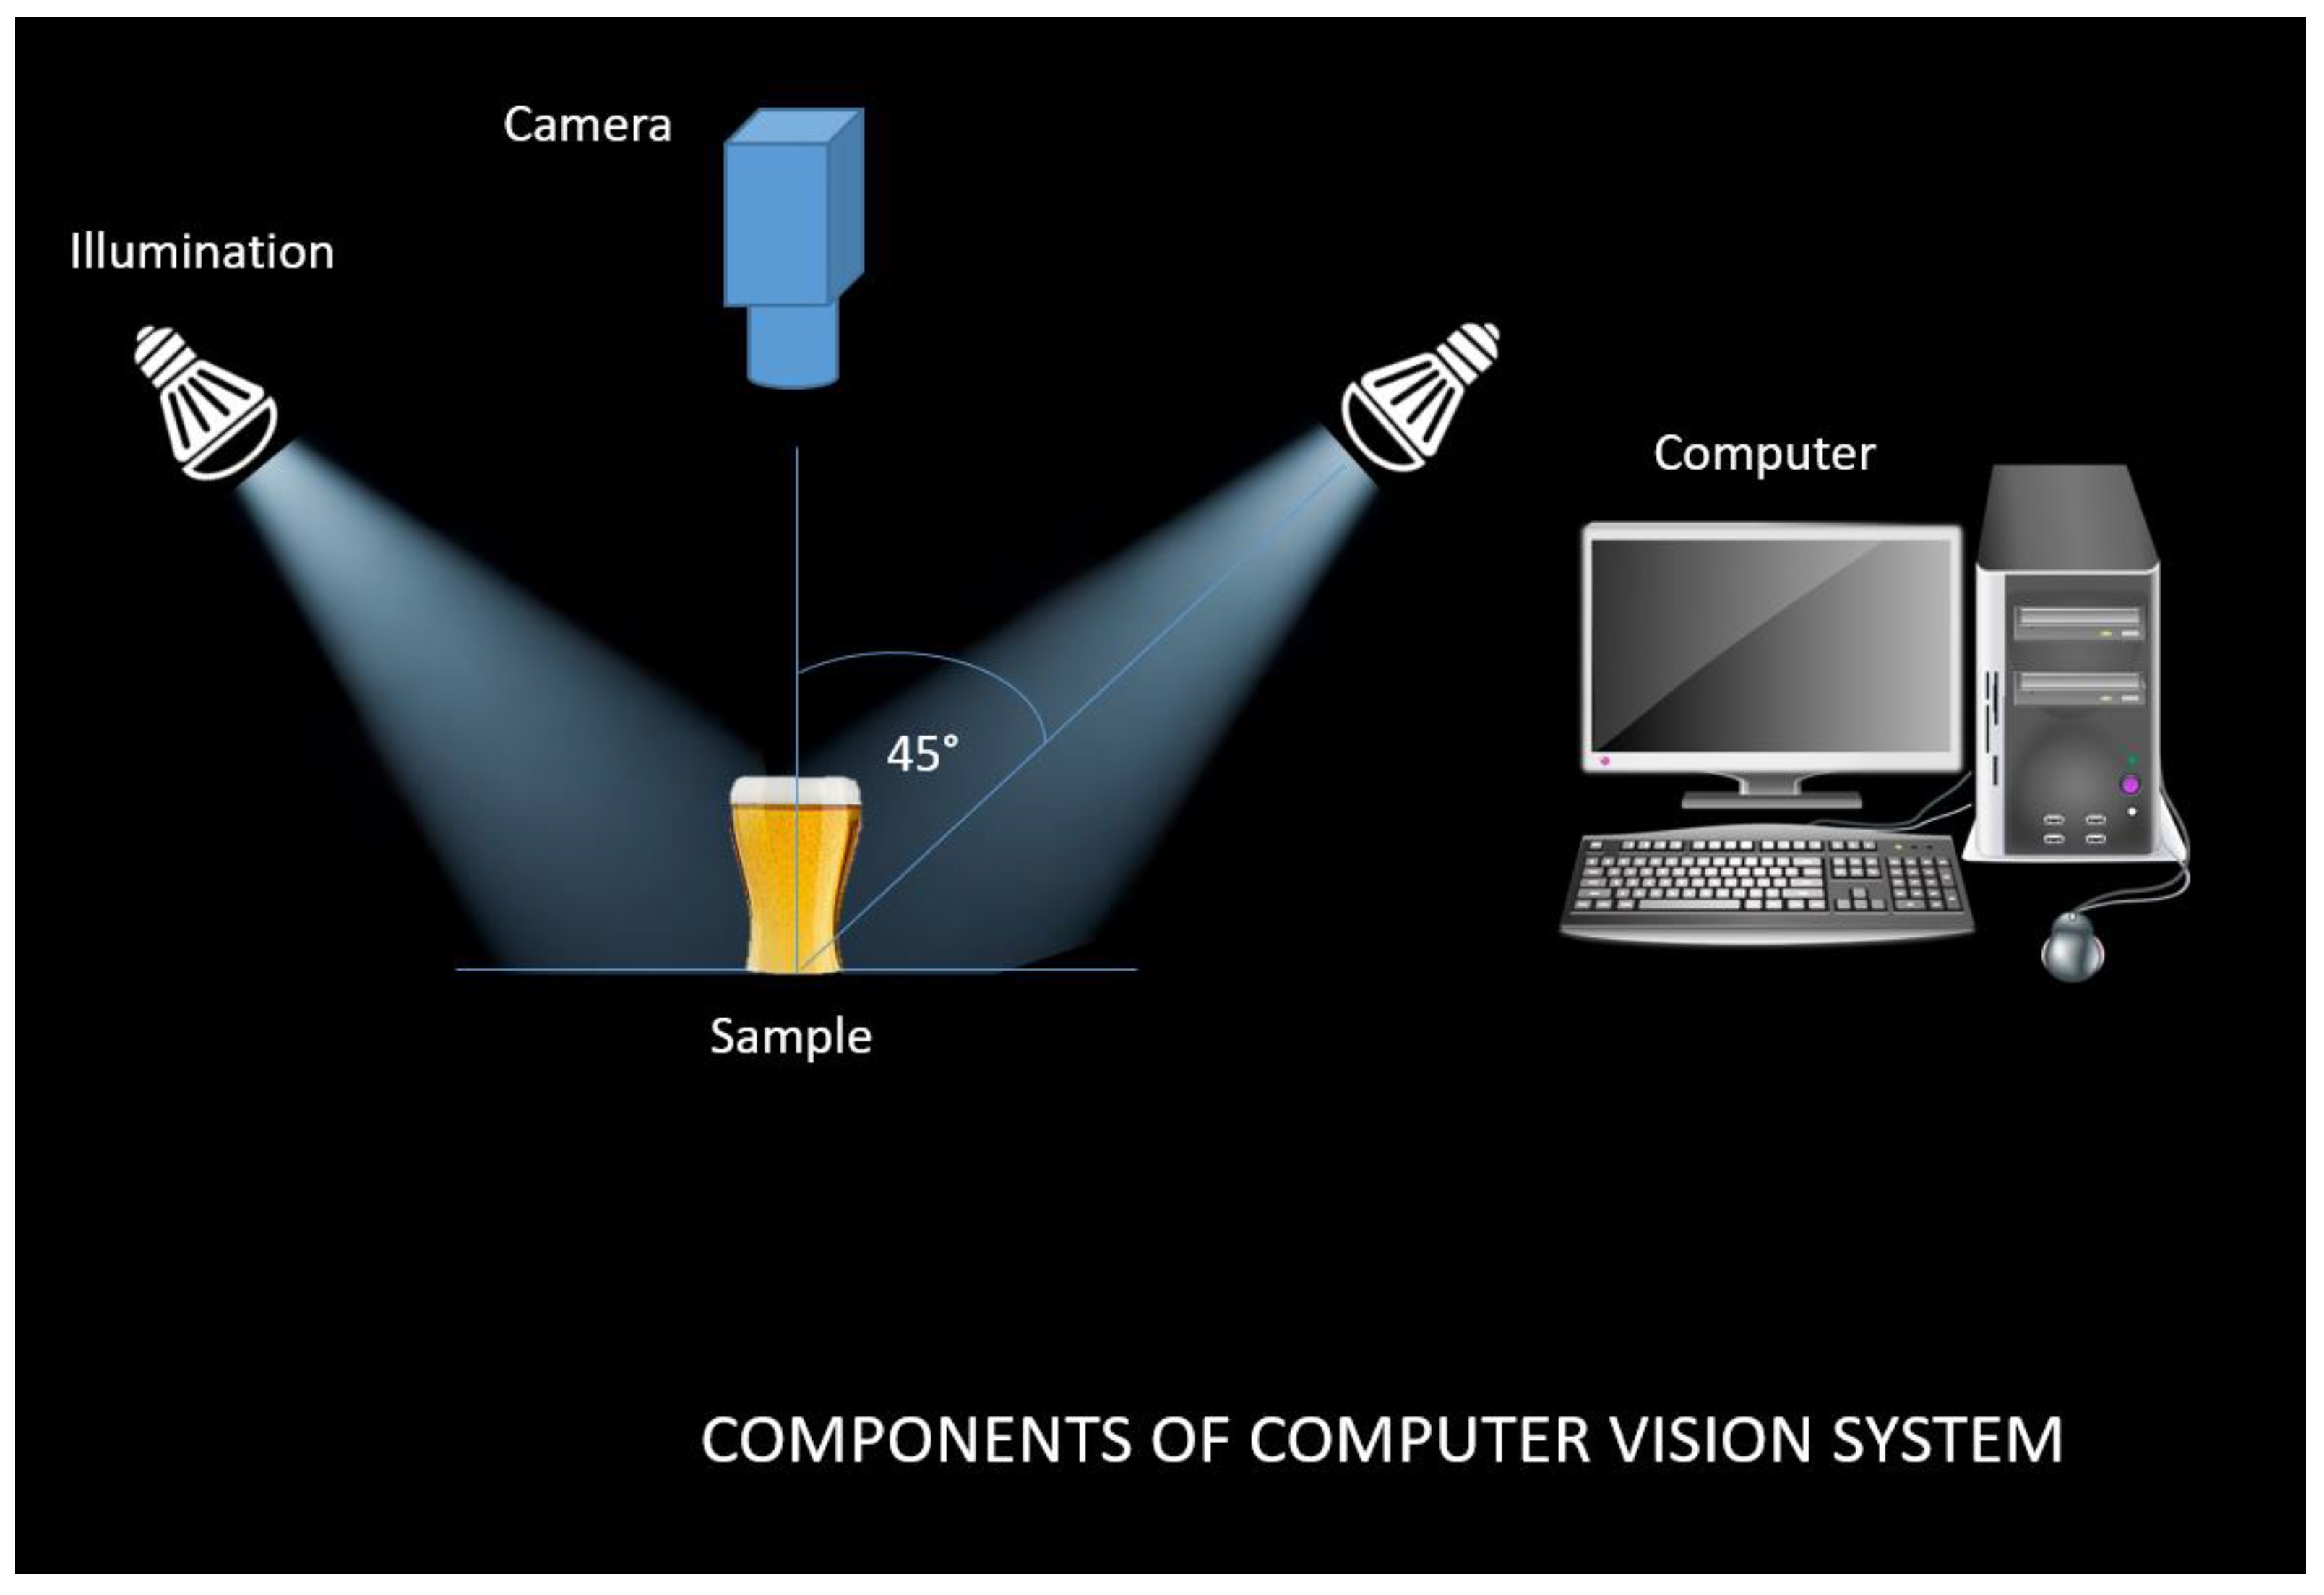
CVS can measure the external features of products, recognize objects and extract quantitative information from digital images [15]. Currently, the main application of CVS occurs in the automated inspection providing constant control of product quality. Configuration of CVS is relatively standard, basic components are illumination device (lights), a device for image acquisition (digital camera/scanner), frame grabber (in the case of an analog camera), and computer hardware and software (algorithms for image analyzing and pre-processing) [16,17].
2.1. Illumination
With the camera, one of the most important elements of the CVS system is the illumination. The illumination device is used for object illumination under test. There are many properties of illumination (light angle of incidence, light source color, direct/diffuse light technique), which must be selected in such a way to reduce disturbances (shadows, reflections, noise) or enhance image contrast [14,18,19]. Suitable illumination increases the quality of captured images and improves the accuracy of the analysis. There are several simple rules and good practices that can help select the proper illumination and improve the image quality:
- maximizing the contrast of the features that must be inspected or measured
- minimizing the contrast of the features of no interest
- getting rid of unwanted variations caused by ambient light and differences between items that are non-relevant to the inspection task.
To view an object, it is necessary for it to be illuminated by a light source. The color perception of an object depends on the color of the light source and the color of the surface. Considering the color, we distinguish these light colors: red, green, blue, white with particular color temperature, infrared, and ultraviolet. Light sources may be either natural (sunlight) or artificial (incandescent, halogen, fluorescent, compact fluorescent, LED, metal halide, Xenon, High Pressure Sodium, lasers, and infrared lamps) [20,21,22,23]. The most suitable illumination is defined by its position, sources type, geometry and color [14,19]. The term “light source” implies any object that emits energy in the visible spectrum (380–750 nm). Sunlight is one example of the light source, but is not suitable for colorimetric characterization because its quality and energy may vary during the day. To provide reliable colorimetric characterization CIE establishes illuminants upon binding standards (relative energy versus wavelength).
All illuminants are compared against the color temperature, which is described as the spectral energy distribution of the ideal blackbody radiator that radiates light with a specific color at defined temperatures in kelvin (K). Color temperature for an incandescent lamp (~100 W) is 2800 K, for halogen lamp 3000–3200 K, for the fluorescent lamp (cold white) 4000 K, for Xenon and metal halide lamp 4500–5000 K, for warm white LED lamp is 2700–3000 K, and cold white LED lamp 5000–5500 K [20,24].
According to the CIE, we distinguish several illuminants like:
- daylight illuminants lamps (illuminants that represent daylight conditions): C lamp, D50 lamp and D65 lamp
- incandescent/tungsten lamps: A lamp
- fluorescent lamps: F2 lamp (cool white fluorescent), F7 lamp, and F11 lamp
- special light sources.
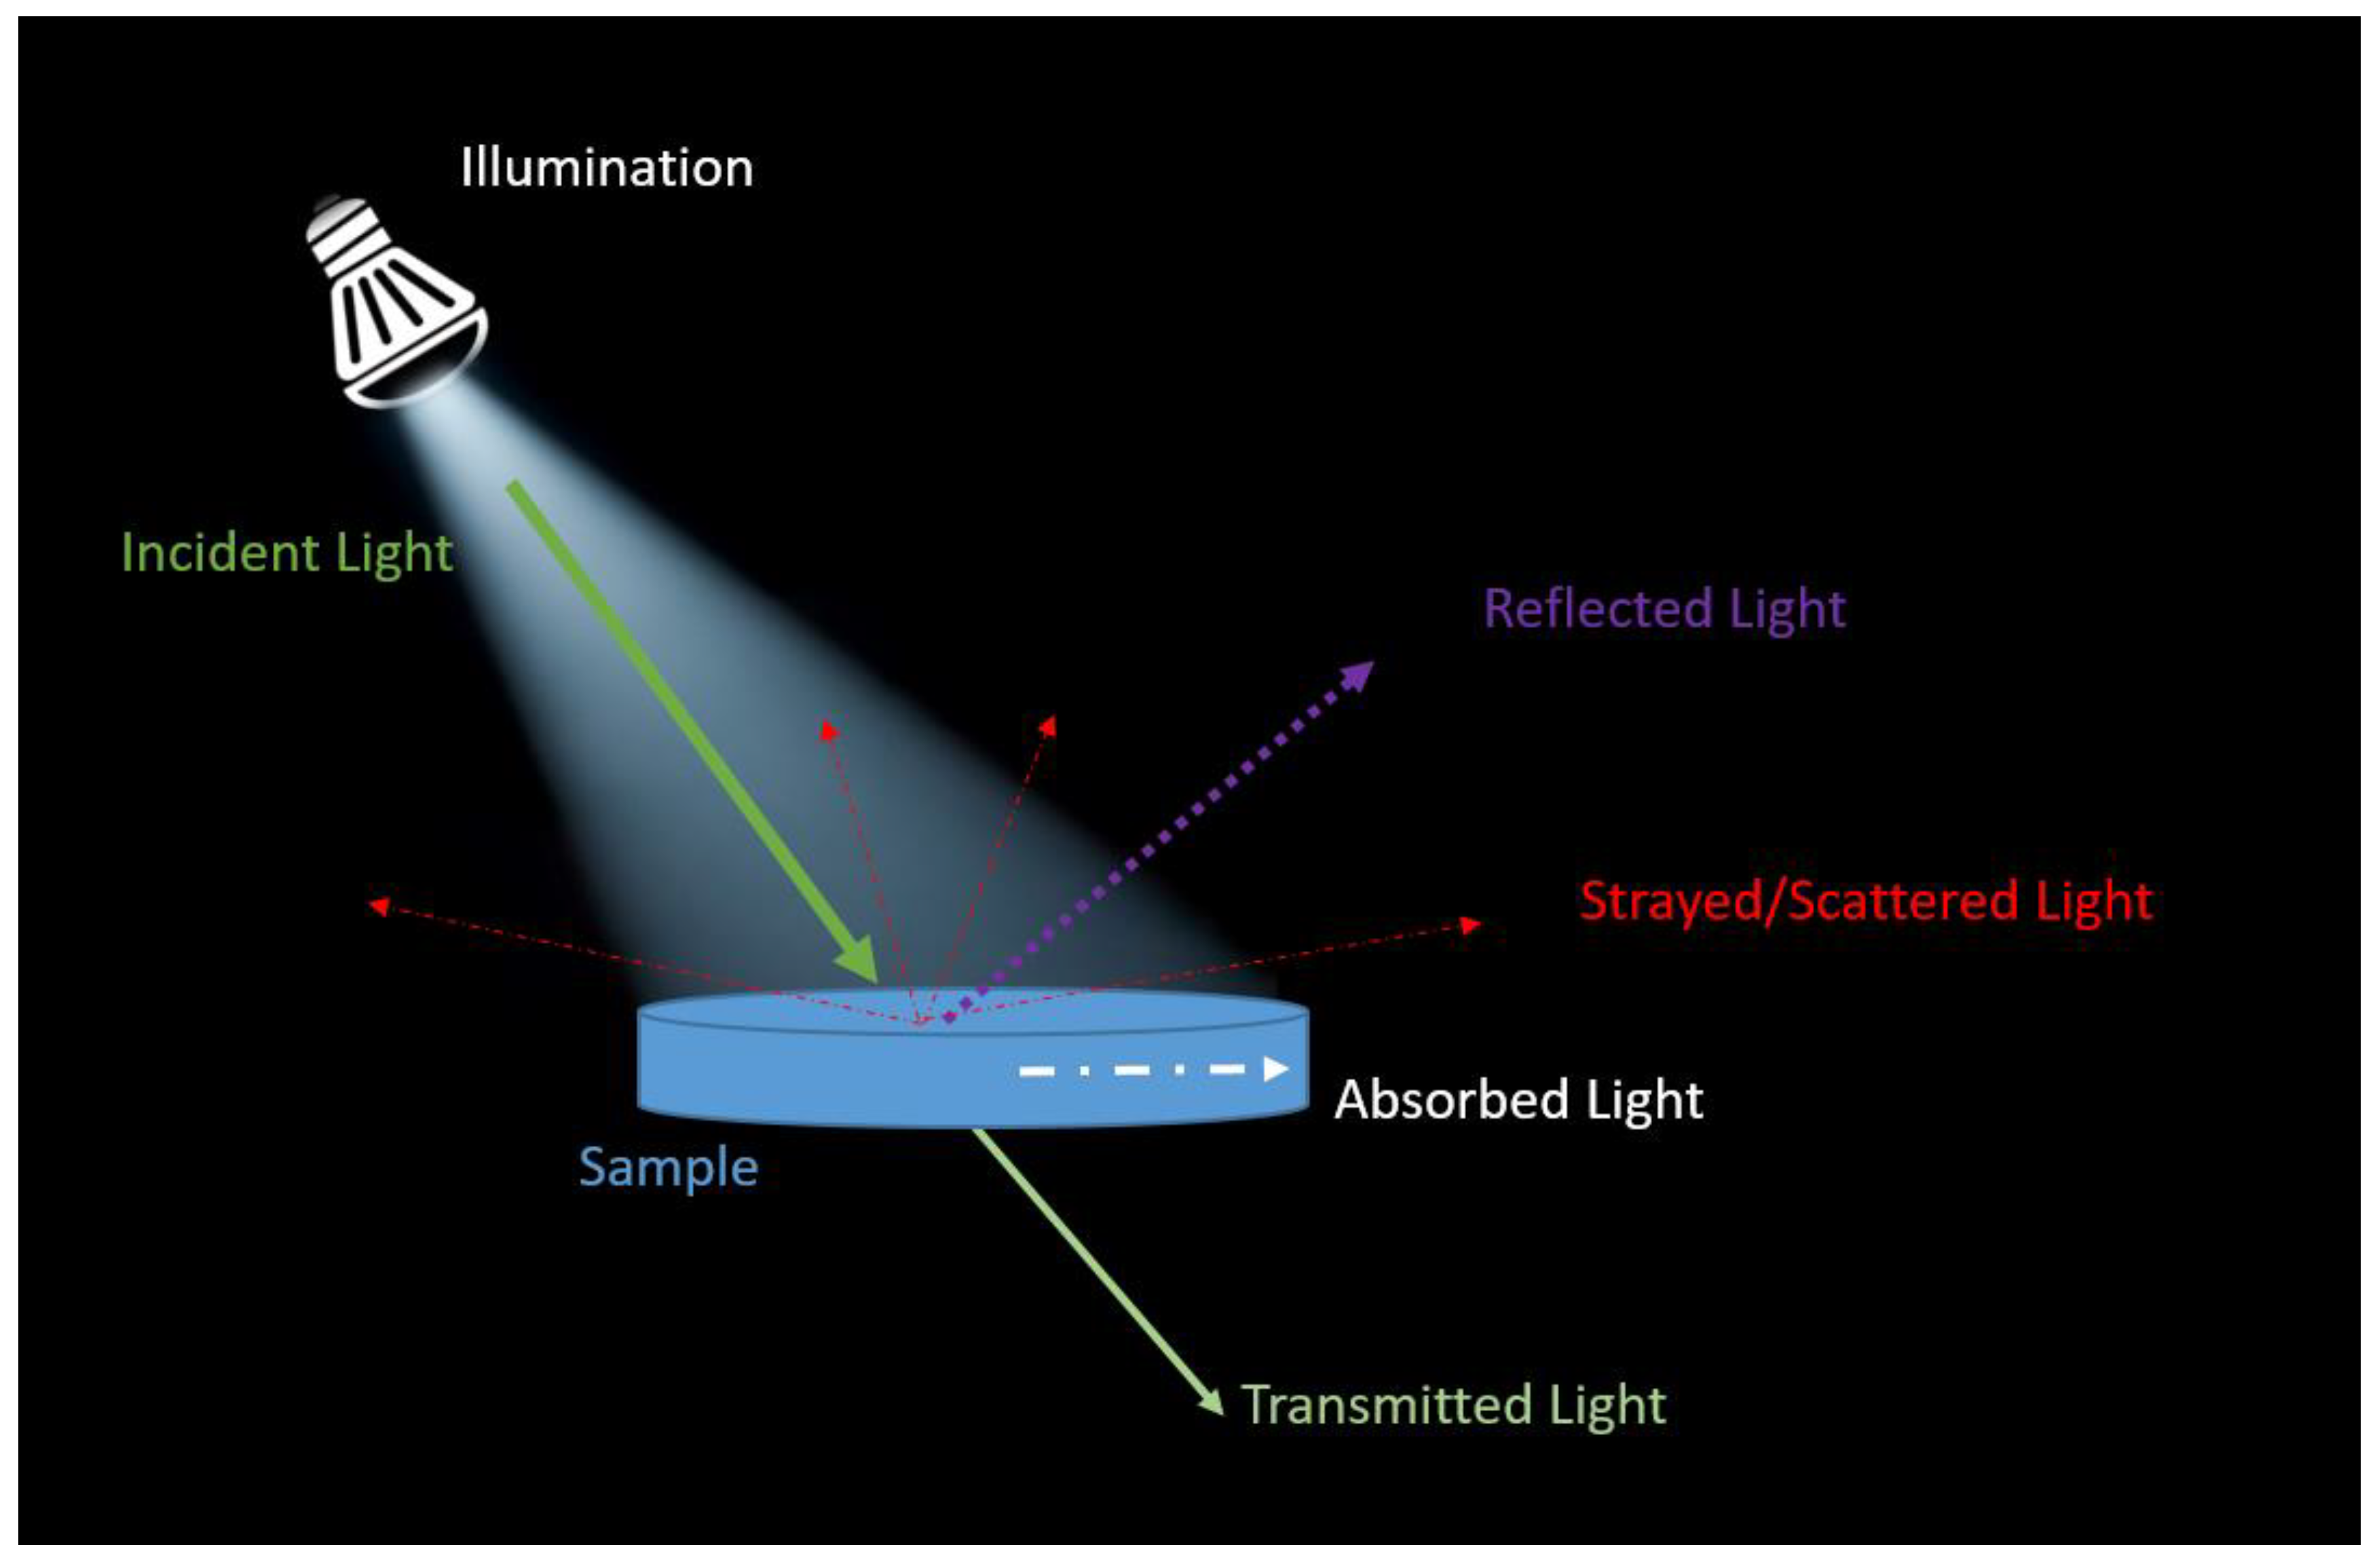
Several parameters should be considered when deciding on a selection of illuminant source: characteristic of the object surface (whether the object is absorptive, transmissive or reflective), the object geometry (curved of flat), and object/background contrast (translucent objects are usually illuminated with backlight). When an object is illuminated, the incident light is partly (Figure 2):
- reflected and/or
- transmitted and/or
- absorbed and/or
- strayed.
Type of the effect that will occur, depends on the object surface (opaque, semi-transparent or translucent, glossy or matt). Because of that, the position of a light source is very important. When the object surface is glossy, the light is reflected from the object surface at an angle of incidence. If surface is opaque, semi-transparent or translucent, the light is transmitted (penetrates through the object) or it can be polarized or diffracted at the object surface. Usually one of these effects never appears alone, but it is always a combination of several effects.
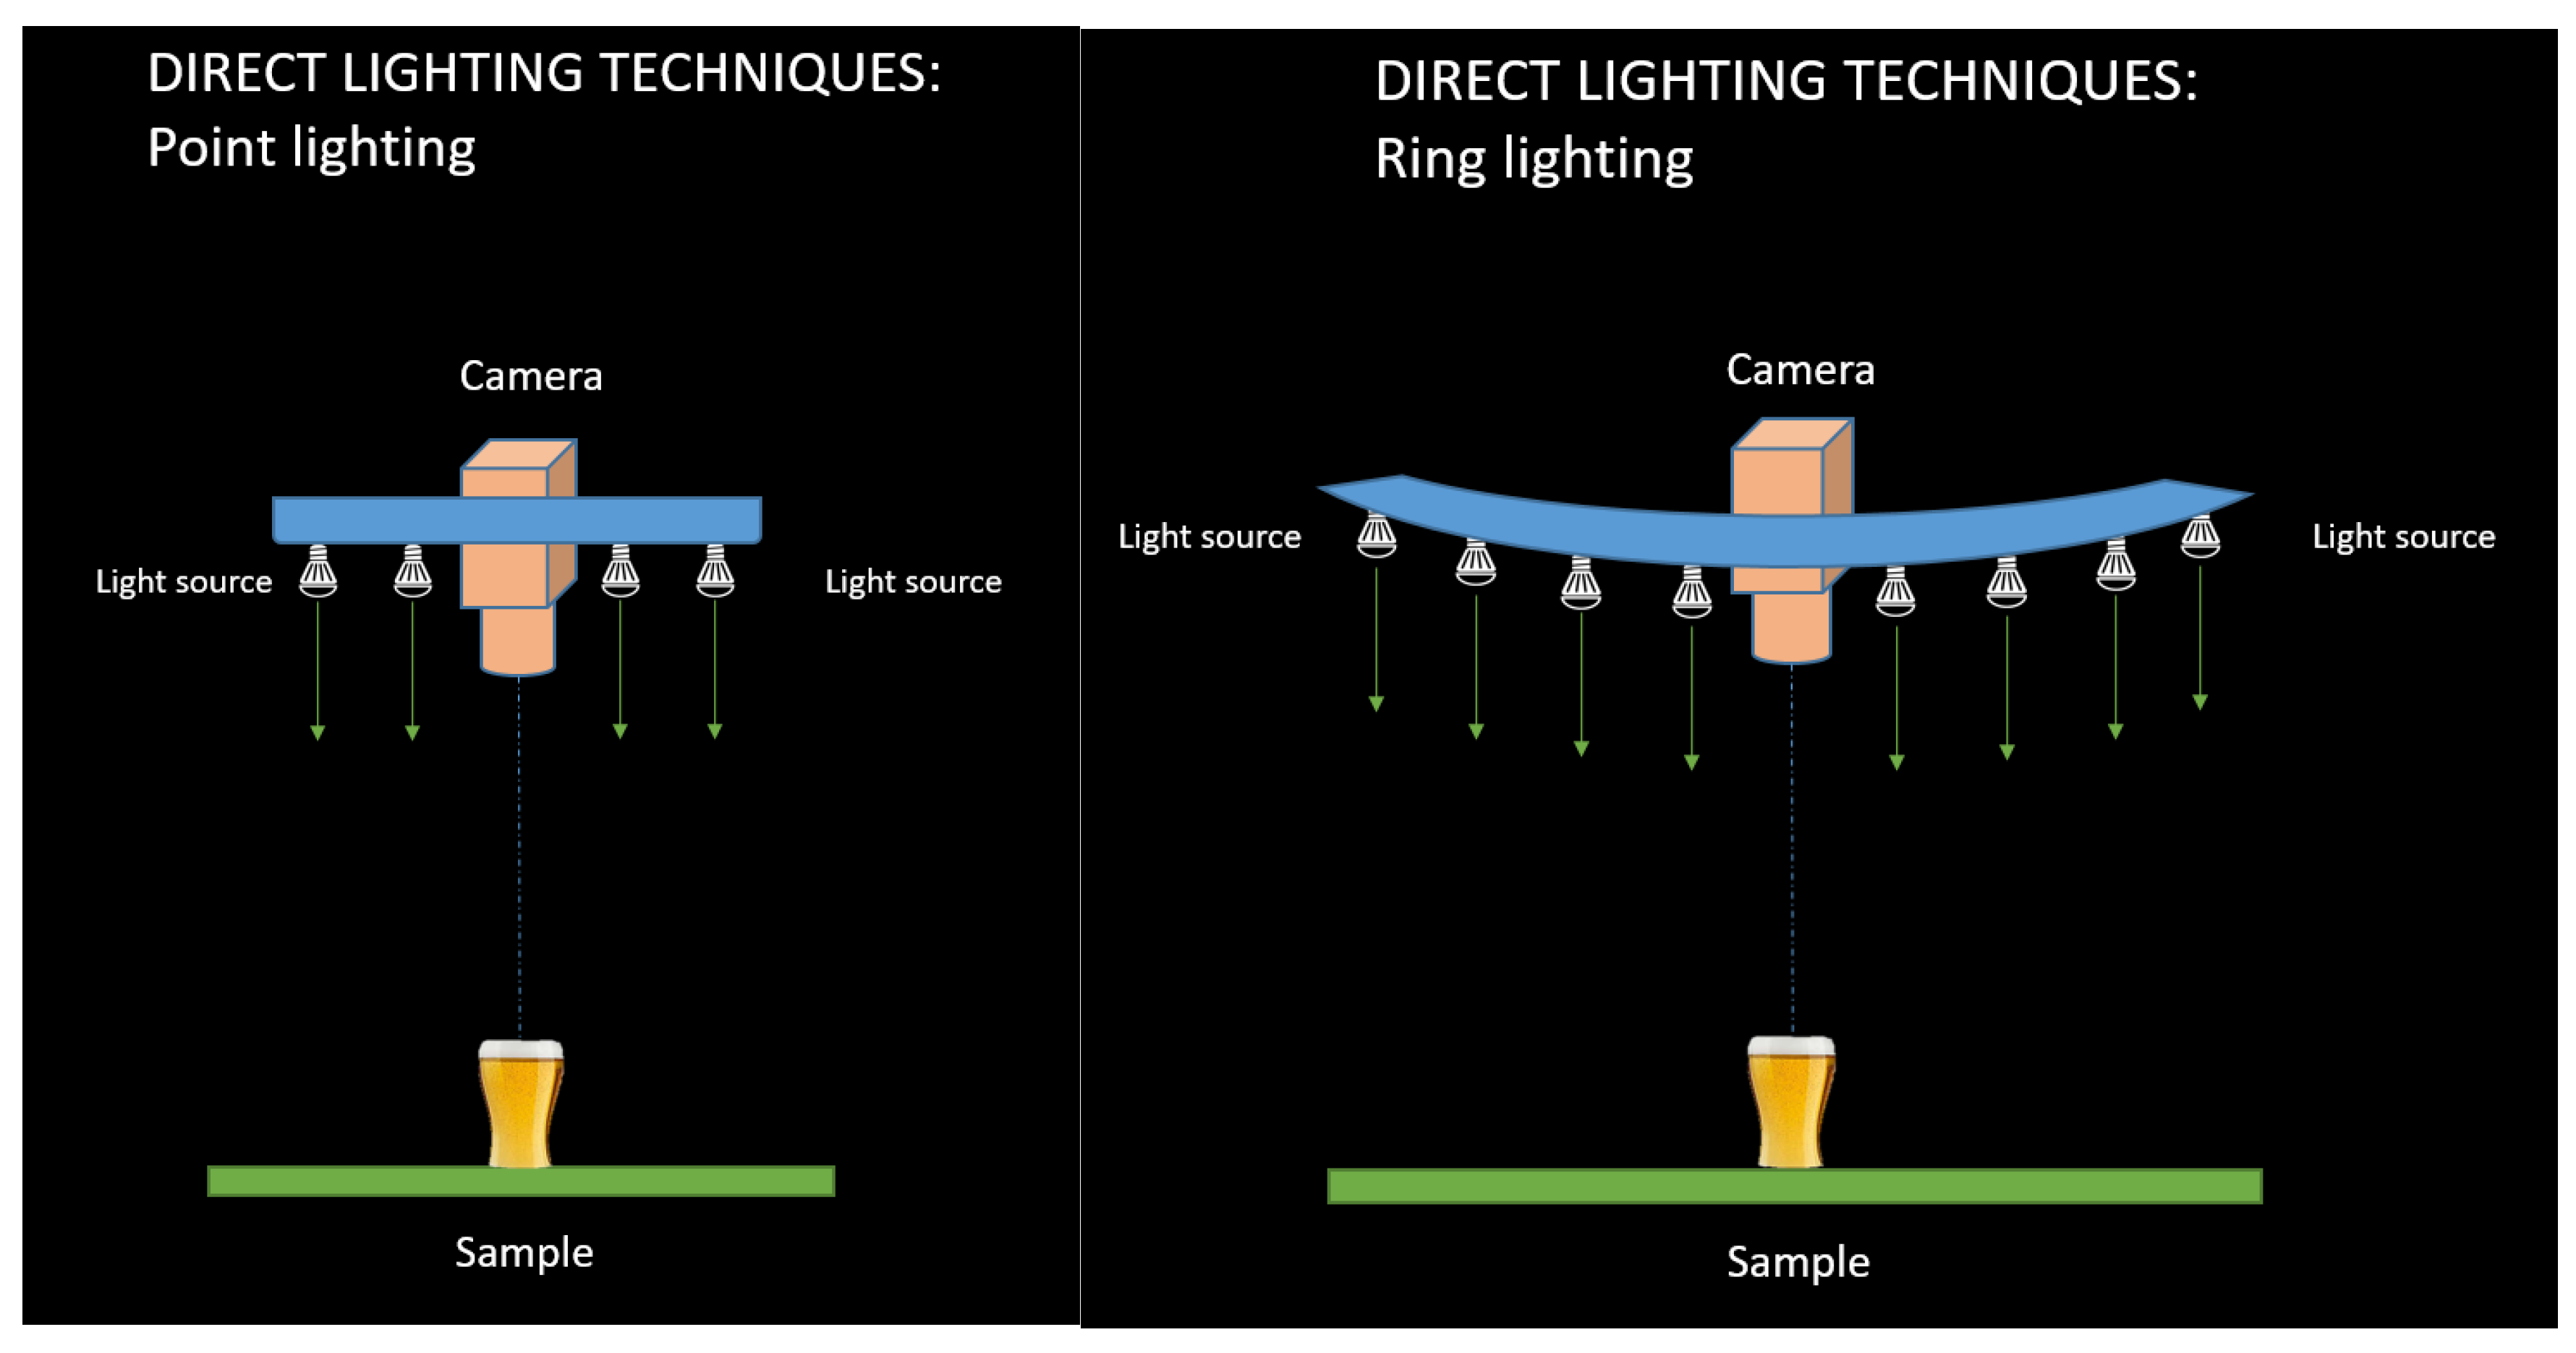
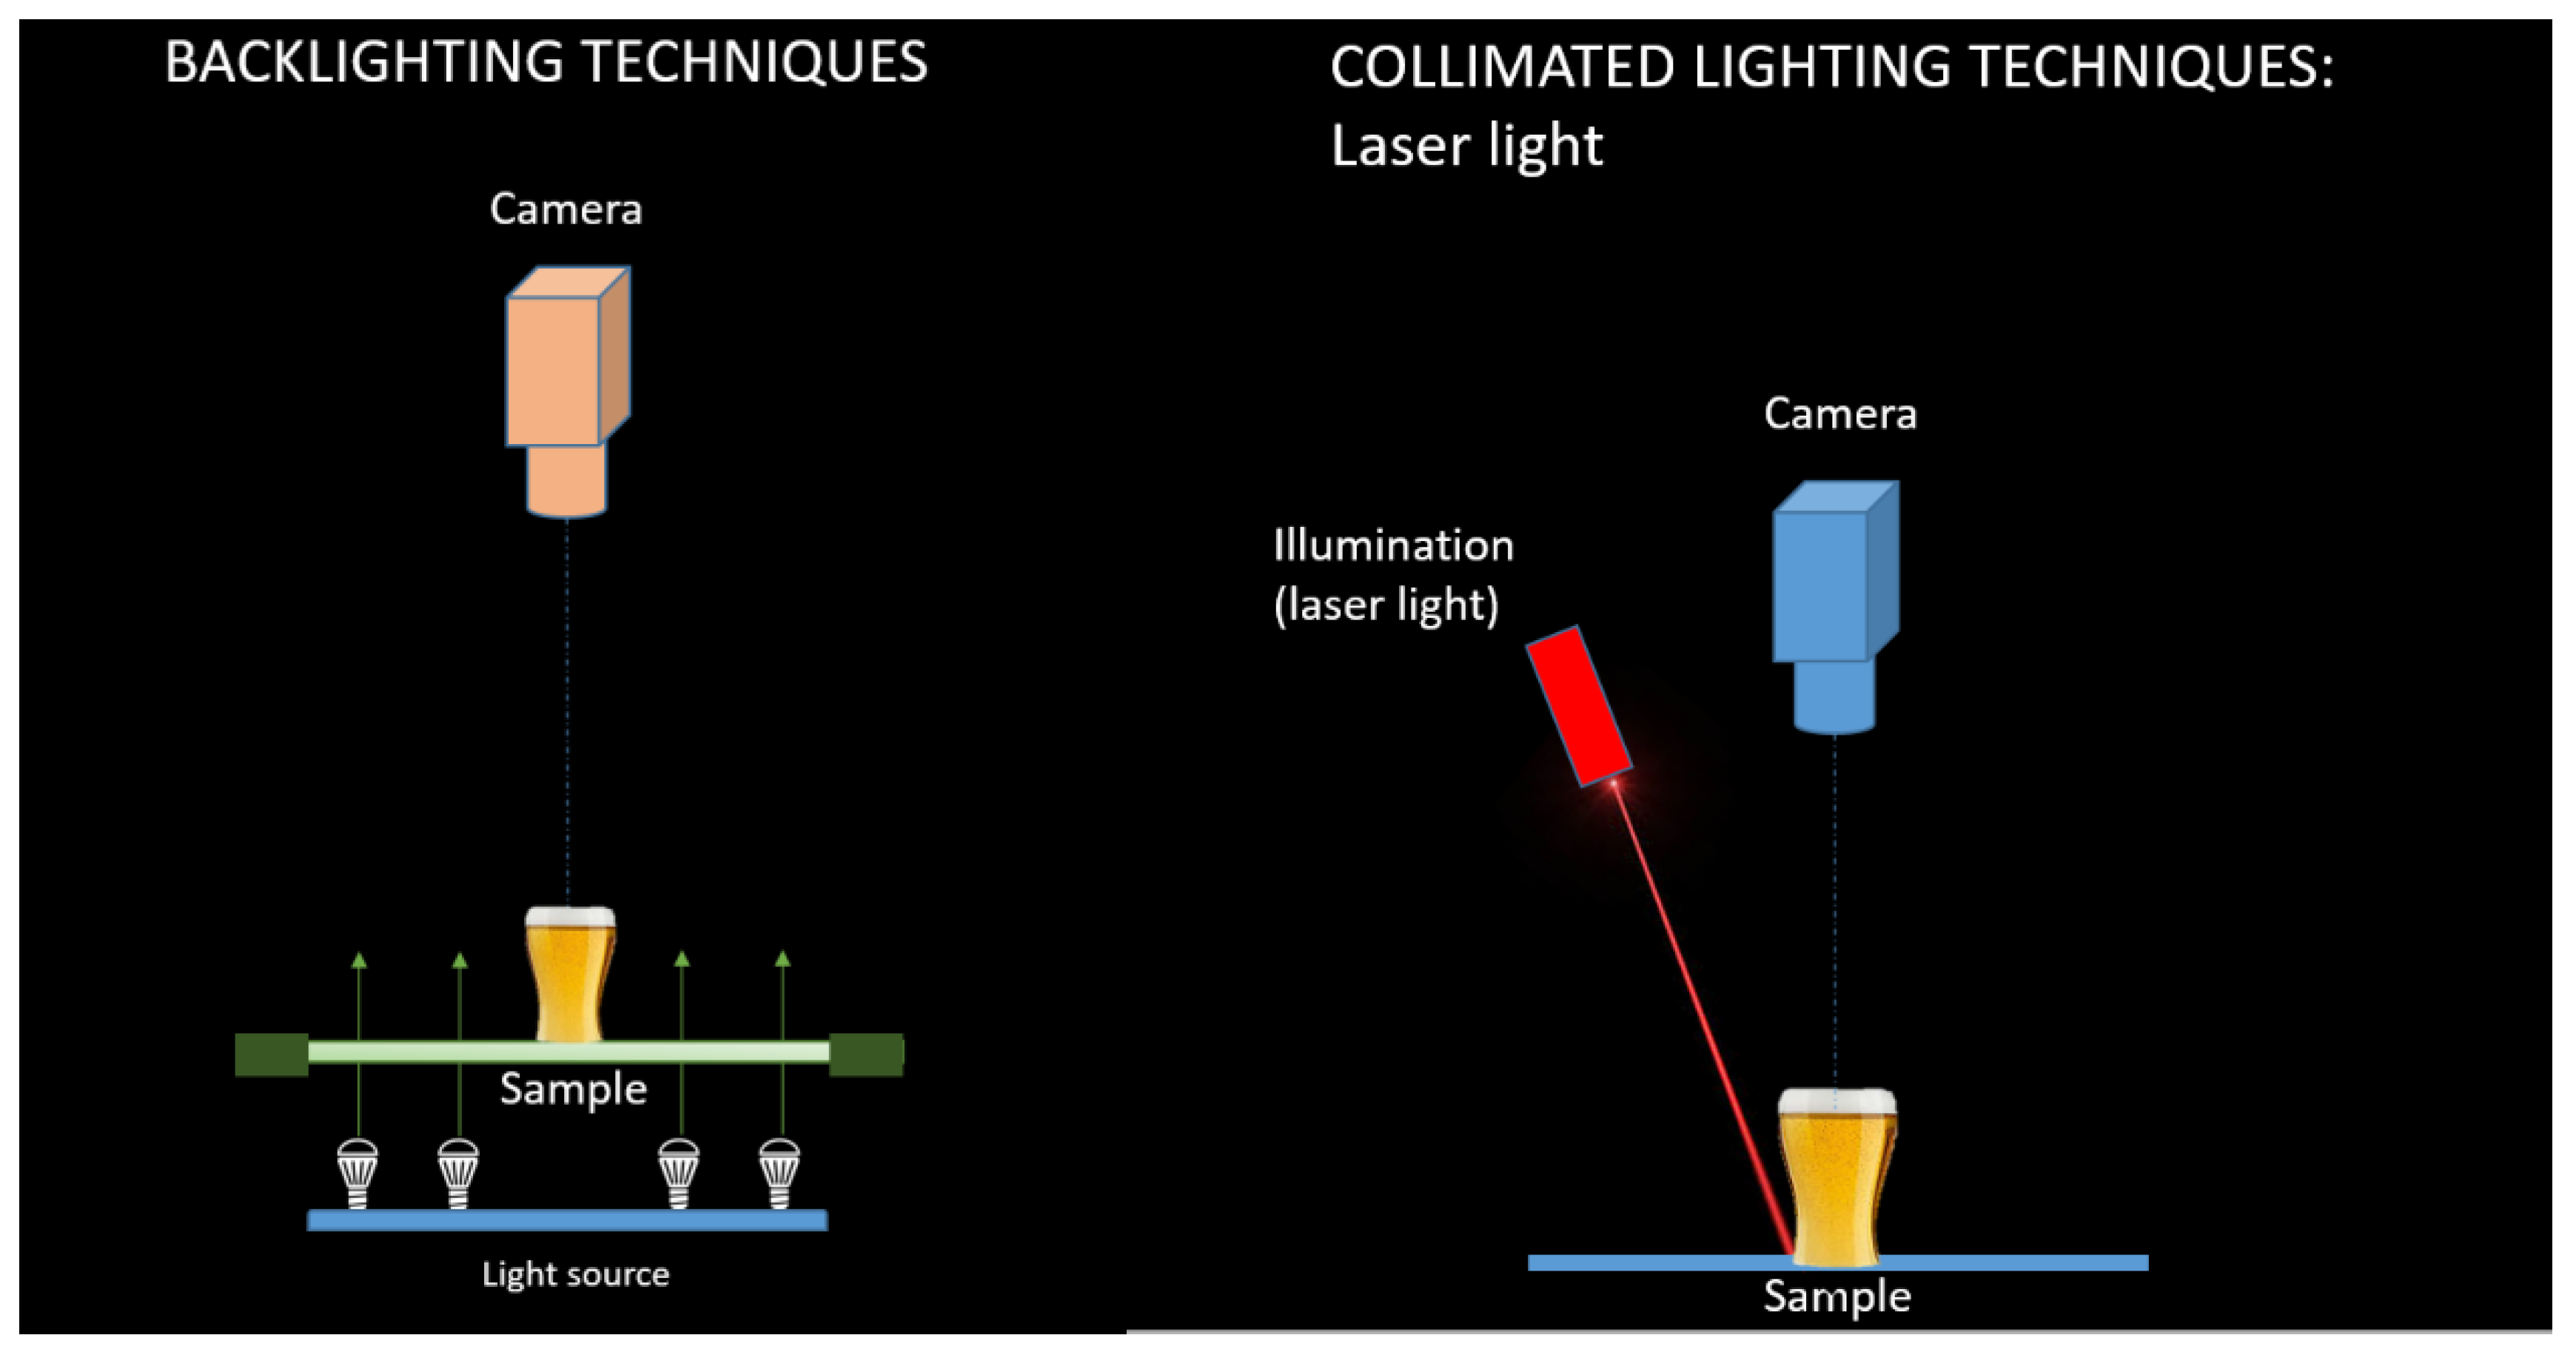
Due to a different object geometry, there are the three common lighting geometries: the point lighting for flat objects, the diffuse lighting for challenging reflective 3-D objects, and collimated lighting (laser light) [10,22].
Regarding the angle of incidence of the illumination (angle between light source, object and camera), there are several illumination techniques [14]:
- direct incident light (front light)
- ○
- vertical illumination from above,
- ○
- ring illumination,
- ○
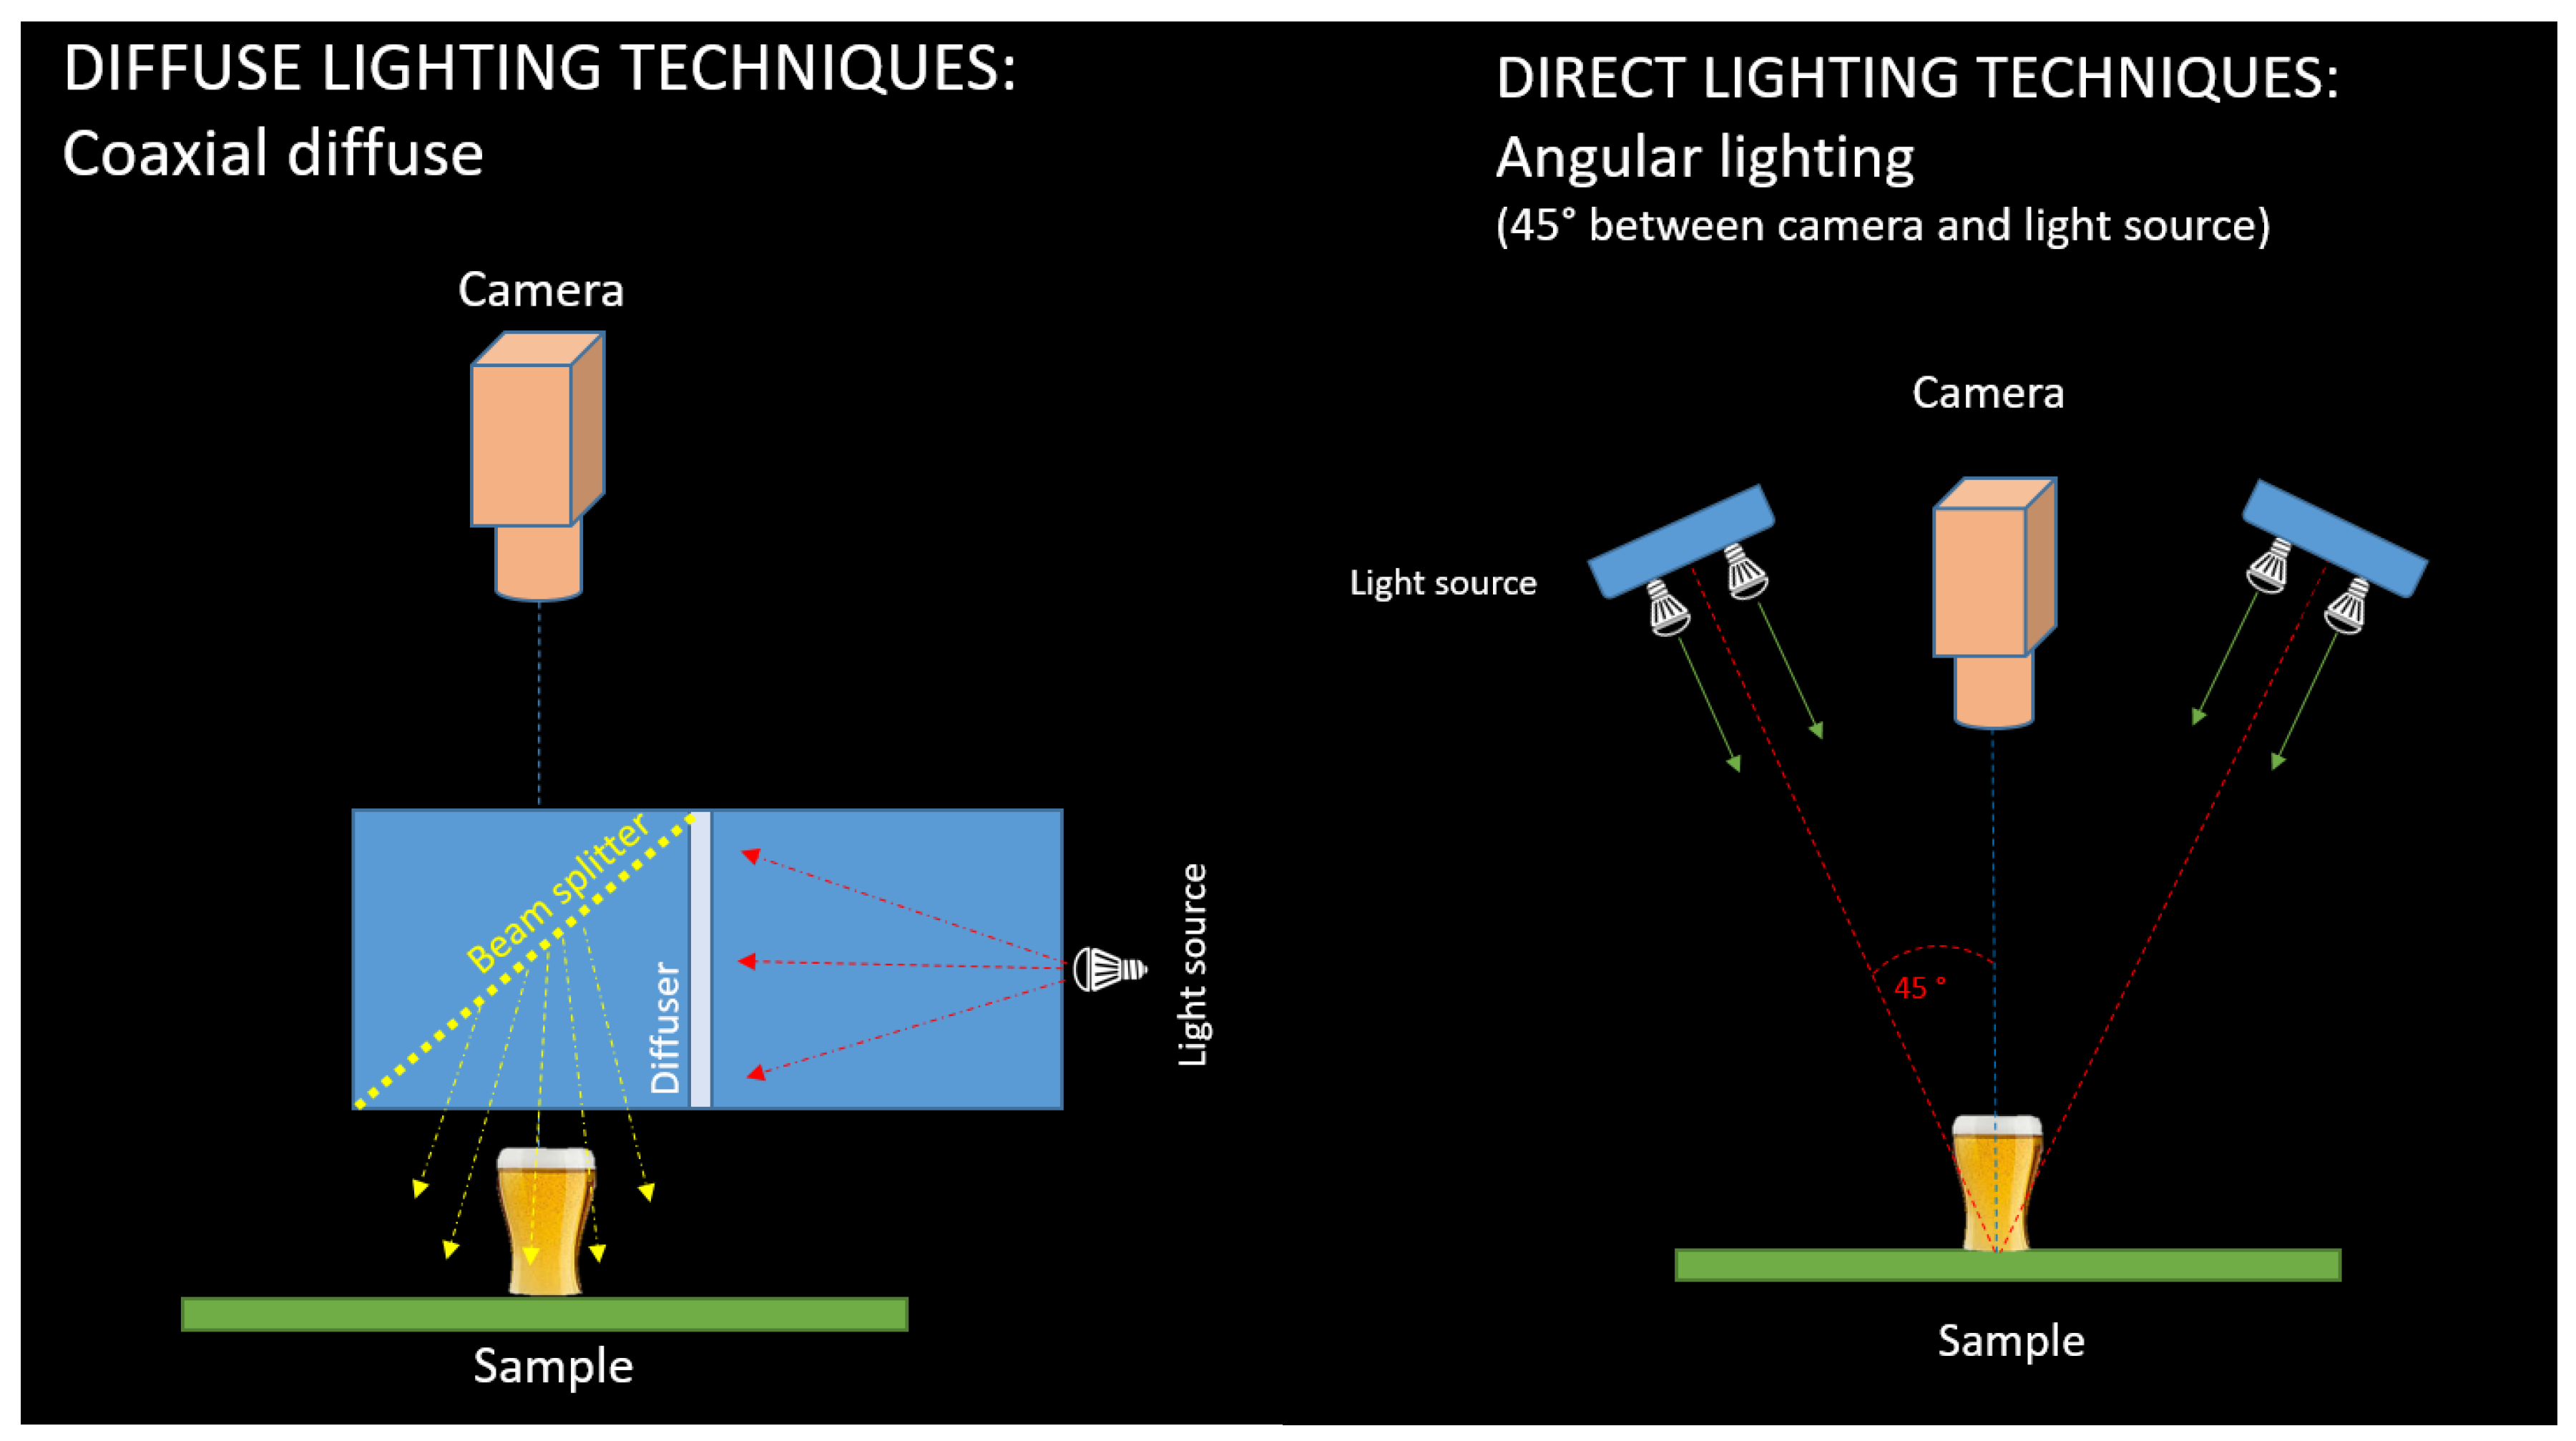
- angular illumination;
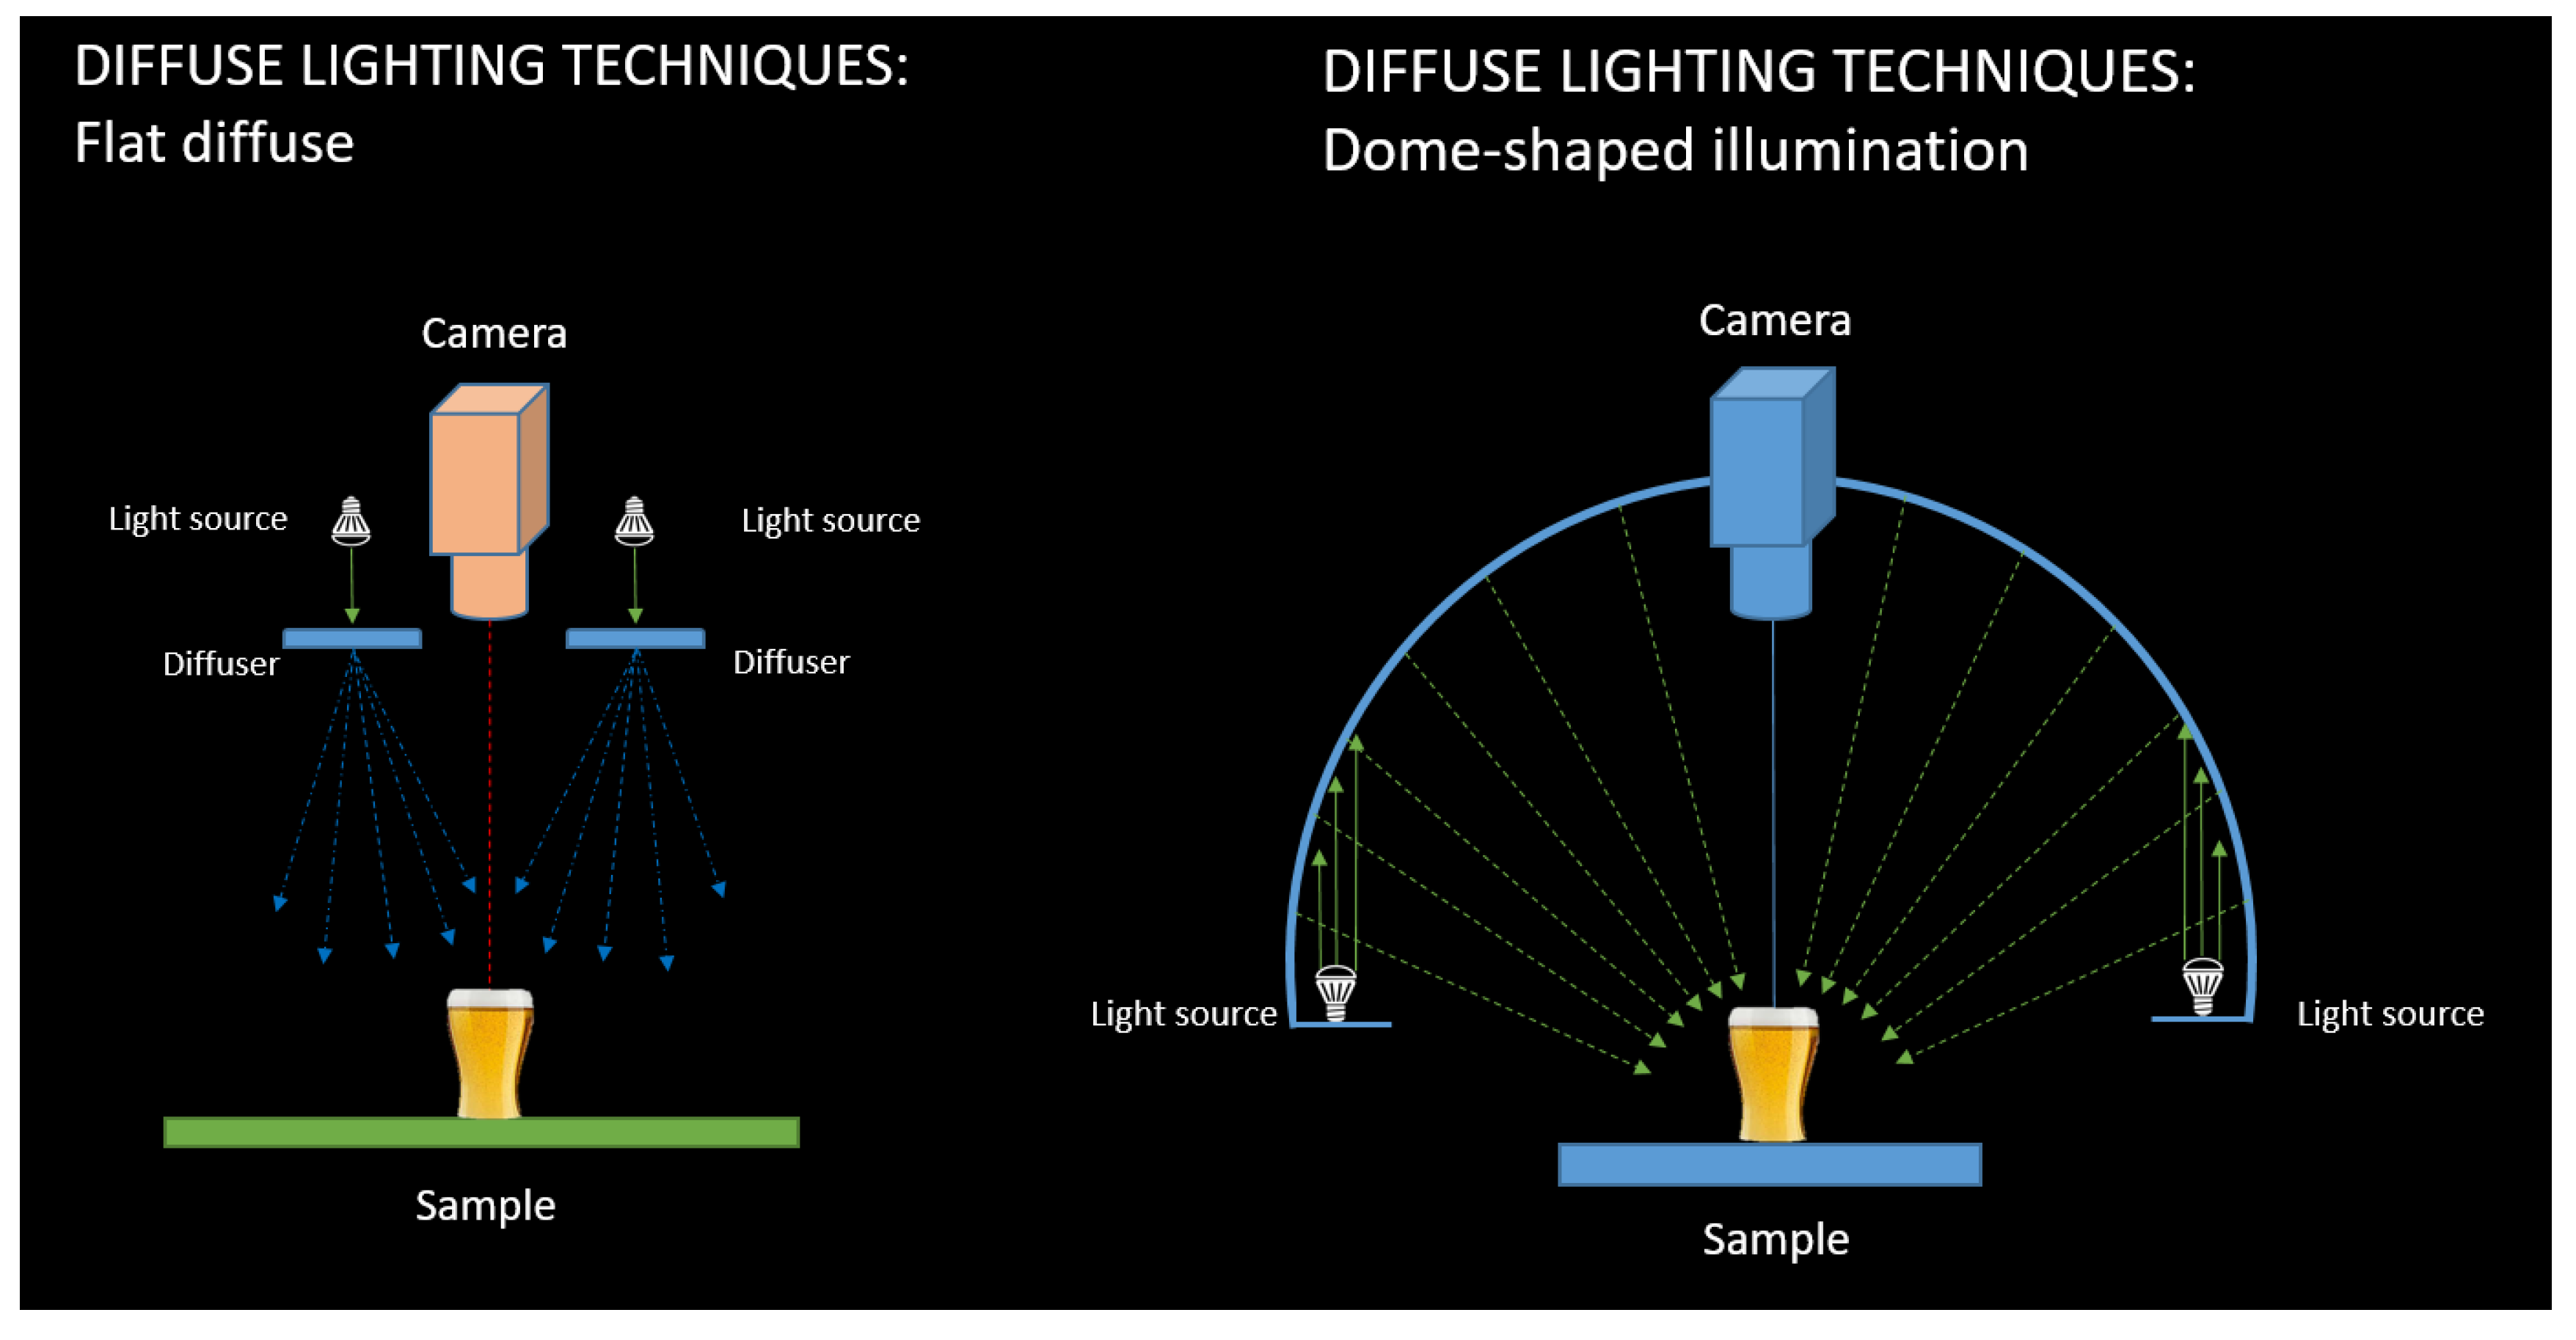
- incident lighting with a diffuser
- ○
- flat,
- ○
- coaxial,
- ○
- dome-shaped;
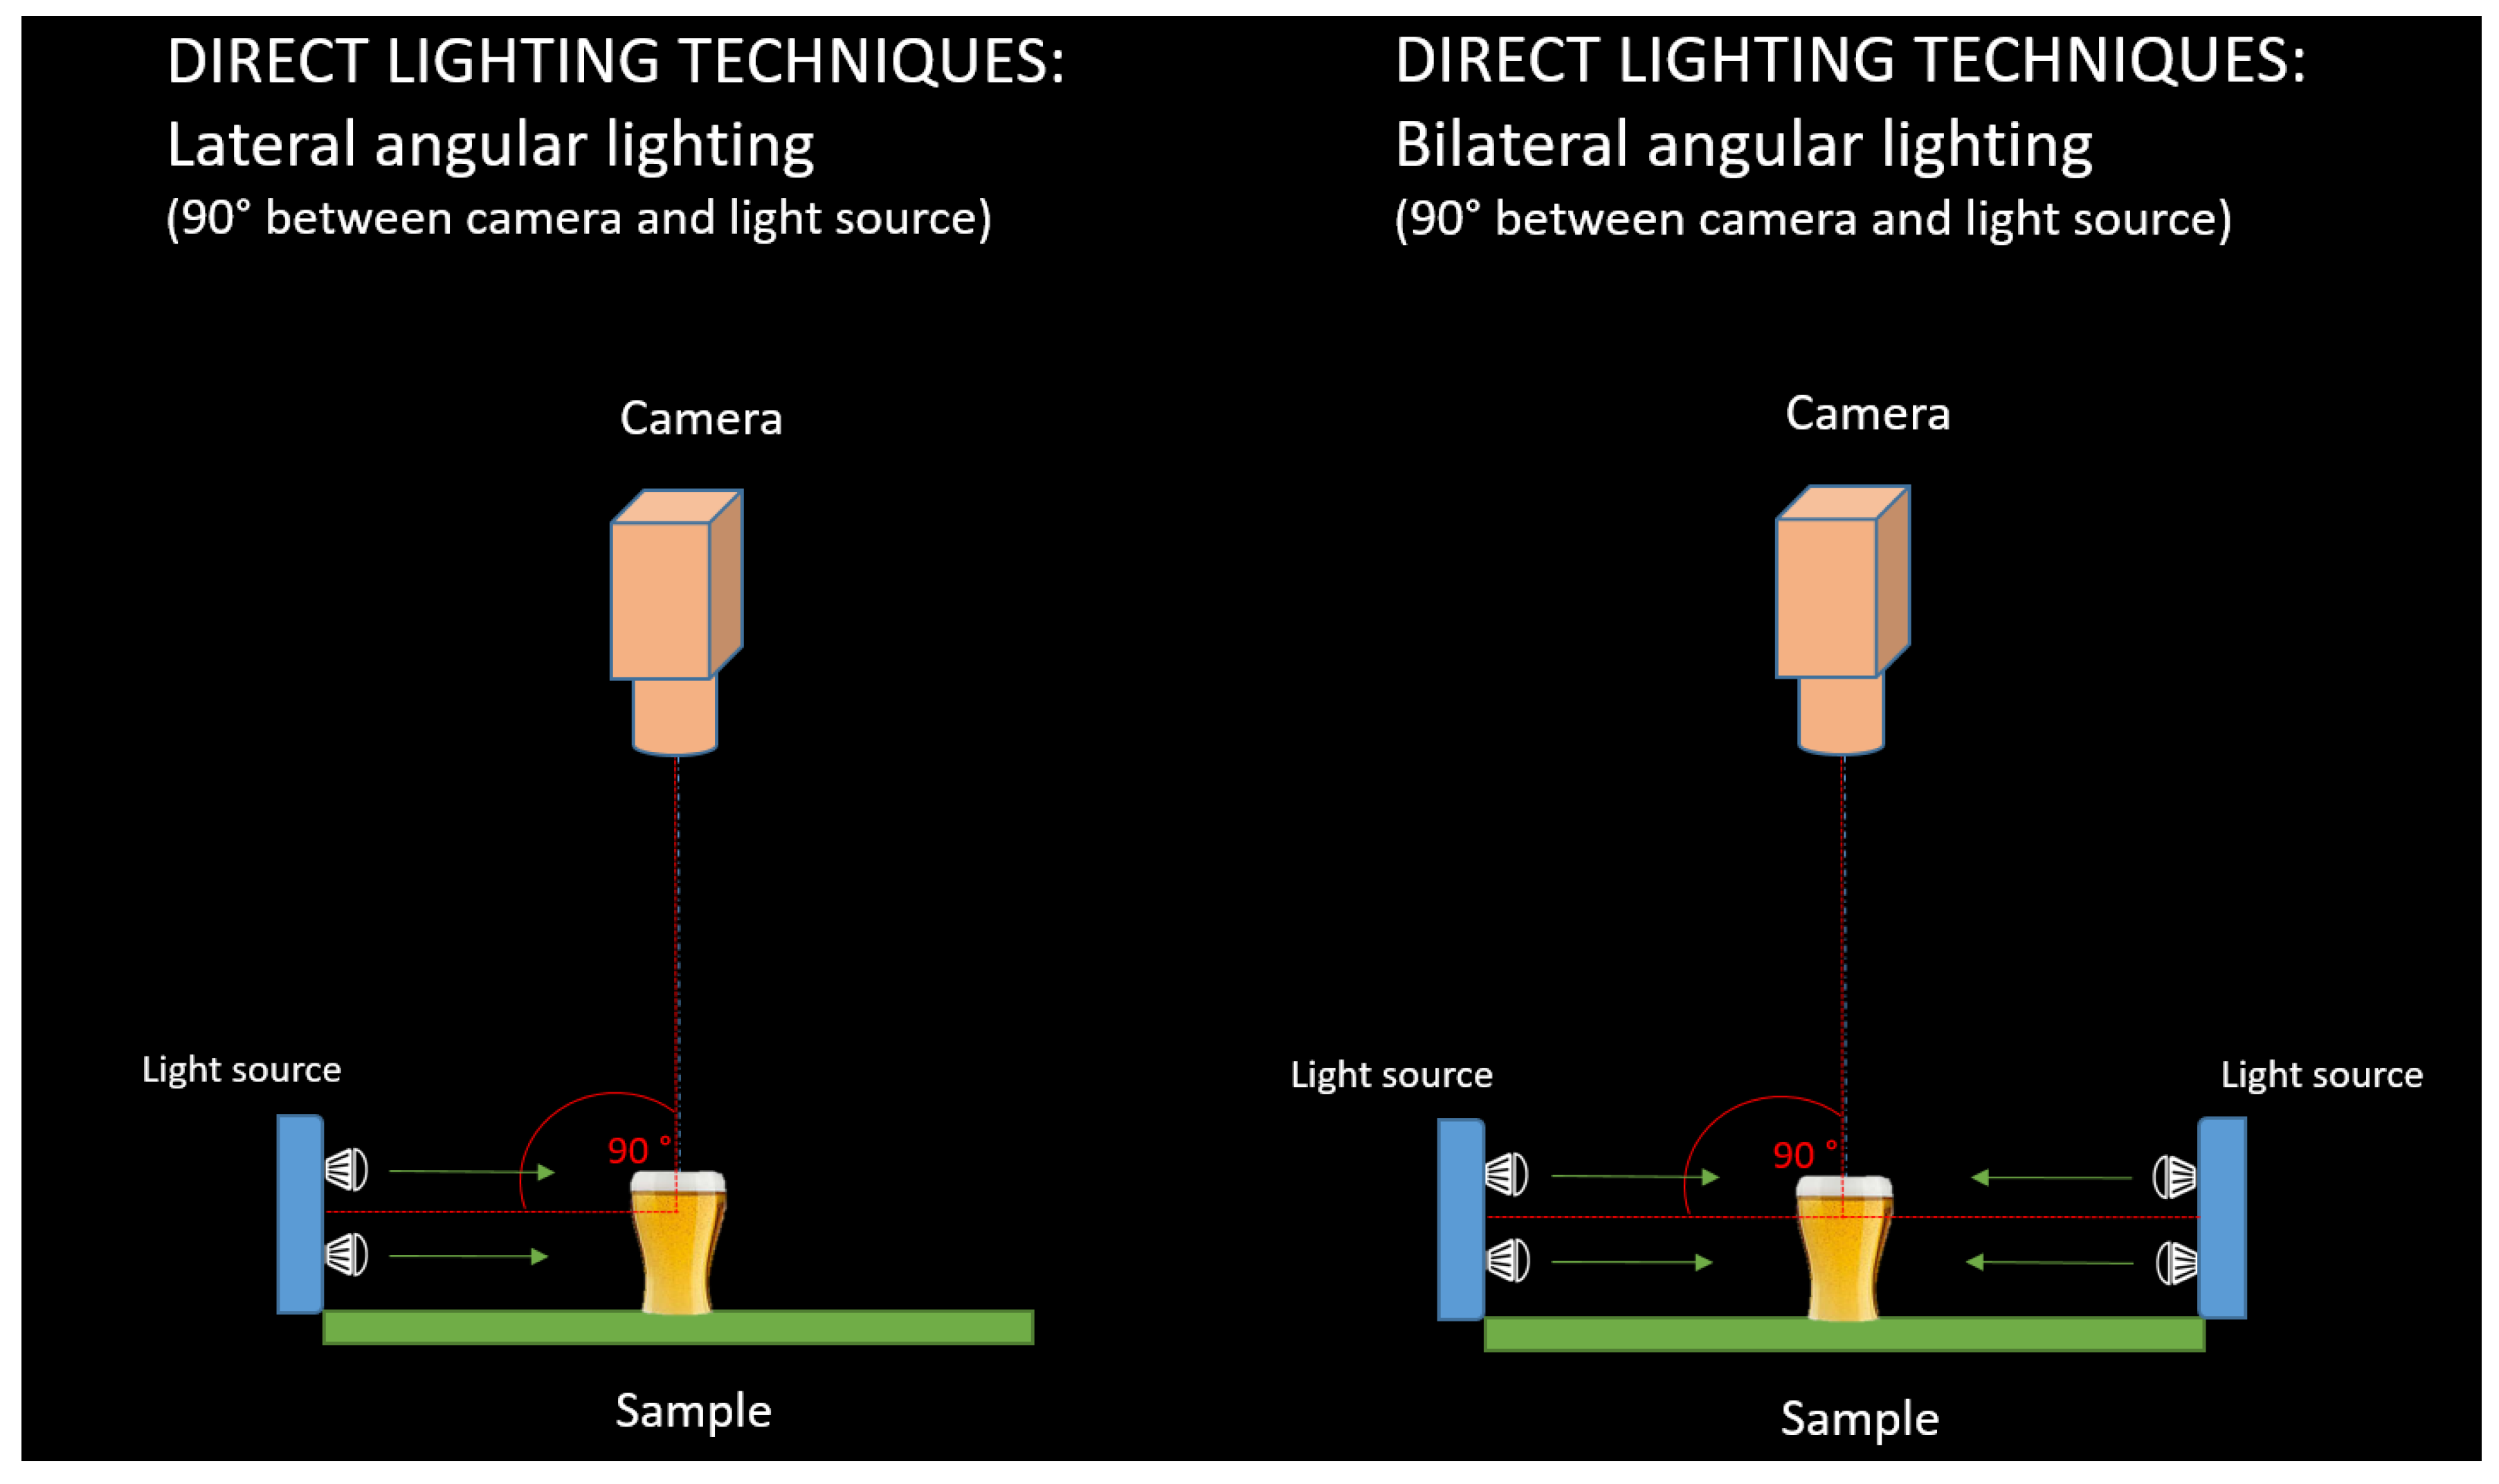
- lateral light at angles—at angles from one side or all around;
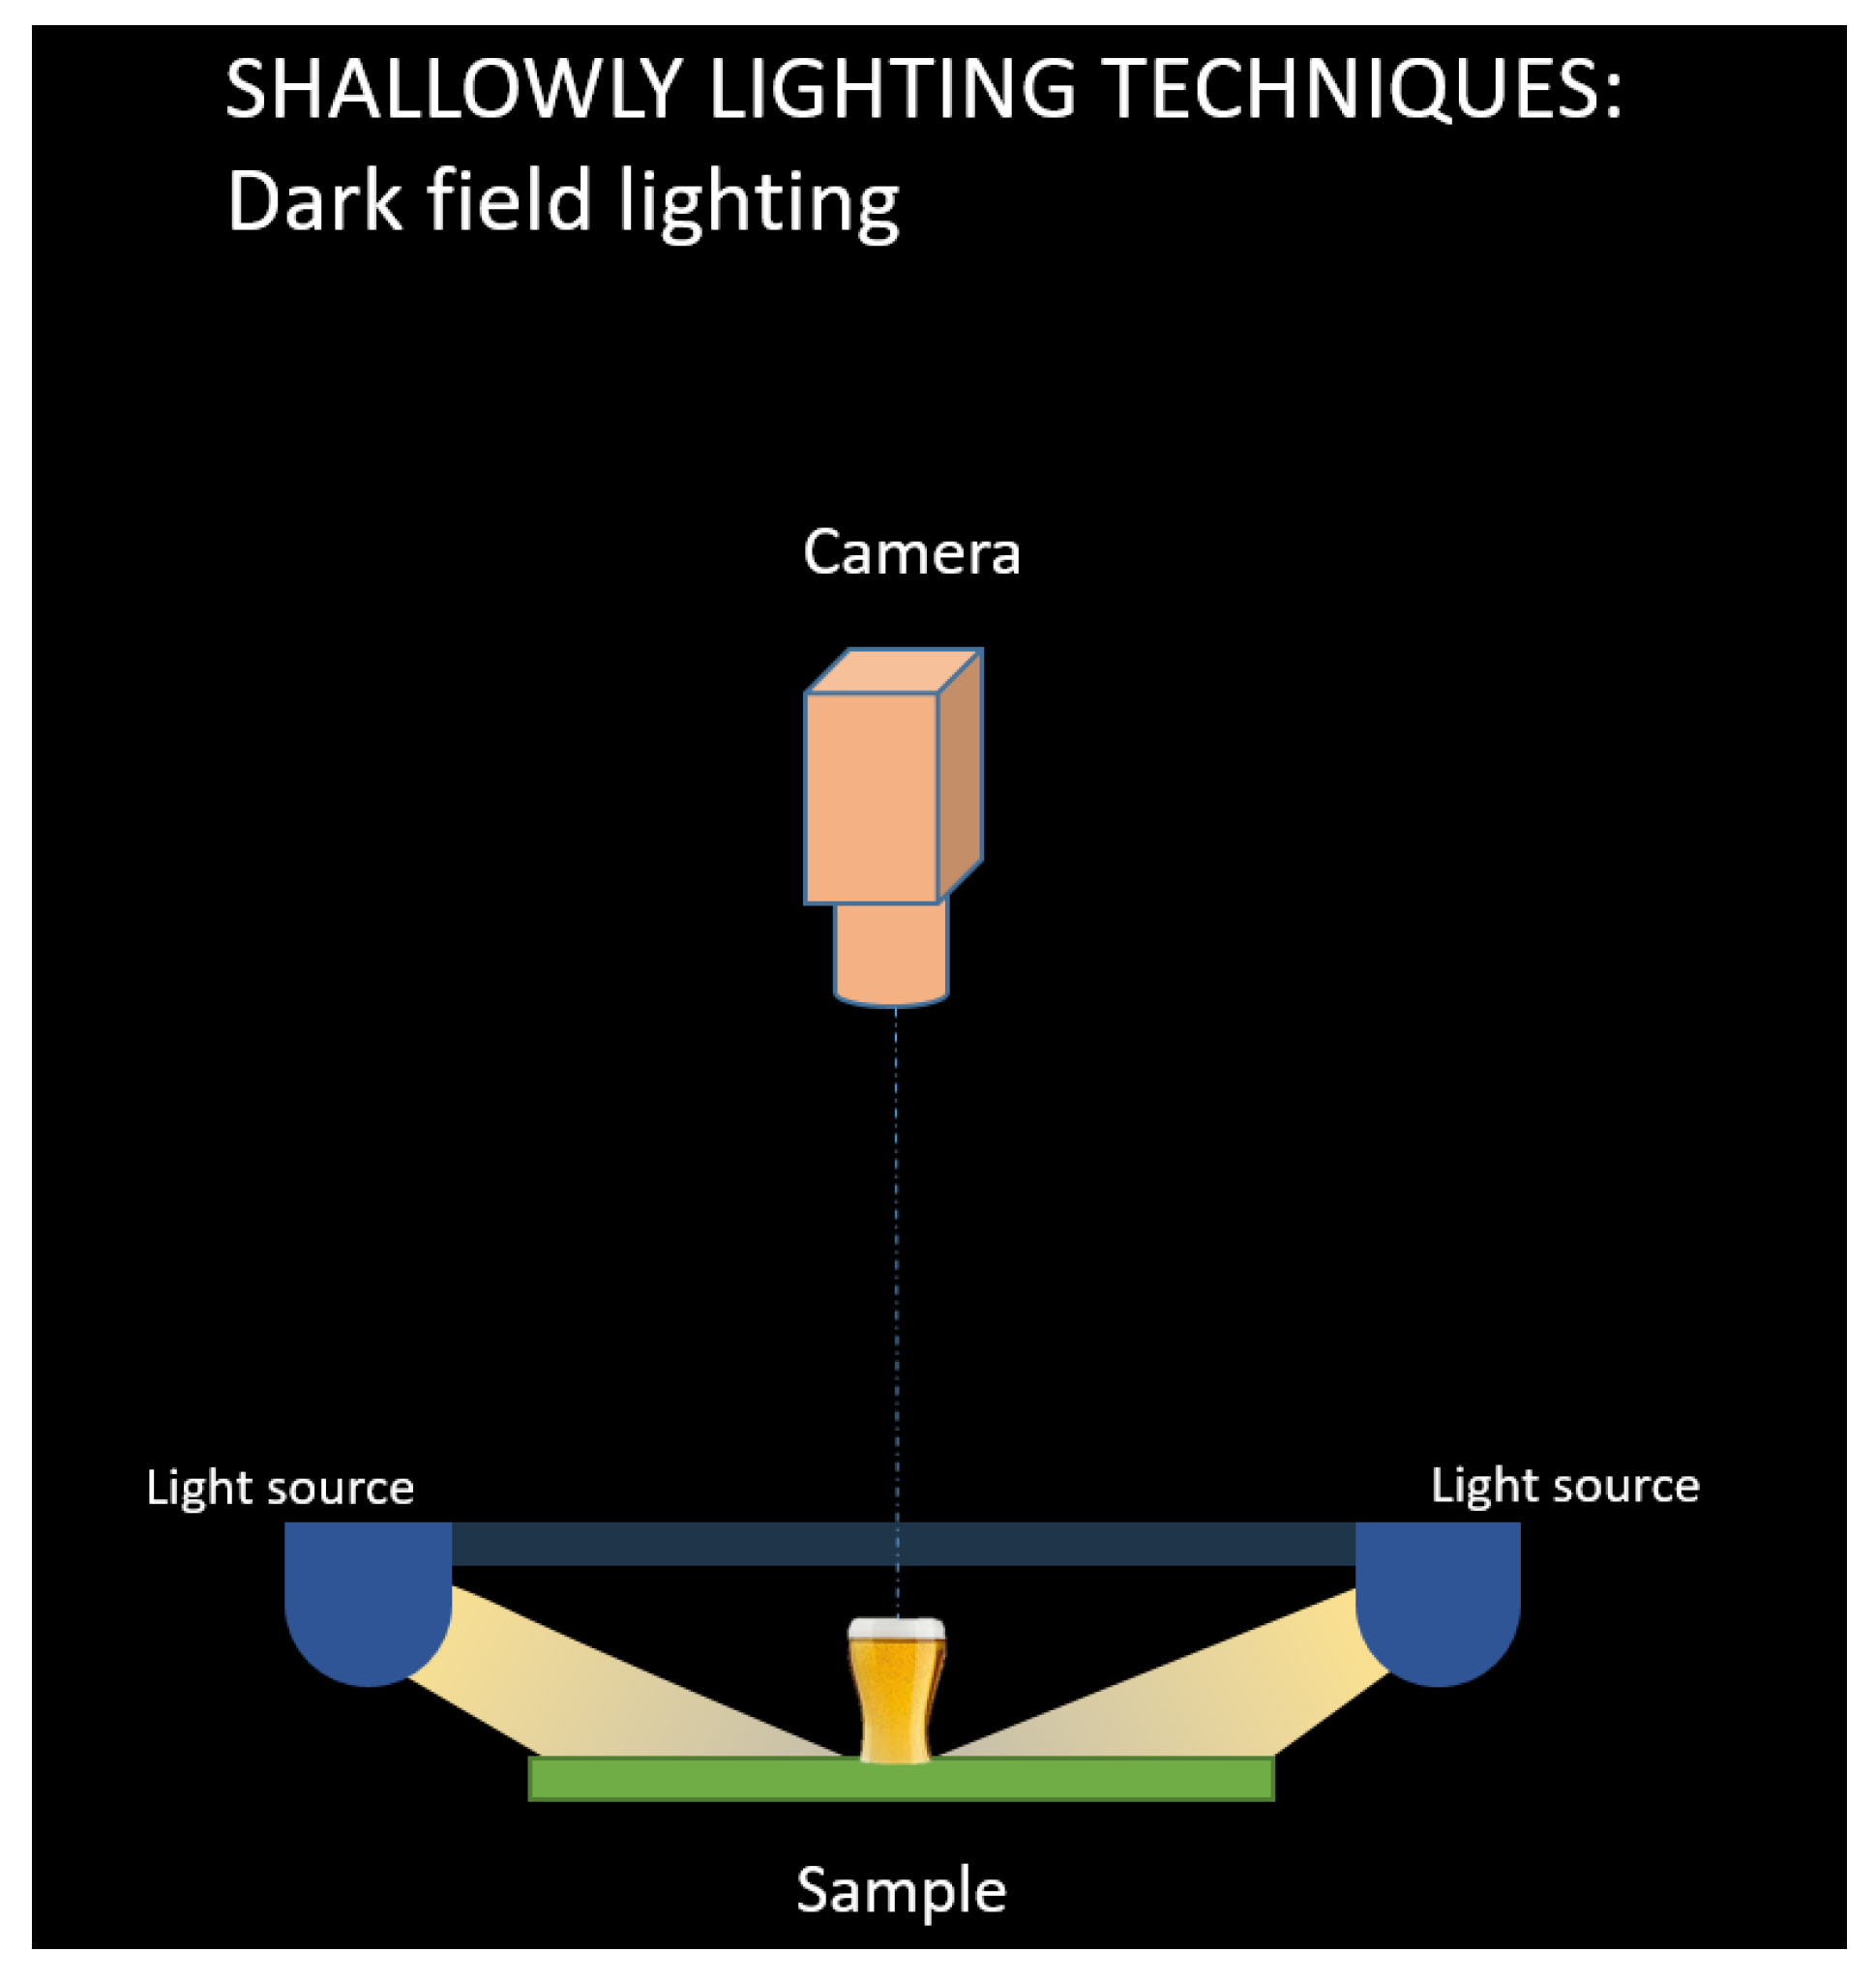
- shallowly—illumination at a shallow angle from all sides: dark field illumination (usually uses a low angle ring light that is mounted very close to the object where the light rays from the light source are not reflected into the camera lens, but only a proportion of light that is scattered by an uneven surface);
- backlighting—transmitted light from the opposite side of the object (backlit image);
2.2. Image Acquisition Devices
Image acquisition encompasses images capturing, with digital camera or scanner. There are three basic elements in image capturing: energy, the lens (optical system) and the sensor. Electronic capturing of the image with camera and frame grabber is the first step in the processing of the digital image. Photons are converted to electrical signals with a camera, and these signals are digitalized with the frame grabber [18]. The frame grabber is required for the transformation of analog to digital signal when analog cameras are used [25]. Usually, only three channels are used by camera (i.e., R, G, B), but when higher accuracy and extended information is required, more channels can be used.
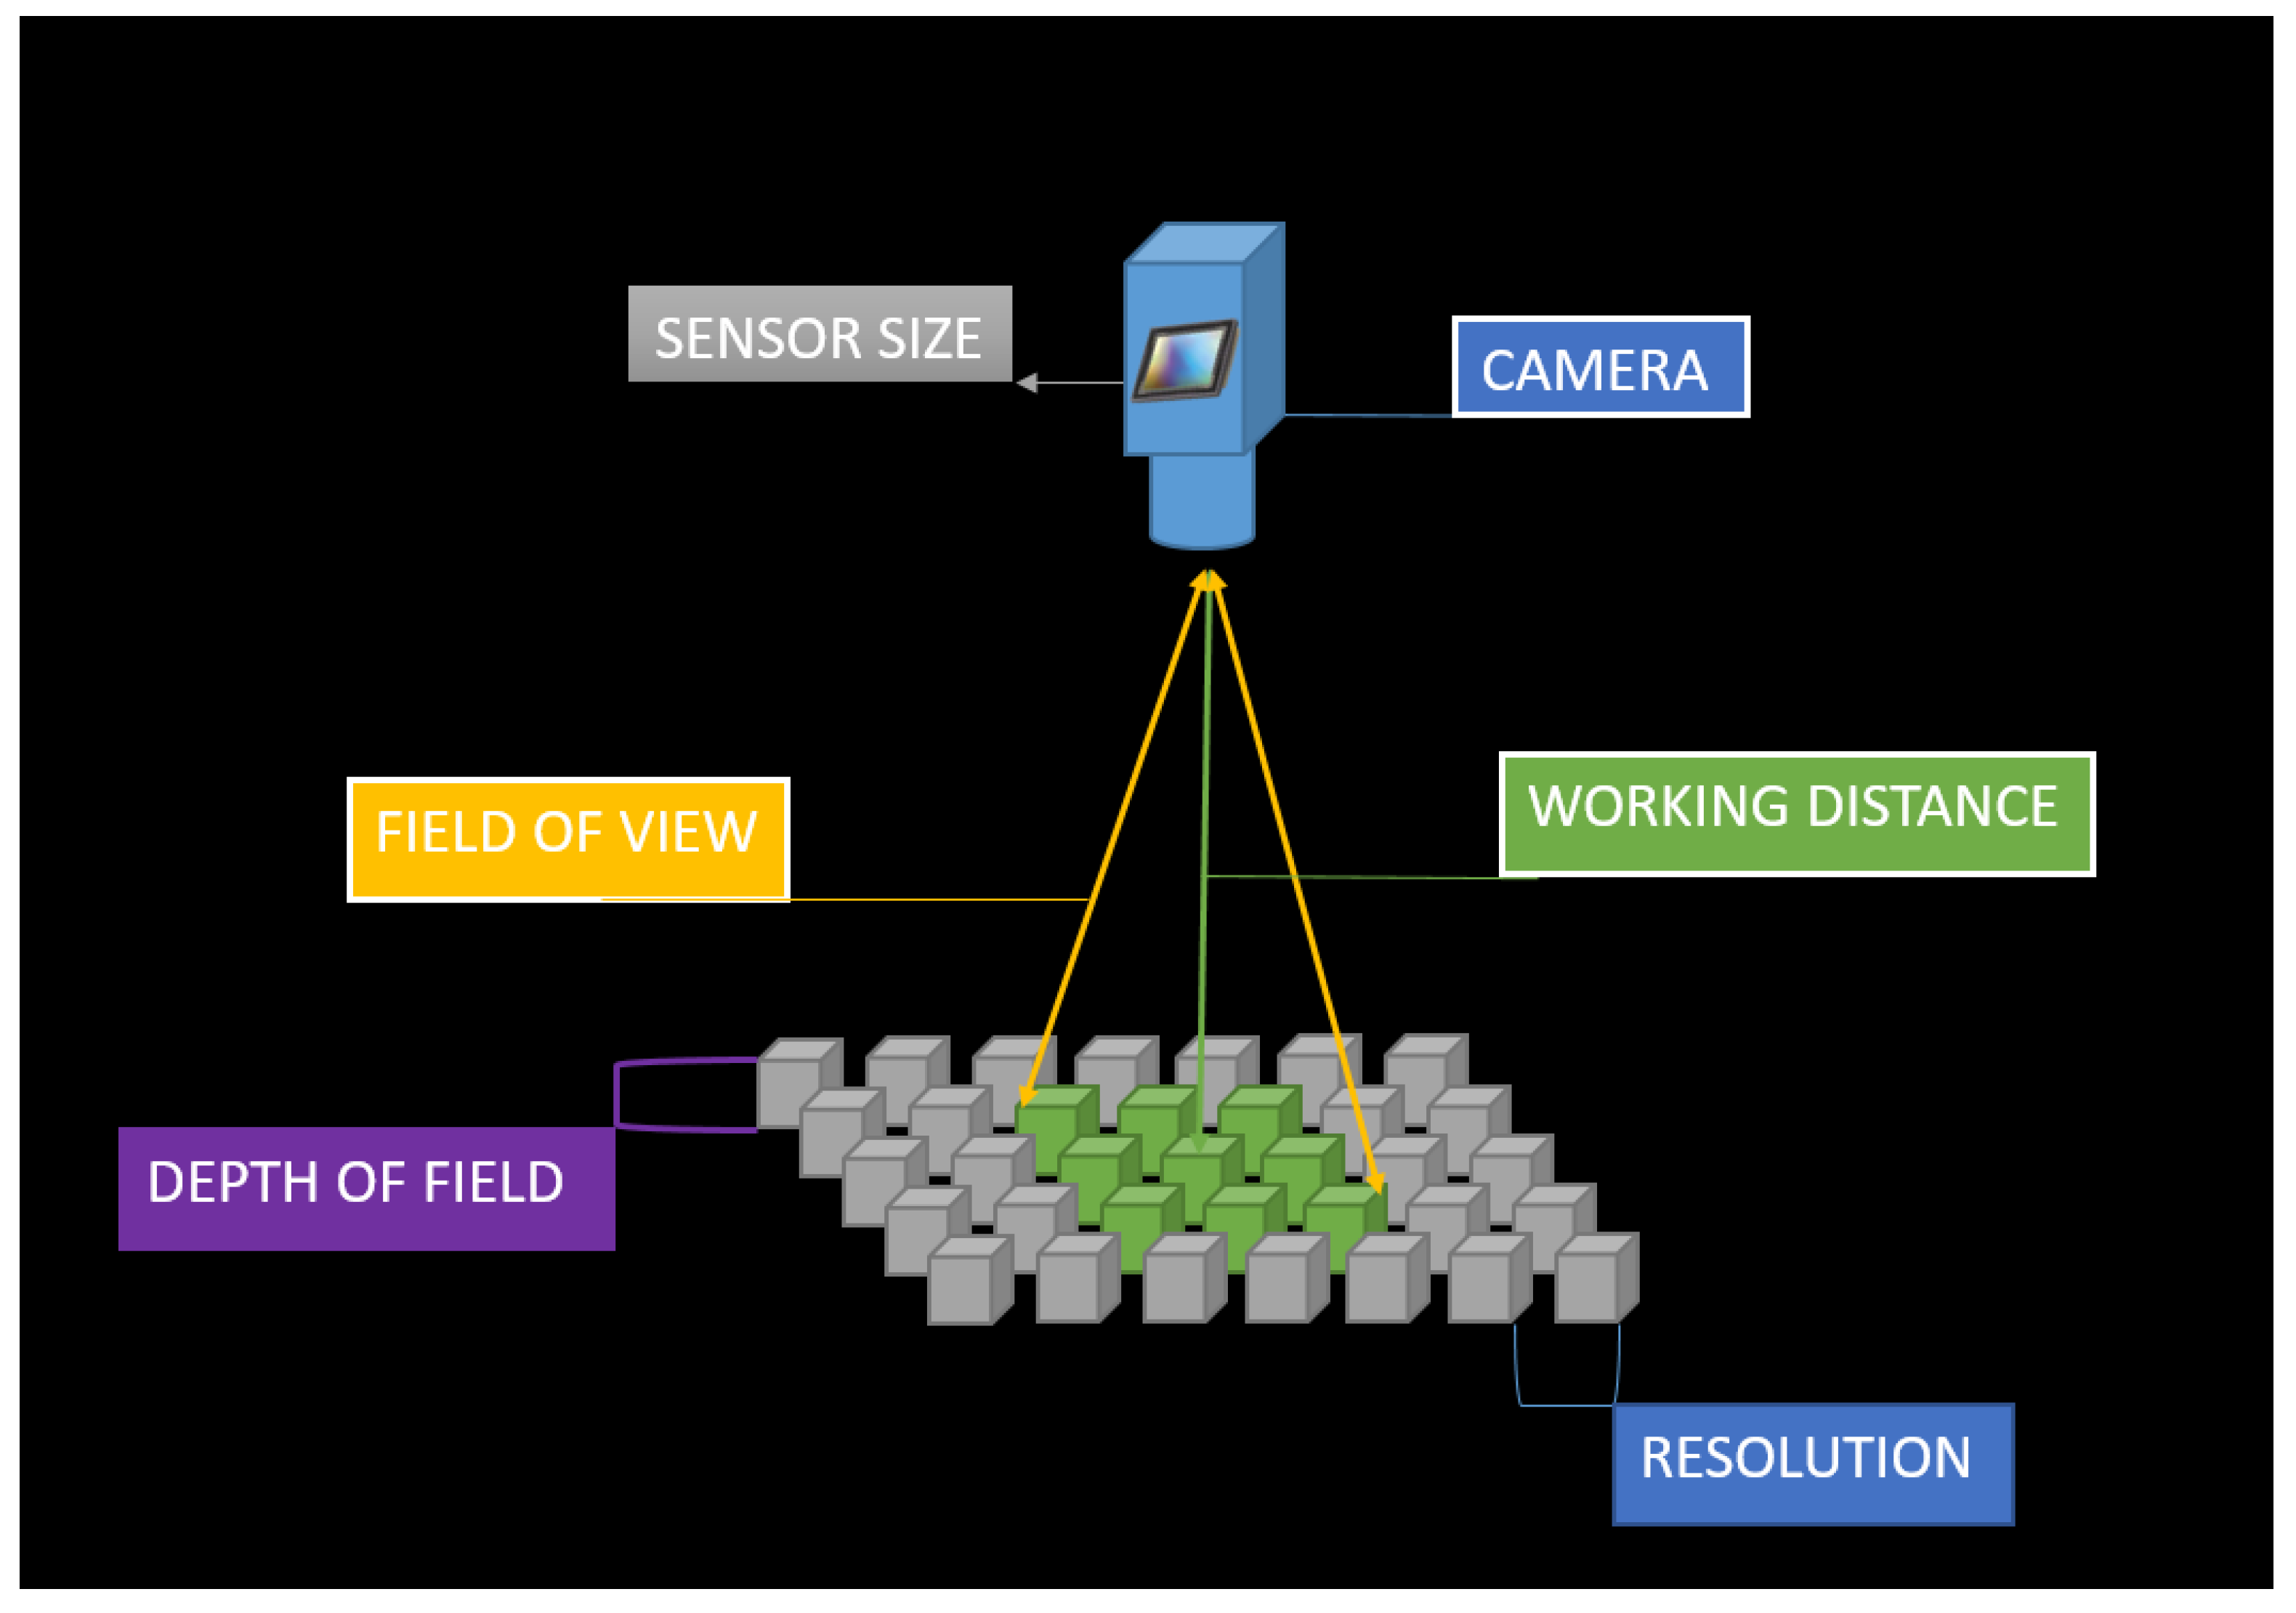
The basic parameters (Figure 9) of an imaging system are:
- Field of View (FOV)—visible object area photographed;
- Working Distance (WD)—the distance between the lens front and the inspected object;
- Resolution—number of pixels or number of minimal parts of the object that can be distinguished by digital imaging;
- Depth of Field (DOF)—the maximum depth tenable in acceptable focus;
- Sensor Size—the active area size of the camera sensor;
- Camera.
There are a wide range of digital camera capabilities, and consequently, of sizes and prices (Table 1). The most commonly used camera sensors are charged coupled device (CCD) and complementary metal-oxide semiconductor (CMOS) [26]. In a CCD camera, radiation energy (proportional to light exposure) is converted to an electrical signal using of mass photodiodes. These cameras provide good system differentiation and flexibility for various applications (industrial imaging, digital photography, scientific and medical research, etc.). A CMOS camera is more sensitive than a CCD camera, and has a greater dynamic range with very fast signal transferring. They are suitable for industrial use for on-line product inspection, and for all other applications where there is no need for high image quality (wireless video devices, video conferencing, toys, bar-code scanners, etc.) [26].
Scanners are usually used for specialized tasks and specific use (extreme resolution, large numbers of output channels or extreme wavelengths). Qualifying specification parameters for a scanner are bit (color) depth, resolution, and dynamic range. The scanner’s bit-depth defines the amount of color information in the image. Accuracy increases with higher depths (4-bit with 16, 8-bit with 256, 24-bit with almost 17 million tones, etc.). Resolution is expressed in dots per inch (dpi) and determines the number of details in the image. Dynamic range is a measure of scanner ability to distinguish image colors and tones. It is similar to image depth and it ranges from perfect white (0.0) to black (4.0) [20].
2.3. Hardware and Supplied Software
3. Digital Image Analysis
Image capturing (acquisition), processing and analysis are operations included in the computer vision system (Figure 10). The role of image processing is to obtain an image with enhanced quality and to decrease various defects such as noise, distortion, improper lighting and focus, and errors caused by camera movement. Image analysis separates the region of interest (ROI) from the background is then used to obtain quantitative information about the analyzed object. There are several steps in image processing and analysis. The first step is image acquisition and pre-processing of the image to improve its quality (correction of contrast, blur, distortions etc.). Second processing step includes image segmentation (thresholding), representation and description [28]. In the last step, different statistical tools are used to recognize and interpret information obtained from the object image [30].
4. Perception and Measuring of Beer Color
Each beer style has a range of acceptable colors. The actual color of each beer is nothing more than gradations of a brown tone, which decreases in concentration through red, copper, and amber colors, through to golden yellow and light yellow. The brewer’s ability to predict and control beer color, as one of the three visual attributes which influence beer appearance, is very important. Consumers have a habit associating the beer color with the flavor, and according to the color, to determine which type it belongs, to lager, ale or stout [31]. Consumers expect consistently high-quality standards of foods and beverages, and color loss will be perceived as a sign of quality reduction. They have high requirements in terms of external product quality (appearance, shape, color), so the food industry has the task of providing efficient systems for continuous monitoring of the product’s color during the production and storage [12].
The color of the beer comes from malted barley, and wort production. Substances responsible for beer color (melanoidin, polyphenols, trace metals like copper and iron, riboflavin, caramel) are formed during several different chemical reactions [32,33,34]. Melanoidins are water soluble pigments whose color changes from initially yellow to dark brown [35]. During the kilning process, when the temperature is greater than 95 °C, a Maillard reaction takes place and produces color and aroma components from sugars and amino acids. Caramelization reactions take place at temperatures above 120 °C, and are affected by pH and the type of sugar [36]. At the temperature above 200 °C, pyrolysis reaction occurs and black pigments are produced in the brewing process.
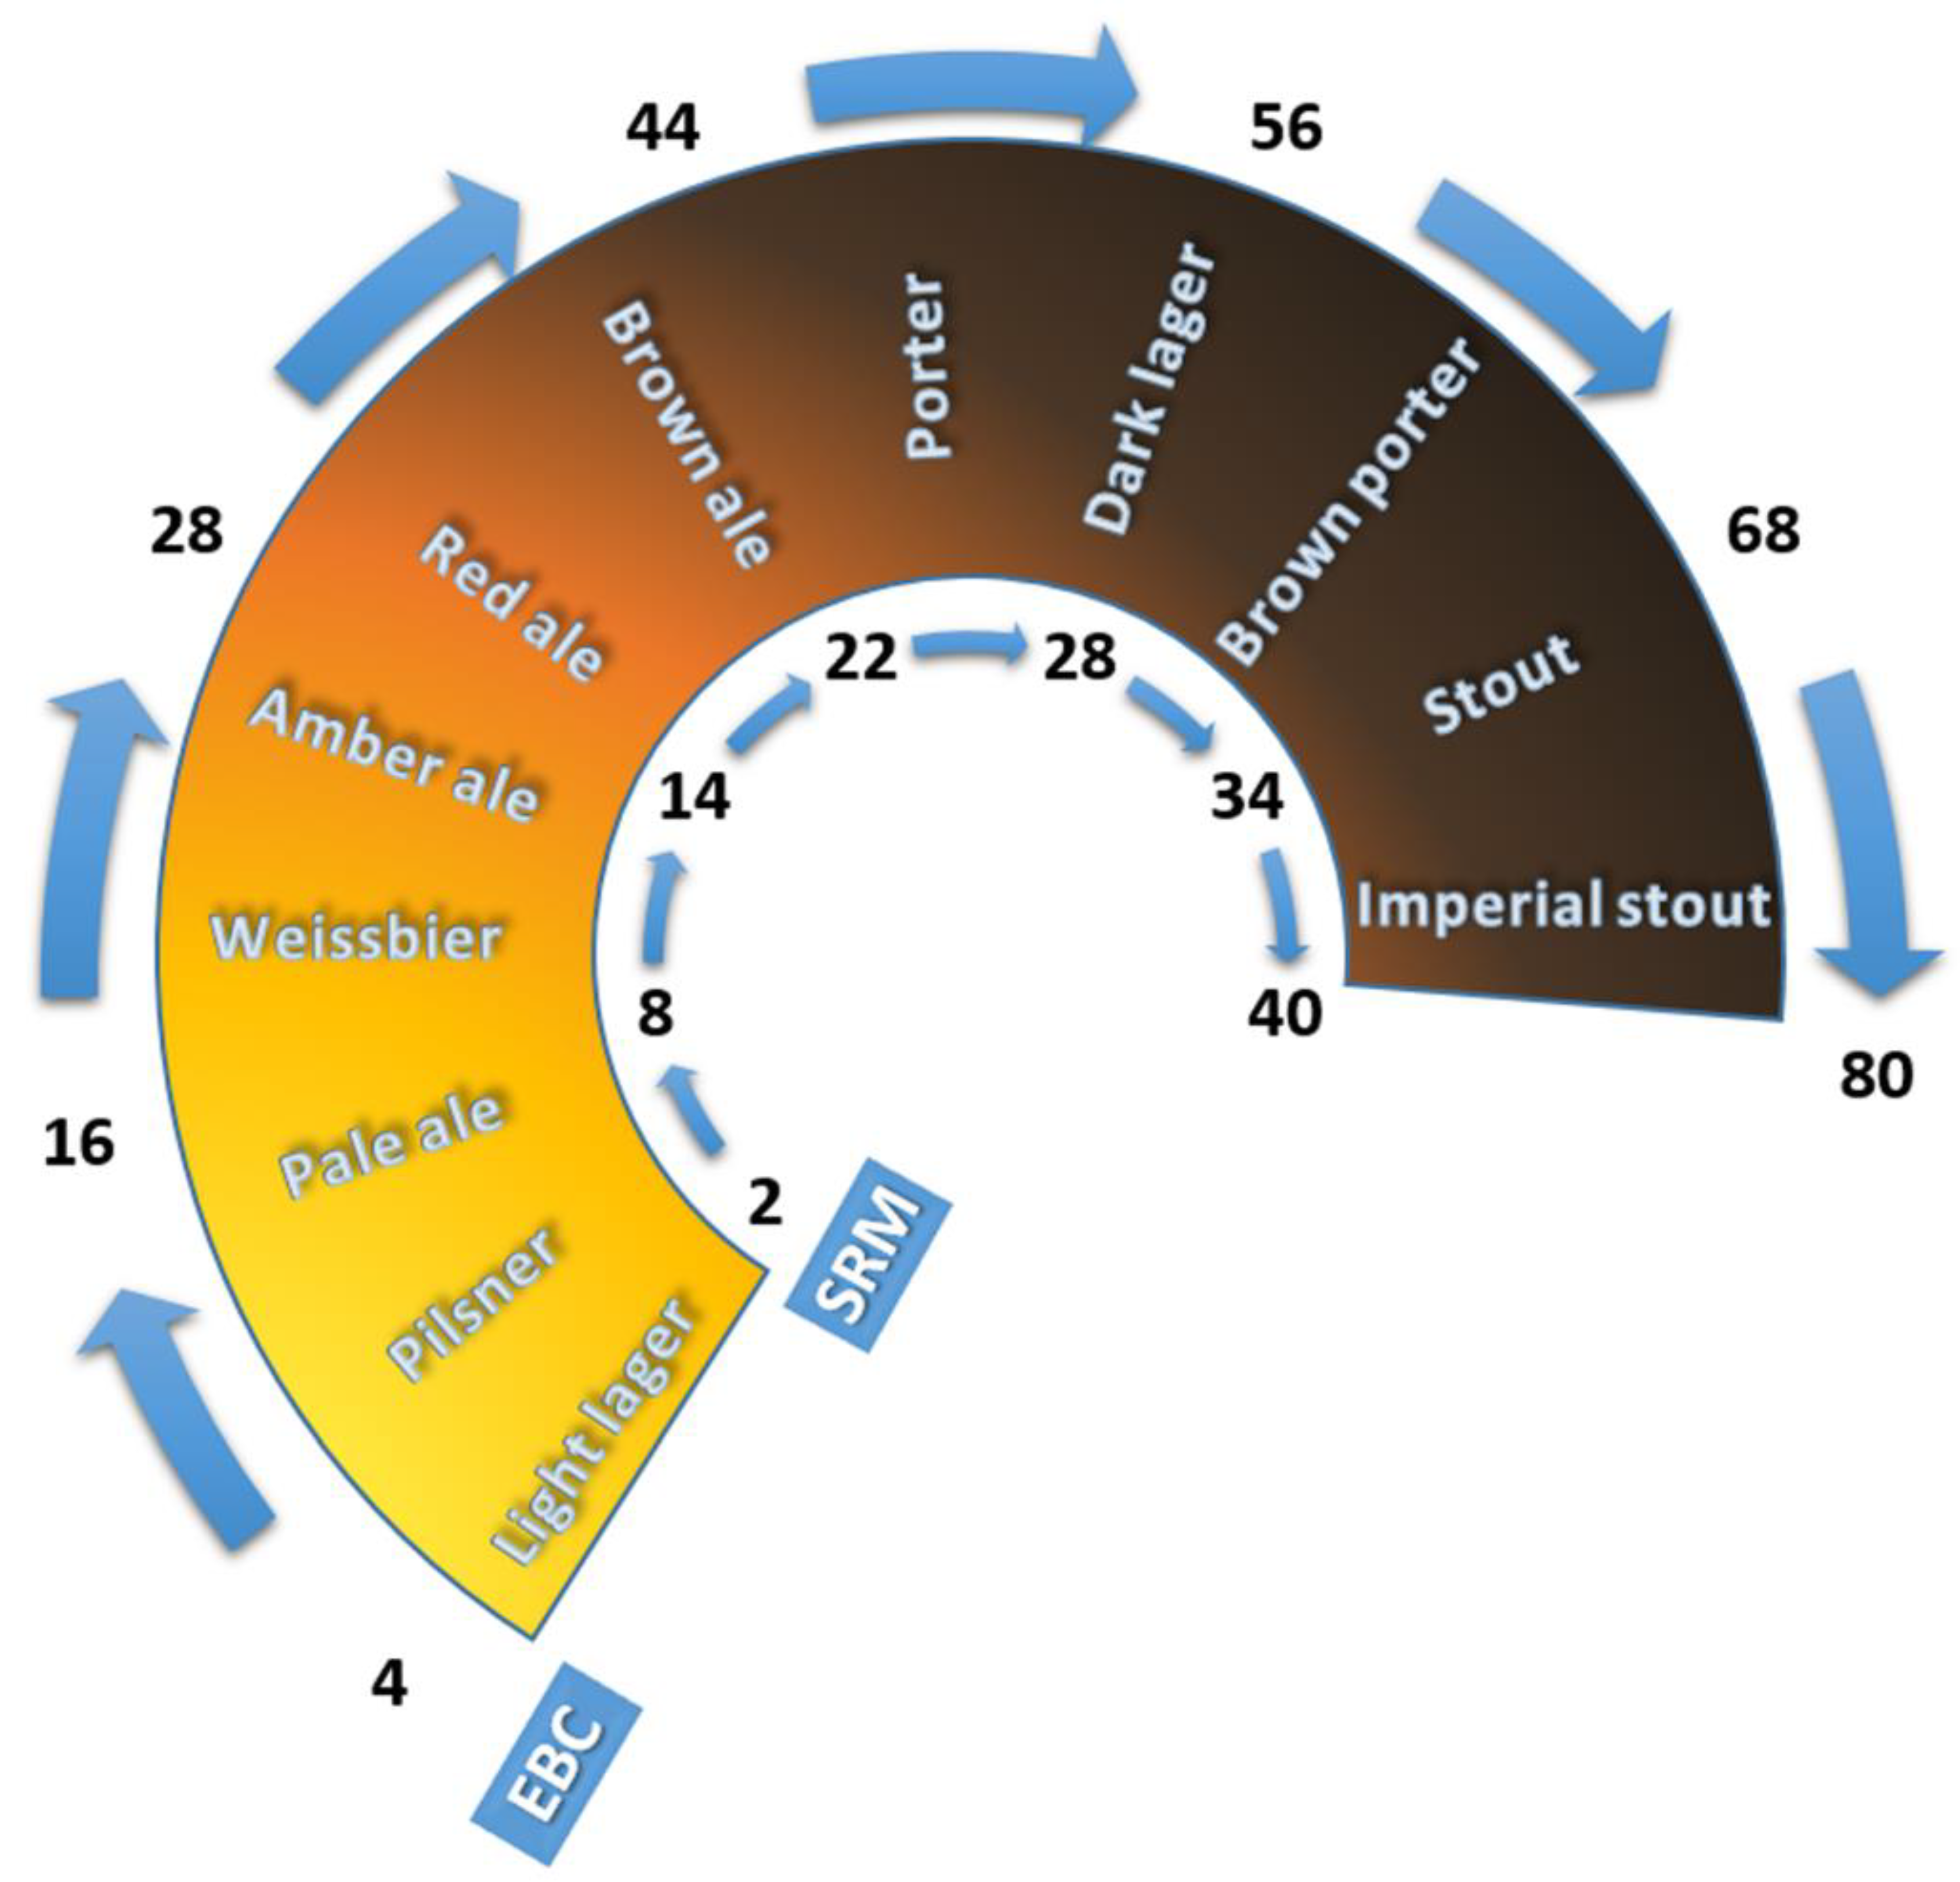
Through history, numerous techniques of color determination of malt and beer have been developed. Grading techniques are based on a comparison of the color standards with the product color. The color is expressed using several scales according to Lovibond (°L), European Brewery Convention color scheme (EBC) [37] or Standard Reference Method (SRM) (Figure 11). A scale for the beer color expression is determined by the used method of color measurement. The first method used to determine the color of beer was the visual comparison method, where beer color is expressed in degrees Lovibond. J.W. Lovibond developed this method in 1893, which was then adopted by Bishop in 1950. The method is quantitative and based on subjective estimation of beer color by visual comparison of beer samples with colored glass discs references. After improving, the European Brewery convention accepted the visual comparison method and the color of malt, wort and beer are expressed in EBC units [31]. In the US, the color of malt is commonly expressed in °L while SRM scale is used for estimation of the beer color. However, visual comparison method ha weaknesses, because it is subjective (based on visual comparison of color sample and reference with the human eye). Because of this disadvantage, new instrumental methods for beer color assessment are developed (spectrophotometric and tristimulus method). That group of methods is independent of the observers, and allow an objective assessment of beer color. In the tristimulus method, light reflected from the sample is separated through the filters into three color channels corresponding to the human eye vision and captured by sensors. Several color systems have been proposed to describe a color as a tristimulus value of individual intensities of red, green and blue [38]. There are many different color systems like Lovibond RYBN color, The Munsell Scale, CIE color system (CIELab, CIELCh, CIEXYZ), RGB color system. The spectrophotometric method uses multiple sensors to measure spectral transmittance or reflectance in a visible light spectrum range (380–740 nm).
Currently, the color of beer and wort is expressed in EBC scale, and North America is an exception where the color is expressed in a SRM scale. The American Society of Brewing Chemists (ASBC) has developed a method for beer color determination by spectrophotometer, called the Standard Reference Method (SRM). The SRM method is based on an absorbance measurement, where the beer color is expressed as a quantity of absorbed light at a wavelength of 430 nm in a 10 mm quartz cuvette against water as a reference [39].
where, D = dilution factor of the sample and A430 = the light absorbance at 430 nm in a 1 cm cuvette.
Based on spectrophotometry, the European Brewing Convention (EBC) system has developed a similar method in Europe. The simple equation is used to calculate beer color in EBC units:
where, D present dilution factor of the sample, A430 present absorbance of the beer at a wavelength of 430 nm in a 1 cm cuvette.
Since EBC and ASBC measurements are based on absorbance at 430 nm, conversion can be made by simply adjusting for the differences in path length and multiplicative factors by the following equation:
For both methods, it is important that the beer sample have no turbidity during color measurement. Otherwise, if turbidity is greater than 1 EBC unit, the sample needs to be filtered or centrifuged.
The values of the EBC color scale are approximately 2 times higher than the values of the SRM scale. There are also darker beers whose color is out of the scale and difficult to detect; such samples have to be diluted when measuring [40].
Photometry can be used for color determination of beer and malt [9], and color can be expressed with a tristimulus CIELab color model, were L is the lightness component, a refers to the degree of the red and green, and b to the degree of the blue and yellow color. Lightness (L value) is strongly correlated with the conventional EBC scores [41]. To replace the conventional visual color assessment a novel, computer vision system (CVS) has been developed [24]. CVS enables the non-destructive, contactless, fast, automated, objective, and repeatable color measurement of different food products. It is based on the analysis of each pixel on a captured photo (covering the entire sample), which makes it objective and precise as a method [42,43].
Various methods have been developed for the characterization of different beer types. Silva et al. [44] investigated computer vision method and digital image analysis as an alternative method for color classification of Brazilian pale lager beers. Beer samples are scanned in Petri dishes, and digital image analysis was applied for pattern recognition of beers. After applying digital image analysis, results were presented as color histograms in RGB color space for each brand of Brazilian pale lager beer. Along with conventional analytical methods of color determination, digital image analysis has been demonstrated to be a suitable method for classifying beer of the same type or category. Nikolova et al. [45] reported the use of digital image analysis and spectrophotometer for beer type classification according to their color. For this purpose, several beer samples were chosen to obtain digital images: light beer, dark beer, a beer with lemon and beer with fruits. Cluster analysis was applied to a group of similar beer samples. Beer samples were photographed with a CCD camera in a BMP format. After pre-processing of the image, obtained results were presented as RGB values, and later transformed into the CIELab values. The beer color determined by the image analysis corresponds to the color results measured by the spectrophotometer. Therefore, computer vision and digital image analysis proved capable color-based method in classifying beer.
5. Bubble Size Distribution and Nucleation in Beer
Bubble haze arises in the beer during dispensing beer into the glass (creating an illusion of haze), as a result of a large number of microbubbles which are formed during bubble nucleation. Formed microbubbles do not go immediately to its surface, thus contributing to the effect of the beer bubble haze, and are responsible for the formation of the foam ring on the top of the liquid surface. Bubble haze is an important beer quality parameter and can be preferred by the consumers. For the brewing industry, it is essential to measure beer bubble haze during beer dispense, as one of the product quality indicators. Furthermore, it is very important to determine and control the bubble size in beer haze because their size directly affects the distribution of flavor and taste of beer. Bubbles collect at the top of the glass in a foam called “head”. A beer perceived as flat showed little nucleation activity (bubbling) in the glass, regardless of its normal CO2 content. Also, active bubbling regenerates the head [46,47,48].
Several methods can measure the frequency of bubble formation, their size and distribution in supersaturated beer liquid. Saxena et al. [49] categorized these methods into three groups:
- Image (photographic) analysis methods—analysis of the captured images of bubbles;
- Optical probe methods—analysis of the bubble penetration length in the area of intensive bubbles migration;
- Electrical conductivity (resistivity) probe methods—analysis of the bubble volume with ultrasound/isokinetic sampling probes.
A digital balance can be used for the estimation of gas loss (measuring the mass loss of the beer glass) over time, to quantify the degree of nucleation activity. The nucleation activity also can be performed visually, observing the reduction in the number of bubbles occurring in beer glass over time. This method is one of the first to be reported for observing the nucleation activity in beer. This method has many faults, is long-lasting, requires a lot of time and is not precise and objective [50]. Lubetkin and Blackwell [51] developed a method for quantification of the nucleation activity using sound data recorded with a microphone and computer at the surface of the liquid. After recording, the sound data were analyzed and the frequency of the bubble rupturing is determined. In this method, the nucleation activity is observed by measuring the sound of rupturing bubbles. This method also has limitations in the application since the beer is the system with foam-forming nature. Image analysis method can also be used for measuring the bubble rate formation in beer. This method is based on image analysis of the photographed bubbles in beer glass during the time. Liger-Belair et al. [52] reported the use of an image analysis method for investigation of the bubble formation in Champagne. They used stroboscopic light and digital camera for image capturing. In this study, the authors reported that the image analysis method could be used to measure numerous parameters of bubble formation: bubble formation frequency, growth rates, and bubbles rising velocities in the liquid.
Hepworth et al. [53,54,55] made several studies of using computer vision method and image analysis to monitor bubble haze in beer and to investigate the influence of numerous process parameters on bubble haze formation and distribution in beer glass during beer dispense. Hepworth et al. [55] tried to explain the phenomenon of bubble haze in beer more closely in the general aim to predict their presence or absence, and to understand how process parameters affect the bubble haze. They examined the influence of changing the dissolved nitrogen and carbon dioxide content on the stability of the bubble haze in beer. Furthermore, they observed the influence of beer flow rate from the tap and applying a sparkler (a thin plastic disk) in the tap on the stability of the bubble haze. Stability of beer bubble haze was monitored by measuring surge time (the period of the haze disappearing), haze velocity (velocity increase of bubbles), and bubble size distribution (diameter and number of bubbles) in beer. Experiments were carried out using the high-speed video camera and a CCD camera for image acquisition, followed by the image analysis method. Experimental results indicate a positive correlation between the surge time and beer flow rate, sparkler application and supplied nitrogen content. Besides, the size and number of bubbles are crucial factors for the prediction of bubble haze lifetime, and they can be affected by varying the process condition [55].
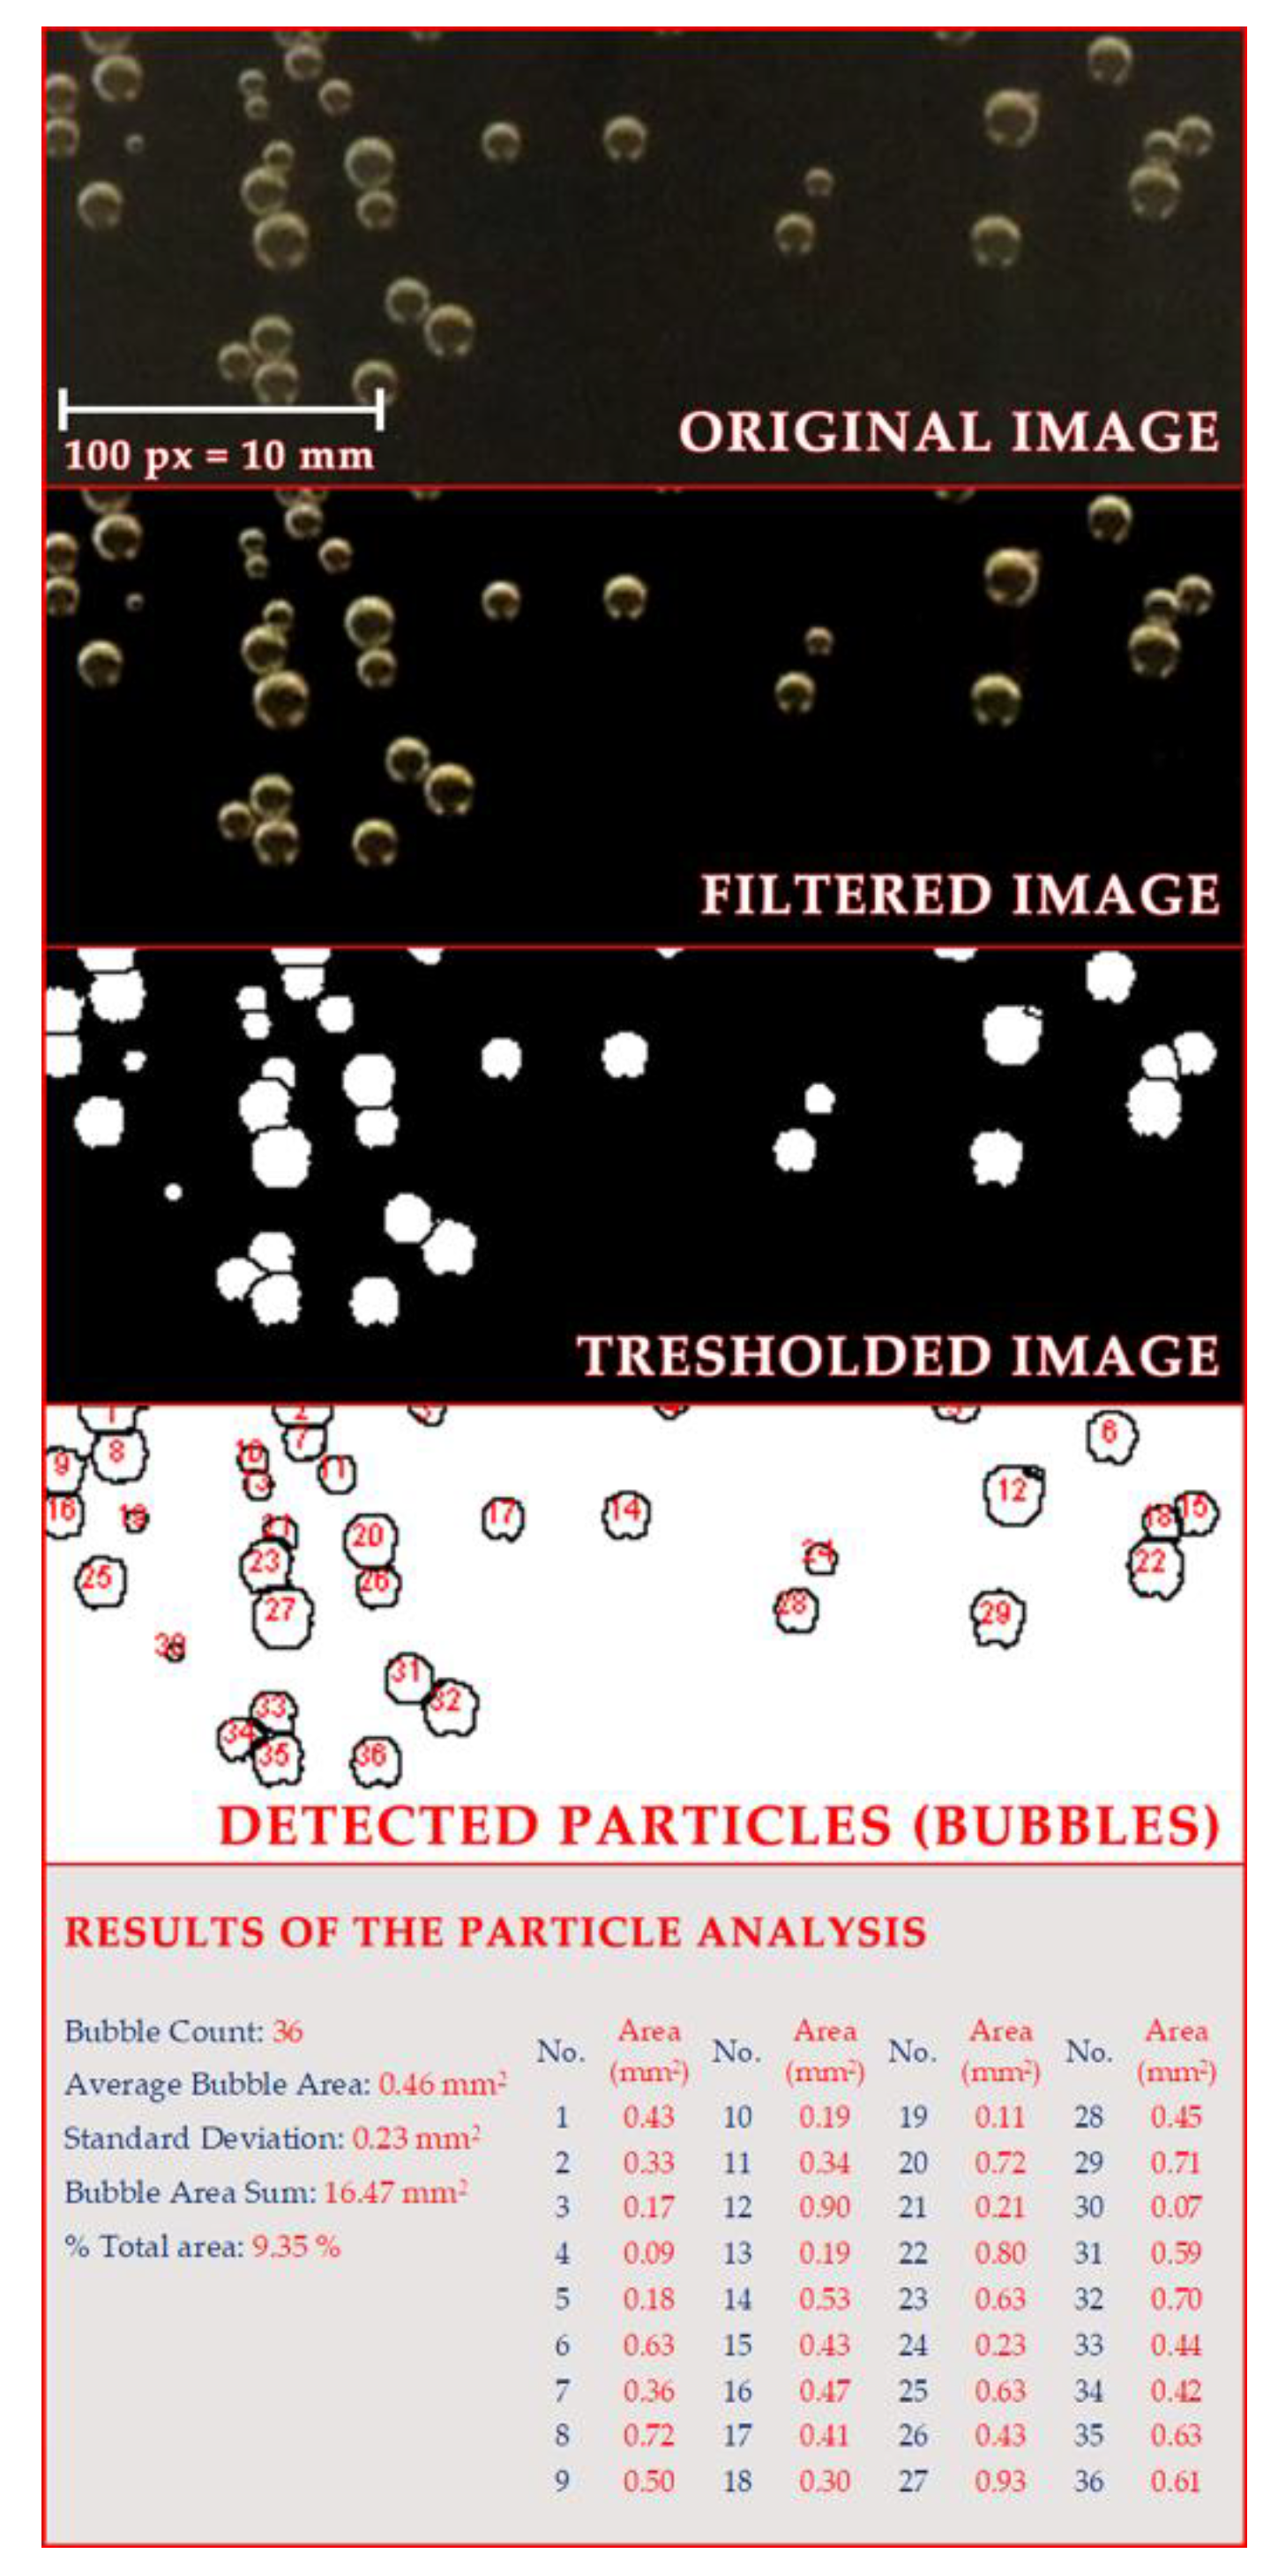
Hepworth et al. [54] also developed another experimental procedure for monitoring the bubble nucleation (measuring bubble production rate and bubble size) during beer dispense. In this study, they investigated the influence of liquid motion, gas composition, and beer flow rate on the bubble nucleation in beer using computer vision and mathematical modeling. The image analysis was performed on images captured with a CCD camera to determine the bubble diameters and bubble distribution. They adopted the classical mathematical model for predicting bubble nucleation by including liquid motion as a new variable. According to the result, the proposed mathematical model can be suitable for predicting the bubble production rate and size, considering liquid motion. When the flow rate increases, the bubble nucleation rate in beer also increases. The nitrogen content in the gas headspace has an opposite effect on the bubble nucleation (greater nitrogen content, the lower nucleation rate). Hepworth et al. [53] developed and adapted the image analysis method for measuring bubble distribution in beer (measuring bubble production rate and size). For this purpose, they captured images of bubbles in beer, and after image capturing, they applied an image processing to extract valuable data from the captured image like bubble size (diameter) and bubble velocities (distribution and position of bubbles in the observed tank during the time) (Figure 12). In order to ignore the influence of errors and limitations during image capturing (distortion from the curved glass, the distance between the camera lens and glass, focusing problems), they constructed flat-bottomed beer tank with the camera in a very close position. Thus, distortions were avoided due to this positioning method. The proposed method has shown as a good tool for predicting the bubble nucleation rate, bubble growth, and motion under various experimental conditions. The great advantage of this technique is that is designed to be simple to use and relatively portable.
Zabulis et al. [56] reported the method for bubbles detection and their size determination in dense dispersions with digital image technique. In this study, they developed software for bubble detection, which is easy to use without any need for additional intervention during application. The method is objective and effective in determination of the bubble distribution, and bubble size in beer. This method provides a good tool to control and monitor foam decay through measurement of bubble size distribution. The method is based on monitoring of visual appearance (appearance-based approach) of beer samples with a digital camera in a single image. The proposed approach utilizes templates to increase robustness and an image scale-space to detect bubbles independently of their size. Furthermore, algorithmic optimizations for the proposed approach that target the reduction of computational complexity and user-intervention are proposed and compiled into a software application.
6. Foam Stability (Head Retention)
Beer external quality is characterized by foam stability and visual appearance. Therefore, for beer having a long-lasting head of foam and strong foam, some say that beer is of good quality and is desirable among consumers Features of a good foam are quantity and stability, cling or lacing (adhesion to the glass), density or creaminess, whiteness, and strength. Methods for foam quality evaluation are based on the different foam physical characteristics. Most methods measure foam collapse or the rise of the liquid/foam surface (drainage). Drainage is the liquid flow from a wet foam fraction to the liquid underneath and, in the first stages of the foam decay (collapse), it is the dominant process contributing to foam collapse. However, rearrangement of the foam bubbles during time is an equally important factor when measuring foam stability. Furthermore, some other phenomena also must be considered when beer foam kinetics is studied, e.g., creaming, which represents the rise of the bubbles to the top of the system [57].
Many research activities have been focused on detecting the main components and reaction mechanisms that influence beer foam quality (both positive and negative effects). Stability of beer foam mainly depends on the presence of the hydrophobic surface-active proteins (polypeptides) of albumin class, primarily protein Z (40 kDa) and lipid transfer protein LTP1 (9.7 kDa). Among the proteins mentioned above, the stability of beer foam is also influenced by an iso-α-acids from hops, metal cations, hordein-derived (poly) peptides, polyphenols and non-starch polysaccharides (β-glucan and arabinoxylan). Contrary to substances that promote foam stability, destabilization substances are lipids, some amino acids and increased ethanol content [47,48,56,57,58,59,60,61]. The beer foam stability can be improved by using nitrogen gas, the way of pouring beer into a glass (pouring from a certain height which can increase the foam in the glass), or by using the beer dispensing system. In addition, the shape of a beer glass plays an important role in beer foam stability. Beer glasses with a larger diameters at the top have a larger exposed surface area of foam in relation to volume ratio, which is why the stability of the foam is disturbed.
The assessment of beer foam quality depends both on the foam generation method, and on foam collapse/drainage measurement procedure. Techniques to generate beer foam can be divided into artificial (foaming devices) and natural categories (pouring). Standard methods for determination of beer foam stability are based on measurements of the weight or volume of the liquid collapse from the foam, visual assessment of foam volume decrease or conductometric assessment of foam/air interface. Some traditional methods for the foam quality assessment are Rudin head retention, Ross and Clark procedure, NIBEM, Sigma head value (SHV), ASBC sigma method [62]. Those traditional (standard) methods can produce errors due to some experimental conditions, e.g., non-reproducible and irregular way of foam generation. Evaluation of the foam stability is much more commonly determined by measuring the liquid drainage rate from the foam due to an inconsistent foam-air boundary, which is difficult to define precisely. Additionally, the beer temperature of 20 °C is greater than one used when beer is served to the customer; foam stability is directly related to temperature (the foam quality differs at lower and higher temperatures).
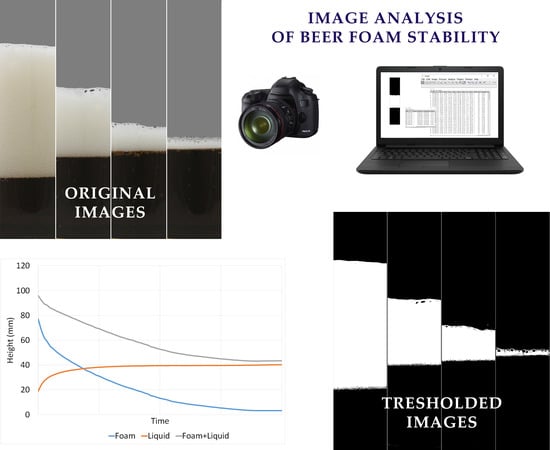
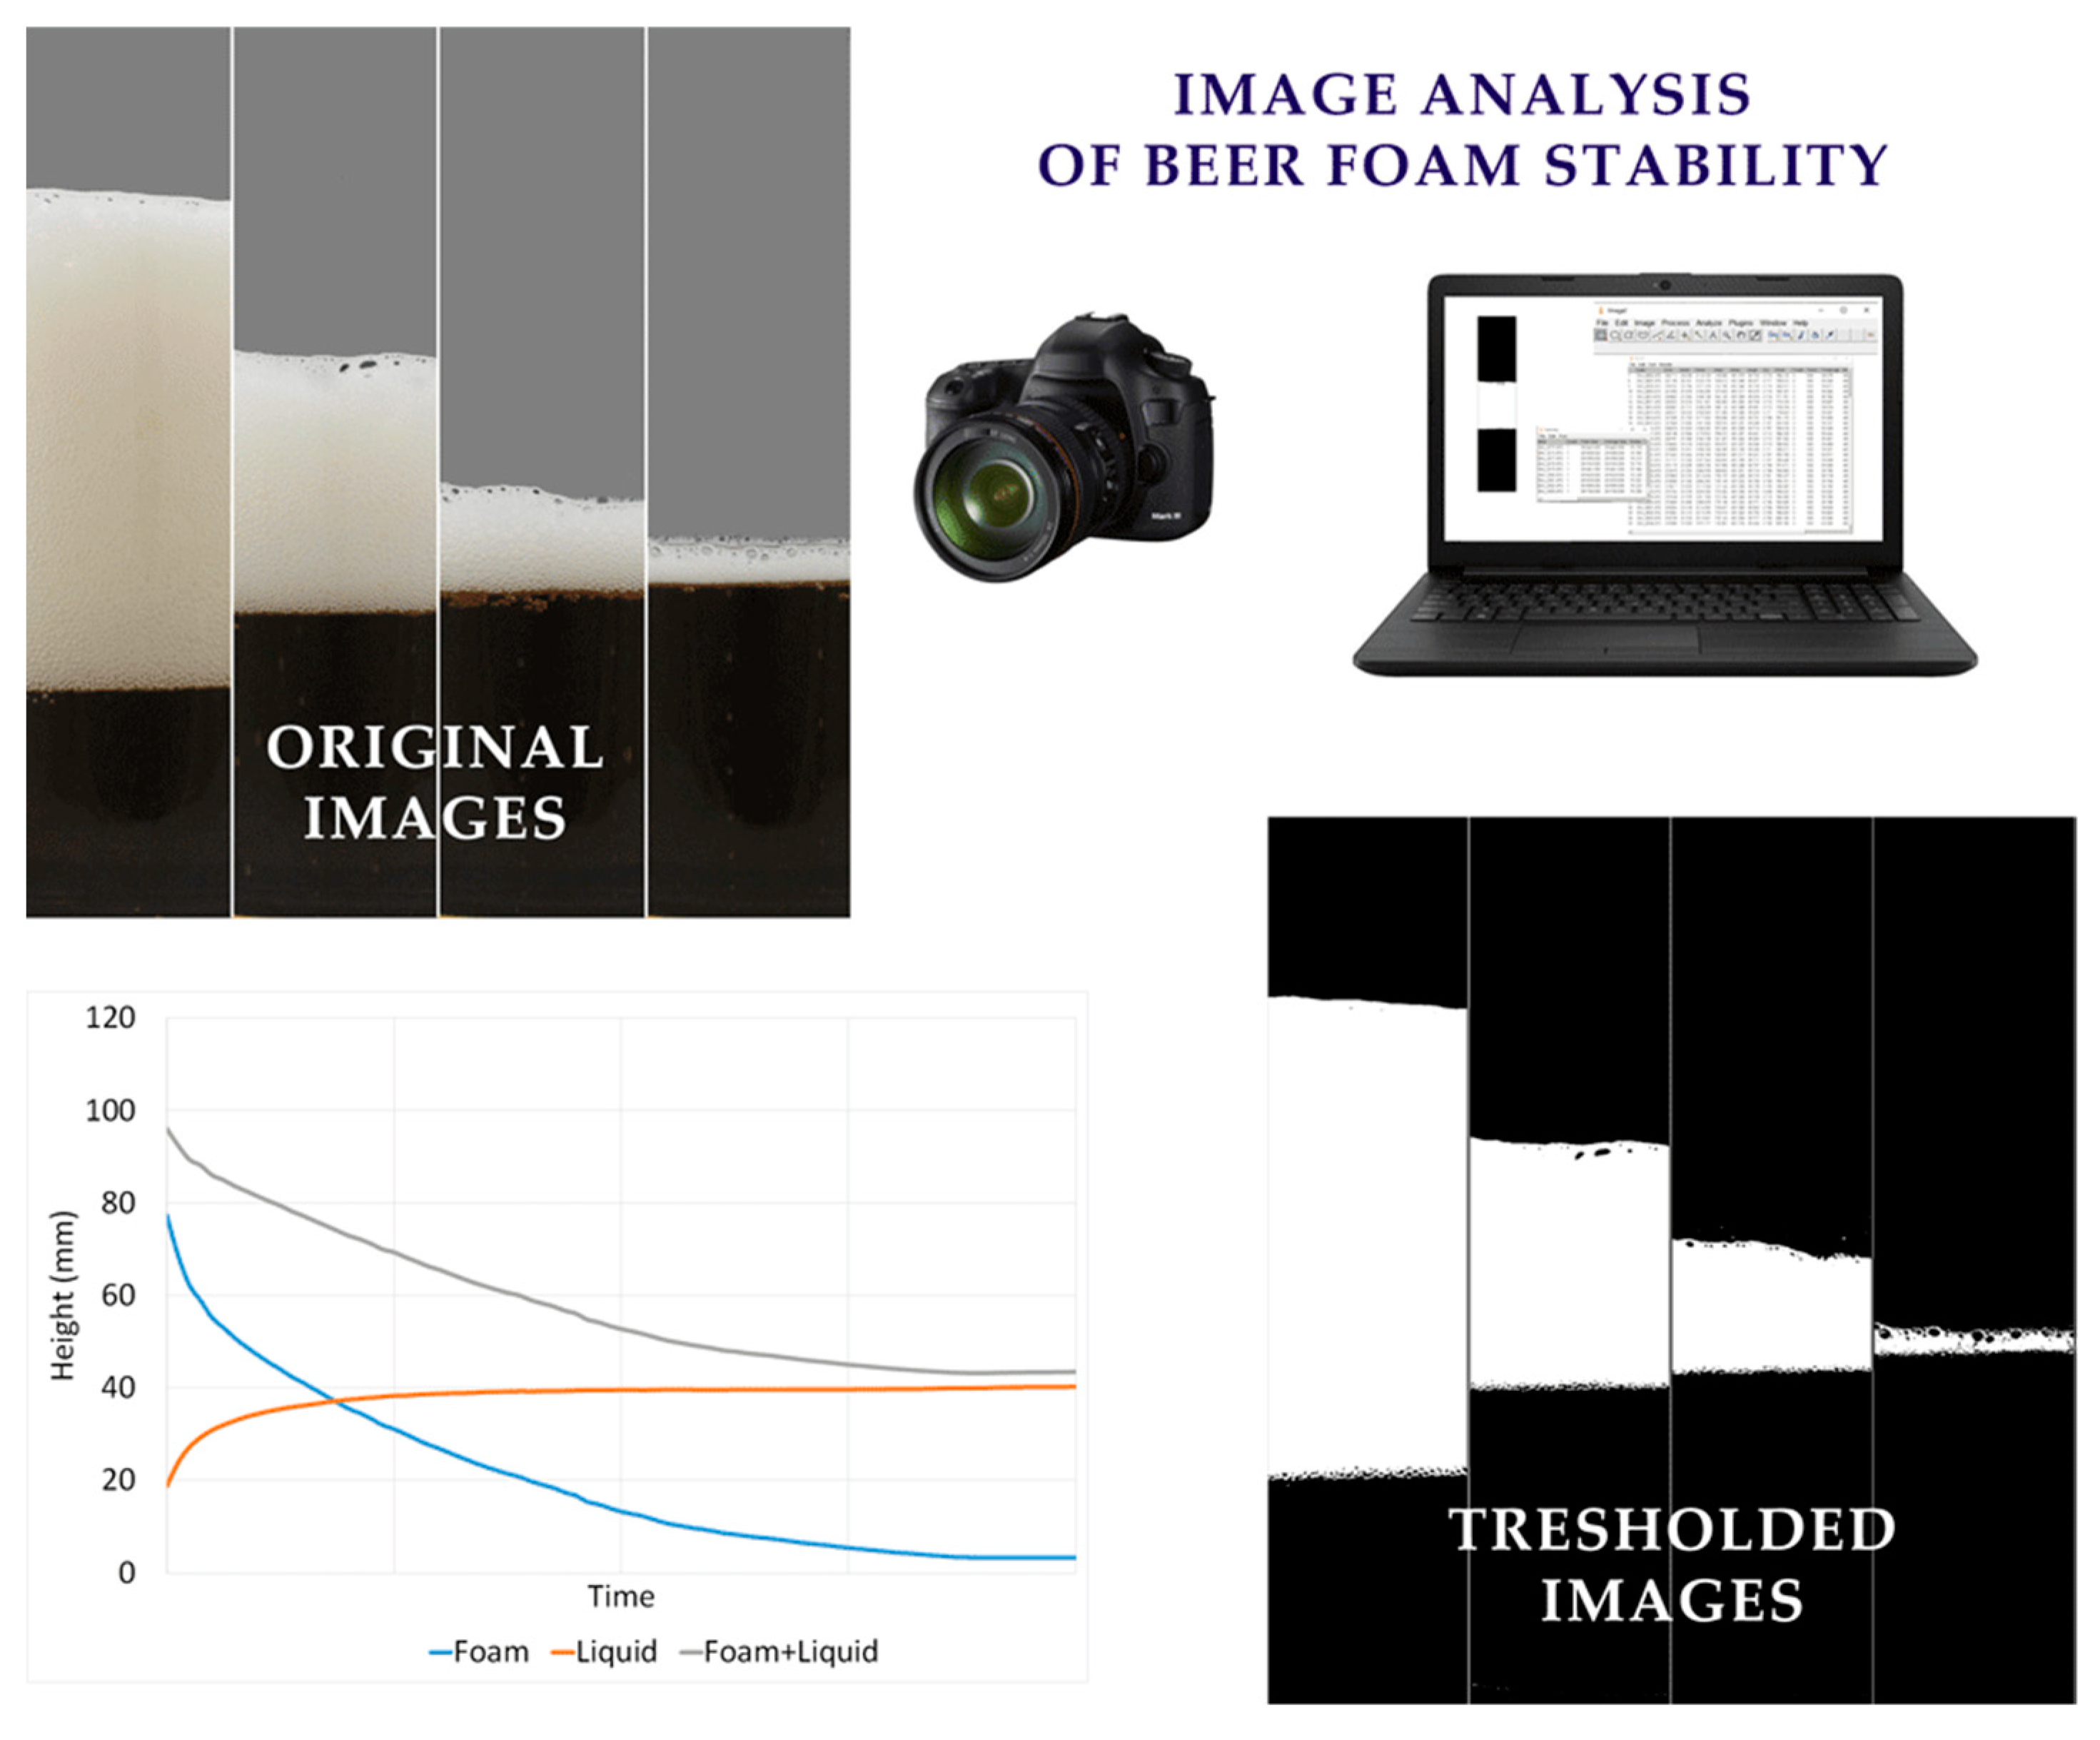
In contrast to standard methods, new devices like digital cameras and image analysis software have been developed for the assessment of the beer foam stability [59]. Methods using such devices are automated, low-cost, contactless and non-destructive, and measures the foam collapse over time. The method is based on photographing a glass in which a known volume of beers is poured. This method can be used to monitor two parameters simultaneously: beer foam collapse or beer liquid height increase in the glass over the time. The beer poured into a glass and is photographed over time, photos are processed using appropriate image analysis software, and obtained results describe the decrease of the beer foam height and increase of the beer liquid phase height over time. Constant [63] investigated the beer foam collapsing by photographing the foam collapse during a 5 min period. After applied image analysis method on photographed beer samples, he observed two separated parameters on photography: total beer height (which includes foam, and liquid together), and liquid height separated from the foam (beer beneath the foam). Yasui et al. [64] investigated foam stability (foam collapse over time, FTC) using image analysis method. Total foam stability over the time is measured using images captured with CCD camera, and beer samples are poured into a beer glass directly from a beer bottle. This method is based on simulation of the foam formation in realistic conditions (the consumer pours beer directly from the bottle into the beer glass). After images are captured, they are analyzed by the image analysis software. The results of the image analysis method (captured foam collapse during the time) are foam height, FTC and foam stability. They confirmed that image analysis is suitable as a method to monitor foam stability by measuring FTC values. Further, it has been found that monitoring FTC values may replace the usual visual impression of foam stability.
Wallin et al. [65] reported a comparison of three methods for the assessment of foam stability. To measure foam stability of nine different beer, they use NIBEM (foam collapse assessment), Steinfurth (foam drainage assessment) and image analysis technique (monitoring foam stability during time) (Figure 13). The main difference between those methods is a way that foam is generated. In the NIBEM and Steinfurth method, foam is generated artificially (under pressure); meanwhile, for the purpose of the image analysis, foam is generated in a natural pour. The result showed a significant correlation between three different methods for assessing foam stability and good reproducibility, and better foam stability of ale beers over lagers.
Recently, to analyze some foam properties like foamability, foam stability, and structure, the Dynamic Foam Analyzer (DFA100) has been introduced. This apparatus is based on the principle of the image analysis method. In KRÜSS GmbH study report [66] samples of degassed clear wheat beer, Pils and Kolch were analyzed to determine the influence of the surfactants in the beer independently of the CO2 content and its impact on the foam behavior. Removal of CO2 before analyses provides a better insight into the influence of other foam-forming substances (e.g., proteins). The equipment uses a vacuum pump to remove CO2 from the sample and, after degassing, foaming is conducted in controlled conditions by computer-regulated air pumping through the beer sample. Samples are illuminated with the LED panel and changes in foam height is captured with photodetector of a video camera. During the analysis, the device records the formed foam in a column and simultaneously provides data on the foamability and foam stability. Furthermore, this equipment measures changes in foam structure during the time (size and number of foam bubbles).
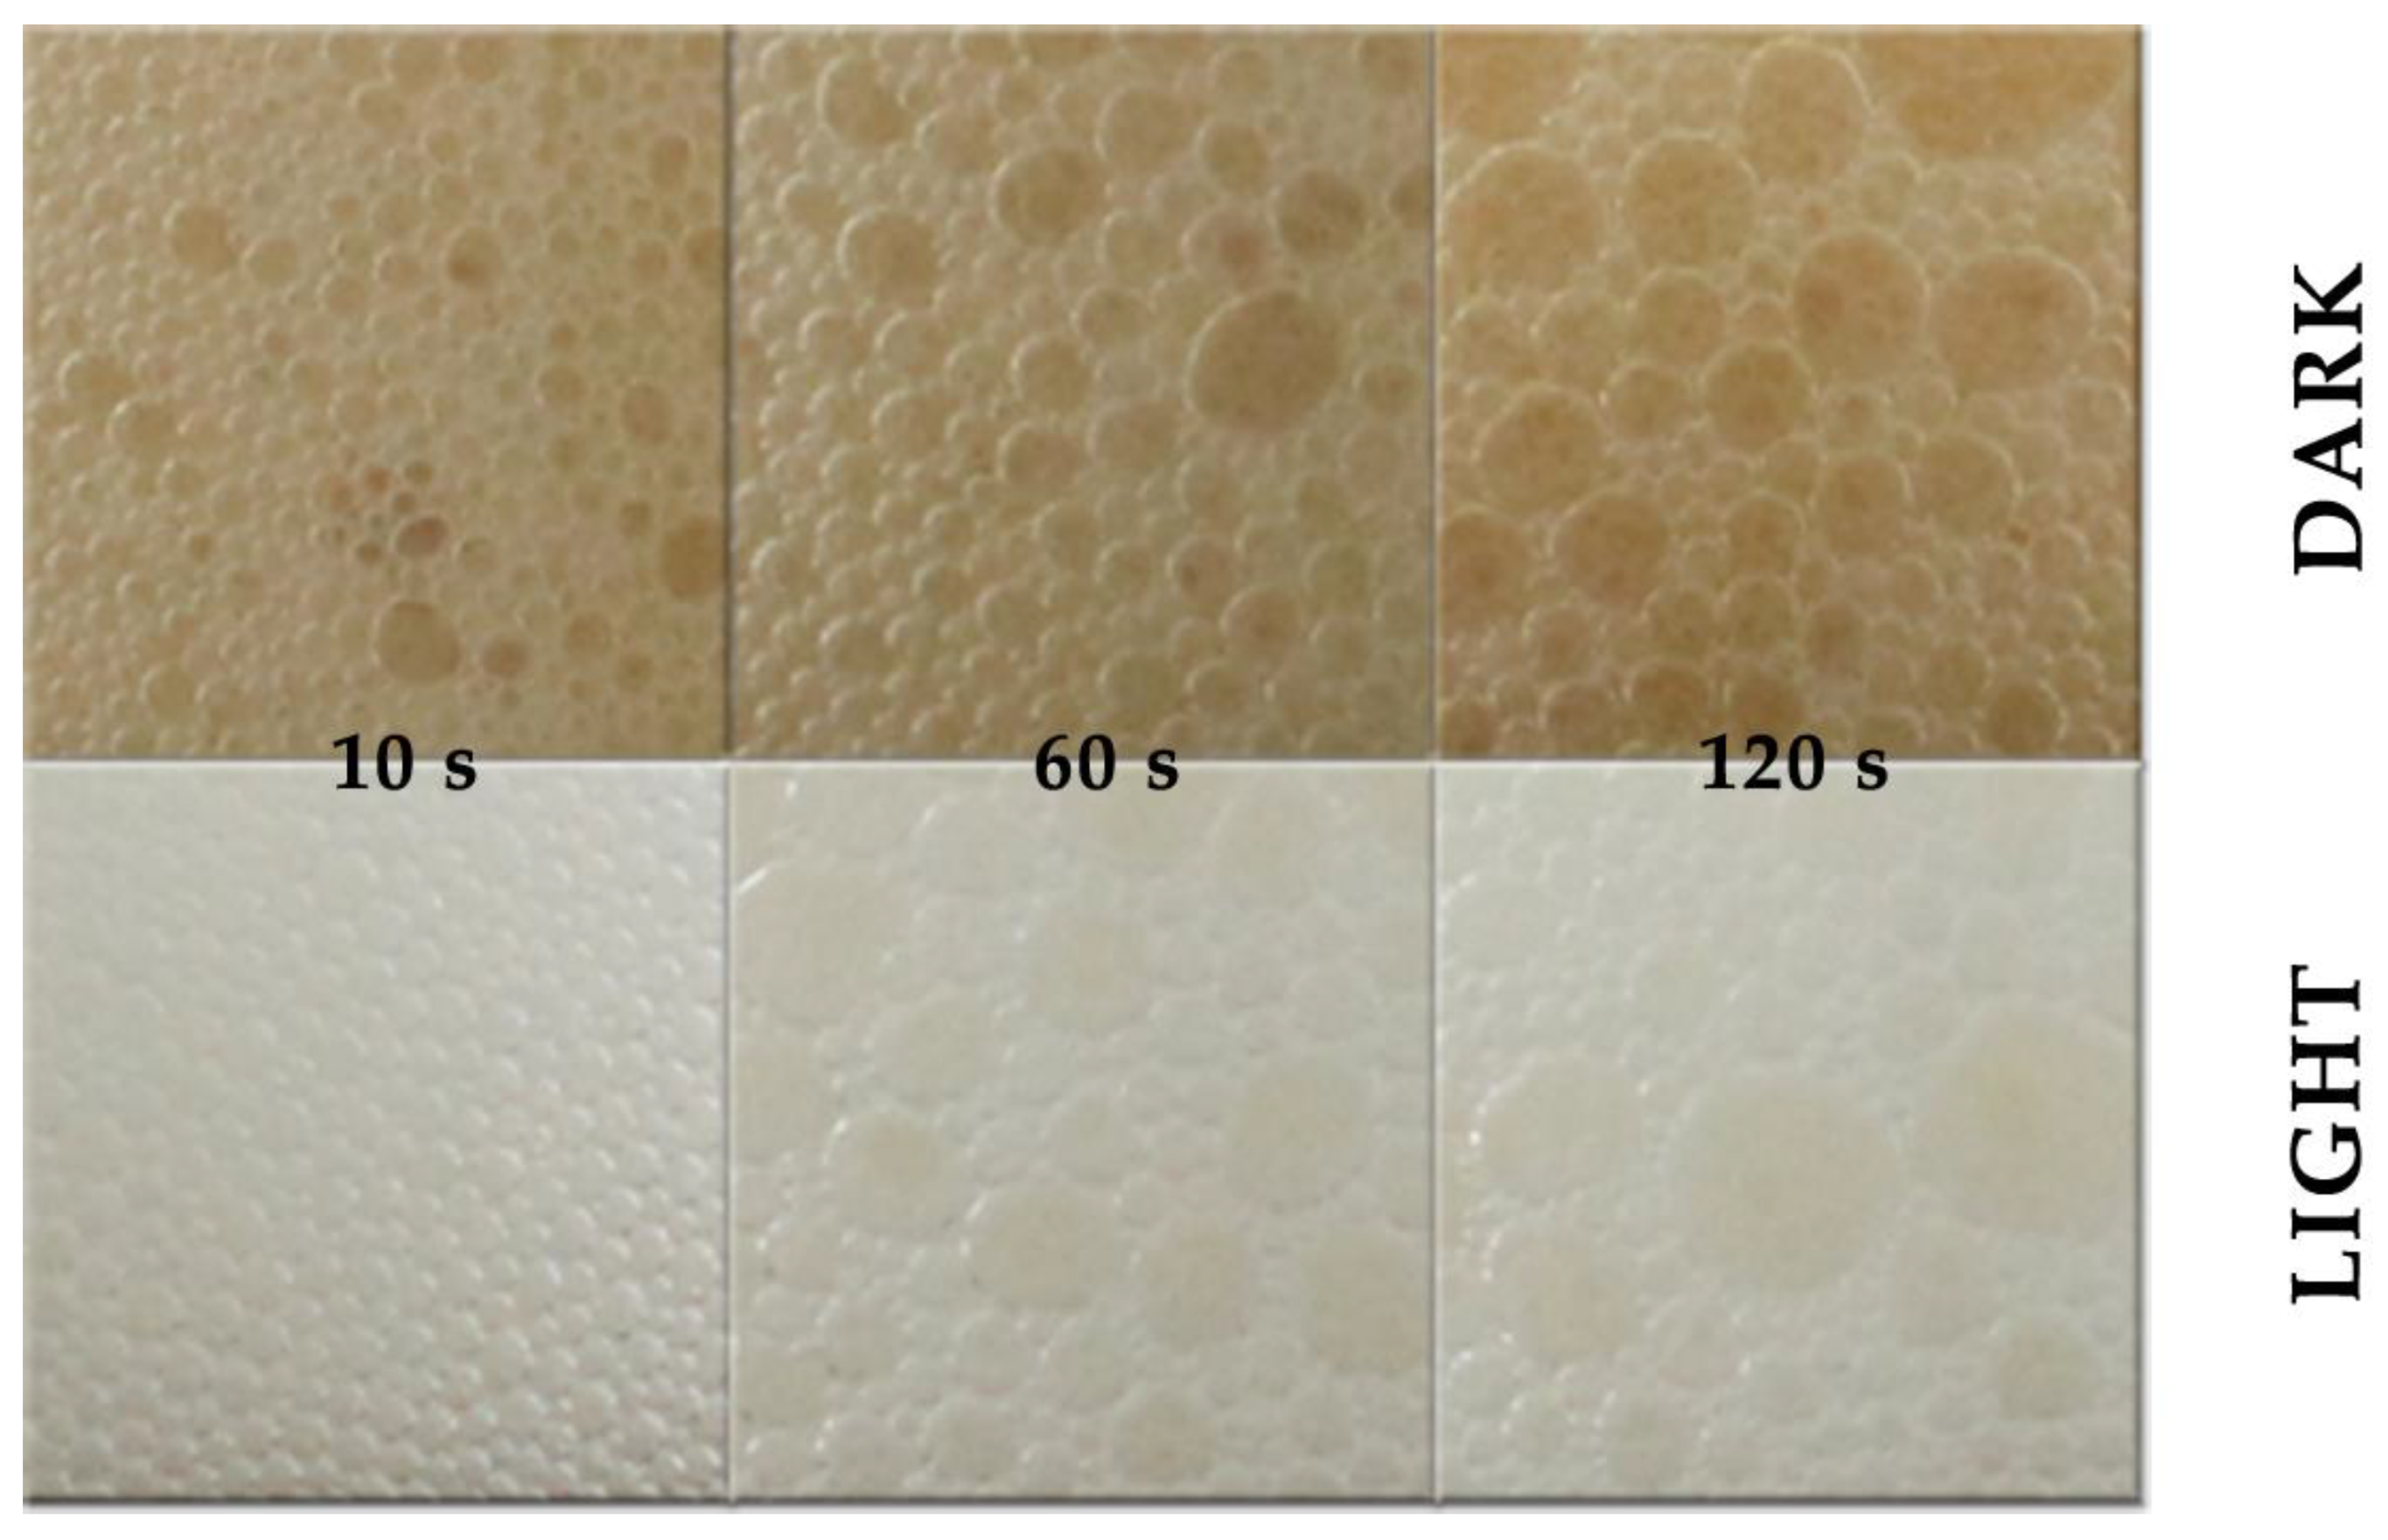
Sauerbrei et al. [67] conducted a computer-aided image processing research of redistribution and size of the foam bubbles during the beer foam decay. They used CCD camera, diffuse coaxial illumination to record photographs of the foam collapse, and foam bubble structure over time (5 s interval). The use of the ultrasonic device accomplished foaming. They have successfully implemented image analyses to measure the foam bubble size and area of the liquid fraction in the foam. Immediately after foaming bubbles were very small and uniformly distributed. Over time, coalescence occurs due to rupture of the bubble surface and some of the bubbles merge, forming larger bubbles (Figure 14). Remaining smaller bubbles fill the remaining space between the larger bubbles. The authors have compared the resulting pattern to a known mathematical structure called the Apollonian gasket. They also concluded that beer foam does not follow simple exponential decay but more complex higher order kinetics.
Cimini et al. [68] presented an inexpensive, automated and flexible image analysis method instead of the standard foam head retention method (developed by Rudin [69]). The standard Rudin’s method is improved by using three different systems for automatic data collection: tracking software for mouse movement; Accurate Image Analysis system (AIA) and low-cost image analysis (LCIA) system. The main difference between AIA system and LCIA system is that AIA used CCD camera and script written in MATLAB, while LCIA system used a Raspberry Pi single-board computer and a camera module. Authors reported that the LCIA system could be successfully used for analyzing beer foam attributes, such as the number of bubbles in the beer, their distribution, diameter and size.
7. Conclusions
The computer vision system (CVS) represents an efficient and non-destructive inspection technique for evaluating the external attributes of food products. It is an effective alternative to human vision, enabling rapid and objective analyses of food quality properties. Lately, digital image analysis is increasingly used in the study of various beer quality parameters (color, bubble size and distribution, foam stability, etc.). The strongest arguments for deploying CVS in evaluating external quality attributes of beer are the reliability and reproducibility of the obtained results. Although more and more progress is being made on the development of image analysis devices, there is still no available equipment that will simultaneously cover the determination of all quality features, due to the complexity and broad spectrum of beer quality parameters. Despite the fact that CVS is, in any case more, precise than visual methods, algorithms used for image representation and interpretation may be the source of the errors, resulting in the improper extraction and analysis of the obtained data. Therefore, additional efforts must be made in the development of more sophisticated equipment and algorithms that will further enhance measuring precision. One way of improving algorithms is the use of the information collected with the chemometric methods, using a wide set of various statistical tools which are capable of providing useful information by the analysis and modeling large quantities of data.
Author Contributions
Conceptualization, J.L., K.M. (Kristina Mastanjević) and M.J.; Investigation, J.L., K.M. (Kristina Mastanjević), K.M. (Krešimir Mastanjević), G.N. and M.J.; Writing—Original Draft Preparation, J.L., K.M. (Kristina Mastanjević) and M.J.; Writing—Review & Editing, J.L., K.M. (Kristina Mastanjević), K.M. (Krešimir Mastanjević), G.N. and M.J.; Visualization, J.L. and M.J.; Supervision, J.L.
Funding
This research received no external funding.
Conflicts of Interest
The authors declare no conflict of interest. All images shown in this paper are the result of unpublished research of authors of this review paper.
References
- Mastanjević, K.; Krstanović, V.; Lukinac, J.; Jukić, M.; Lučan, M.; Mastanjević, K. Craft brewing—Is it really about the sensory revolution? Kvas. Prum. 2019, 65, 13–16. [Google Scholar] [CrossRef]
- Gonzalez-Viejo, C.; Fuentes, S.; Li, G.J.; Collmann, R.; Conde, B.; Torrico, D. Development of a robotic pourer constructed with ubiquitous materials, open hardware and sensors to assess beer foam quality using computer vision and pattern recognition algorithms: RoboBEER. Food Res. Int. 2016, 89, 504–513. [Google Scholar] [CrossRef] [PubMed]
- Baert, J.J.; De Clippeleer, J.; Hughes, P.S.; De Cooman, L.; Aerts, G. On the origin of free and bound staling aldehydes in beer. J. Agric. Food Chem. 2012, 60, 11449–11472. [Google Scholar] [CrossRef] [PubMed]
- Cooper, D.J.; Husband, F.A.; Mills, E.N.C.; Wilde, P.J. Role of beer lipid-binding proteins in preventing lipid destabilization of foam. J. Agric. Food Chem. 2002, 50, 7645–7650. [Google Scholar] [CrossRef] [PubMed]
- Ebienfa, P.; Grudanov, V.; Ermakov, A.; Pozdniakov, V. Improving the process of roasting malt with intensive stirring machine. Ukr. Food J. 2015, 4, 95–108. [Google Scholar]
- Bellido-Milla, D.; Moreno-Perez, J.M.; Hernández-Artiga, M.P. Differentiation and classification of beers with flame atomic spectrometry and molecular absorption spectrometry and sample preparation assisted by microwaves. Spectrochim. Acta Part B 2000, 55, 855–864. [Google Scholar] [CrossRef]
- Duarte, I.F.; Barros, A.; Almeida, C.; Spraul, M.; Gil, A.M. Multivariate analysis of NMR and FTIR data as a potential tool for the quality control of beer. J. Agric. Food Chem. 2004, 52, 1031–1038. [Google Scholar] [CrossRef]
- Lachenmeier, D.W.; Frank, W.; Humpfer, E.; Schäfer, H.; Keller, S.; Mörtter, M. Quality control of beer using high-resolution nuclear magnetic resonance spectroscopy and multivariate analysis. Eur. Food Res. Technol. 2005, 220, 215–221. [Google Scholar] [CrossRef]
- Lachenmeier, D.W. Rapid quality control of spirit drinks and beer using multivariate data analysis of Fourier transform infrared spectra. Food Chem. 2007, 101, 825–832. [Google Scholar] [CrossRef]
- Patel, K.K.; Kar, A.; Jha, S.N.; Khan, M.A. Machine vision system: A tool for quality inspection of food and agricultural products. J. Food Sci. Technol. 2012, 49, 123–141. [Google Scholar] [CrossRef]
- Lukinac, J.; Jukić, M.; Mastanjević, K.; Lučan, M. Application of computer vision and image analysis method in cheese-quality evaluation: A review. Ukr. Food J. 2018, 7, 192–214. [Google Scholar] [CrossRef]
- Wu, D.; Sun, D.W. Food colour measurement using computer vision. In Instrumental Assessment of Food Sensory Quality, 1st ed.; Kilcast, D., Ed.; Woodhead Publishing Ltd.: Cambridge, UK, 2013; pp. 165–189. [Google Scholar]
- Abdullah, M.Z. Image Acquisition System. In Computer Vision Technology for Food Quality Evaluation, 2nd ed.; Sun, D.-W., Ed.; Academic Press: San Diego, CA, USA, 2016; pp. 3–43. [Google Scholar]
- Brosnan, T.; Sun, D.-W. Improving quality inspection of food products by computer vision—A review. J. Food Eng. 2004, 61, 3–16. [Google Scholar] [CrossRef]
- Sun, D.-W. Computer Vision Technology for Food Quality Evaluation, 1st ed.; Sun, D.-W., Ed.; Academic Press: San Diego, CA, USA, 2008. [Google Scholar]
- Davies, E.R. Computer and Machine Vision, Theory, Algorithms, Practicalities, 4th ed.; Mirmehdi, M., Ed.; Academic Press: Oxford, UK, 2012. [Google Scholar]
- Wang, H.-H.; Sun, D.-W. Correlation between cheese meltability determined with a computer vision method and with Arnott and Schreiber. J. Food Sci. 2002, 67, 745–749. [Google Scholar] [CrossRef]
- Moeslund, T.B. Image acquisition. In Introduction to Video and Image Processing. Building Real Systems and Applications, 1st ed.; Moeslund, T.B., Ed.; Springer London Ltd.: London, UK, 2012; pp. 7–24. [Google Scholar]
- Gunasekaran, S. Computer vision technology for food quality assurance. Trends Food Sci. Technol. 1996, 7, 245–256. [Google Scholar] [CrossRef]
- Batchelor, B.G. Machine Vision Handbook, 1st ed.; Batchelor, B.G., Ed.; Springer London Ltd.: London, UK, 2012. [Google Scholar]
- Pedreschi, F.; Leon, J.; Mery, D.; Moyano, P. Development of a computer vision system to measure the color of potato chips. Food Res. Int. 2006, 39, 1092–1098. [Google Scholar] [CrossRef]
- Zuech, N. Machine Vision and Lighting. Machine Vision on Line. 2004. Available online: https://www.visiononline.org/vision-resources-details.cfm/vision-resources/Machine-Vision-and-Lighting/content_id/1269 (accessed on 25 January 2019).
- Abdullah, M.Z.; Abdul-Aziz, S.; Dos-Mohamed, A.M. Quality inspection of bakery products using colour-based machine vision system. J. Food Qual. 2000, 23, 39–50. [Google Scholar] [CrossRef]
- Choudhury, A.K.R. Colour measurement instruments. In Principles of Colour and Appearance Volume 1: Object Appearance, Colour Perception and Instrumental Measurement, 1st ed.; Choudhury, A.K.R., Ed.; Woodhead Publishing: Cambridge, UK, 2014; pp. 221–269. [Google Scholar]
- Sliwinska, M.; Wisniewska, P.; Dymerski, T.; Namiesnik, J.; Wardenki, W. Food analysis using artificial senses. J. Agric. Food Chem. 2014, 62, 1423–1448. [Google Scholar] [CrossRef] [PubMed]
- Waltham, N. CCD and CMOS sensors. In Observing Photons in Space. A Guide to Experimental Space Astronomy, 2nd ed.; Huber, M.C.E., Pauluhn, A., Culhane, J.L., Timothy, J.G., Wilhelm, K., Zehnder, A., Eds.; Springer: New York, NY, USA, 2013; pp. 443–453. [Google Scholar]
- Zhang, B.; Huang, W.; Li, J.; Zhao, C.; Fan, S.; Wu, J.; Liu, C. Principles, developments and applications of computer vision for external quality inspection of fruits and vegetables, A review. Food Res. Int. 2014, 62, 326–343. [Google Scholar] [CrossRef]
- Sun, D.W. Inspecting pizza topping percentage and distribution by a computer vision method. J. Food Eng. 2000, 44, 245–249. [Google Scholar] [CrossRef]
- Sun, D.-W. Computer vision-an objective, rapid and non-contact quality evaluation tool for the food industry. J. Food Eng. 2004, 61, 1–2. [Google Scholar] [CrossRef]
- Ying, Y.; Jing, H.; Tao, Y.; Zhang, N. Detecting stem and shape of pears using fourier transformation and an artificial neural network. Trans. ASAE 2003, 46, 157–162. [Google Scholar] [CrossRef]
- Hughes, P.S.; Baxter, E.D. Beer: Quality, Safety and Nutritional Aspects; Righelato, R., Ed.; Royal Society of Chemistry: Cambridge, UK, 2001. [Google Scholar]
- De Schutter, D.P.; Saison, D.; Delvaux, F.; Derdelinckx, G.; Delvaux, F.R. The chemistry of aging beer. In Beer in Health and Disease Prevention, 1st ed.; Preedy, V.R., Ed.; Academic Press Inc.: New York, NY, USA, 2008; pp. 375–388. [Google Scholar]
- Lewis, M.J.; Bamforth, C.W. Essays in Brewing Science, 1st ed.; Lewis, M.J., Bamforth, C.W., Eds.; Springer: New York, NY, USA, 2006; pp. 20–27. [Google Scholar]
- Pozdrik, R.; Roddick, F.A.; Rogers, P.J.; Nguyen, T. Spectrophotometric method for exploring 3-methyl-2-butene-1-thiol (MBT) Formation in Lager. J. Agric. Food Chem. 2006, 5, 6123–6129. [Google Scholar] [CrossRef]
- Nursten, H.E. The Maillard Reaction, Chemistry, Biochemistry and Implication, 1st ed.; Baynes, J.W., Ed.; The Royal Society of Chemistry: Cambridge, UK, 2005. [Google Scholar]
- Park, C.W.; Kang, K.O.; Kim, W.J. Effects of reaction conditions for improvement of caramelization rate. Korean J. Food Sci. Technol. 1998, 30, 983–987. [Google Scholar]
- Committee of the EBC. Analytica EBC; Schweizer Brauerei-Rundschau: Zurich, Switzerland, 1975. [Google Scholar]
- Smedley, S.M. Colour determination of beer using tristimulus values. J. Inst. Brew. 1992, 98, 497–504. [Google Scholar] [CrossRef]
- De Lange, A.J. Color. In Brewing Materials and Processes. A Practical Approach to Beer Excellence, 1st ed.; Bamforth, C.W., Ed.; Academic Press Elsevier: London, UK, 2016; pp. 199–249. [Google Scholar]
- De Lange, A.J. The standard reference method of beer color specification as the basis for a new method of beer color reporting. J. Am. Soc. Brew. Chem. 2008, 66, 143–150. [Google Scholar]
- Davies, N.L. Perception of color and flavor in malt. MBAA Tech. Q. 2010, 474, 12–16. [Google Scholar] [CrossRef]
- Yagiz, Y.; Balaban, M.O.; Kristinsson, H.G.; Welt, B.A.; Marshall, M.R. Comparison of Minolta colorimeter and machine vision system in measuring colour of irradiated Atlantic salmon. J. Sci. Food Agric. 2009, 89, 728–730. [Google Scholar] [CrossRef]
- Leon, K.; Mery, D.; Pedreschi, F.; Leon, J. Color measurement in L*a*b* units from RGB digital images. Food Res. Int. 2006, 39, 1084–1091. [Google Scholar] [CrossRef]
- Silva, T.C.O.; Godinho, M.S.; De Oliveira, A.E. Identification of pale lager beers via image analysis. Lat. Am. Appl. Res. 2011, 41, 141–145. [Google Scholar]
- Nikolova, K.T.; Gabrova, R.; Boyadzhiev, D.; Pisanova, E.S.; Ruseva, J.; Yanakiev, D. Classification of different types of beer according to their colour characteristics. J. Phys. Conf. Ser. 2017, 794, 1742–6596. [Google Scholar] [CrossRef]
- Mastanjević, K.; Krstanović, V.; Lukinac, J.; Jukić, M.; Vulin, Z.; Mastanjević, K. Beer–The Importance of colloidal stability (non-biological haze). Fermentation 2018, 4, 91. [Google Scholar] [CrossRef]
- Bamforth, C.W. The relative significance of physics and chemistry for beer foam excellence: Theory and practice. J. Inst. Brew. 2004, 110, 259–266. [Google Scholar] [CrossRef]
- Bamforth, C.W. The foaming properties of beer. J. Inst. Brew. 1985, 91, 370–383. [Google Scholar] [CrossRef]
- Saxena, S.C.; Patel, D.; Smith, D.N.; Ruether, J.A. An assessment of experimental techniques for the measurement of bubble size in a bubble slurry reactor as applied to indirect coal liquefaction. Chem. Eng. Commun. 1988, 63, 87–127. [Google Scholar] [CrossRef]
- Shafer, N.E.; Zare, R.N. Through a beer glass darkly. Phys. Today 1991, 44, 48–52. [Google Scholar] [CrossRef]
- Lubetkin, S.; Blackwell, B. The nucleation of bubbles in supersaturated solutions. J. Colliods Interface Sci. 1988, 26, 610–615. [Google Scholar] [CrossRef]
- Liger-Belair, G.; Marchal, R.; Robillard, B.; Vignes-Adler, M.; Maujean, A.; Jeandet, P. Study of effervescence in a glass of champagne: Frequencies of bubble formation, growth rates, and velocities of rising bubbles. Am. J. Enol. Vitic. 1999, 50, 317–323. [Google Scholar]
- Hepworth, N.J.; Hammond, J.R.M.; Varley, J. Novel application of computer vision to determine bubble size distributions in beer. J. Food Eng. 2004, 61, 119–124. [Google Scholar] [CrossRef]
- Hepworth, N.J.; Boyd, J.W.R.; Hammond, J.R.M.; Varley, J. Modelling the effect of liquid motion on bubble nucleation during beer dispense. Chem. Eng. Sci. 2003, 58, 4071–4084. [Google Scholar] [CrossRef]
- Hepworth, N.J.; Varley, J.; Hind, A. Characterizing gas bubble dispersions in beer. Food Bioprod. Process. 2001, 79, 13–20. [Google Scholar] [CrossRef]
- Zabulis, X.; Papara, M.; Chatziargyriou, A.; Karapantsios, T.D. Detection of densely dispersed spherical bubbles in digital images based on a template matching technique—Application to wet foams. Colloids Surf. A Physicochem. Eng. Asp. 2007, 309, 96–106. [Google Scholar] [CrossRef]
- Evans, D.E.; Bamforth, C.W. Beer foam: Achieving a suitable head. In Beer: A Quality Perspective, 1st ed.; Bamforth, C.W., Ed.; Academic Press: Burlington, NJ, USA, 2009; pp. 1–60. [Google Scholar]
- Asano, K.; Hashimoto, N. Isolation and characterization of foaming proteins of beer. J. Am. Soc. Brew. Chem. 1980, 38, 129–137. [Google Scholar] [CrossRef]
- Evans, D.E.; Sheehan, M.C. Do not be fobbed off, the substance of beer foam, a review. J. Am. Soc. Brew. Chem. 2002, 60, 47–57. [Google Scholar]
- Kunimune, T. Foam Enhancing Properties of Hop Bitter Acids and Propylene Glycol Alginate. Master’s Thesis, Oregon State University, Corvallis, OR, USA, 14 January 2007. [Google Scholar]
- Hao, J.L.Q.; Dong, J.; Yu, J.; Fan, W.; Chen, J. Identification of the major proteins in beer foam by mass spectometry following sodium dodecyl sulphatepolyacrylamide gel electrophoresis. J. Am. Soc. Brew. Chem. 2006, 64, 166–174. [Google Scholar]
- Evans, E.D.; Surrel, A.; Sheehly, M.; Stewart, D.C.; Robinson, L.H. Comparison of foam quality and the influence of hop alpha-acids and proteins using five foam analysis methods. J. Am. Soc. Brew. Chem. 2008, 66, 1–10. [Google Scholar]
- Constant, M. A practical method for characterizing poured beer foam. J. Am. Soc. Brew. Chem. 1992, 50, 37–47. [Google Scholar] [CrossRef]
- Yasui, K.; Yakoi, S.; Shigyo, T.; Tamaki, T.; Shinotsuka, K.A. Customer-orientated approach to the development of a visual and statistical foam analysis. J. Am. Soc. Brew. Chem. 1998, 56, 152–158. [Google Scholar]
- Wallin, C.E.; Di Pietro, M.B.; Schwarz, R.W.; Bamforth, C.W. A comparison of three methods for the assessment of foam stability of beer. J. Inst. Brew. 1992, 116, 78–80. [Google Scholar] [CrossRef]
- Kruss Application Report: Comparison of The Foam Behaviour of Different Types of Beer Independently of CO2 Content. (Kruss, AR275). Available online: https://www.kruss-scientific.com/fileadmin/user_upload/website/literature/kruss-ar275-en.pdf (accessed on 25 January 2019).
- Sauerbrei, S.; Haß, E.C.; Plath, P.J. The Apollonian decay of beer foam bubble size distribution and the lattices of young diagrams and their correlated mixing functions. Discret. Dyn. Nat. Soc. 2006, 2006, 79717. [Google Scholar] [CrossRef]
- Cimini, A.; Pallottino, F.; Menesatti, P.; Moresi, M. A low-cost image analysis system to upgrade the rudin beer foam head retention meter. Food Bioprocess. Technol. 2016, 9, 1587–1597. [Google Scholar] [CrossRef]
- Rudin, A.D. Measurement of the foam stability of beers. J. Inst. Brew. 1957, 63, 506–509. [Google Scholar] [CrossRef]
Figure 1.
Components of a computer vision system.

Figure 2.
Different types of effects that can occur when the object is illuminated.

Figure 3.
Direct lighting techniques—point and ring lighting.

Figure 4.
Diffuse lighting techniques—flat diffuse and dome shaped illumination.

Figure 5.
Coaxial lighting techniques with diffuser and angular lighting techniques.

Figure 6.
Lateral lighting techniques.

Figure 7.
Shallowly lighting techniques—Dark field lighting.

Figure 8.
Backlighting and collimated lighting techniques.

Figure 9.
Basic parameters of an Imaging System.

Figure 10.
Steps in digital image analysis.

Figure 11.
European Brewery Convention (EBC) and Standard Reference Method (SRM) color values of various beer types.
Figure 11.
European Brewery Convention (EBC) and Standard Reference Method (SRM) color values of various beer types.

Figure 12.
Bubble size determination in beer using digital image analysis method.

Figure 13.
Image analysis of beer foam stability (original images and images with applied threshold segmentation; and graphical parameters presentation of the beer foam stability).
Figure 13.
Image analysis of beer foam stability (original images and images with applied threshold segmentation; and graphical parameters presentation of the beer foam stability).

Figure 14.
Different bubble size and distribution in the beer foam (10, 60 and 120 s after pouring).
Figure 14.
Different bubble size and distribution in the beer foam (10, 60 and 120 s after pouring).


Table 1.
Types of cameras in CVS system.
| Cameras Categorization | Application | Features | ||
|---|---|---|---|---|
| Cameras Type According to the Image Processing Demands | Network cameras (Internet Protocol camera, IP) | Surveillance | Record a video Day/night modes Special infrared filters Compressed captured photos Simultaneously connected to a large number of users via the Internet | |
| Industrial cameras (Machine vision) | Area scan cameras | Application in different purposes and industries (packaging system management; traffic control system) | Record video or photo Raw photo (no loosing data by compression) | |
| Line scan cameras | ||||
| Color | Color cameras | intelligent traffic systems | Color image | |
| Monochrome cameras | Black and white image | |||
| Sensor Types | CMOS sensor | apply in cases where high speed is required | strong value for the performance high frame rates high resolution low power consumption | |
| CCD sensor | Those sensors are light sensitive, provide image of high quality, and applied in cases where in no need of high speed | high frame rates without deterioration in image quality | ||
| Shutter Technique | Global shutter | Capturing fast moving object | allow the light to strike the entire sensor surface all at once | |
| Rolling shutter | Capturing a stationary object | exposes the image line-by-line | ||
| Frame Rate (fps) | Slow sensor | For slow moving or stationary object which require low frame rates (medicine—microscopic inspection) | Small frame rate | |
| Quick sensor | For fast moving application which require high frame rates (inspection of printed images or labels) | High frame rate | ||
| Resolution | Camera with high resolution | For capturing precision image with large number of details | ||
| Camera with low resolution | For capturing image where details are not the main focus (moving object) | |||
© 2019 by the authors. Licensee MDPI, Basel, Switzerland. This article is an open access article distributed under the terms and conditions of the Creative Commons Attribution (CC BY) license (http://creativecommons.org/licenses/by/4.0/).
Share and Cite
MDPI and ACS Style
Lukinac, J.; Mastanjević, K.; Mastanjević, K.; Nakov, G.; Jukić, M. Computer Vision Method in Beer Quality Evaluation—A Review. Beverages 2019, 5, 38. https://0-doi-org.brum.beds.ac.uk/10.3390/beverages5020038
AMA Style
Lukinac J, Mastanjević K, Mastanjević K, Nakov G, Jukić M. Computer Vision Method in Beer Quality Evaluation—A Review. Beverages. 2019; 5(2):38. https://0-doi-org.brum.beds.ac.uk/10.3390/beverages5020038
Chicago/Turabian StyleLukinac, Jasmina, Kristina Mastanjević, Krešimir Mastanjević, Gjore Nakov, and Marko Jukić. 2019. "Computer Vision Method in Beer Quality Evaluation—A Review" Beverages 5, no. 2: 38. https://0-doi-org.brum.beds.ac.uk/10.3390/beverages5020038
Note that from the first issue of 2016, this journal uses article numbers instead of page numbers. See further details here.