The Effect of Sonication on Bubble Size and Sensory Perception of Carbonated Water to Improve Quality and Consumer Acceptability


Abstract
:1. Introduction
2. Materials and Methods
2.1. Samples Description
2.2. Physicochemical Analysis
2.3. Sensory Evaluation
2.4. Statistical Analysis
3. Results
3.1. Physicochemical Properties of Carbonated Water
3.2. Sensory Evaluation of Carbonated Water
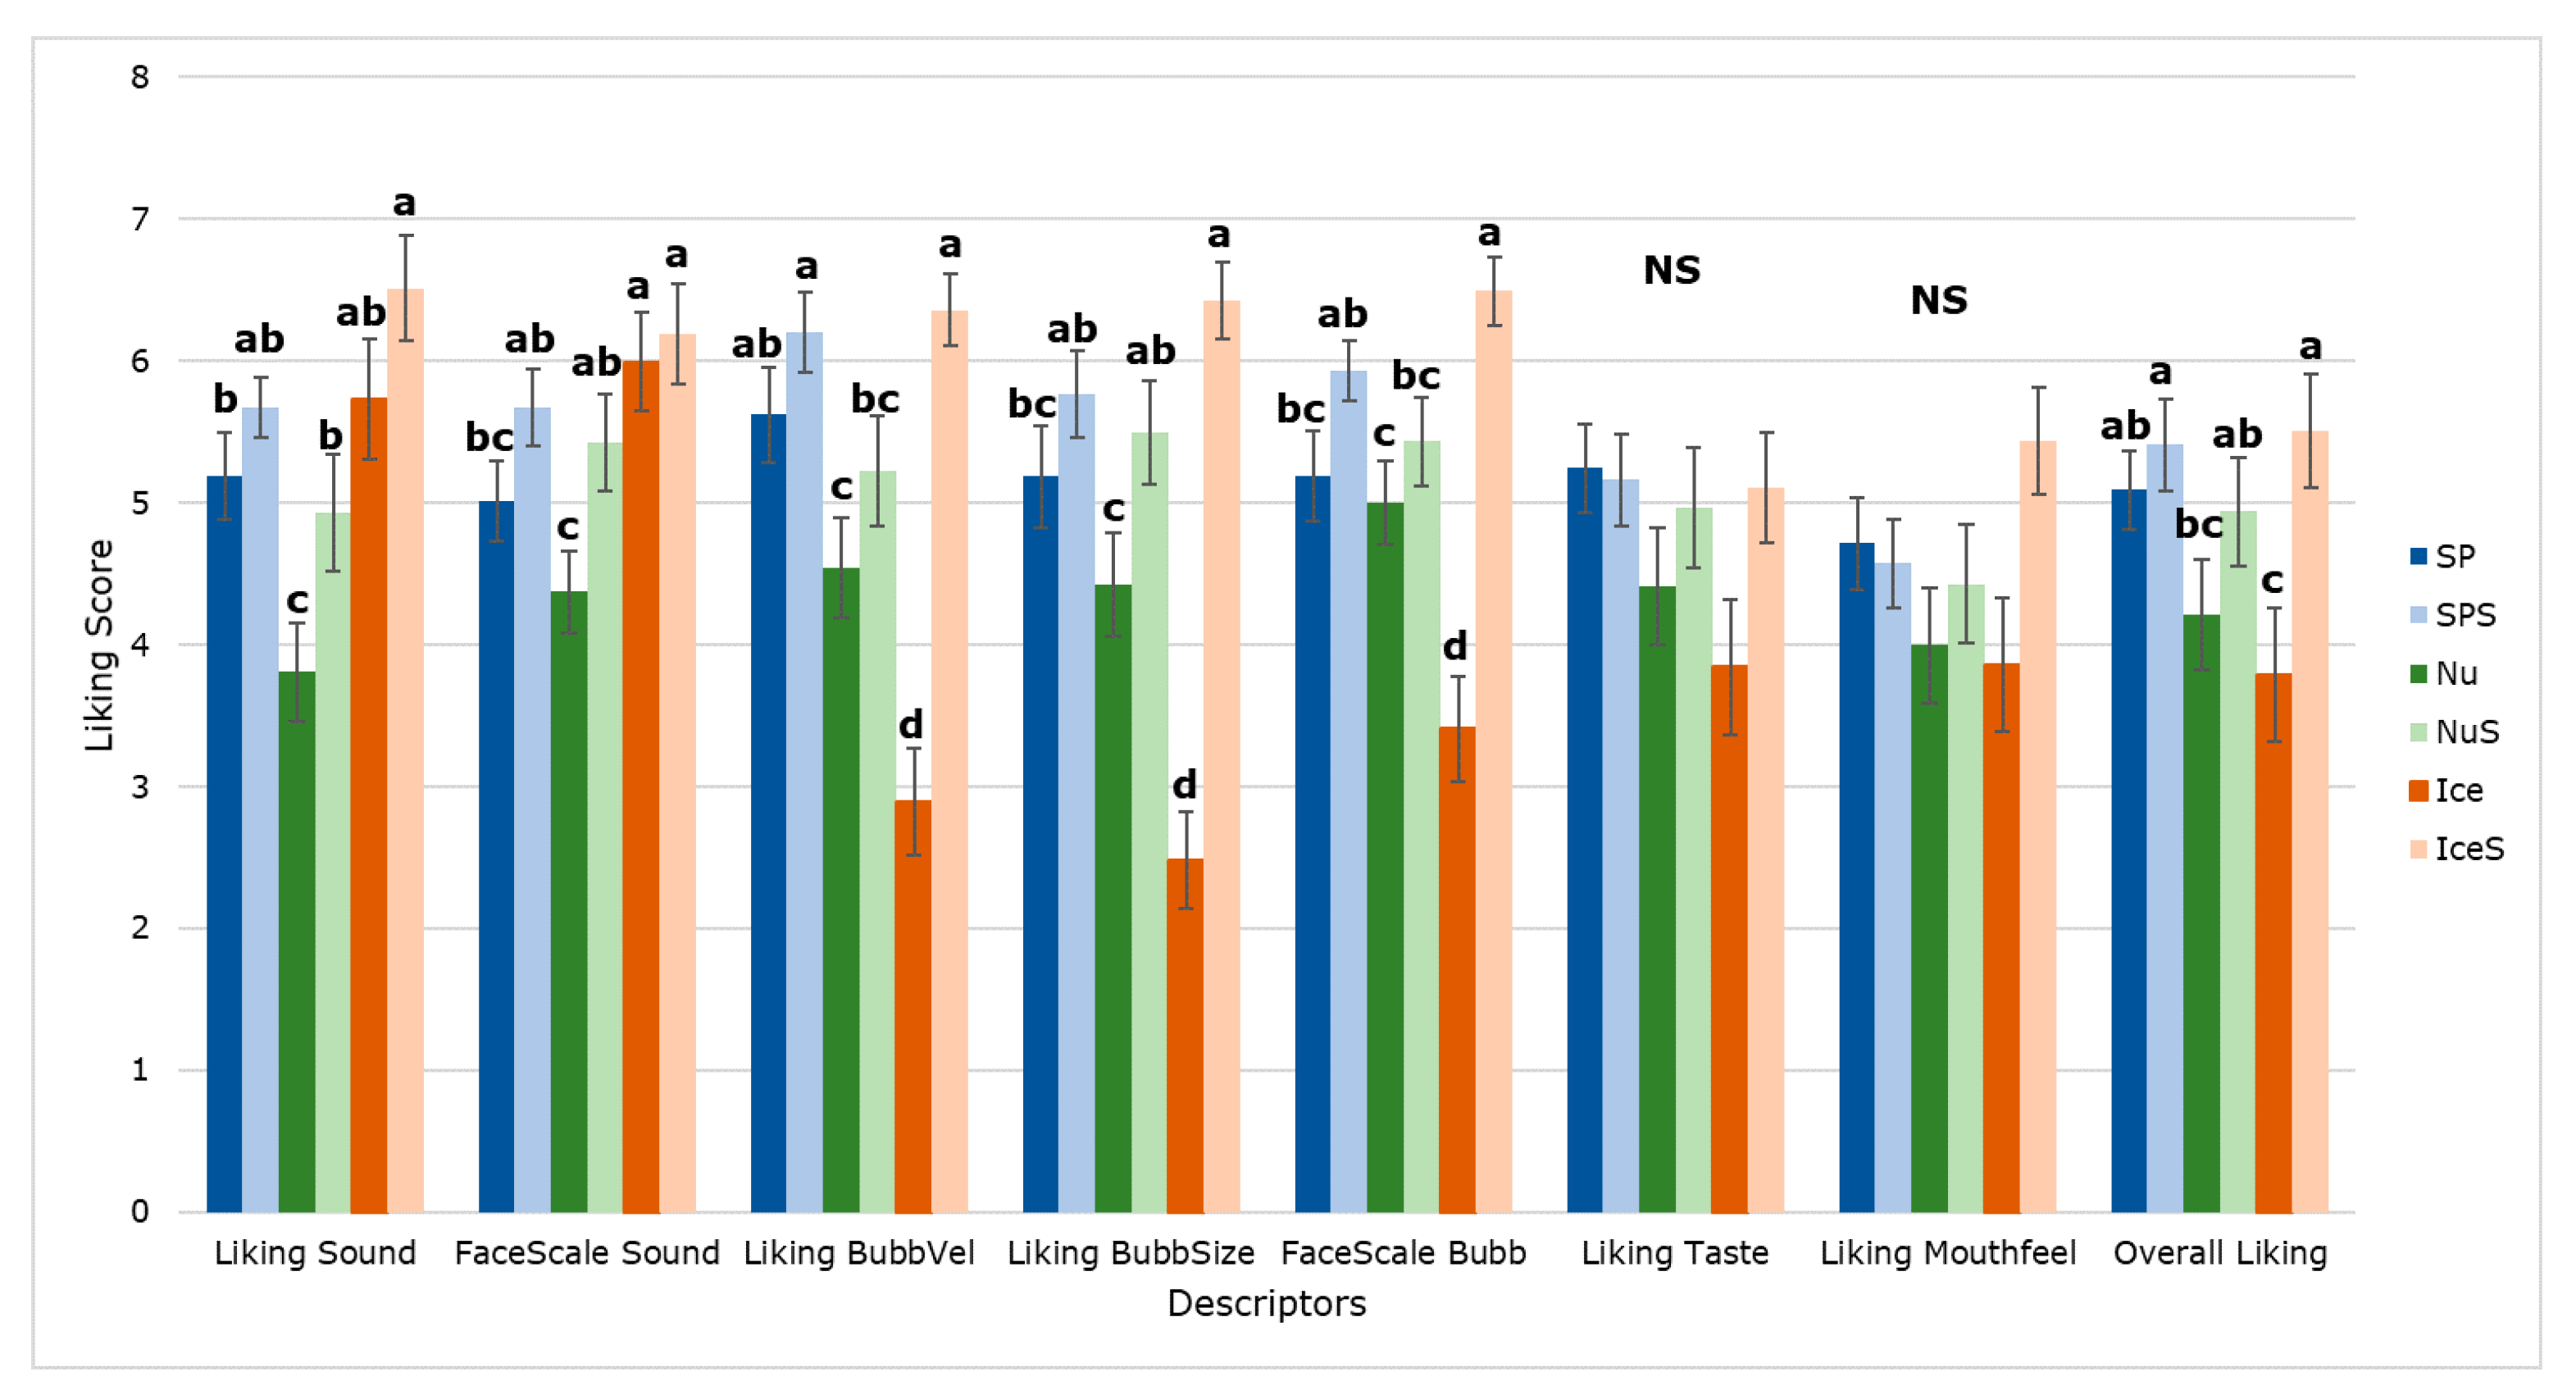
3.2.1. Self-Reported Responses of Consumer Acceptability of Carbonated Water
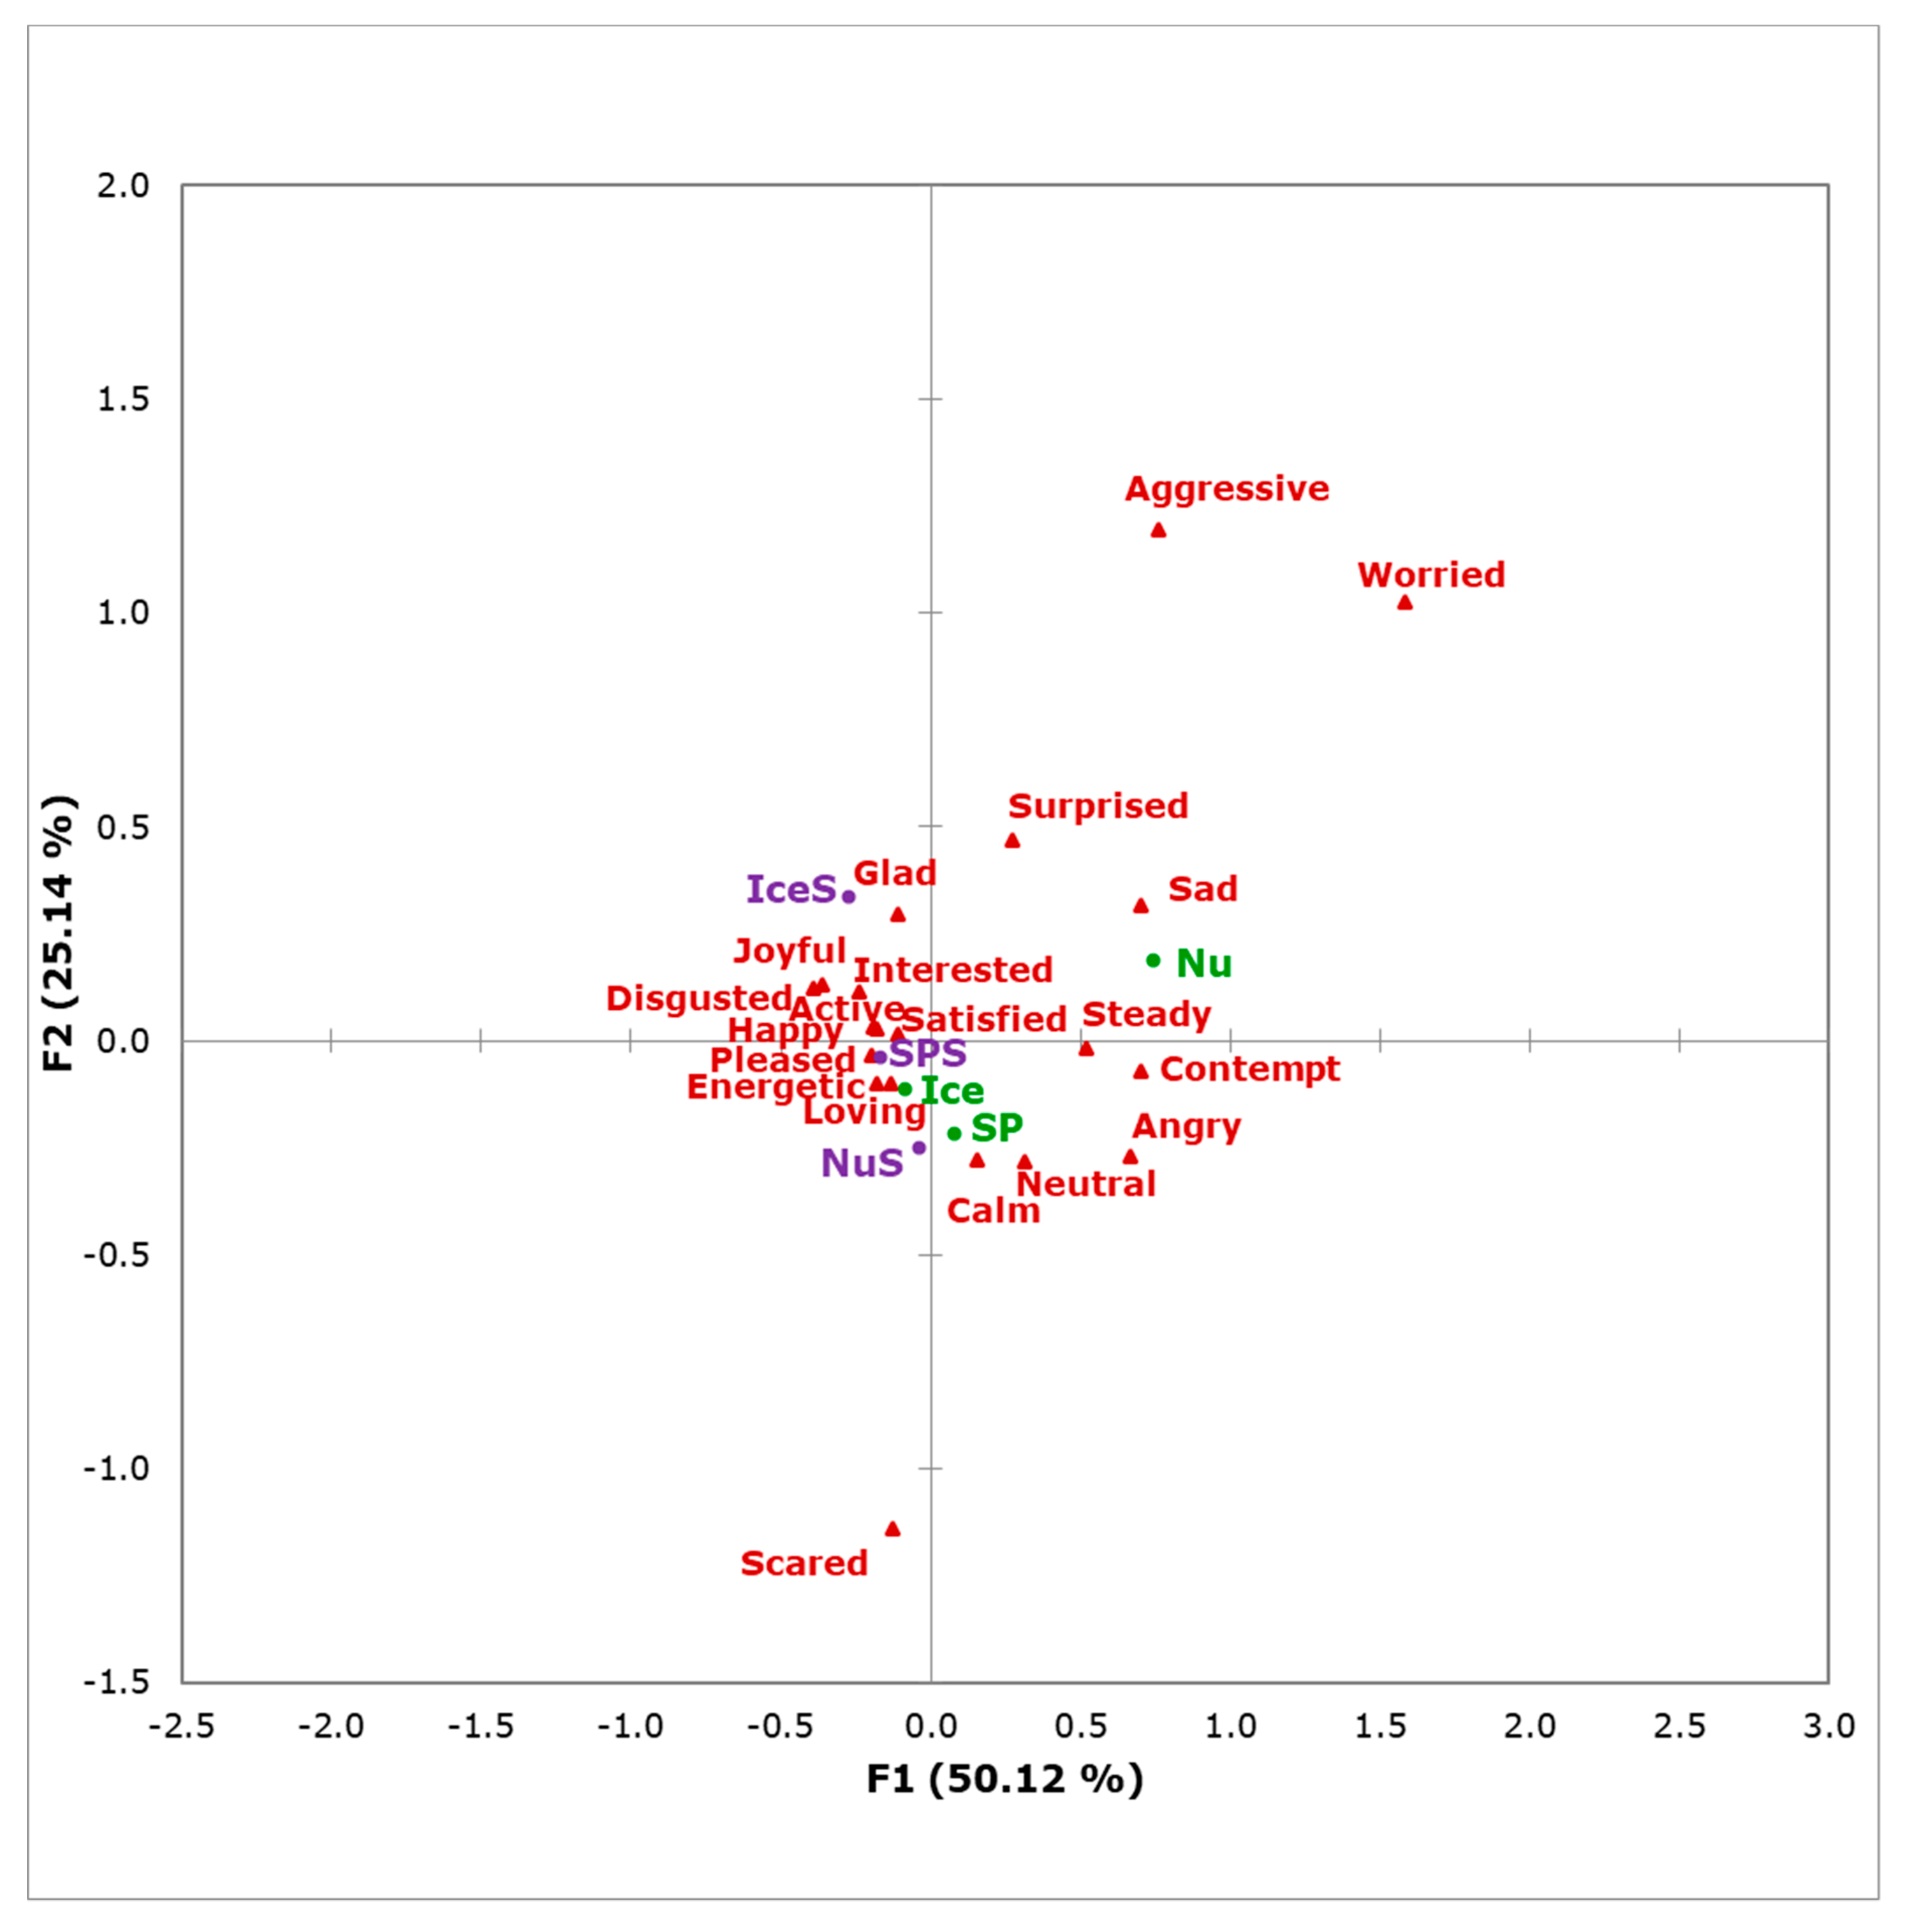
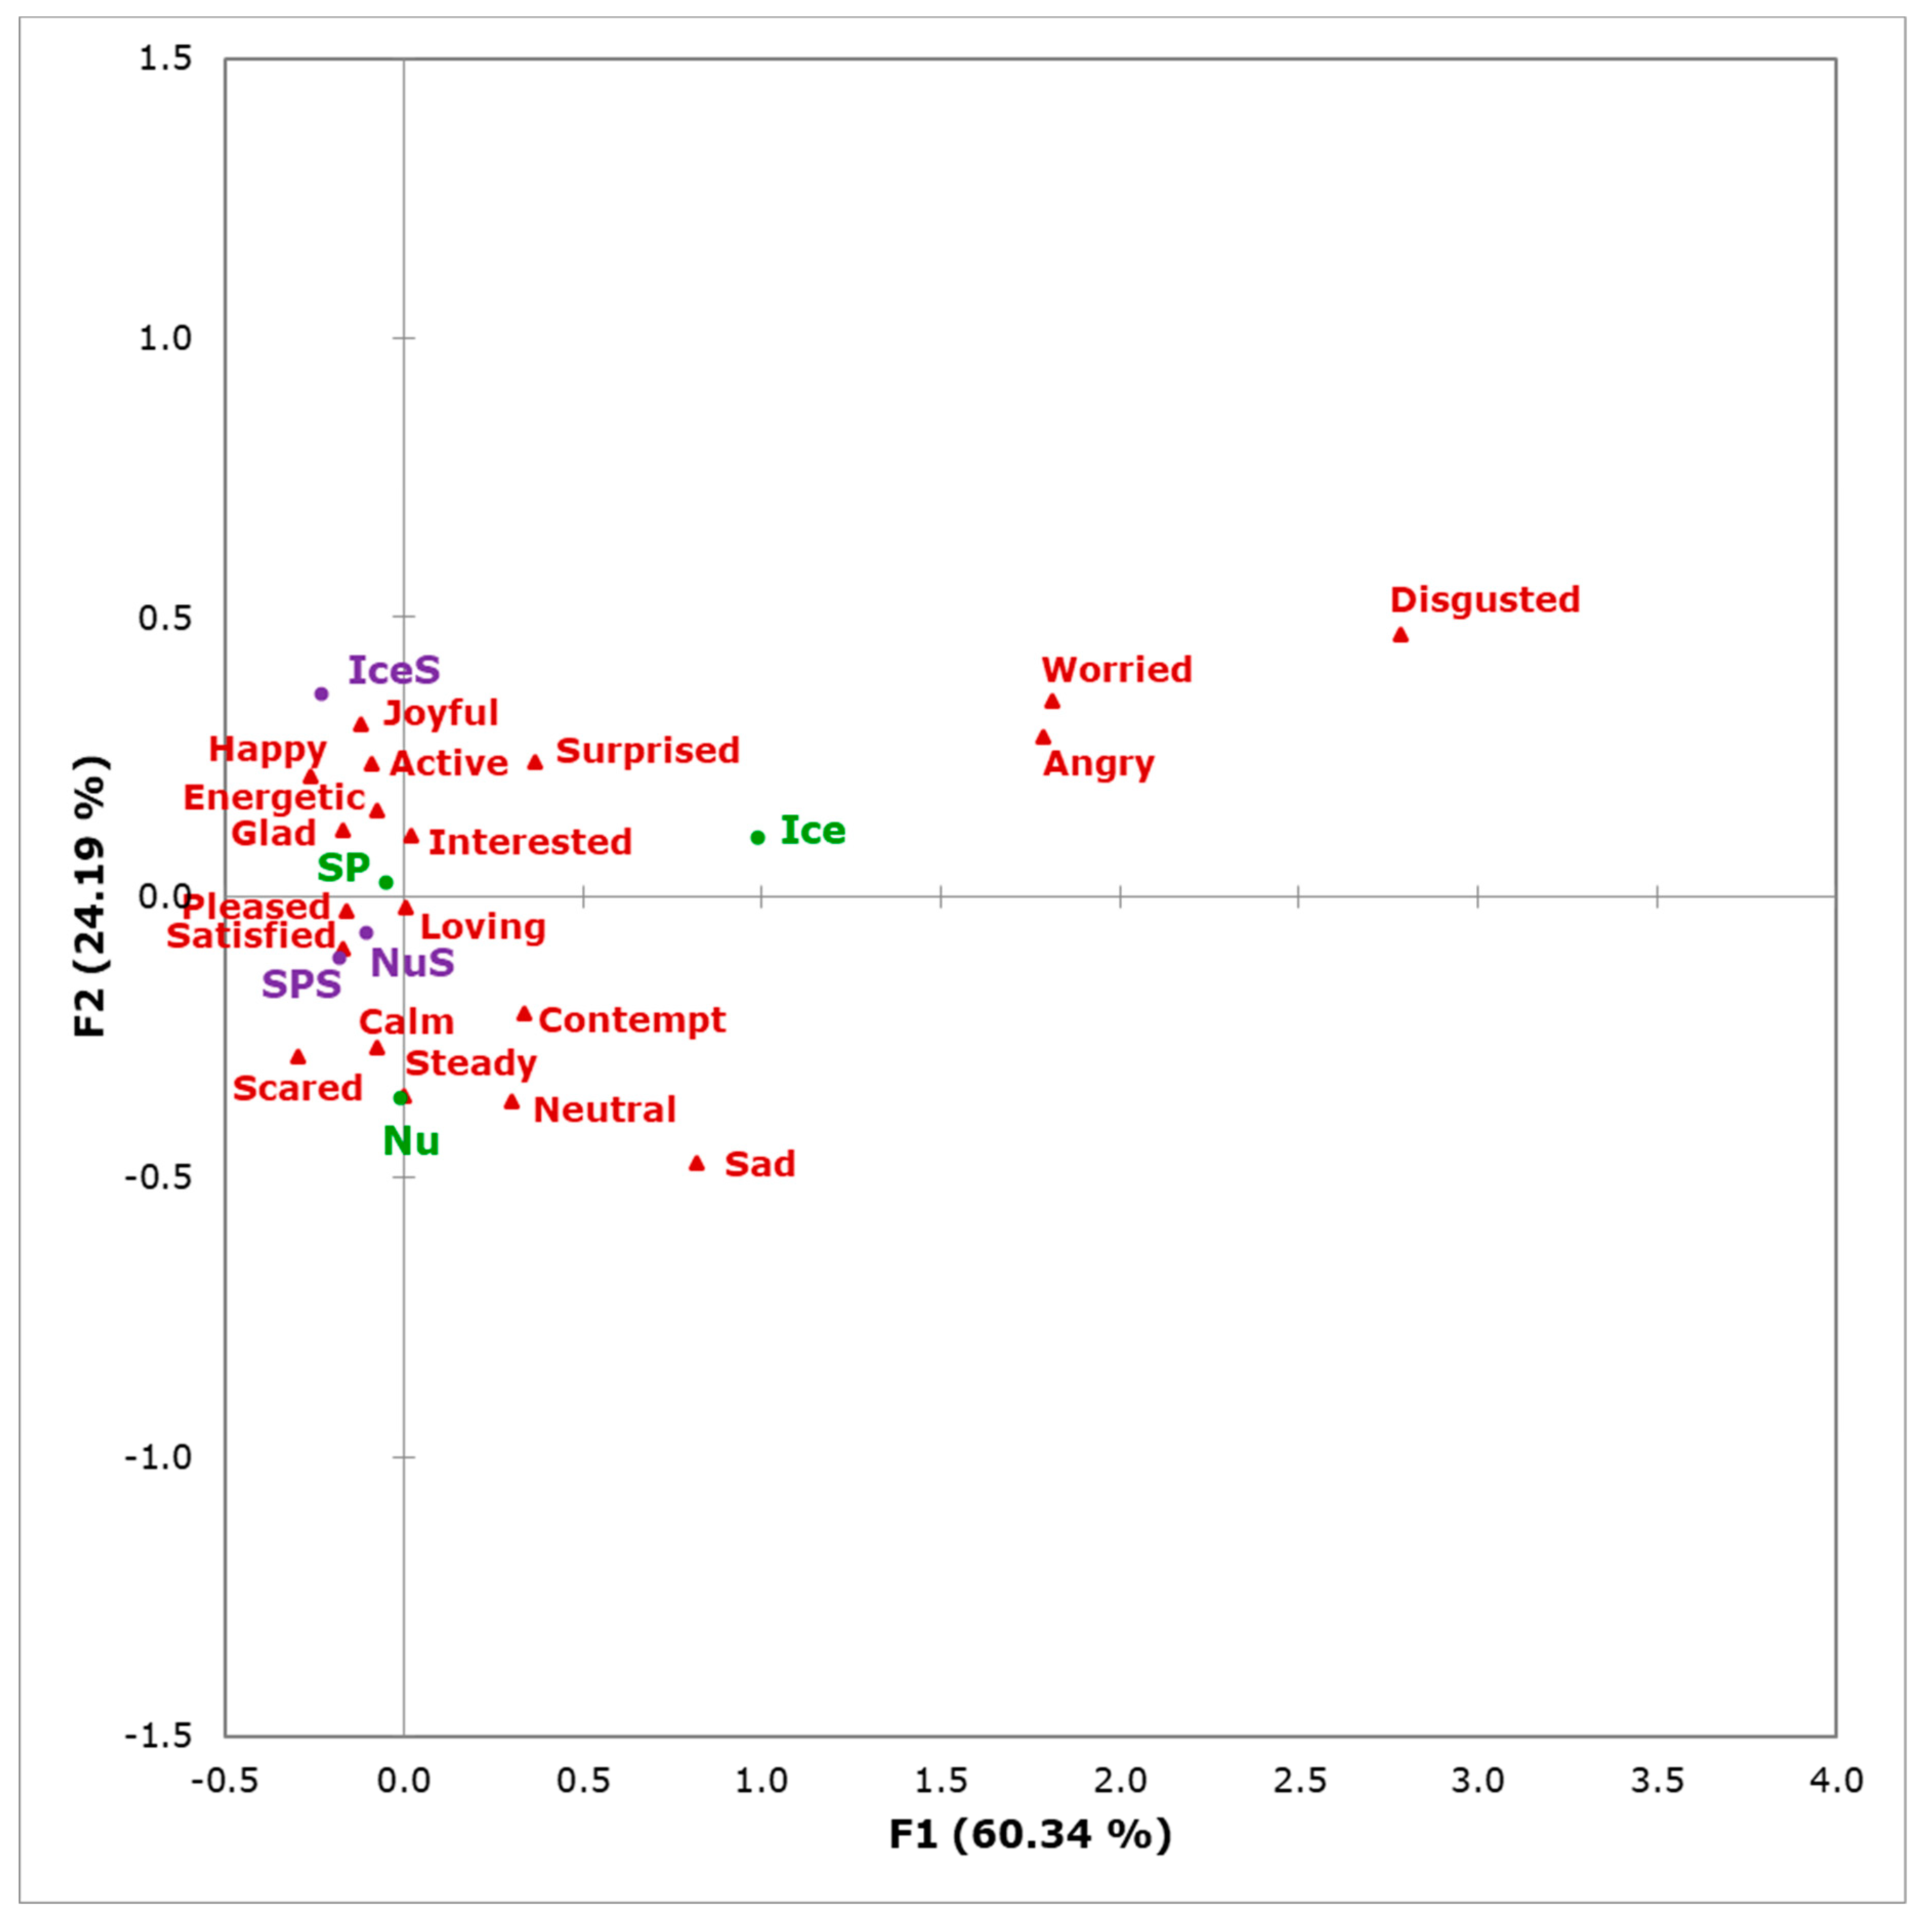
3.2.2. Self-Reported Emotional Responses of Carbonated Water
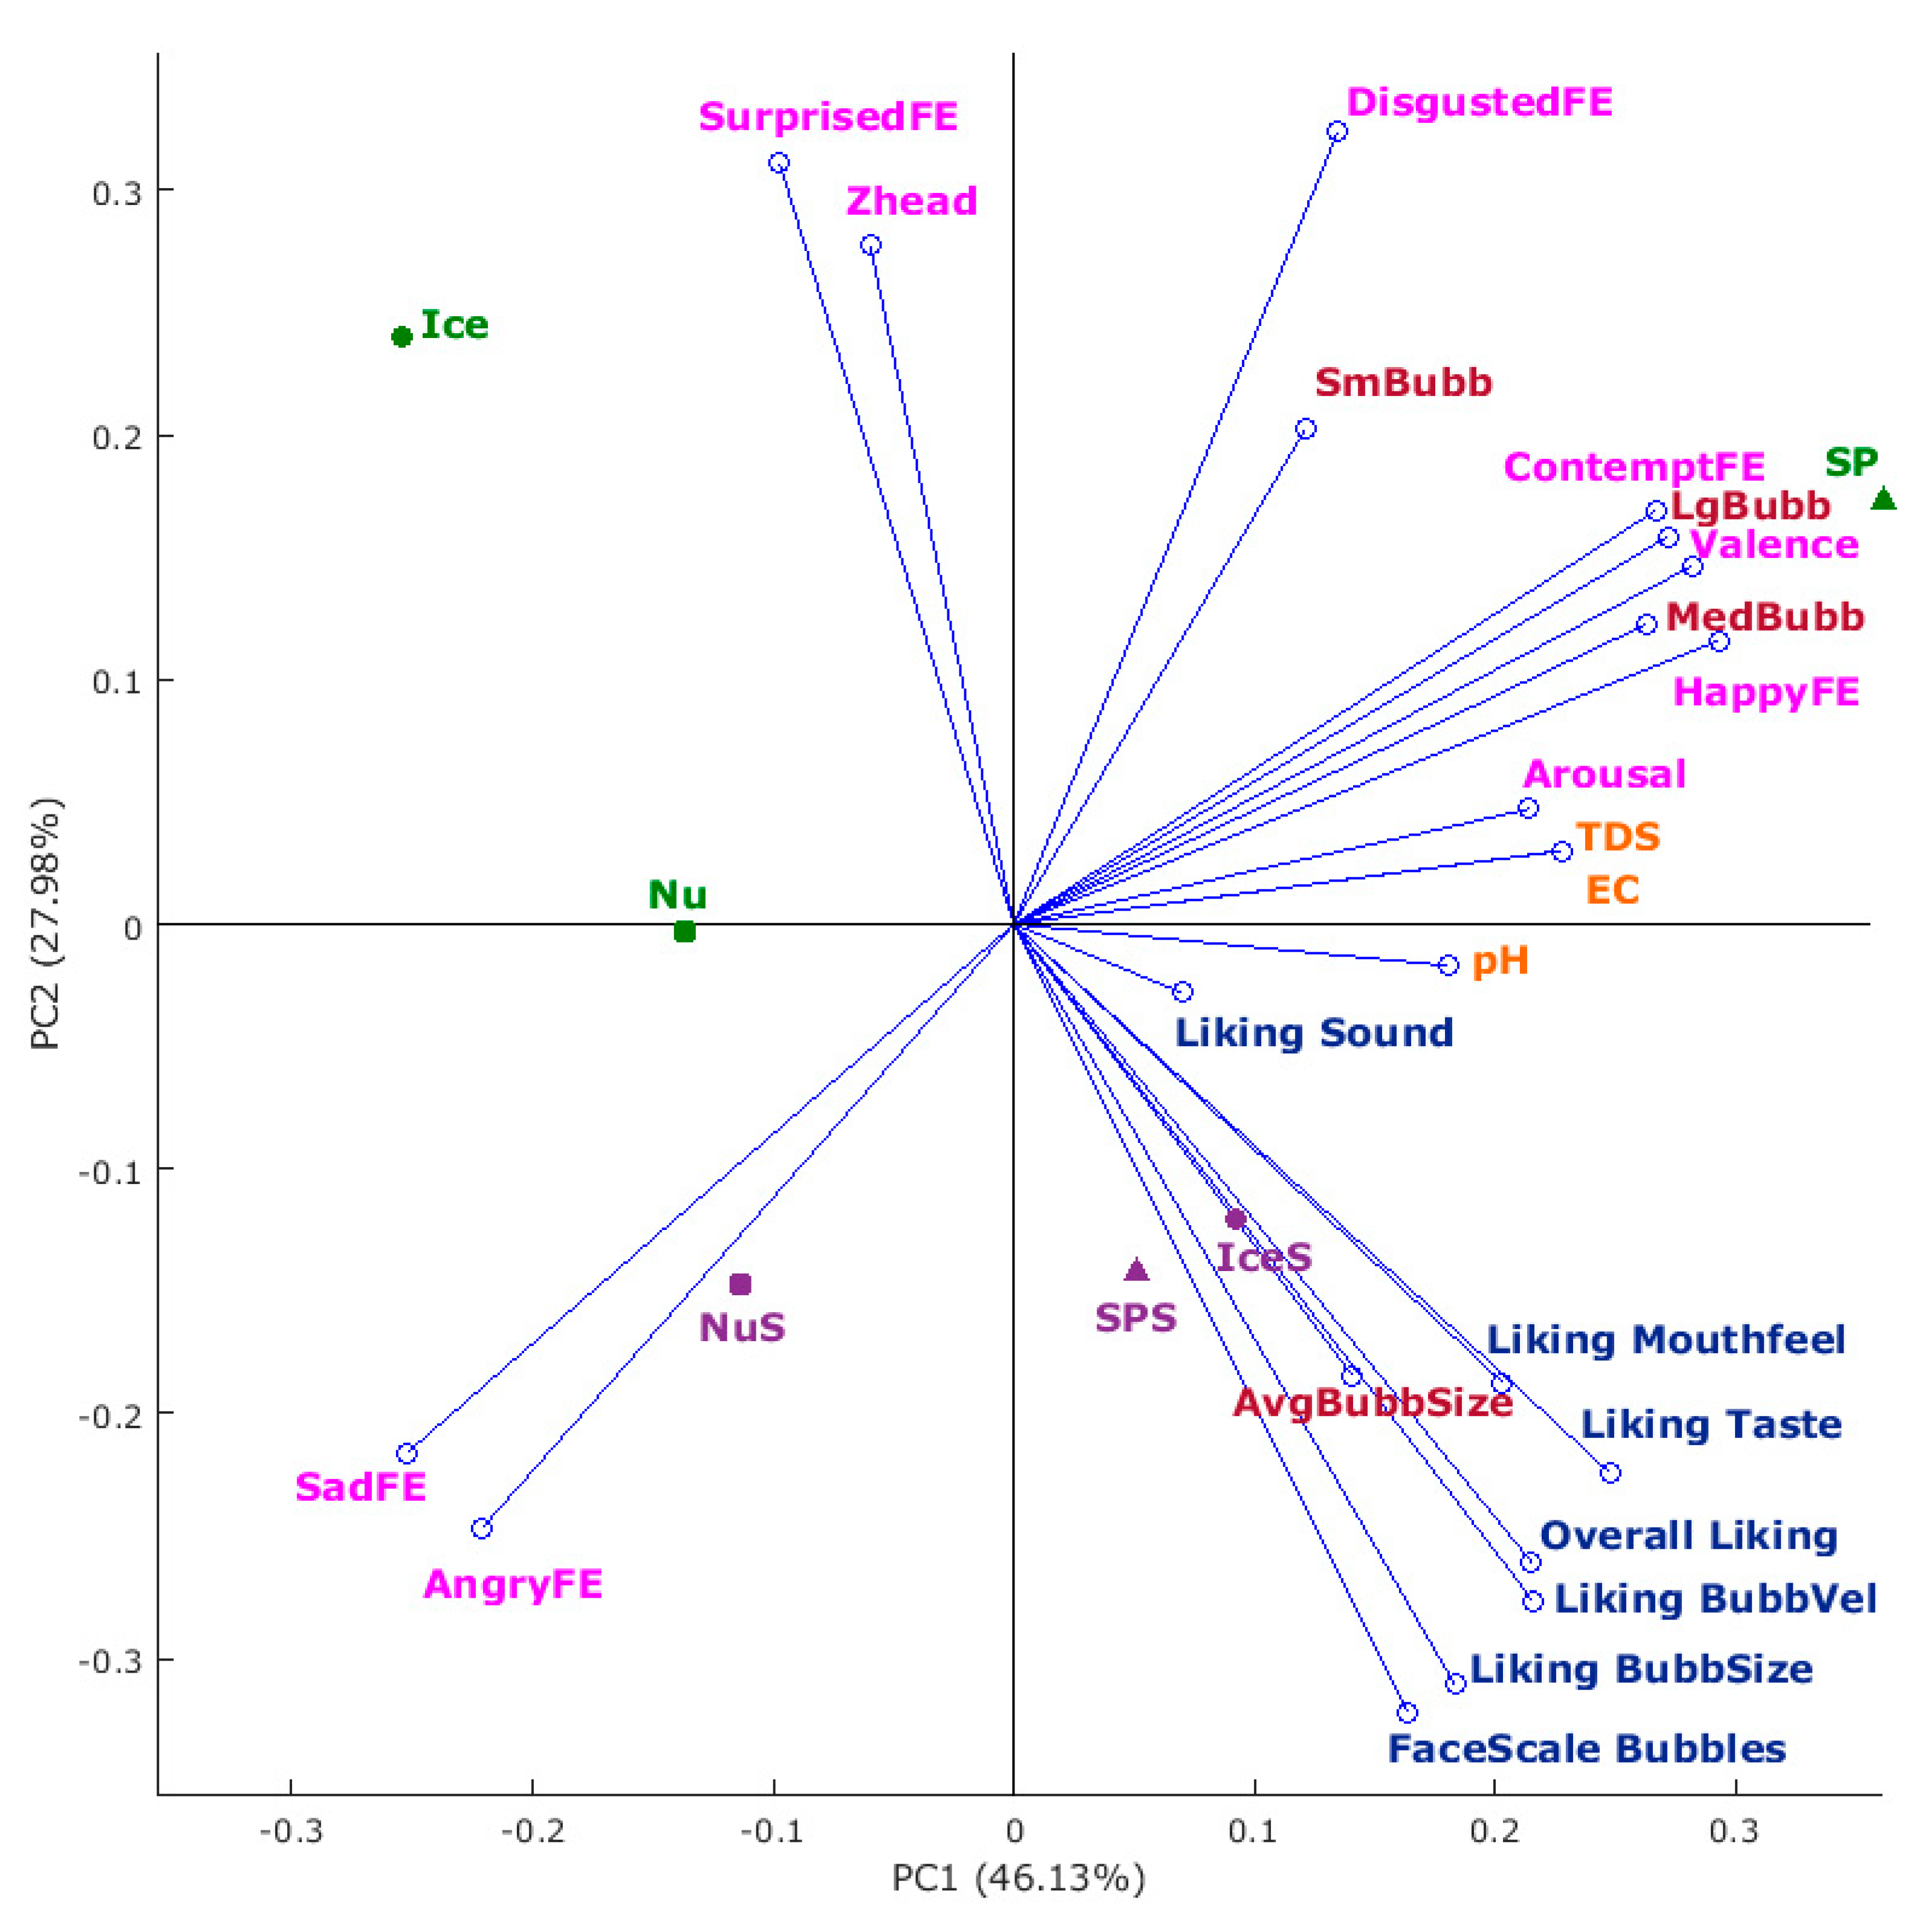
3.3. Multivariate Data Analysis
4. Discussion
4.1. Physicochemical Properties of Carbonated Water
4.2. Sensory Evaluation of Carbonated Water
4.2.1. Self-Reported Responses of Consumer Acceptability of Carbonated Water
4.2.2. Self-Reported Emotional Responses of Carbonated Water
4.3. Multivariate Data Analysis
5. Conclusions
Supplementary Materials
Author Contributions
Funding
Acknowledgments
Conflicts of Interest
References
- LaMoreaux, P.E.; Tanner, J.T. Springs and Bottled Waters of the World: Ancient History, Source, Occurrence, Quality and Use; Springer: Berlin/Heidelberg, Germany, 2012. [Google Scholar]
- Chang, C.-H.; Urban, P.L. Fizzy extraction of volatile and semivolatile compounds into the gas phase. Anal. Chem. 2016, 88, 8735–8740. [Google Scholar] [CrossRef]
- Euromonitor-International. Bottled Water in Australia; Euromonitor-International: London, UK, 2016; p. 11. [Google Scholar]
- Rodwan, J., Jr. BOTTLED WATER 2014: Reinvigoration U.S. and International Developments and Statistics.; International Bottled Water Association: Alexandria, VA, USA, 2015; pp. 10–19. [Google Scholar]
- Hewson, L.; Hollowood, T.; Chandra, S.; Hort, J. Gustatory, olfactory and trigeminal interactions in a model carbonated beverage. Chemosens. Percept. 2009, 2, 94–107. [Google Scholar] [CrossRef]
- Carstens, E.; Carstens, M.I.; Dessirier, J.-M.; O’Mahony, M.; Simons, C.T.; Sudo, M.; Sudo, S. It hurts so good: Oral irritation by spices and carbonated drinks and the underlying neural mechanisms. Food Qual. Prefer. 2002, 13, 431–443. [Google Scholar] [CrossRef]
- Zampini, M.; Spence, C. Modifying the multisensory perception of a carbonated beverage using auditory cues. Food Qual. Prefer. 2005, 16, 632–641. [Google Scholar] [CrossRef]
- Rey-Salgueiro, L.; Gosálbez-García, A.; Pérez-Lamela, C.; Simal-Gándara, J.; Falqué-López, E. Training of panellists for the sensory control of bottled natural mineral water in connection with water chemical properties. Food Chem. 2013, 141, 625–636. [Google Scholar] [CrossRef] [PubMed]
- Liger-Belair, G. The physics and chemistry behind the bubbling properties of champagne and sparkling wines: A state-of-the-art review. J. Agric. Food Chem. 2005, 53, 2788–2802. [Google Scholar] [CrossRef] [PubMed]
- Bamforth, C.; Russell, I.; Stewart, G. Beer: A Quality Perspective; Elsevier Science: Amsterdam, The Netherlands, 2011. [Google Scholar]
- Barker, G.; Jefferson, B.; Judd, S. The control of bubble size in carbonated beverages. Chem. Eng. Sci. 2002, 57, 565–573. [Google Scholar] [CrossRef]
- Khan, S.A.; Duraiswamy, S. Controlling bubbles using bubbles—Microfluidic synthesis of ultra-small gold nanocrystals with gas-evolving reducing agents. Lab Chip 2012, 12, 1807–1812. [Google Scholar] [CrossRef] [PubMed]
- Gonzalez Viejo, C.; Fuentes, S.; Torrico, D.; Lee, M.; Hu, Y.; Chakraborty, S.; Dunshea, F. The Effect of Soundwaves on Foamability Properties and Sensory of Beers with a Machine Learning Modeling Approach. Beverages 2018, 4, 53. [Google Scholar] [CrossRef]
- Wu, H.-Y.; Rubinstein, M.; Shih, E.; Guttag, J.; Durand, F.; Freeman, W. Eulerian Video Magnification for Revealing Subtle Changes in the World. ACM Trans. Graph. 2012, 31, 1–8. [Google Scholar] [CrossRef]
- Gonzalez Viejo, C.; Fuentes, S.; Li, G.; Collmann, R.; Condé, B.; Torrico, D. Development of a robotic pourer constructed with ubiquitous materials, open hardware and sensors to assess beer foam quality using computer vision and pattern recognition algorithms: RoboBEER. Food Res. Int. 2016, 89, 504–513. [Google Scholar] [CrossRef] [PubMed]
- Fuentes, S.; Gonzalez Viejo, C.; Torrico, D.; Dunshea, F. Development of a biosensory computer application to assess physiological and emotional responses from sensory panelists. Sensors 2018, 18, 2958. [Google Scholar] [CrossRef] [PubMed]
- Gonzalez Viejo, C.; Fuentes, S.; Howell, K.; Torrico, D.; Dunshea, F.R. Robotics and computer vision techniques combined with non-invasive consumer biometrics to assess quality traits from beer foamability using machine learning: A potential for artificial intelligence applications. Food Control. 2018. [Google Scholar] [CrossRef]
- King, S.C.; Meiselman, H.L. Development of a method to measure consumer emotions associated with foods. Food Qual. Prefer. 2010, 21, 168–177. [Google Scholar] [CrossRef]
- Sheskin, D.J. Handbook of Parametric and Nonparametric Statistical Procedures, 5th ed.; Taylor & Francis: Abingdon, UK, 2011. [Google Scholar]
- Patnaik, P. Handbook of Environmental Analysis: Chemical Pollutants in Air, Water, Soil, and Solid Wastes, 2nd ed.; CRC Press: Boca Raton, FL, USA, 2010. [Google Scholar]
- Alcademics. Measuring the pH of Mineral Waters. Available online: https://www.alcademics.com/2013/04/measuring-ph-of-mineral-waters.html (accessed on 11 September 2019).
- Tariq, M.; Ali, M.; Shah, Z. Characteristics of industrial effluents and their possible impacts on quality of underground water. Soil Environ. 2006, 25, 64–69. [Google Scholar]
- Liger-Belair, G.; Sternenberg, F.; Brunner, S.; Robillard, B.; Cilindre, C. Bubble dynamics in various commercial sparkling bottled waters. J. Food Eng. 2015, 163, 60–70. [Google Scholar] [CrossRef]
- Doel, K.V.D. Physically based models for liquid sounds. ACM Trans. Appl. Percept. 2005, 2, 534–546. [Google Scholar] [CrossRef] [Green Version]
- Kumeta, M.; Takahashi, D.; Takeyasu, K.; Yoshimura, S.H. Cell type-specific suppression of mechanosensitive genes by audible sound stimulation. PLoS ONE 2018, 13, e0188764. [Google Scholar] [CrossRef]
- Jain, M.C. Textbook Of Engineering Physics; Prentice-Hall Of India Pvt. Limited: Delhi, India, 2009. [Google Scholar]
- Craig, V.S.J. Very small bubbles at surfaces—the nanobubble puzzle. Soft. Matter. 2011, 7, 40–48. [Google Scholar] [CrossRef]
- Campbell, G.M.; Mougeot, E. Creation and characterisation of aerated food products. Trends Food Sci. Technol. 1999, 10, 283–296. [Google Scholar] [CrossRef]
- Spence, C.; Wang, Q.J. Sensory expectations elicited by the sounds of opening the packaging and pouring a beverage. Flavour 2015, 4, 35. [Google Scholar] [CrossRef] [Green Version]
- Lawless, H. Sensory combinations in the meal. In Dimensions of the Meal–The Science, Culture, Business, and Art of Eating; Springer: New York, NY, USA, 2000; pp. 92–106. [Google Scholar]
- Piqueras-Fiszman, B.; Kraus, A.A.; Spence, C. “Yummy” versus “Yucky”! Explicit and implicit approach–avoidance motivations towards appealing and disgusting foods. Appetite 2014, 78, 193–202. [Google Scholar] [CrossRef] [PubMed]
- Gonzalez Viejo, C.; Fuentes, S.; Howell, K.; Torrico, D.D.; Dunshea, F.R. Integration of non-invasive biometrics with sensory analysis techniques to assess acceptability of beer by consumers. Physiol. Behav. 2019, 200, 139–147. [Google Scholar] [CrossRef] [PubMed]
- Nolan, Y. Supporting Care Practice: Level 2: Foundation Modern Apprenticeship; Pearson Education: London, UK, 2004. [Google Scholar]


| Brand | Image | Sample Denomination | Bottle Dimensions (Diameter/Height/ Neck Diameter/ Thickness) | CO2 Source | TDS in Label | Label Control | Label Sonication Treatment |
|---|---|---|---|---|---|---|---|
| San Pellegrino |  | Sparkling natural mineral water | 22.0 cm/22.5 cm/ 11.5 cm/0.40 mm | Natural springs with natural CO2 added | 854 ppm | SP | SPS |
| Nu Pure |  | Lightly sparkling water | 22.5 cm/22.0 cm/ 12.5 cm/0.39 mm | Natural springs | Not reported | Nu | NuS |
| Icelandic Glacial |  | Natural spring water | 21.0 cm/24.3 cm/ 11.8 cm/0.40 mm | Natural springs with added CO2 | 62 ppm | Ice | IceS |
| Assessment | Question | Scale | Anchors/Options |
|---|---|---|---|
| Sound | Liking | Continuous non-structured (9 cm) | Dislike extremely–Like extremely |
| Face Scale | Continuous non-structured (9 cm) |  | |
| Emotions | Check all that apply | Happy */Sad */Surprised */Angry */Disgusted */Scared *+/Contempt ^/Neutral ^/Calm */Pleased */Satisfied */Loving */Joyful */Worried */Energetic */Active */Glad */Steady */Interested */Aggressive * | |
| Visual | Liking of bubbles velocity | Continuous non-structured (9 cm) | Dislike extremely–Like extremely |
| Liking of bubble size | Continuous non-structured (9 cm) | Dislike extremely–Like extremely | |
| Face Scale | Continuous non-structured (9 cm) |  | |
| Emotions | Check all that apply | Happy */Sad */Surprised */Angry */Disgusted */Scared *+/Contempt ^/Neutral ^/Calm */Pleased */Satisfied */Loving */Joyful */Worried */Energetic */Active */Glad */Steady */Interested */Aggressive * | |
| Taste/ Mouthfeel | Liking of taste | Continuous non-structured (9 cm) | Dislike extremely–Like extremely |
| Liking of mouthfeel | Continuous non-structured (9 cm) | Dislike extremely–Like extremely | |
| Overall liking | Continuous non-structured (9 cm) | Dislike extremely–Like extremely |
| Sample | Total Dissolved Solids (ppm) | Electrical Conductivity (µs cm−1) | pH | |||
|---|---|---|---|---|---|---|
| Mean | SD | Mean | SD | Mean | SD | |
| SP | 442.5 a | 13.28 | 941.0 a | 27.71 | 5.5 a | 0.00 |
| Nu | 70.5 b | 2.89 | 149.5 b | 6.35 | 4.9 b | 0.00 |
| Ice | 47.5 c | 0.58 | 101.0 c | 1.16 | 4.5 c | 0.06 |
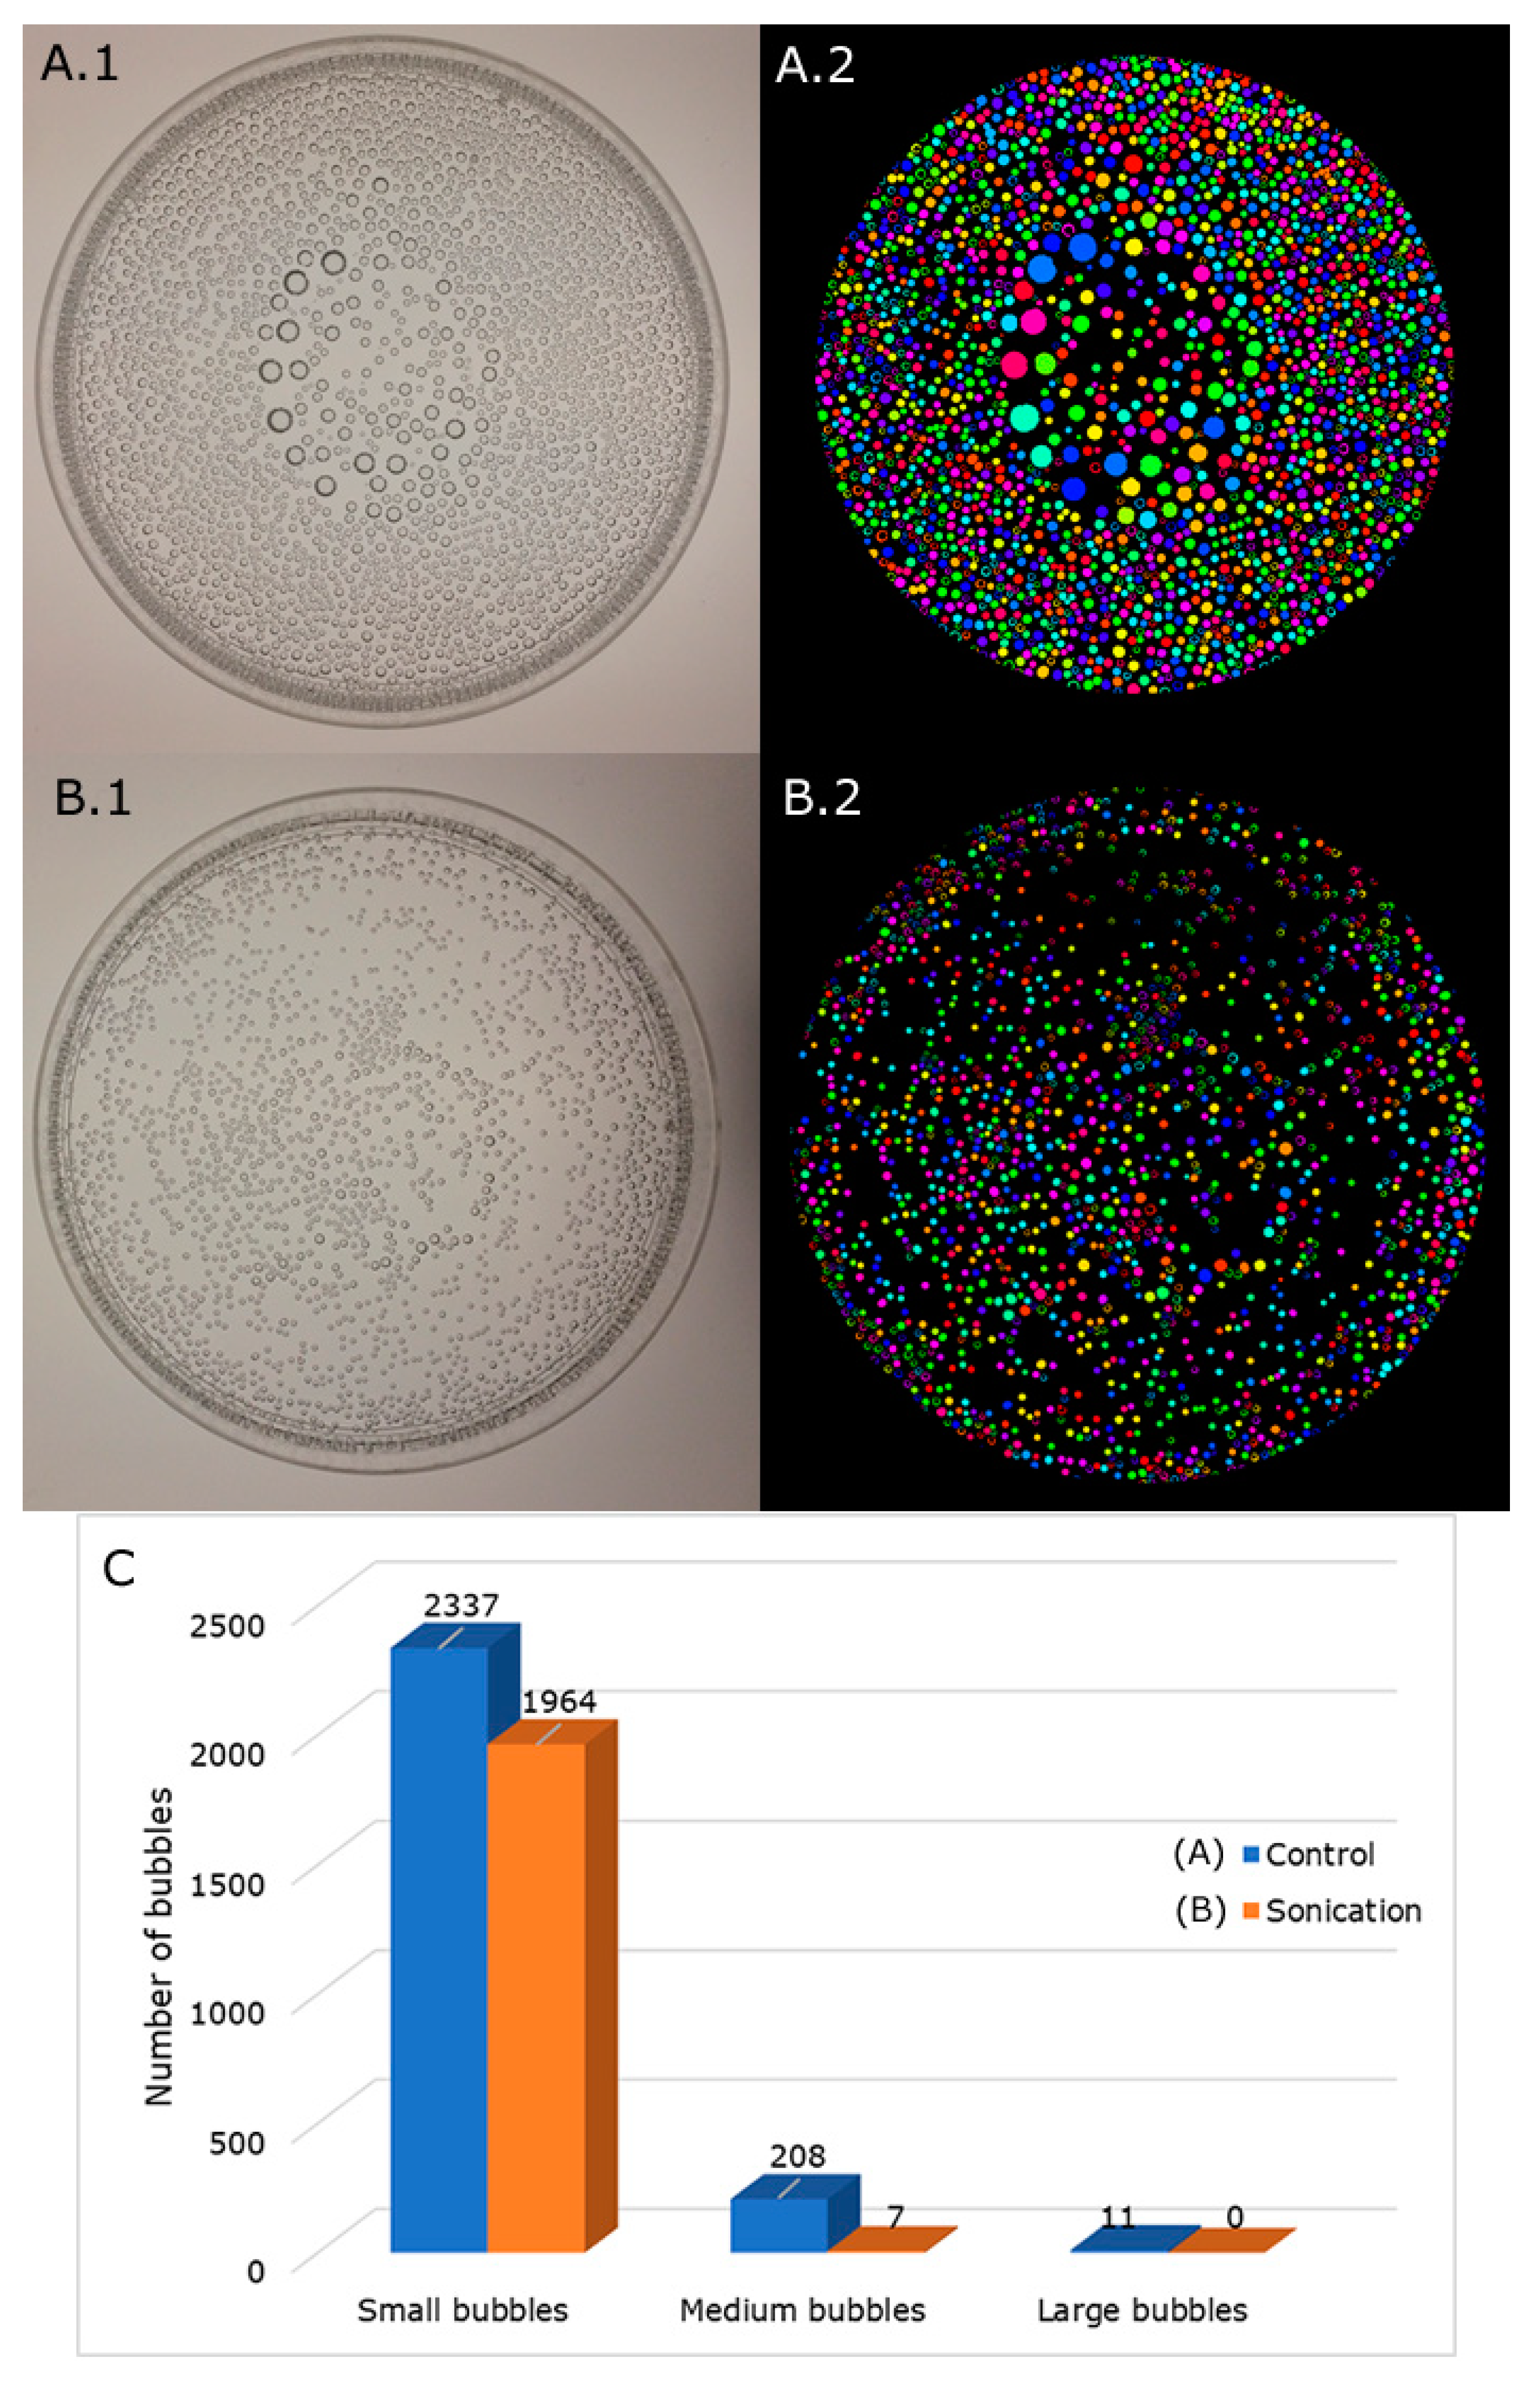
| Sample | Bubble Size (Pixels First Row/cm Second Row) | Total Number of Bubbles | Number of Small Bubbles | Number of Medium Bubbles | Number of Large Bubbles | |||||
|---|---|---|---|---|---|---|---|---|---|---|
| Mean | SD | Mean | SD | Mean | SD | Mean | SD | Mean | SD | |
| Ice | 5.22 e 0.02 | 2.64 0.01 | 2193.84 c | 138.73 | 2193.84 b | 138.73 | 0.00 d | 0.00 | 0.00 c | 0.00 |
| IceS | 13.46 c 0.04 | 10.44 0.03 | 1953.53 d | 132.21 | 1768.03 c | 110.26 | 180.36 b | 19.96 | 5.14 b | 2.00 |
| Nu | 15.04 ab 0.04 | 6.16 0.02 | 1403.39 e | 147.67 | 1315.83 d | 202.86 | 87.56 c | 55.19 | 0.00 c | 0.00 |
| NuS | 15.47 a 0.05 | 7.28 0.02 | 1106.82f | 60.42 | 1013.47 e | 117.85 | 93.35 c | 57.43 | 0.00 c | 0.00 |
| SP | 14.84 b 0.04 | 12.57 0.04 | 2723.20 a | 157.75 | 2196.79 b | 132.29 | 509.06 a | 284.04 | 17.35 a | 5.99 |
| SPS | 10.18 d 0.03 | 5.05 0.01 | 2238.26 b | 239.59 | 2234.03 a | 242.08 | 4.23 d | 2.49 | 0.00 c | 0.00 |
| Emotion | SP | SPS | Nu | NuS | Ice | IceS |
|---|---|---|---|---|---|---|
| Pleased | 0.11 ab | 0.19 ab | 0.07 b | 0.16 ab | 0.25 a | 0.23 ab |
| Satisfied (NS) | 0.14 | 0.25 | 0.09 | 0.05 | 0.18 | 0.18 |
| Active | 0.12 ab | 0.16 ab | 0.07 b | 0.16 ab | 0.16 ab | 0.25 a |
| Interested | 0.11 b | 0.18 ab | 0.07 b | 0.14 b | 0.21 ab | 0.30 a |
| Energetic | 0.18 ab | 0.12 ab | 0.05 b | 0.18 ab | 0.18 ab | 0.23 a |
| Happy | 0.12 b | 0.19 ab | 0.07 ab | 0.16 ab | 0.14 ab | 0.25 a |
| Calm (NS) | 0.30 | 0.18 | 0.23 | 0.21 | 0.19 | 0.09 |
| Neutral | 0.18 a | 0.14 ab | 0.12 ab | 0.12 ab | 0.21 ab | 0.07 b |
| Sad (NS) | 0.00 | 0.00 | 0.04 | 0.02 | 0.02 | 0.02 |
| Surprised | 0.07 ab | 0.05 ab | 0.12 ab | 0.02 b | 0.05 ab | 0.16 a |
| Angry (NS) | 0.00 | 0.00 | 0.02 | 0.02 | 0.02 | 0.00 |
| Disgusted (NS) | 0.02 | 0.02 | 0.09 | 0.00 | 0.00 | 0.02 |
| Scared (NS) | 0.00 | 0.00 | 0.00 | 0.02 | 0.00 | 0.00 |
| Contempt (NS) | 0.04 | 0.04 | 0.11 | 0.07 | 0.04 | 0.02 |
| Loving (NS) | 0.04 | 0.04 | 0.02 | 0.05 | 0.04 | 0.05 |
| Joyful | 0.05 b | 0.11 ab | 0.02 b | 0.09 ab | 0.09 ab | 0.18 a |
| Worried (NS) | 0.00 | 0.00 | 0.05 | 0.00 | 0.00 | 0.02 |
| Glad | 0.07 ab | 0.09 ab | 0.07 ab | 0.05 b | 0.09 ab | 0.19 a |
| Steady (NS) | 0.11 | 0.09 | 0.16 | 0.05 | 0.09 | 0.05 |
| Aggressive (NS) | 0.00 | 0.00 | 0.02 | 0.00 | 0.00 | 0.02 |
| Emotion | SP | SPS | Nu | NuS | Ice | IceS |
|---|---|---|---|---|---|---|
| Happy | 0.14 b | 0.20 ab | 0.11 b | 0.18 ab | 0.05 b | 0.32 a |
| Neutral | 0.16 ab | 0.18 ab | 0.25 a | 0.18 ab | 0.18 ab | 0.05 b |
| Calm | 0.23 ab | 0.25 ab | 0.30 a | 0.27 ab | 0.09 b | 0.16 ab |
| Pleased | 0.30 a | 0.36 a | 0.18 ab | 0.30 a | 0.09 b | 0.27 ab |
| Satisfied | 0.23 ab | 0.30 a | 0.20 ab | 0.25 ab | 0.07 b | 0.23 ab |
| Joyful | 0.18 ab | 0.11 ab | 0.07 b | 0.14 ab | 0.07 b | 0.25 a |
| Energetic (NS) | 0.14 | 0.18 | 0.11 | 0.16 | 0.09 | 0.25 |
| Active | 0.16 ab | 0.16 ab | 0.09 b | 0.18 ab | 0.09 b | 0.27 a |
| Interested (NS) | 0.25 | 0.16 | 0.14 | 0.25 | 0.14 | 0.25 |
| Sad (NS) | 0.00 | 0.00 | 0.02 | 0.02 | 0.02 | 0.00 |
| Surprised (NS) | 0.05 | 0.05 | 0.07 | 0.02 | 0.09 | 0.11 |
| Angry | 0.02 ab | 0.00 b | 0.00 b | 0.02 ab | 0.09 a | 0.00 b |
| Disgusted | 0.00 b | 0.00 b | 0.00 b | 0.00 b | 0.07 a | 0.00 b |
| Scared (NS) | 0.00 | 0.00 | 0.00 | 0.02 | 0.00 | 0.00 |
| Contempt (NS) | 0.05 | 0.05 | 0.09 | 0.05 | 0.07 | 0.05 |
| Loving (NS) | 0.05 | 0.09 | 0.05 | 0.09 | 0.05 | 0.07 |
| Worried (NS) | 0.02 | 0.00 | 0.00 | 0.00 | 0.05 | 0.00 |
| Glad (NS) | 0.11 | 0.11 | 0.11 | 0.14 | 0.05 | 0.20 |
| Steady (NS) | 0.11 | 0.18 | 0.18 | 0.11 | 0.07 | 0.07 |
© 2019 by the authors. Licensee MDPI, Basel, Switzerland. This article is an open access article distributed under the terms and conditions of the Creative Commons Attribution (CC BY) license (http://creativecommons.org/licenses/by/4.0/).
Share and Cite
Viejo, C.G.; Torrico, D.D.; Dunshea, F.R.; Fuentes, S. The Effect of Sonication on Bubble Size and Sensory Perception of Carbonated Water to Improve Quality and Consumer Acceptability. Beverages 2019, 5, 58. https://0-doi-org.brum.beds.ac.uk/10.3390/beverages5030058
Viejo CG, Torrico DD, Dunshea FR, Fuentes S. The Effect of Sonication on Bubble Size and Sensory Perception of Carbonated Water to Improve Quality and Consumer Acceptability. Beverages. 2019; 5(3):58. https://0-doi-org.brum.beds.ac.uk/10.3390/beverages5030058
Chicago/Turabian StyleViejo, Claudia Gonzalez, Damir D. Torrico, Frank R. Dunshea, and Sigfredo Fuentes. 2019. "The Effect of Sonication on Bubble Size and Sensory Perception of Carbonated Water to Improve Quality and Consumer Acceptability" Beverages 5, no. 3: 58. https://0-doi-org.brum.beds.ac.uk/10.3390/beverages5030058