Article

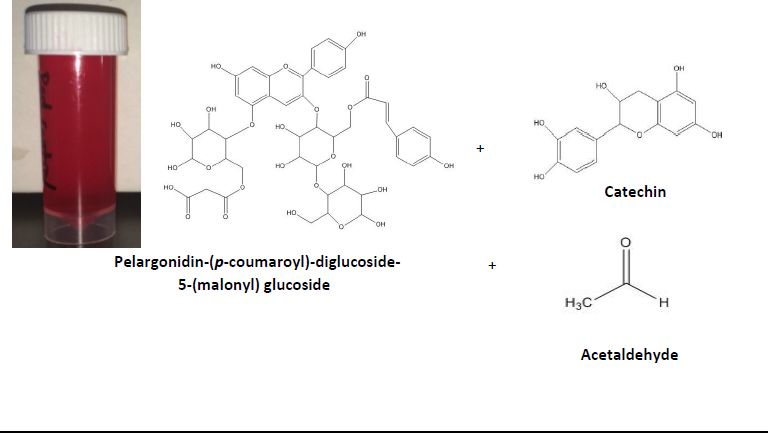
Formation, Tentative Mass Spectrometric Identification, and Color Stability of Acetaldehyde-Catalyzed Condensation of Red Radish (Raphanus sativus) Anthocyanins and (+) Catechin

1
Department of Food Science, University of Arkansas, 2650 N. Young Ave., Fayetteville, AR 72704, USA
2
Department of Chemistry and Biochemistry, University of Arkansas Statewide Mass Spectrometry Facility, 1260 West Maple Street, Fayetteville, AR 72701, USA
*
Author to whom correspondence should be addressed.
Submission received: 30 June 2019 / Revised: 9 October 2019 / Accepted: 31 October 2019 / Published: 8 November 2019

Abstract

:
Red radish anthocyanins are relatively stable due to the acylation of anthocyanins with organic and phenolic acid moieties. The objective of this study was to create and identify a novel ethyl-bridged acylated anthocyanin with a stable violet color from red radishes in the presence of acetaldehyde and catechin. After incubation at ambient temperature for one week at 21 °C the reaction mixture with acetaldehyde and catechin turned from bright red to a vivid purple color. The newly formed compounds were tentatively identified with liquid chromatography-electrospray ionization-mass spectrometry. Color stability (CIE L*C*h) was monitored over six months at 21 °C and anthocyanin stability was evaluated by HPLC. Next, radishes were fermented by Zymomonas mobilis, a high acetaldehyde producing bacteria. Natural sources of catechin were used to replace the catechin standard, but the same purple color did not appear with the addition of cocoa powder or fava beans. The ethyliden-bridged radish anthocyanins possess excellent color stability and could serve as a natural food colorant.

Graphical Abstract

1. Introduction

Anthocyanins are an obvious candidate to replace artificial dyes in the food industry, but these natural colorants currently have stability issues. There is a need for stable natural colorants in beverages, because some consider that artificial dyes may have negative health effects, such as ADHD [1]. Using anthocyanins from natural sources allows a cleaner product label by removing artificial colorants from the label. Some potential sources of anthocyanins include berries, red cabbage, eggplant, and radishes. Adding one of these to a label can deliver the appeal of an ingredient over an additive [2].
In the presence of anthocyanins and flavanols, such as catechin or procyanidins, acetaldehyde can act as a polymerization agent by reacting at carbon-8 of the anthocyanins in red wines [3]. The reaction of anthocyanins, acetaldehyde, and flavanols is well documented in wine, but has not been studied extensively in other fruits and vegetables. Yellow xanthylium ion compounds are formed in wine, but the more significant products were violet [3]. In another study, reddish-blue enantiomers of malvidin-3-glucoside (the main anthocyanin in wine) with an ethyl linkage to procyanidin B2 catalyzed by acetaldehyde were reported [4], but violet compounds were also noted. Acetaldehyde is formed through fermentation and also via the oxidation of ethanol. This volatile compound can react with flavanols to form ethyliden-bridged flavanol polymers that correlate with wine age [5], reflecting the slow rate of this reaction. By reacting at carbon-4 instead of carbon-8, acetaldehyde can combine with anthocyanins to form pyranoanthocyanins, which are highly stable compounds found in low concentrations in wine [6].
Acylated anthocyanins possess greater color stability than non-acylated anthocyanins [7,8,9] and the acylated anthocyanins from radishes are a suitable replacement for FD&C Red No. 40 [10,11]. Both Red No. 40 and Blue No. 1 are frequently used in dark blue and purple beverages. In an effort to further enhance the stability of acylated anthocyanins and replace both FD&C Red No. 40 and Blue No. 1, the objective of this study was to create and identify a novel ethyliden-bridged acylated anthocyanin with a stable violet color from red radishes in the presence of acetaldehyde and catechin.

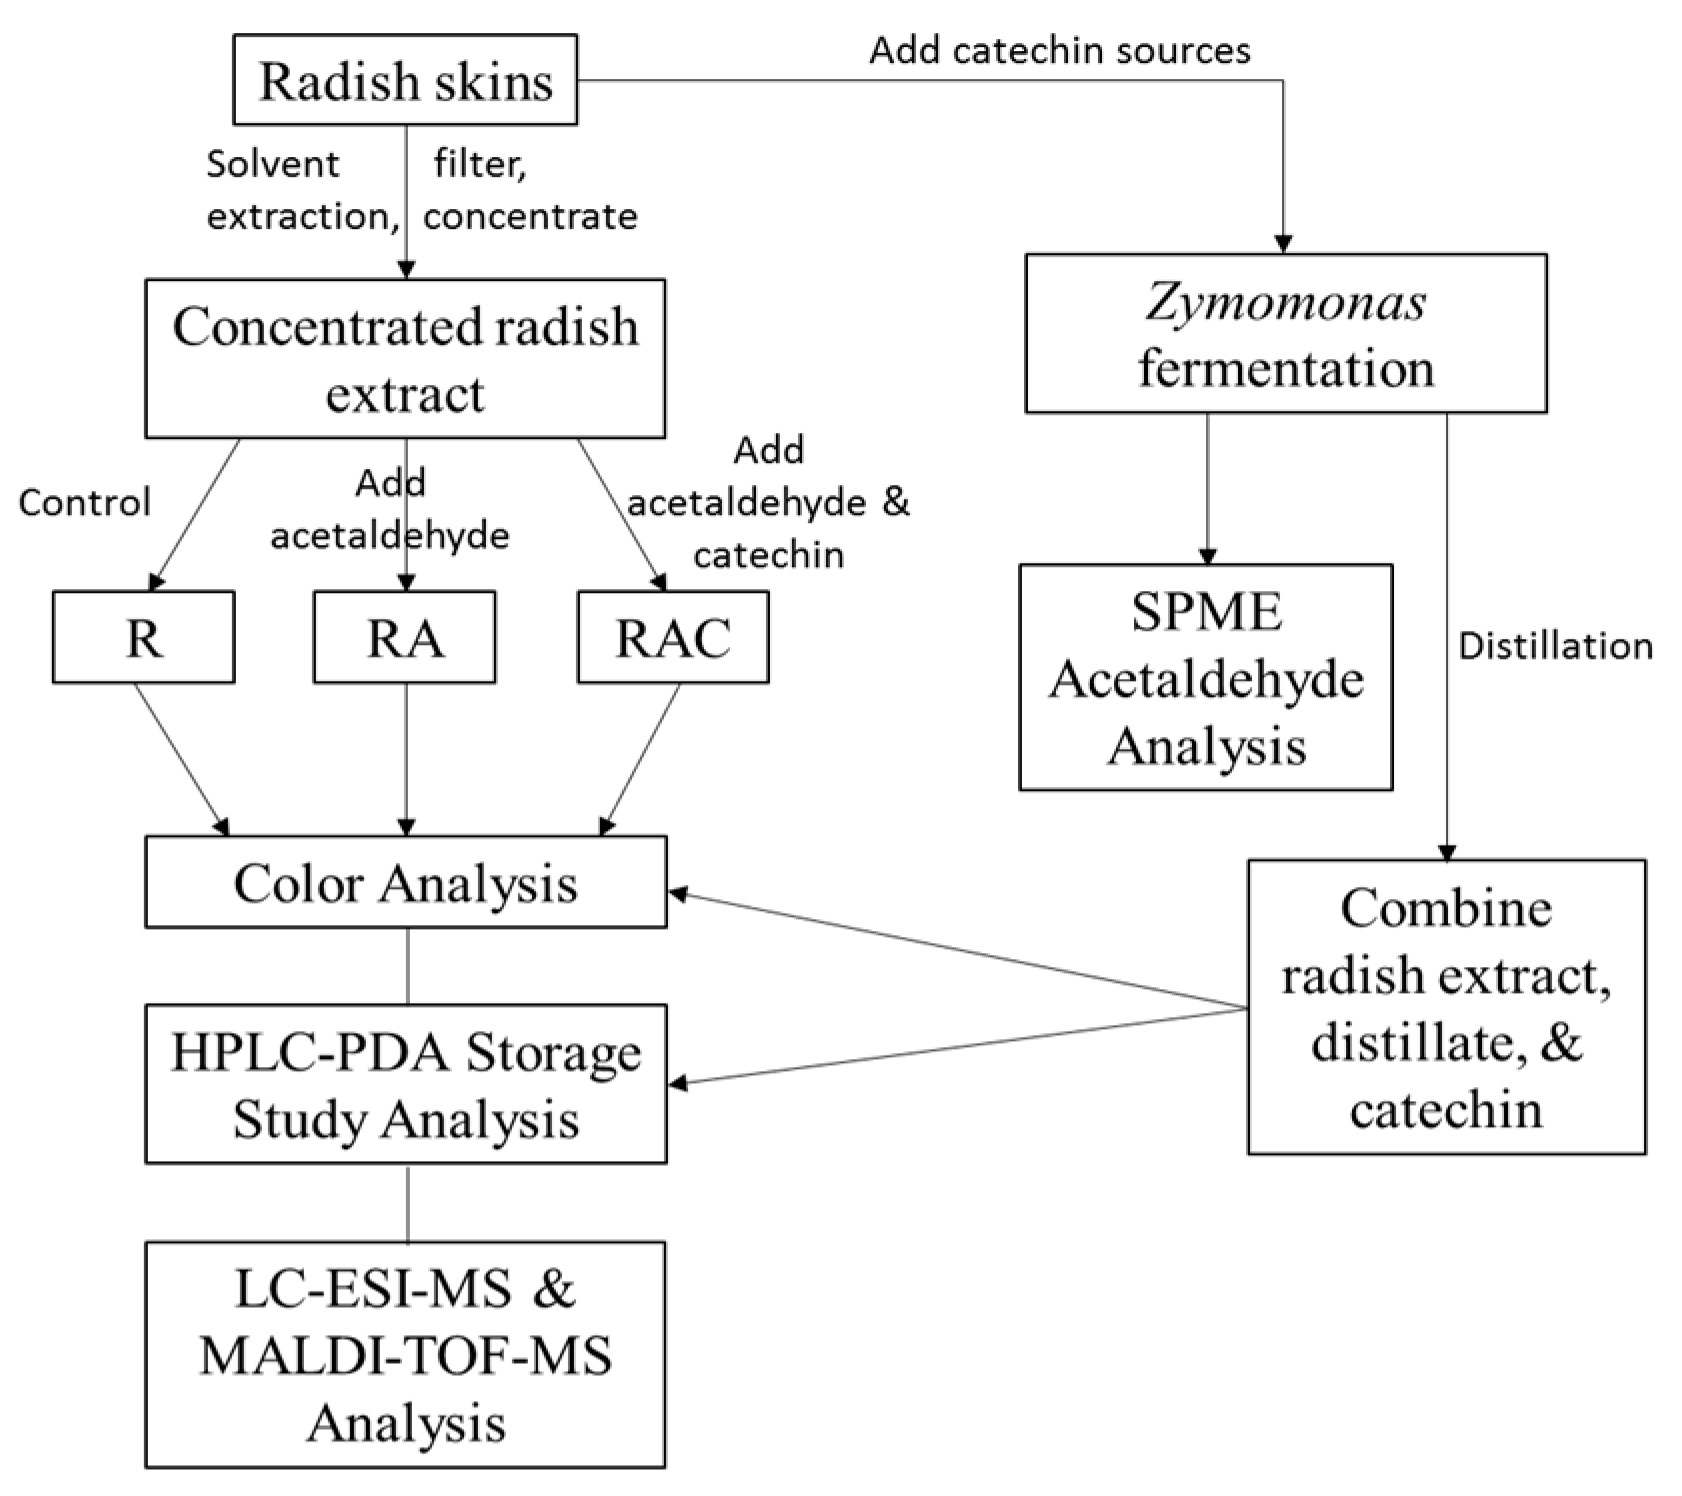
2. Materials and Methods

2.1. Chemicals and Materials

Cyanidin-3-O-glucoside (>98% purity) was obtained from Chromadex (Irvine, CA, USA). Acetaldehyde (>99.5% purity), (O-2,3,4,5,6-(pentafluorobenzyl) hydroxylamine hydrochloride (PFBHA), glucose, yeast extract, dipotassium phosphate, and catechin (>99% purity) were purchased from Sigma Aldrich (St. Louis, MO, USA). HPLC-grade methanol was purchased from EMD Millipore (Billerica, MA, USA) and formic acid was from Fischer-Scientific (Fair Lawn, NJ, USA). Zymomonas mobilis strain ATCC 31,821 was purchased from American Type Culture Collection (Manassas, VA, USA). Radishes, Hershey’s special dark cocoa powder, Dagoba cocoa powder, and fava beans were purchased from a local supermarket.

2.2. Extraction of Polyphenolics and Formulation of Model Systems

Figure 1 illustrates the experiments used in this study to create and identify a novel ethyliden-bridged acylated anthocyanin with a stable violet color from red radishes in the presence of acetaldehyde and catechin.
Radishes were hand peeled and the anthocyanin-containing skins were extracted according to Stebbins et al. [12]. Samples were first extracted with methanol/water/formic acid (60:37:3 v/v/v), and then the extraction was repeated with acetone/water/acetic acid (70:29.5:0.5 v/v/v) using a Euro Turrax Tissuemizer (Tekmar-Dohrman Corp., Mason, OH, USA). Natural sources of catechin, fava beans, Hershey’s special dark cocoa powder, aDagoba cocoa powder, were extracted in a similar manner using acetone/water/acetic acid (70:29.5:0.5 v/v/v). Extracts were filtered using Miracloth (Calbiochem, LaJolla, CA, USA) and concentrated using a Buchi (Flawil, Switzerland) Model R-144 rotary evaporator at 35 °C. Catechin sources were diluted for model systems to a concentration of 1.7 mM catechin equivalents. Radish extracts were diluted to match the absorbance and color properties of Red No. 40 in sports beverages. The samples contained either the radish extract alone (control), or 70 mM acetaldehyde (RA), 70 mM acetaldehyde, and 1.7 mM catechin (RAC) or catechin equivalents in water acidified to pH 3.5 by HCl. Triplicate 5 mL samples of each treatment were repeatedly measured over storage for six months at 21 °C. The natural sources of catechin were added in 1.7 mM equivalents of catechin.

2.3. Color Analysis

A Konica Minolta Chroma meter CR-400 and data processor DP-400 was used to measure lightness (L), chroma (C), and hue (h) in the L*C*h color scheme (Konica Minolta, Japan). Chroma and hue angle were calculated using the following formulas:
Chroma = ( a * ) 2 + ( b * ) 2
Hue   angle = tan 1 ( b * a * )   [ degrees ]
The chroma meter was calibrated with a white tile, as follows: X = 92.41, Y = 0.3145, Z = 0.3200, observer = 2° prior to each use. Color measurements were taken using five mL of sample with repeated measures at specified time intervals.

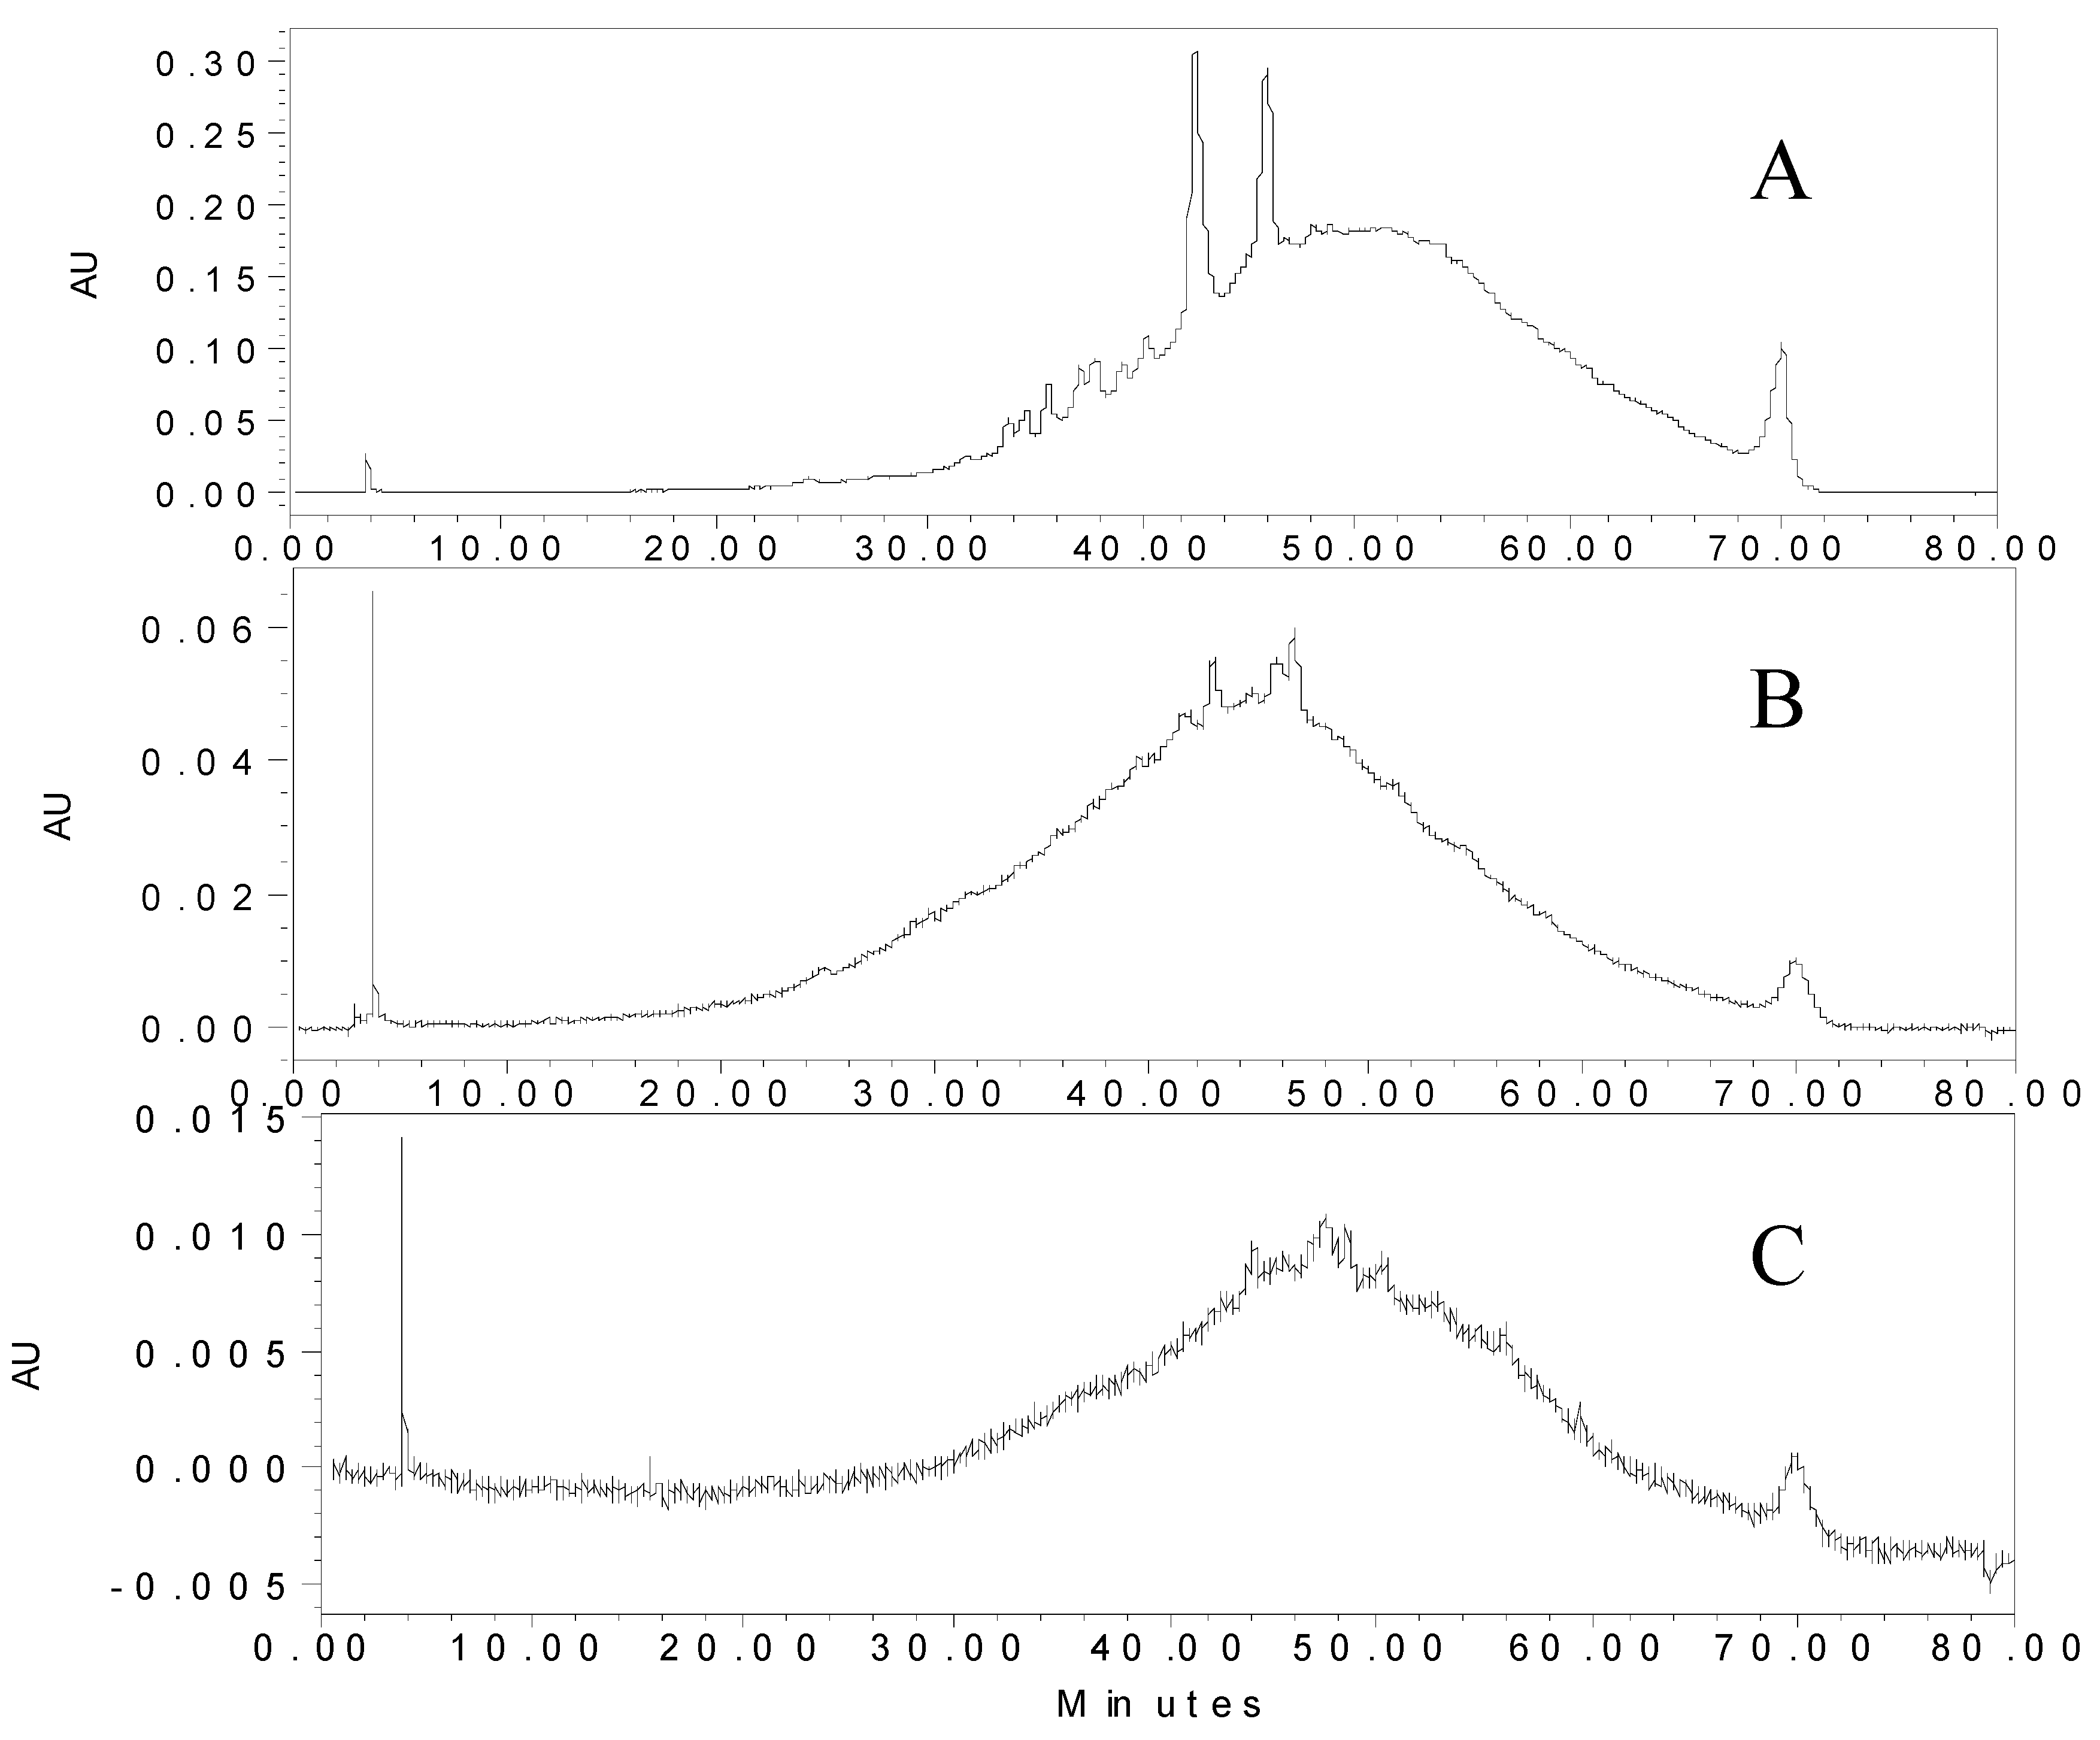
2.4. HPLC-PDA Analysis of Anthocyanins

Anthocyanin analysis followed the method of Cho et al. [13]. Radish extracts were passed through 0.45 μm nylon syringe filters prior to HPLC injection (50 µL). A Waters HPLC system (Waters Corp., Milford, MA, USA) comprised of dual 515 pumps, a 717plus autosampler, and a 996 photodiode array detector was used for chromatographic analyses. Anthocyanins were separated on a Waters Symmetry C18 column (4.6 × 250 mm, 5 μm) at 1 mL/min flow rate with solvent A as 5% formic acid and solvent B as methanol. Elution started with 15% B, increased to 60% B in 60 min, from 60% to 100% in 2 min, with an isocratic wash at 100% B for 10 min, and finishing with 15% B for a 10 min re-equilibration. UV-visible spectra were monitored from 250–600 nm and peak areas were integrated at 510 nm. Anthocyanins were quantified as cyanidin-3-glucoside equivalents using external calibration curves ranging from 1–200 µg/mL.
After Sephadex LH-20 purification, the RAC sample stored for one month at 21 °C was fractionated on the Waters Symmetry C18 HPLC column. Fractions, collected every minute using a Waters Fraction Collector III (Waters Corp., Milford, MA, USA), were evaporated to dryness using a SpeedVac concentrator (ThermoSavant, Holbrook, NY, USA), and then dissolved in a small volume of methanol prior to MALDI-TOF-MS analysis.

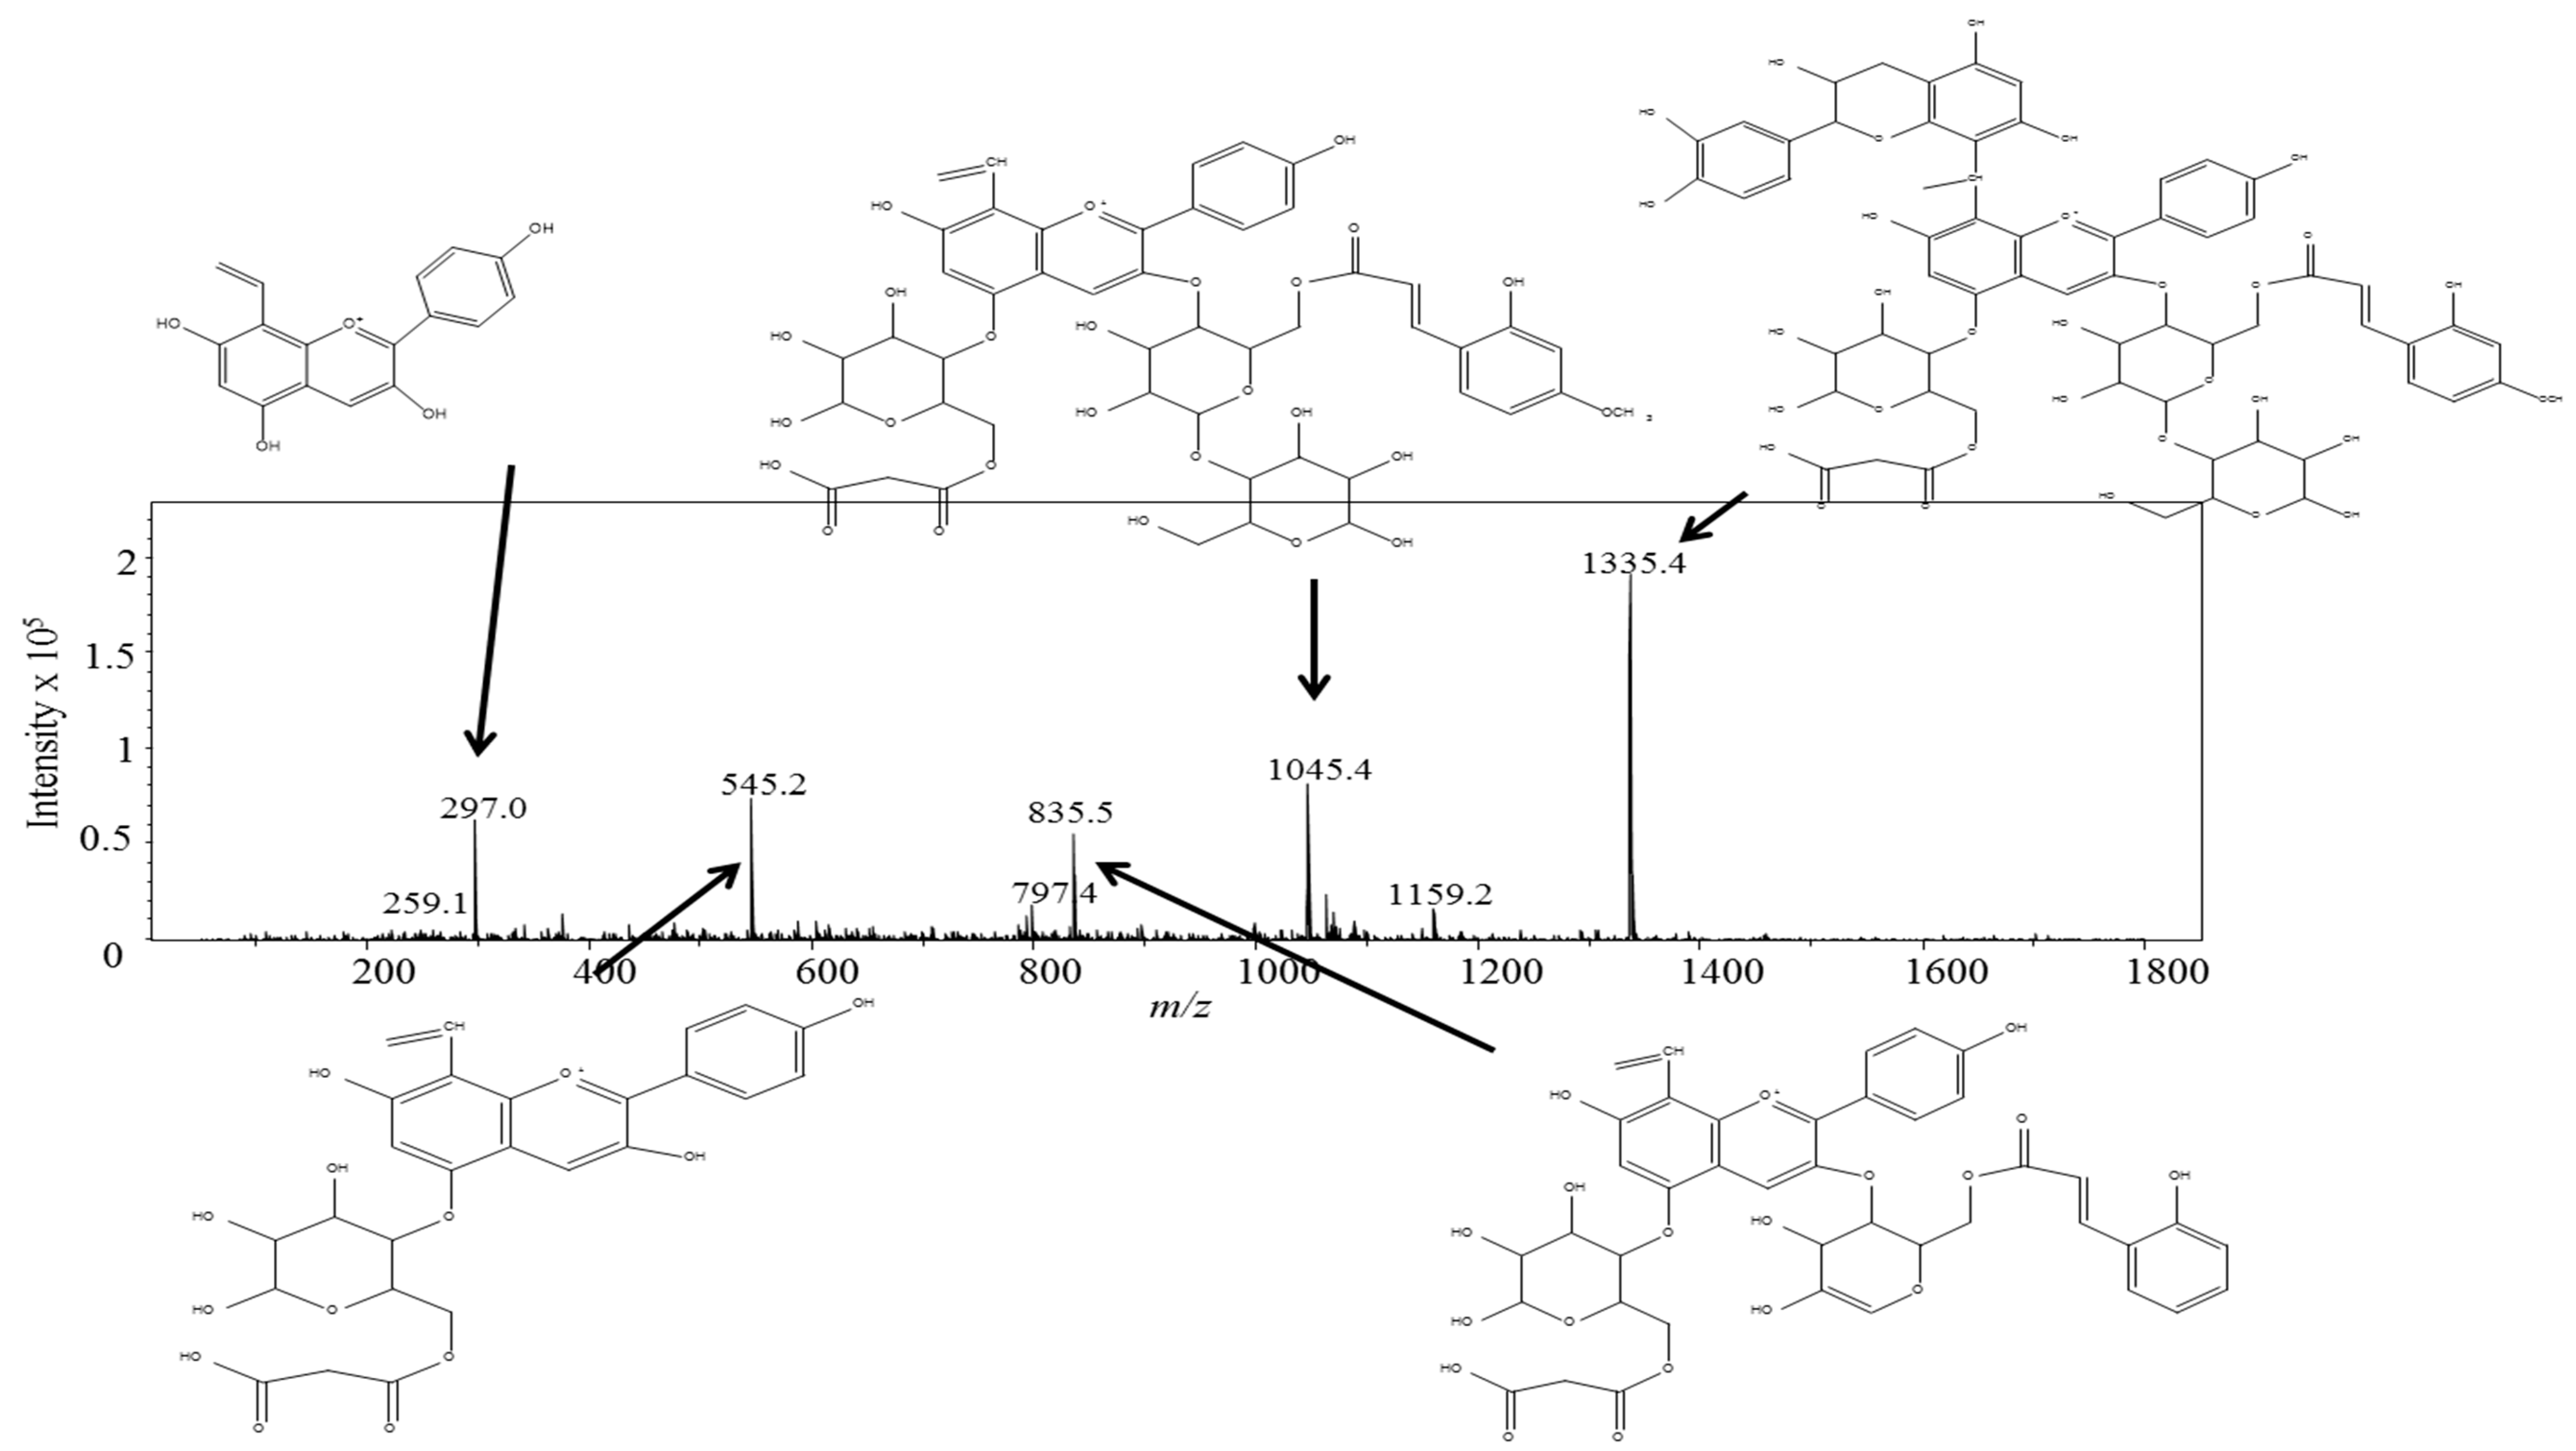
2.5. HPLC-Electrospray Ionization Tandem Mass Spectrometry (HPLC-ESI-MS) Analysis of Degradation Products

HPLC-ESI-MS analysis was conducted using an HP 1000 series HPLC and a Bruker Esquire 2000 quadrupole ion trap mass spectrometer (Bruker Scientific, Billerica, MA). Radish extract anthocyanins were separated using a Waters Symmetry C18 (250 × 4.6 mm; 5 μm) column, with gradients described above. The mass spectrometry analysis was performed in positive ion mode under the following conditions: Capillary voltage at 4 kV with polarity [−] for positive ion mode analysis, nebulizer gas pressure 32 psi, dry gas flow 12 L/min, and skim voltage at 53.7 V. Ions were isolated and fragmented in a quadrupole ion trap with excitation amplitude of 1.2 volts.

2.6. Sephadex LH-20 Solid Phase Extraction and Matrix Assisted Laser Desorption Ionization Time of Flight (MALDI-TOF) Analysis

Triplicate samples were purified and concentrated using Sephadex LH-20 and stored for one, four, and 12 months at 21 °C. The methodology followed Kantz et al. [14], with some modifications. Extracts were loaded on separate columns of 4 g Sephadex LH-20, which were previously hydrated overnight in DI water. Samples were loaded onto columns above the vacuum manifold, allowed to absorb onto the stationary phase, and then washed with 30% methanol to remove sugars and small phenolic molecules, which included some monomeric anthocyanins. Acetone (70%) was used to elute polymeric phenols that were subsequently dried using a SpeedVac concentrator (ThermoSavant, Holbrook, NY, USA) and then re-suspended in 70% acetone for further analysis.
Radish extracts and a peptide standard were mixed with 1 M dihydroxybenzoic acid (DHB) matrix in methanol in an equal ratio and 1 μL was spotted onto a stainless steel MALDI plate. Analysis was conducted using a Bruker Reflex III MALDI-TOF-MS (Billerica, MA, USA) equipped with a 337 nm N2 laser. A BrukerDaltonics peptide standard consisting of angiotensin II, angiotensin I, substance P, bombesin, ACTH clip, and somatostatin was used for time-of-flight calibration. Data was obtained in positive ion reflectron mode with an accelerating voltage of 25 kV and a reflectron voltage of 28 kV. Peaks were statistically evaluated using BrukerClinProTools software (Version 2.2., Bruker Daltonics, Hamburg, Germany).

2.7. On-Fiber Derivatization Headspace Solid Phase Microextraction Gas Chromatography-Mass Spectrometry (OFD-HS-SPME-GC-MS) and OFD-HS-SPME-GC-Flame Ionization Detection (FID) Analysis of Acetaldehyde

O-2,3,4,5,6-(pentafluorobenzyl) hydroxylamine hydrochloride (PFBHA) was used to derivatize acetaldehyde to limit analysis to aldehydes. A carboxen/polydimethylsiloxane SPME fiber was inserted into a 20 mL glass headspace vial with one mL of PFBHA (15 mg/mL) and incubated for 15 min at 50 °C with magnetic stirring [15,16]. The SPME fiber loaded with PFBHA was transferred to a vial with 5 mL of sample and incubated for 15 min at 50 °C with magnetic stirring. The SPME was desorbed for 10 min into a Varian 450-GC connected to a Varian 320-MS triple quadrupole mass spectrometer with an EI ionization source. Volatiles were separated on an Agilent 5% phenyl-methylpolysiloxane (30 m × 250 μm × 1 μm) column. The injector temperature was 270 °C and a split ratio of 5:1 was used. The column oven started at 25 °C, was held for 4 min, and then increased to 280 °C at 10 °C /min with a helium flow of 1.0 mL/min. The transfer line and ionization source temperatures were 270 °C and 200 °C, respectively. The ionization energy was 70 eV with m/z range of 35–350. GC-FID conditions followed the same methodology.

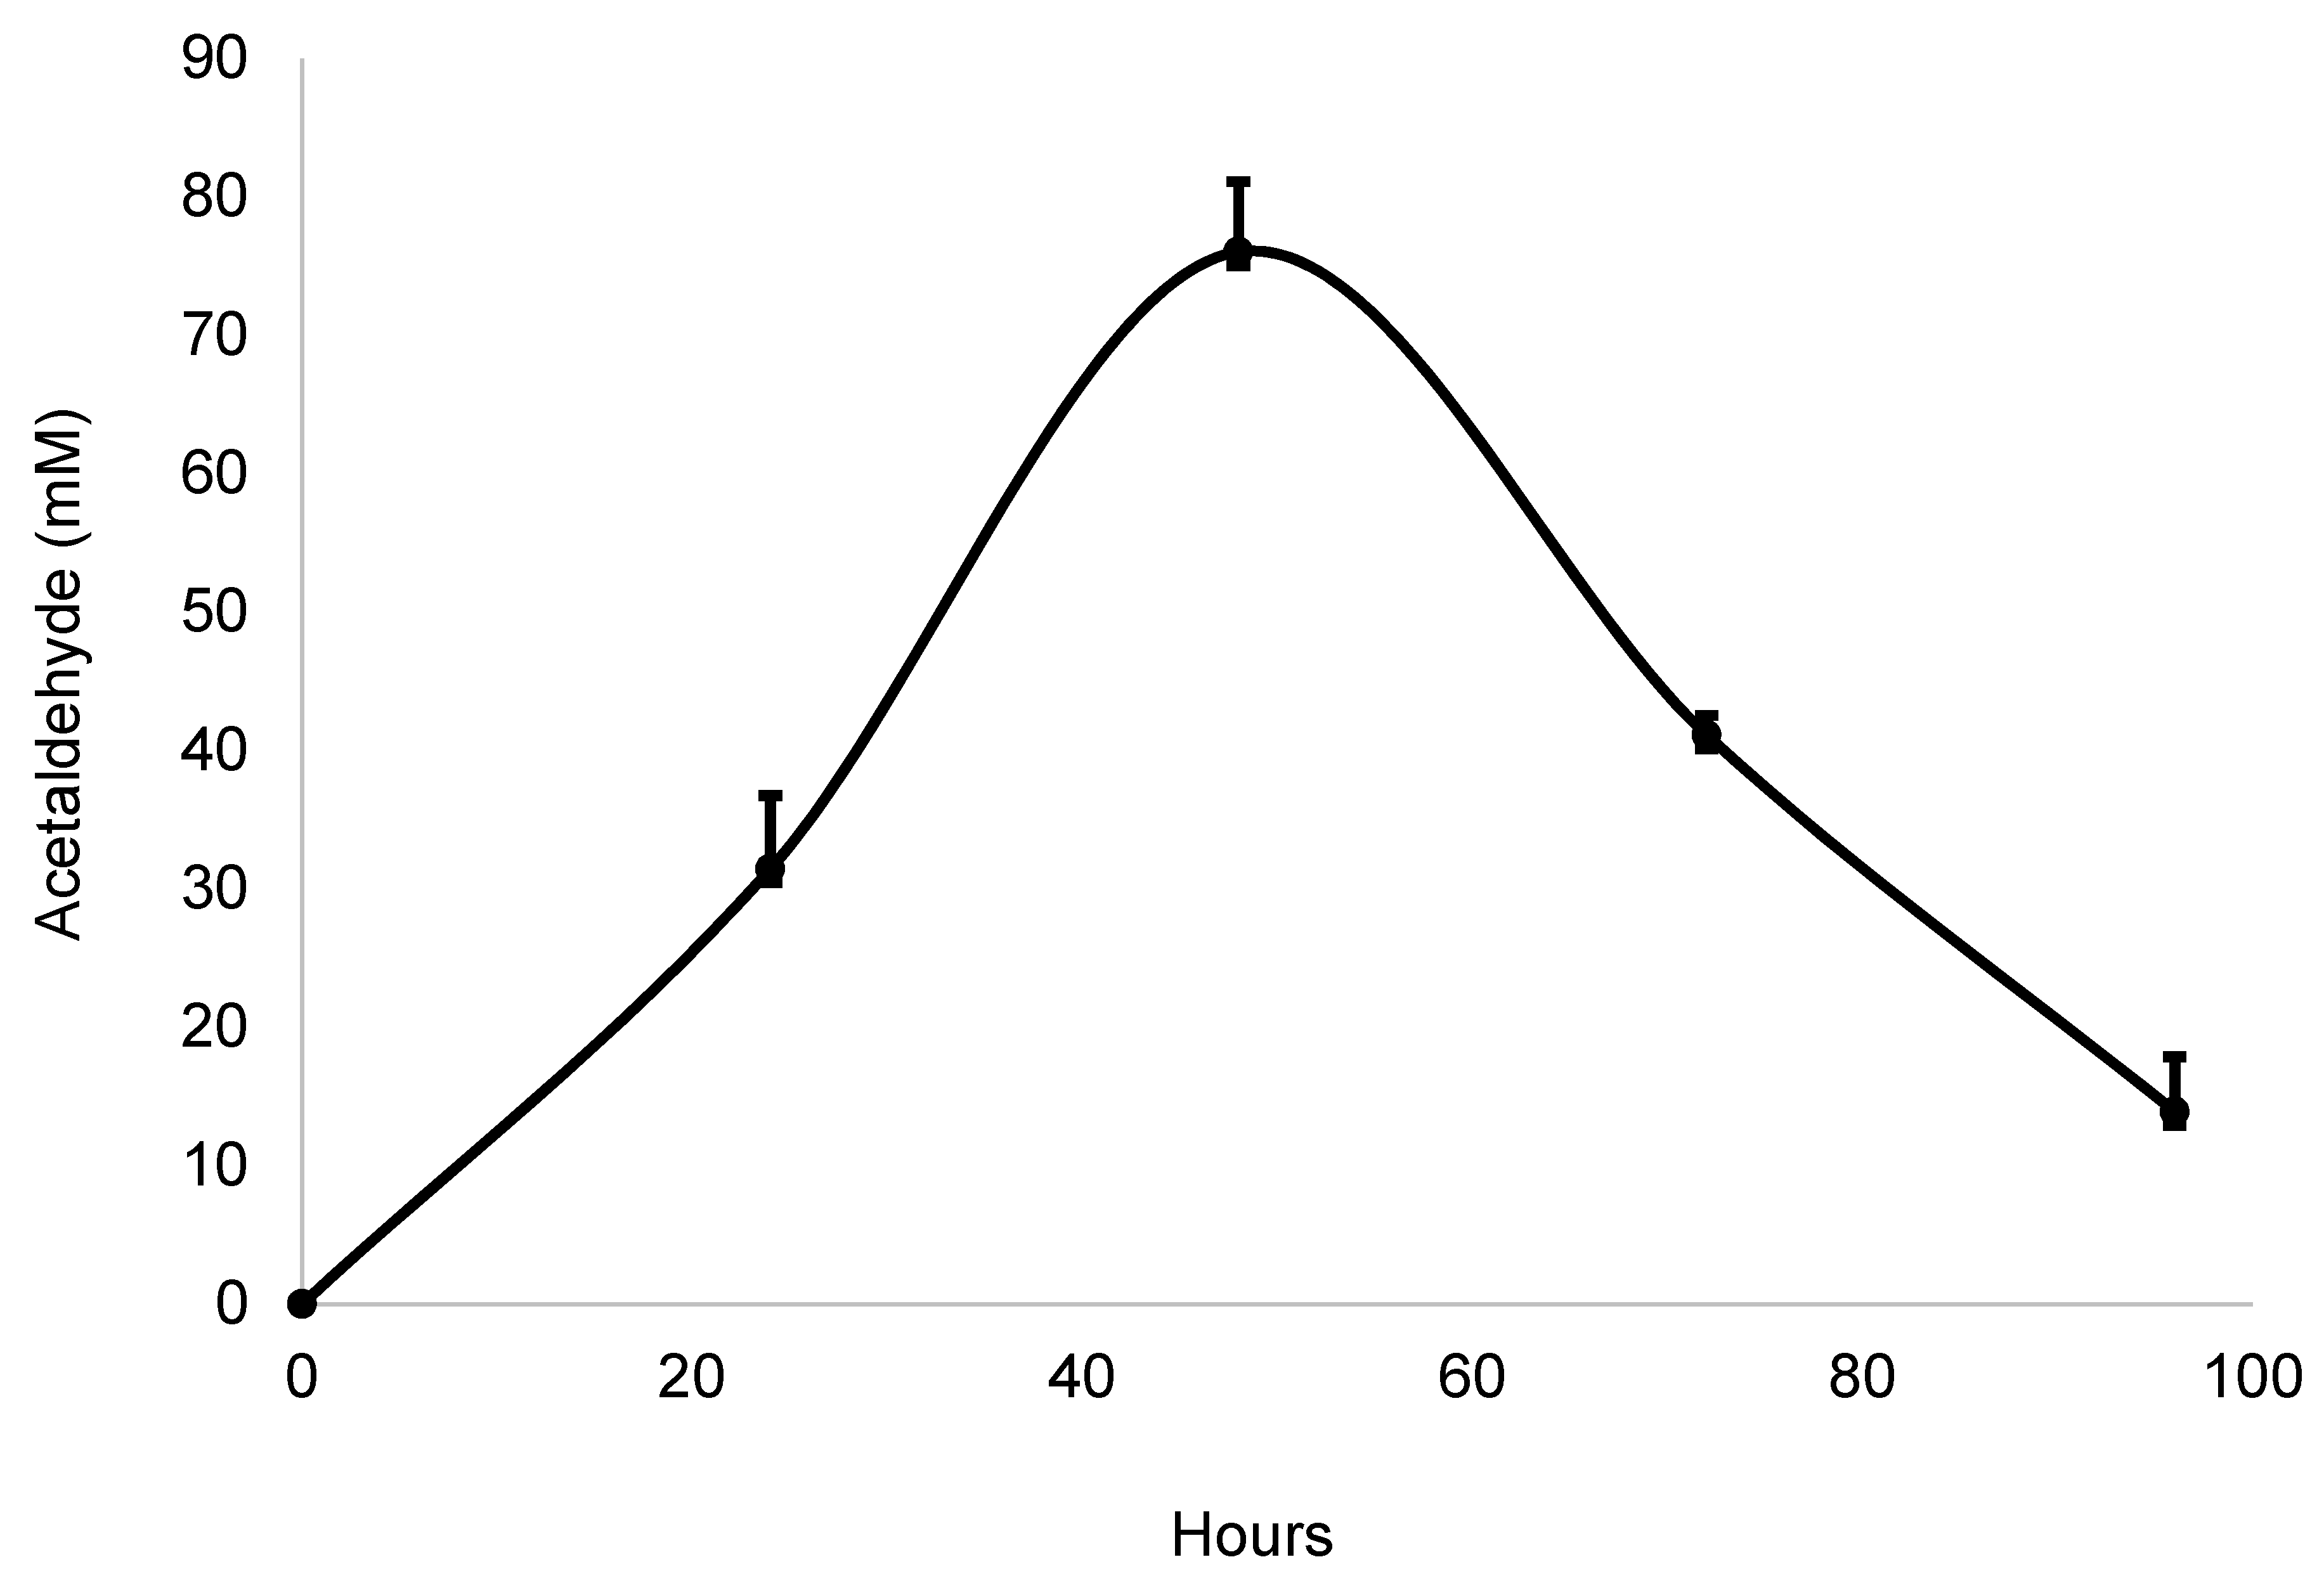
2.8. Radish Fermentation in Bioreactor

Batch fermentations of Zymomonas mobilis were carried out in American Type Culture Collection (ATCC) medium #1341, which consisted of 20 g glucose, 10 g yeast extract, and 2 g dipotassium phosphate in one L of deionized water. Inoculations were prepared by transferring a single colony to 5 mL of medium and incubated overnight at 30 °C with constant agitation at 250 rpm. This seed culture was added to 500 mL of medium in a two L Applikon reactor vessel connected to a Bio console ADI 1025 and Bio controller ADI 1010 at 30 °C with constant agitation at 200 rpm and aeration. Radish peels (100 g) were added to each batch, along with a source of catechin (1.7 mM equivalent). Acetaldehyde content was measured daily over a week for each sample stored at 21 °C. After each week, the bioreactor was cleaned and sanitized in preparation for the next sample.

2.9. Distillation of Zymomonas Fermentation and Distillate Model System Formation

A Buchi Rotavapor R-114 at 40 °C was used to vacuum distill the Zymomonas mobilis fermented solution for 15 min under 28 inHg. The collected distillate was measured using the OFD-HS-SPME-GC-FID method described above. The model system contained radish extract, 1.7 mM catechin, and 70 mM pure acetaldehyde (RAC) or 70 mM acetaldehyde from the Zymomonas distillate (RD1Cat). Triplicate samples were monitored for color and chromatographic changes on days 0, 2, 4, 7, and 14. The next model system used two and five-fold higher concentrations of distillate to create samples, RD2Cat and RD5Cat. Again, triplicate samples were monitored for color and chromatographic changes on days 0, 2, 4, 7, and 14.

2.10. Statistical Analysis

Three replicates of each treatment were analyzed at each storage time using JMP Pro 13 with data expressed as mean ± standard error.

3. Results and Discussion

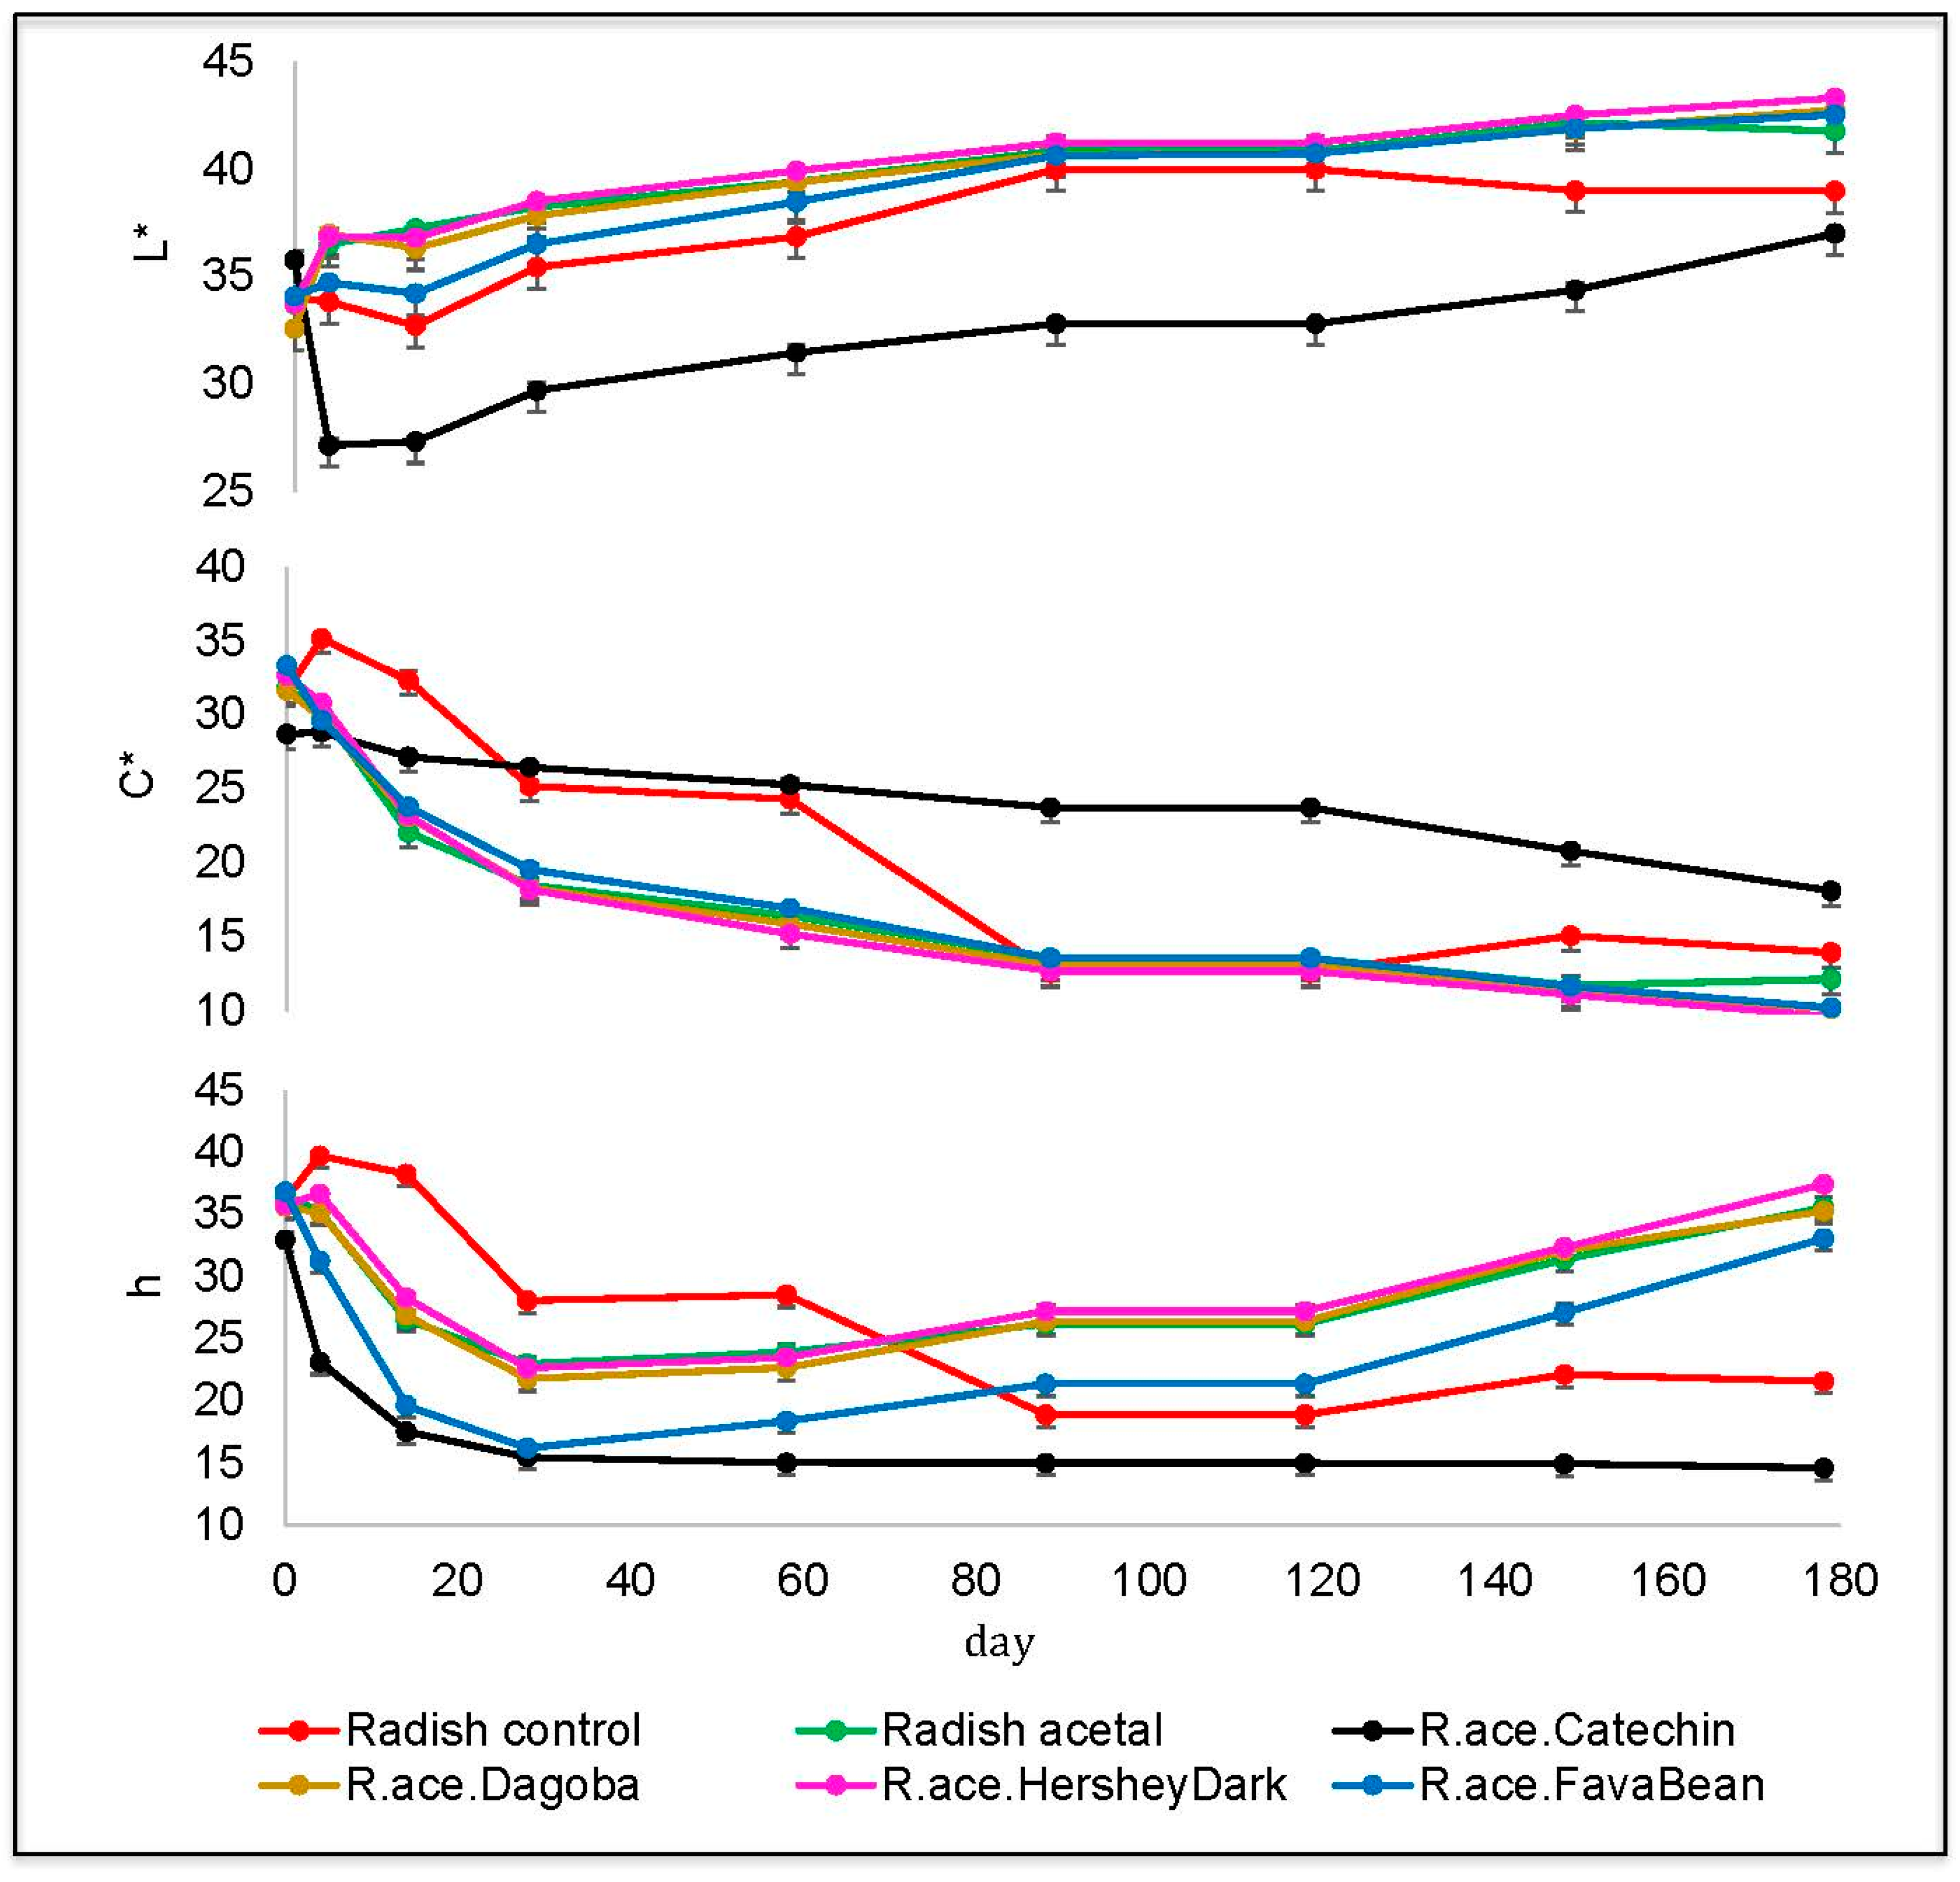
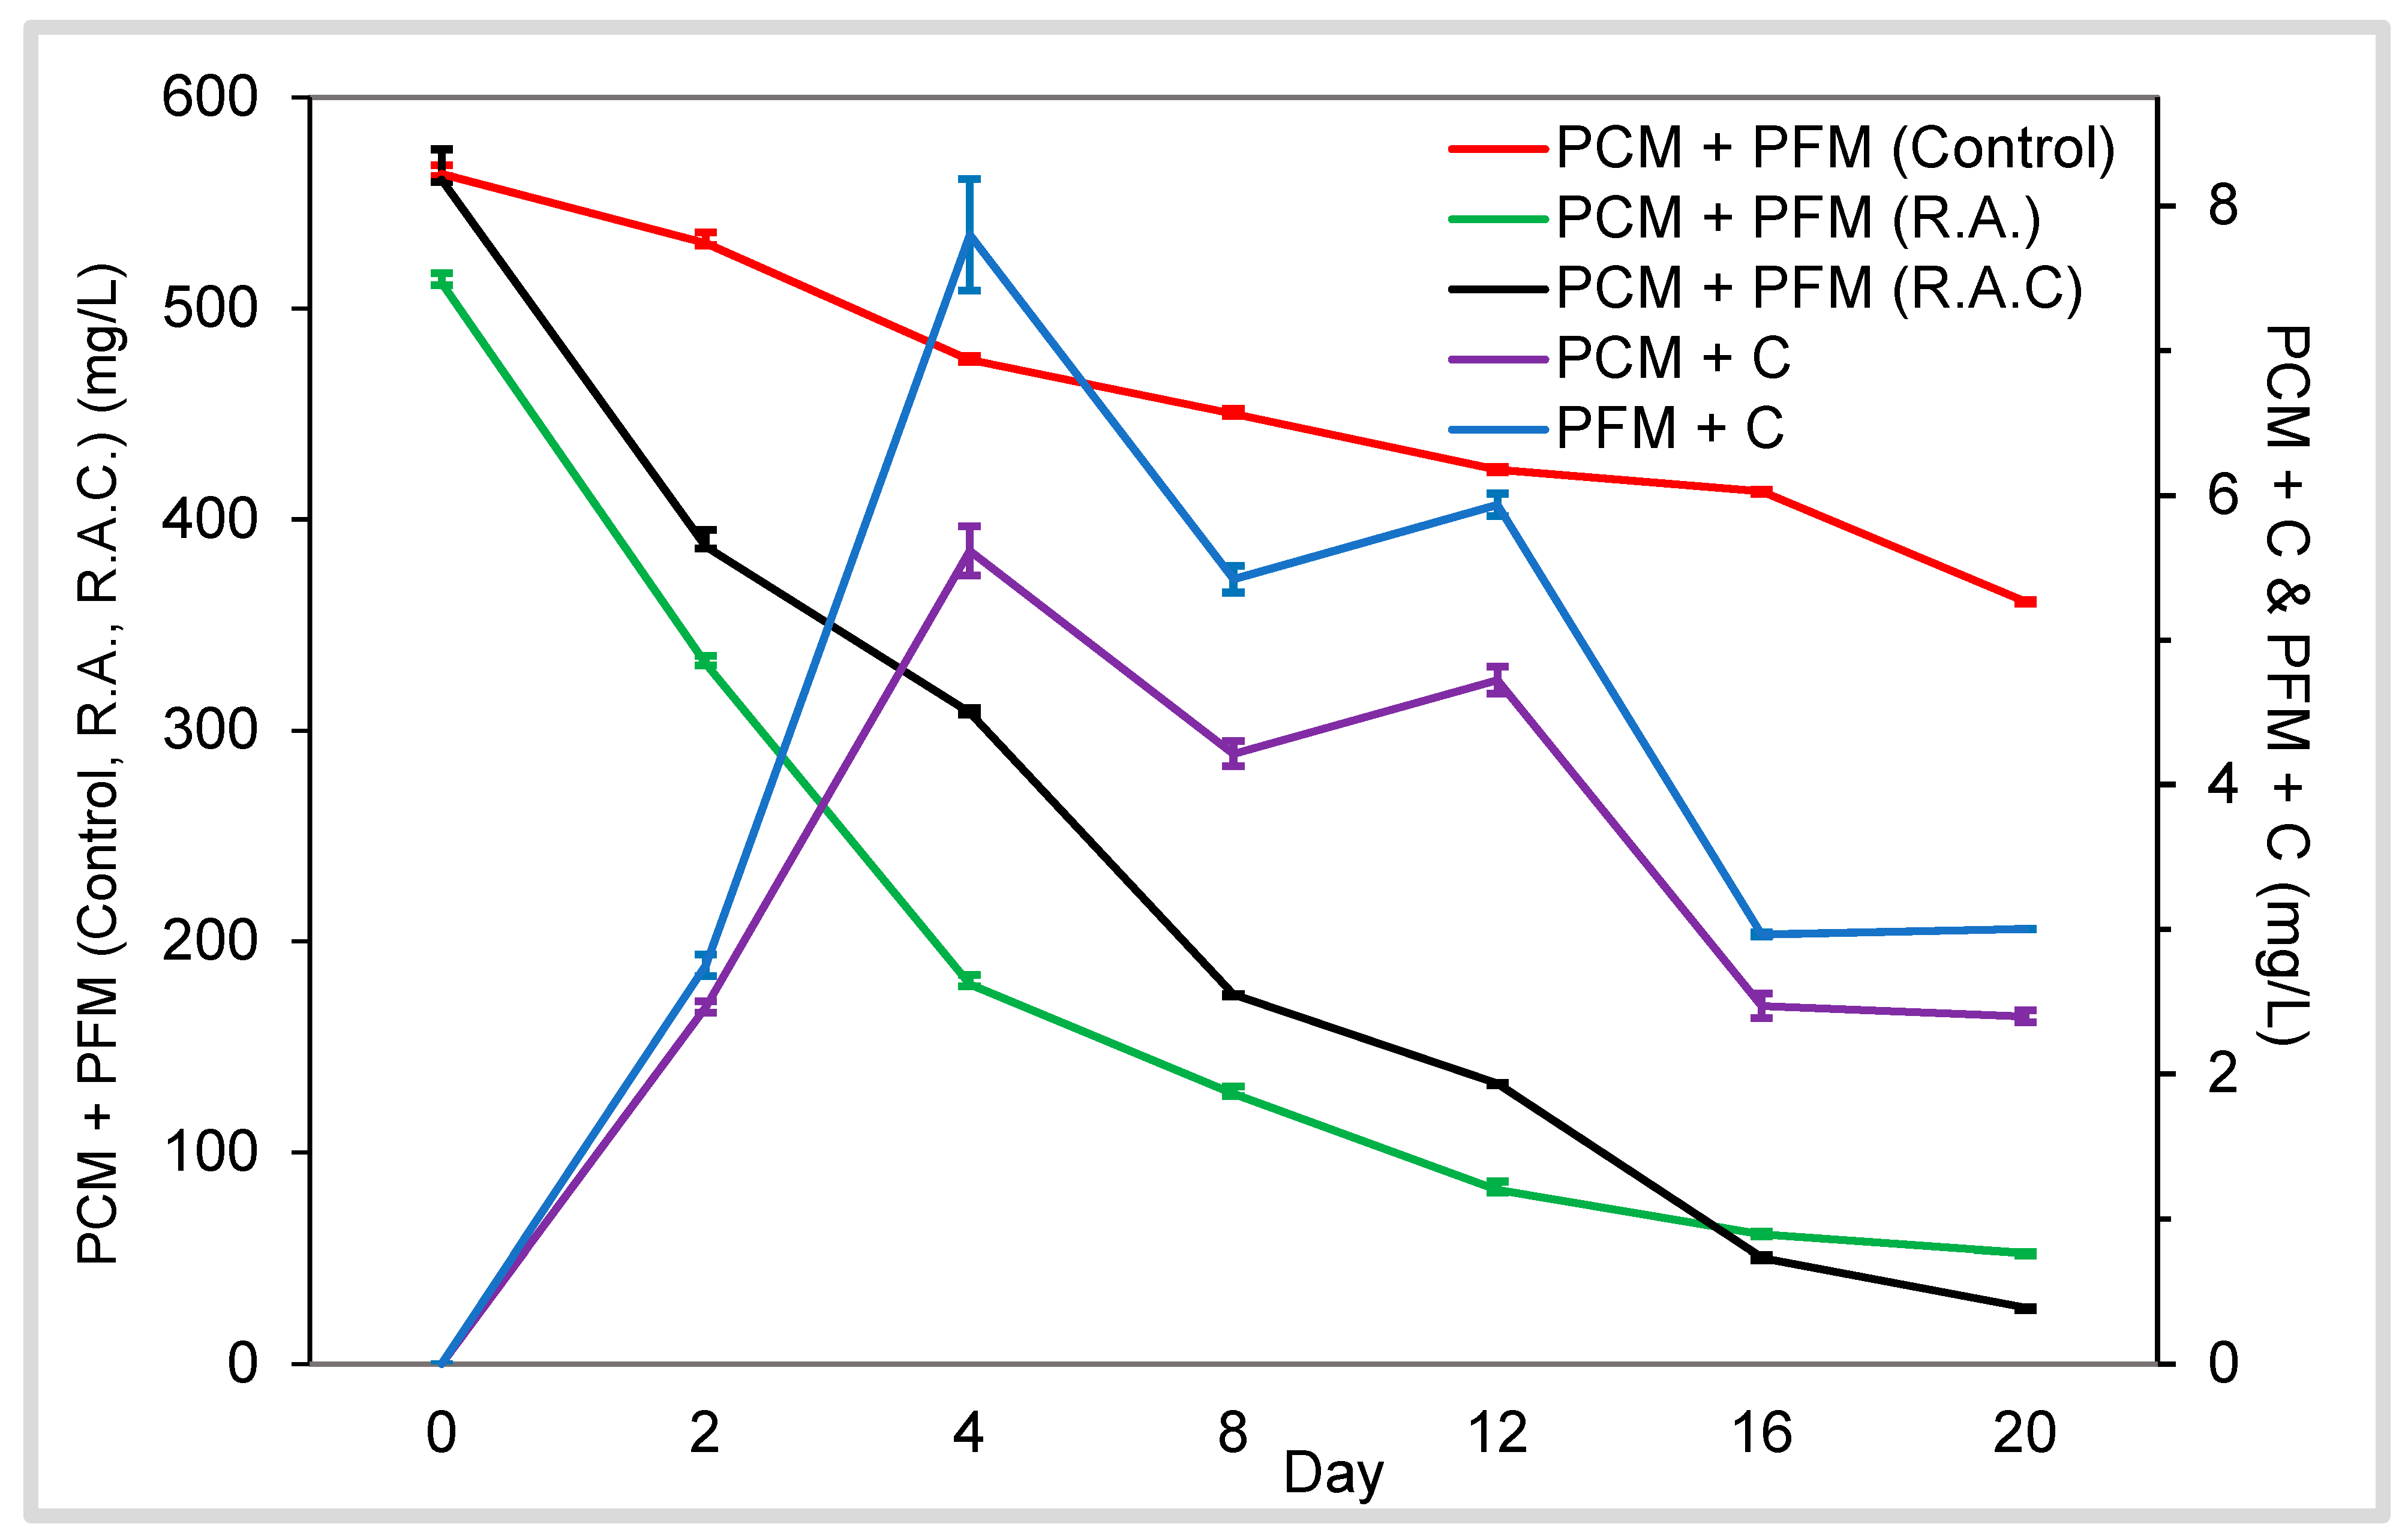
3.1. Color Properties of Radish Samples

Red radishes were used in this study since their pigments were previously reported to have comparable color properties to FD&C Red No. 40 and function as a natural replacement in maraschino cherries [10]. In this previous study, there were no significant differences among L*, a*, or b* values between FD&C Red No. 40 (200 ppm) and red radish extract at either 600 and 1200 mg/L at the initial time, but the lightness increased, while the chroma and hue decreased [10]. After matching the color properties of Red 40 (200 ppm) our radish samples exhibited similar color stability over six months of storage at 21 °C.
In Figure 2, the lightness value increased for all radish samples, which agrees with previous literature using red-fleshed potatoes and red radishes that were stored as juice concentrates (pH 3.5) at room temperature [11].
The RAC sample darkened over the first four days of storage and developed a purple hue. Consistent with this finding, ethyliden bridged oligomers of anthocyanins and catechins are reported to contribute to development of purple hues in wine and wine model systems [17,18]. Over six months of storage at 21 °C, the RAC increased in lightness and visually became a red-purple shade. The lightness of all samples with natural sources of catechin mirrored the lightness of the RA sample. This potentially indicates that the natural sources of catechin contained competing reactants for acetaldehyde, which may decrease the reactivity of acetaldehyde and halt the formation of the anthocyanin-catechin dimer.
After mixing the model system, the chroma values decreased in all samples (Figure 2). However, RAC showed a linear decline and slowest rate of decline compared to the other samples containing acetaldehyde, which quickly declined in the first month, then the rate lessened from months two through six. The radish control initially increased in chroma slightly, then gradually declined below the chroma value of RAC to the level of other acetaldehyde containing samples. This relative stability of the chroma of RAC is an important characteristic of a natural colorant and demonstrates its potential application to the beverage industry.
The hue angle of a sample provides a numerical assessment of its color. Similar to the lightness of RAC, the hue quickly decreased in the first month (Figure 2). There was no notable change in the hue of RAC for the remainder of the storage time and this stability is another important character for a potential natural colorant. The sample containing radish, acetaldehyde, and fava bean extract mirrored the RAC’s decrease in hue, but visually did not produce the same purple color, evident by the difference in lightness and chroma between these two samples. There was no visual difference between RA and other acetaldehyde-containing samples.
In agreement with our findings, an increase in lightness and a decrease in chroma was shown in red-fleshed potatoes and red radishes at pH 3.5 [11]. However, our radish control declined in hue over storage and eventually reached a plateau, which conflicts with previous results for radish samples (in juice concentrates), where hue increased toward orange/yellow [11]. The yellowing of anthocyanins over storage has been previously recognized [7].

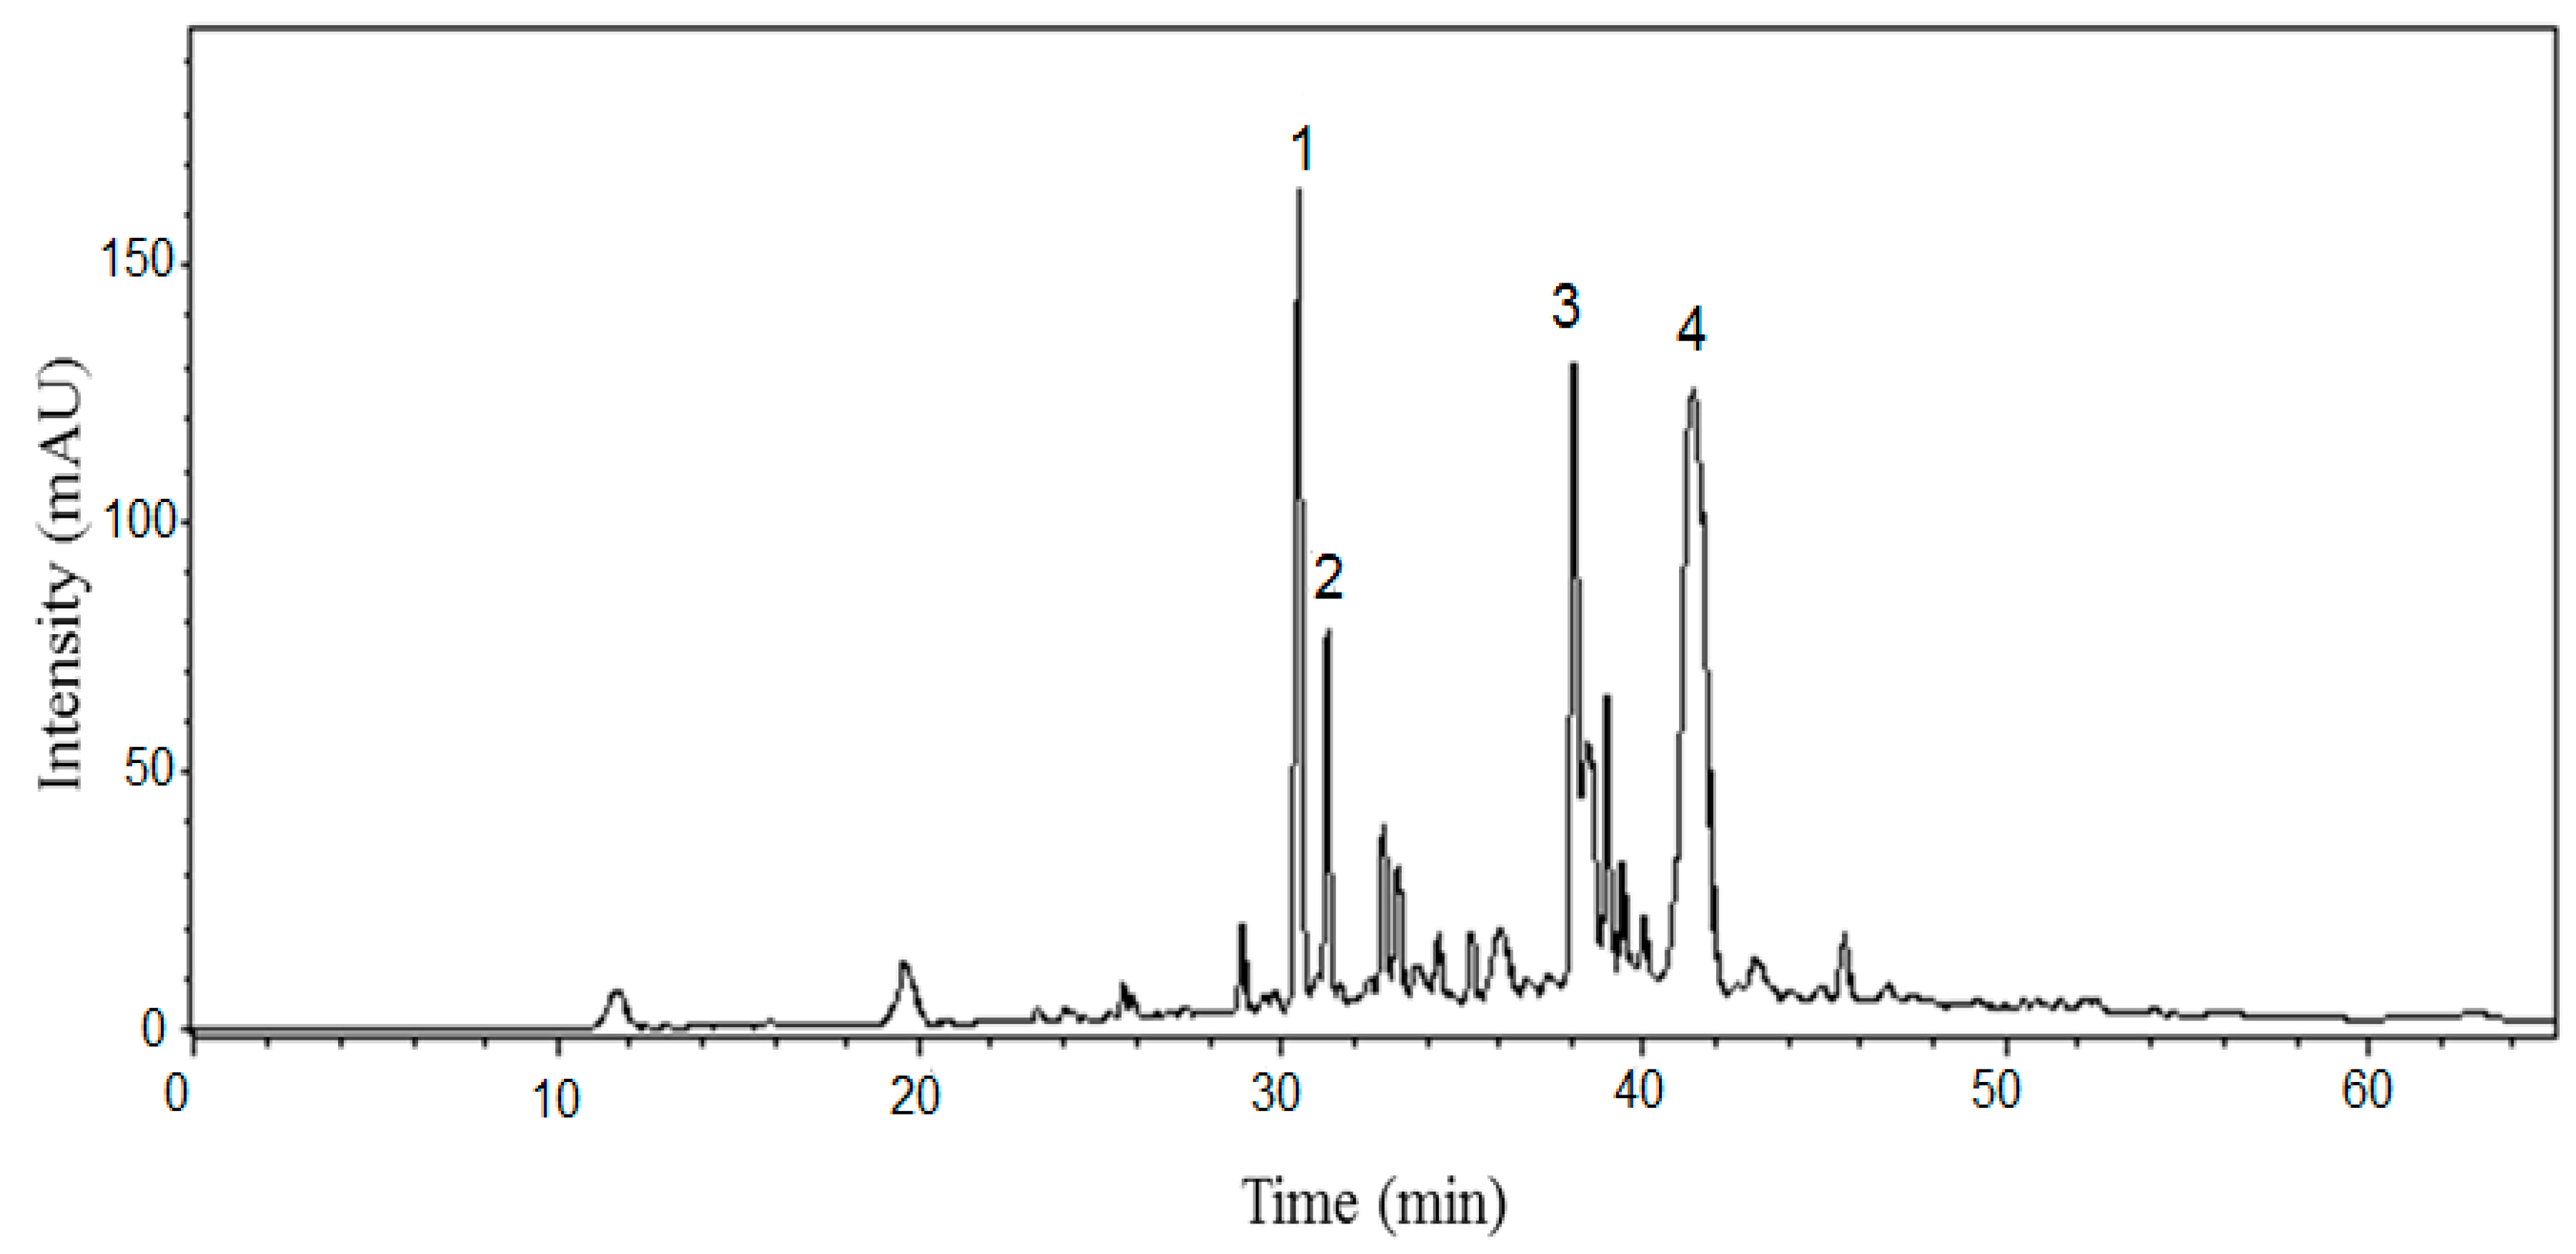
3.2. HPLC/HPLC-MS Identification and Quantification of Radish Anthocyanins and Anthocyanin-Catechin Ethyliden-Bridged Dimers over Storage

Red radish anthocyanins were first identified in the 1960’s [19,20] with predominantly pelargonidin forms, while purple radishes are composed mainly of cyanidin derivatives [21]. The major anthocyanins in red radish are pelargonidin-3-sophoroside-5-glucoside (P) with malonic acid and either ferulic (PFM) or p-coumaric acid (PCM) moieties, while the two secondary anthocyanins are P with either ferulic or p-coumaric acid [22,23]. These anthocyanins were initially characterized on a divinylbenzene HPLC column; however, our newly formed dimeric compounds were better separated on a C18 column, as they co-eluted on the divinylbenzene column. The C18 column resulted in co-elution of the two major radish anthocyanins (PFM and PCM), so neither column enabled complete separation of all anthocyanins. In Figure 3, the wide peak at 41 min contains both PCM and PFM, which are subtly differentiated by their mass spectrometric signals at the front and tail edges of the peak. PCM had a molecular ion of [M+] m/z 989, with two fragment ions m/z 741 and 519, and PFM had a molecular ion of [M+] m/z 1019 with four fragment ions m/z 975, 771, 519 and 433. These acylating moieties induce a bathochromic shift, moving the color toward red-purple depending on the acylation [24] and the stability of these anthocyanins is attributed to the phenolic acids bound to the glycosidic moieties. The sugar groups can act as hinges allowing the acyl groups to protect the flavylium cation from hydrolysis by stacking around the pyrylium ring [25].
Each of the numbered peaks in Figure 3 relates to an anthocyanin-catechin ethyliden-bridged dimer.
The proposed HPLC/MS fragmentation of peak 1 is shown in Figure 4. The molecular ion m/z 1305.4 fragmented to m/z 1015.3, corresponding to loss of catechin (−290), m/z 835.4, corresponding to loss of glucose (−180 amu), m/z 545.3, corresponding to loss of glucose minus water (−162 amu) and loss of coumaric acid minus water (−145 amu), and m/z 297.1 corresponding to loss of glucose minus water (−162 amu) and malonic acid minus water (−86 amu). The aglycone m/z of 297 corresponds to pelargonidin with a carbon-carbon double bond at C8 remaining from the ethyliden bridge. We propose the ethyl-bridged catechin is attached to the anthocyanin via C-8, although it is possible to attach at C-6 as well. Based on this fragmentation pattern the compound was tentatively identified as pelargonidin-(p-coumaroyl) diglucoside-5-(malonyl) glucoside-ethyliden-catechin (PCM+C). The proposed HPLC/MS fragmentation of peak 2 is shown in Figure 5. The molecular ion m/z 1335.4 fragmented to m/z 1045.4, corresponding to loss of catechin (−290 amu), m/z 835.5, corresponding to loss of glucose (−180 amu) and a methoxy group (OCH3) (−31 amu) from ferulic acid. This loss of OCH3 from ferulic acid results in the formation of coumaric acid. The next fragment m/z 545.2 corresponds to loss of glucose minus water (−162 amu) and coumaric acid minus water (−145 amu). The final fragment m/z 297 corresponds to loss of glucose minus water (−162 amu) and malonic acid minus water (−86 amu). Similar to the previous compound, the aglycone mass m/z of 297 corresponds to pelargonidin with a carbon-carbon double bond at C8 remaining from the ethyliden bridge. This compound was tentatively identified as pelargonidin-(feruloyl) diglucoside-5-(malonyl) glucoside-ethyliden-catechin (PFM+C). Peak 3 had identical mass spectral fragments as peak 1, and peak 4 had identical mass spectral fragments as peak 2 indicating the presence of structural isomers (data not shown). Additional NMR work will be required to confirm the identification of these novel compounds.
The change in concentration and formation of radish anthocyanins and anthocyanin-catechin bridged dimers over storage is presented in Figure 6. This figure illustrates the combined concentration of the two major anthocyanins in radishes because they co-elute using our method.
The maximum concentration of the bridged dimers was approximately 100-fold less than the starting concentration of the radish anthocyanins. The rapid degradation of anthocyanins in the presence of acetaldehyde has been shown in previous studies; however, malvidin-3-glucoside decayed precipitously in 20 h [26], as opposed to the 20 days needed for anthocyanin decay in our model system. This difference is likely due to enhanced stability caused by the acylation of radish anthocyanins. In the absence of acetaldehyde, the radish control demonstrated greater anthocyanin stability. The formation of the bridged dimers started promptly after mixing the model system. Their maximum concentration was reached four days after mixing, then slowly declined over 20 days of measurement. A similar concentration pattern of bridged dimers was shown using malvidin, delphinidin, and petunidin monoglucosides [17]. These dimers reached maximum concentration around 12 h after mixing, then decreased within 48 h [17]. The authors detected and quantified oligomeric compounds from the monoglucosides, which followed a similar concentration profile, but offset six hours.
To examine the oligomeric and polymeric products of the acetaldehyde-catalyzed reaction, radish samples were stored for one, four and 12 months. Samples from the time course study were purified by Sephadex LH-20 solid phase extraction and the compounds were separated on a C18 HPLC column. Sephadex LH-20 is a unique sorbent known for purifying polymeric phenolic compounds [14]. The chromatogram changed dramatically before (Figure 3) and after (Figure 7A) Sephadex LH-20 purification. A large hump featured in chromatograms of samples stored for one, four, and 12 months of storage (Figure 7A–C) remained through one year of storage, although the size of the hump decreased over time. However, the hue is stable throughout storage, so it is difficult to understand the source of pigment stability.
Mass spectrometry was used to identify the compounds within the polymeric hump. The RAC samples stored for one, four, and 12 months at 21 °C were analyzed by HPLC-ESI-MS to determine if the pigment was derived from molecules whose size is less than 2000 Da, which would include a radish anthocyanin with up to three ethyliden-bridged catechins. The mass spectra of the two peaks at 42 and 46 min emerging from the hump did not produce any identifiable m/z values. In the middle of the hump, an m/z value of 1937.1 (PFM+3C) was detected. However, there was only a single m/z peak without any isotopic peaks, so this is simply a noise peak and should not be considered. Unfortunately, there were no true peaks (with isotopic peaks) detected over 1500 Da despite a chromatographic hump being present in the samples through the year-long storage.

3.3. MALDI-TOF-MS Analysis of Radish Extracts over Storage

It is possible that polymeric compounds were larger than 2000 Da and could not be detected by the HPLC-ESI-MS, so MALDI-TOF-MS was used to seek larger pigmented molecules. Figure S1 displays the spectrum of the RAC sample stored for one month and no m/z values were detected over 1000 Da. Figure S2 and Figure S3 show the MALDI-TOF-MS spectra for the RAC sample stored for four and 12 months, respectively. Once again, these spectra do not contain any m/z values greater than 1000 Da. This result aligns with the HPLC-ESI-MS data and may indicate the polymeric compounds are present at too low of a concentration to be detected. Consequently, the RAC sample stored for one month was fractionated by HPLC and samples were collected each minute. The fractions were concentrated by evaporating to dryness and dissolving in a small volume of methanol prior to MALDI-TOF-MS analysis. The majority of the fractions did not have any m/z values greater than 1000 Da; however, one fraction (Figure S4) revealed several peaks over 1000 Da. Figure S4 displays the forty-third fraction, which eluted in the middle of the chromatographic hump, with m/z 1133.6 and 1368.6 as two of the primary peaks. Neither of these masses aligned with radish anthocyanins with any degree of ethyliden-bridged catechins and were not identified. However, the signals detected at m/z 933.4 and 1005.4 reflect the presence of pelargonidin-3-(feruloyl) diglucoside-5-glucoside and pelargonidin-(caffeoyl)-diglucoside-5-(malonyl) glucoside, respectively that have previously been reported in red radishes [23]. The source of the long-term pigment in the radish mixture remains to be identified even though visual color and color data is stable over storage.

3.4. Zymomonas Mobilis Fermentatio

Zymomonas mobilis, a high acetaldehyde-producing bacterium was used to naturally produce acetaldehyde in an effort to form bridged dimers. This bacterium also produced notable quantities of ethanol, which aided anthocyanin extraction from radish peels into the media. Pure catechin and equivalent concentrations of natural sources of catechin were added to radish peels in the growing media to be fermented by Z. mobilis. Taking into account the yellow-brown color of the media, the purple hue of the bridged dimers never appeared and HPLC data confirmed this finding. To determine the possible effect of the bacteria on the reaction, the same model system was created using radish extract, pure acetaldehyde, and pure catechin in water and in media and monitored via HPLC for 20 days. The dimers were detected in the water-based model system, but not in the media-based system. We suspect that components of the media scavenged acetaldehyde before it could react with the anthocyanins.
Next, the volatile fraction of Z. mobilis growth was collected (in the absence of radish peels and catechin) and the acetaldehyde-containing distillate was used in a model system. Z. mobilis produced a maximum concentration of acetaldehyde after 48 h of growth (Figure 8) and the fermented solution was distilled at this time. The concentration of acetaldehyde declined over the following 48 h due to depletion of glucose, and the decline of Z. mobilis growth. If the medium were restocked with glucose on a daily basis, the acetaldehyde content would remain at its maximum [27].
A model system of radish extract, catechin, and Z. mobilis distillate (RD1Cat) was prepared with the same concentration of acetaldehyde as previous model systems and monitored over two weeks for color change and HPLC detection of dimeric compounds. Figure 9A shows color data for this model system with the RAC sample reacting to form the purple hue. However, the radish control and RD1Cat were identical and no purple color appeared. Chromatograms (not shown) of the radish control and RD1Cat were indistinguishable and confirmed that no dimeric ethyliden-bridged anthocyanins were formed. Although the concentration of acetaldehyde was identical between RAC and RD1Cat samples, it is unclear as to why the dimeric compounds were not formed. A follow-up experiment used higher concentrations of Z. mobilis distillate in samples RD2Cat and RD5Cat with two and five times the concentration of acetaldehyde compared to RD1Cat, respectively. The results followed the same pattern as the first distillate model system. Color changes over two weeks of storage are shown in Figure 9B. The color values were slightly different then the first distillate model system due to use of a different batch of radishes. Although the values were different, a similar trend was observed, indicating the higher concentrations of acetaldehyde did not produce a purple pigment. This was confirmed by the lack of dimeric radish anthocyanins detected by HPLC.

4. Conclusions

Radishes are an inexpensive source of acylated anthocyanins that can be used in a reaction found in wine production in order to produce dimeric compounds that could serve as natural colorants in foods and beverages. This is the first evidence of customizing the acetaldehyde-catalyzed reaction in an acylated anthocyanin source. Radish extract combined with pure acetaldehyde and catechin produced dimeric compounds with a stable red-purple color. Z. mobilis was used to naturally produce acetaldehyde in a fermentation with radishes and natural sources of catechin; however, the dimeric compounds were not formed. This reaction can be expanded to other acylated anthocyanin sources in an effort to produce natural colorants for the food and beverage industries. The ethyl-bridged anthocyanins have a remarkably stable hue over six months of ambient storage and show potential as a replacement for artificial color additives.

Supplementary Materials

The following are available online at https://0-www-mdpi-com.brum.beds.ac.uk/2306-5710/5/4/64/s1, Figure S1: MALDI-TOF-MS spectrum of RAC sample after Sephadex LH-purification stored one month at 21 °C. RAC = radish extract + acetaldehyde (70 mM) + catechin (1.7 mM); Figure S2: MALDI-TOF-MS spectrum of RAC sample after Sephadex LH-20 purification stored four months at 21 °C. RAC = radish extract + acetaldehyde (70 mM) + catechin (1.7 mM); Figure S3: MALDI-TOF-MS spectrum of RAC sample after Sephadex LH-20 purification stored 12 months at 21 °C. RAC = radish extract + acetaldehyde (70 mM) + catechin (1.7 mM); Figure S4: MALDI-TOF-MS spectrum of HPLC fraction 43 of RAC sample after Sephadex LH-20 purification stored one month at 21 °C. RAC = radish extract + acetaldehyde (70 mM) + catechin (1.7 mM).

Author Contributions

Conceptualization, L.R.H. and R.L.P.; Methodology, N.B.S., C.B., R.L., J.O.L.; Writing-original draft, N.B.S., L.R.H.

Funding

This research received no external funding.

Acknowledgments

This study was based upon work that was supported in part, by the United States Department of Agriculture National Institute of Food and Agriculture Hatch Project 1003781.

Conflicts of Interest

The authors declare no conflict of interest.

References

  1. Feingold, B.F. Hyperkinesis and learning disabilities linked to the ingestion of artificial food colors and flavors. J. Learn. Disabil. 1976, 9, 551–559. [Google Scholar] [CrossRef]
  2. Stintzing, F.C.; Carle, R. Functional properties of anthocyanins and betalains in plants, food, and in human nutrition. Trends Food Sci. Technol. 2004, 15, 19–38. [Google Scholar] [CrossRef]
  3. Timberlake, C.F.; Bridle, P. Interactions between anthocyanins, phenolic compounds, and acetaldehyde and their significance in red wines. Am. J. Enol. Vitic. 1976, 27, 97–105. [Google Scholar]
  4. Francia-Aricha, E.M.; Guerra, M.T.; Rivas-Gonzalo, J.C.; Santos-Buelga, C. New anthocyanin pigments formed after condensation with flavanols. J. Agric. Food Chem. 1997, 45, 2262–2266. [Google Scholar] [CrossRef]
  5. Drinkine, J.; Lopes, P.; Kennedy, J.A.; Teissedre, P.; Saucier, C. Ethylidene-bridged flavan-3-ols in red wine and correlation with wine age. J. Agric. Food Chem. 2007, 55, 6292–6299. [Google Scholar] [CrossRef]
  6. Morata, A.; Calderón, F.; González, M.C.; Gómez-Cordovés, M.C.; Suárez, J.A. Formation of the highly stable pyranoanthocyanins (vitisins A and B) in red wines by the addition of pyruvic acid and acetaldehyde. Food Chem. 2007, 100, 1144–1152. [Google Scholar] [CrossRef]
  7. Cevallos-Casals, B.A.; Cisneros-Zevallos, L. Stability of anthocyanin-based aqueous extracts of Andean purple corn and red-fleshed sweet potato compared to synthetic and natural colorants. Food Chem. 2004, 86, 69–77. [Google Scholar] [CrossRef]
  8. Eiro, M.J.; Heinonen, M.A. Anthocyanin color behavior and stability during storage: Effect of intermolecular copigmentation. J. Agric. Food Chem. 2002, 50, 7461–7466. [Google Scholar] [CrossRef] [PubMed]
  9. Malien-Aubert, C.; Dangles, O.; Amiot, M.J. Color stability of commercial anthocyanin-based extracts in relation to the phenolic composition. Protective effects by intra- and intermolecular copigmentation. J. Agric. Food Chem. 2001, 49, 170–176. [Google Scholar] [CrossRef]
  10. Giusti, M.M.; Wrolstad, R.E. Radish anthocyanin extract as a natural colorant for maraschino cherries. J. Food Sci. 1996, 61, 688–694. [Google Scholar] [CrossRef]
  11. Rodriguz-Saona, L.E.; Giusti, M.M.; Wrolstad, R.E. Color and pigment stability of red radish and red-fleshed potato anthocyanins in juice model systems. J. Food Sci. 1999, 64, 451–456. [Google Scholar] [CrossRef]
  12. Stebbins, N.B.; Howard, L.R.; Prior, R.L.; Brownmiller, C.; Liyanage, R.; Lay, J.O.; Yang, X.; Qian, S.Y. Ascorbic acid-catalyzed degradation of cyanidin-3-O-β-glucoside: Proposed mechanism and identification of a novel hydroxylated product. J. Berry Res. 2016, 6, 175–187. [Google Scholar] [CrossRef]
  13. Cho, M.J.; Howard, L.R.; Prior, R.L.; Clark, J.R. Flavonoid glycosides and antioxidant capacity of various blackberry, blueberry, and red grape genotypes determined by high-performance liquid chromatography/mass spectrometry. J. Sci. Food Agric. 2004, 84, 1771–1782. [Google Scholar] [CrossRef]
  14. Kantz, K.; Singleton, V.L. Isolation and determination of polymeric polyphenols using Sephadex LH-20 and analysis of grape tissue extracts. Am. J. Enol. Vitic. 1990, 41, 223–228. [Google Scholar]
  15. Wang, Q.; O’Reilly, J.; Pawliszyn, J. Determination of low-molecular mass aldehydes by automated headspace solid-phase microextraction with in-fibre derivatisation. J. Chromatogr. A 2005, 1071, 147–154. [Google Scholar] [CrossRef]
  16. Carlton, W.K.; Gump, B.; Fugelsang, K.; Hasson, A.S. Monitoring acetaldehyde concentrations during micro-oxygenation of red wine by headspace solid-phase microextraction with on-fiber derivatization. J. Agric. Food Chem. 2007, 55, 5620–5625. [Google Scholar] [CrossRef]
  17. Weber, F.; Winterhalter, P. Synthesis and structure elucidation of ethyliden-linked anthocyanin-flavan-3-ol oligomers. Food Res. Int. 2014, 65, 69–76. [Google Scholar] [CrossRef]
  18. Duenas, M.; Salas, E.; Cheynier, V.; Dangles, O.; Fulcrand, H. UV-visible spectroscopic investigation of the 8,8 methylmethine catechin-malvidin 3-glucoside pigments in aqueous solution: Structural transformations and molecular complexation with chlorogenic acid. J. Agric. Food Chem. 2006, 54, 189–196. [Google Scholar] [CrossRef]
  19. Harborne, J.B. Plant polyphenols IX: The glycosidic pattern of anthocyanin pigments. Phytochemistry 1963, 2, 85–97. [Google Scholar] [CrossRef]
  20. Fuleki, T. The anthocyanins of strawberry, rhubarb, radish, and onion. J. Food Sci. 1969, 34, 365–369. [Google Scholar] [CrossRef]
  21. Hanlon, P.R.; Barnes, D.M. Phytochemical composition and biological activity of 8 varieties of radish (Raphanus sativus L.) sprouts and mature taproots. J. Food Sci. 2011, 76, C185–C192. [Google Scholar] [CrossRef] [PubMed]
  22. Giusti, M.M.; Wrolstad, R.E. Characterization of red radish anthocyanins. J. Food Sci. 1996, 61, 322–326. [Google Scholar] [CrossRef]
  23. Wu, A.; Prior, R.L. Identification and characterization of anthocyanins by high-performance liquid chromatography-electrospray ionization-tandem mass spectrometry in common foods in the United States: Vegetables, nuts and grains. J. Agric. Food Chem. 2005, 53, 3101–3113. [Google Scholar] [CrossRef] [PubMed]
  24. Dangles, O.; Saito, N.; Brouillard, R. Anthocyanin intramolecular copigment effect. Phytochemistry 1993, 34, 119–124. [Google Scholar] [CrossRef]
  25. Brouillard, R. Origin of the exceptional colour stability of Zebrina anthocyanin. Phytochemistry 1981, 20, 143–145. [Google Scholar] [CrossRef]
  26. Garcia-Viguera, C.; Bridle, P.; Bakker, J. The effect of pH on the formation of coloured compounds in model solutions containing anthocyanins, catechin, and acetaldehyde. Vitis 1994, 33, 37–40. [Google Scholar]
  27. Roy, A.; Mukherjee, R.P.; Howard, L.; Beitle, R. Bio-based extraction and stabilization of anthocyanins. Biotechnol. Prog. 2016, 32, 601–605. [Google Scholar] [CrossRef]
Figure 1. Flow diagram illustrating the experiments used to create and identify a novel ethyliden-bridged acylated anthocyanin with a stable violet color from red radishes in the presence of acetaldehyde and catechin. R = radish extract, RA = radish extract + acetaldehyde (70 mM), RAC = radish extract + acetaldehyde (70 mM) + catechin (1.7 mM).
Beverages 05 00064 g001
Figure 2. Changes in L*C*h color values of radish model system samples over six months of storage at 21 °C. Bars represent standard error of the mean (n = 3). RA = radish extract + acetaldehyde (70 mM), RAC = radish extract + acetaldehyde (70 mM) + catechin (1.7 mM), R.ace.FavaBean = radish extract + acetaldehyde (70 mM) + FavaBean extract (1.7 mM catechin equivalents), R.ace.HersheyDark = radish extract + acetaldehyde (70 mM) + HersheyDark chocolate extract (1.7 mM catechin equivalents), R.ace.Dagoba = radish extract + acetaldehyde (70 mM) + Dagoba cocoa extract (1.7 mM catechin equivalents).
Beverages 05 00064 g002
Figure 3. HPLC chromatogram (510 nm) of radish model system supplemented with acetaldehyde and catechin (Numbered peaks are anthocyanin-catechin ethyl-bridged compounds).
Beverages 05 00064 g003
Figure 4. LC-ESI-MS spectra and tentative structural elucidation of pelargonidin-(p-coumaroyl) diglucoside-5-(malonyl) glucoside-8-ethyliden-catechin (PCM+C).
Beverages 05 00064 g004
Figure 5. LC-ESI-MS spectra and tentative structural elucidation of pelargonidin-(p-feruloyl) diglucoside-5-(malonyl) glucoside-8-ethyliden-catechin (PFM+C).
Beverages 05 00064 g005
Figure 6. Changes in anthocyanin content of radish model system samples over 21 days of storage at 21 °C. Bars represent standard error of the mean (n = 3). Control = radish extract; RAC = radish extract + acetaldehyde (70 mM) + catechin (1.7 mM); RA = radish extract + acetaldehyde (70 mM); PCM + C = pelargonidin-(p-coumaroyl) diglucoside-5-(malonyl) glucoside-8-ethyl-catechin; PFM + C = pelargonidin-(p-feruloyl) diglucoside-5-(malonyl) glucoside-8-ethyl-catechin.
Beverages 05 00064 g006
Figure 7. Chromatogram (510 nm) of LH-20 purified radish model system supplemented with acetaldehyde and catechin samples after one (A), four (B), and 12 months (C) of storage at 21 °C.
Beverages 05 00064 g007
Figure 8. Time course production of acetaldehyde from Zymomonas mobilis. Bars represent standard error of the mean (n = 3).
Beverages 05 00064 g008
Figure 9. Changes in L*C*h color values of radish samples supplemented with Zymomonas distillate containing 70 mM acetaldehyde (A), and two and five times the concentration of distilled-derived acetaldehyde (B) over 14 days of storage at 21 °C. Bars represent standard error of the mean (n = 3). Radish control = radish extract; RAC. = radish extract + acetaldehyde (70 mM) + catechin (1.7 mM); RD1Cat = radish extract + acetaldehyde (70 mM) from Zymomonas distillate + catechin (1.7 mM); RD2Cat = radish extract + acetaldehyde (140 mM) from Zymomonas distillate + catechin (1.7 mM); RD5Cat = radish extract + acetaldehyde (350 mM) from Zymomonas distillate + catechin (1.7 mM).
Beverages 05 00064 g009

