1. Introduction
Certain varieties of grape are more likely than others to generate wine “minerality” imprint, such as the internationally known whites Riesling, Chardonnay, Chenin Blanc, Sauvignon Blanc, Grüner Veltliner and Albariño, among others, and Syrah and Carignan red wines and, to a lesser extent, Cabernet Franc, Merlot, Cabernet Sauvignon and others such as Nebbiolo and Barbera. Among all these wines, some common aspects can be found when they express “minerality”: when they are grown in a cold environment and/or marginal climates, harvested in early vintages avoiding over-ripeness, have high acidity or are made through reductive winemaking with a generous dose of sulfur dioxide. They generally tend to be wines with a “single vineyard” profile, potentially seeking to reflect the expression of a terroir. However, it is not exclusive to these “cuvées”, since nowadays there are mass production wines in the market at popular prices, produced in different countries from around the world that also reveal a sensory profile with a mineral character. In many cases, they tend to be dry white wines with high acidity and a relevant low fruity aromatic profile. In most cases, the leading market influencers and consumers interpret this perception as a value of intangible quality that praises the hedonic and economic value of the wine [
1,
2].
There is no doubt that the quality that the term “minerality” in wines transmits is certainly one of the most mysterious attributes from the chemical and sensory point of view. Little was known until now, since no thorough studies had been made before on how certain chemical compounds can affect the description of the term “minerality” by the taster and the consumer. As previously mentioned, “minerality” in wines is often associated with the ”terroir” concept, often with clear commercial purposes where the expression linked to the soil allows you to justify or argue the authenticity of the wine’s origin, with examples of labels in the market that clearly convey this message with associative images and names. It would therefore be easy to link the term “minerality” to the composition and content of minerals that are present in a wine, even though there are no scientific studies to support this direct association [
3].
This study is the corollary of a prior, already published research paper, “Chemical basis of mineral character at olfactory and gustatory level in white and red wines”, and it aims to verify the hypothesis that certain chemicals and not essentially the metal content are responsible for the use of the attribute “minerality” in wine. This paper concludes by mentioning the chemicals associated with the term “minerality” and proposes predictive mathematical algorithms against the renowned term.
It is widely known that there is a huge list of descriptors in the wine world to articulate the qualities, types, and styles of wines at the sensory level. Undoubtedly, the use of the term “minerality” has become very popular in the 21st century and is much used by producers, distributors, and particularly by tasters and famous gurus as a relevant indicator of difference and distinction between wines, especially among high-end and high price labels. Referring to “minerality” in the description of a wine entails endowing it with greater potential sensory and commercial value.
Over the last decade, the impact of the interpretation of this term has become internationally important. There is a strong need to find the possible causes and the origin of the association of the term “minerality” with the presence of odoriferous volatile compounds, certain minerals or other aromatic or sapid substances that may come from the soil, the metabolism of the plant itself or as a result of enological treatments applied in the winery.
The lack of a clear, well-argued definition of the term “minerality” has itself become a drawback of this powerful term. This has given rise to the enigmatic division between those who define themselves as “mineralist” who often match the “pro-terroir” profile, and those who are defined as “anti-mineralist”, who, in turn, also tend to be skeptical about the very concept of “terroir”, perhaps the most powerful marketing term for the wine industry.
The final aim of this study is to examine the possible association of the chemical composition of wine and its sensory attributes with the “minerality” of wine, and to use these elements as variables that are part of predictive mathematical formulas for evaluating the potential mineral character of the wine.
2. Materials and Methods
2.1. Sample Characterization
Seventeen commercial wines were used, including white and red wines from different vintages and worldwide winemaking regions. For the selection of the wines, a specialized press investigation was carried out in order to choose wines that would have been described as “mineral”. For this, reviews sourced from specialized magazines (The Wine Advocate, Wines and Spirits, Wines & Vines, etc.) were used. Similarly, preference was given to those wine regions identified as “mineral” regions by specialized magazines from the sector (
http://www.thewinesociety.com/society-news-and-views-regular-features-opinion-mineral-wines).
Eleven white wines and six red wines were chosen. The description of the wines used in the study is detailed in
Table 1.
2.2. Sensory Analysis
In order to carry out the sensory part of the study, two tasting panels were trained in accordance with the Asociación Española de Estandarización (UNE) 87024-2. One of them, located in Barcelona, formed by 10 professional judges from the wine export sector not specialized in winemaking, and a second panel located in La Rioja formed by 12 students of oenology. The panels were recruited in two ways: the panel from the University of La Rioja was trained for one year by following the program of the sensory analysis course that is part of the University’s degree in Enology. The panel of winemakers from La Rioja was made up of sensory judges aged between 22 and 36 (61% women and 39% men). In the case of the panel of exporters in Barcelona, this was composed of sensory judges aged between 35 and 48 (72% men and 28% women).
The judges from the University of La Rioja were trained with chemical standards and real samples for one year. The second panel, from Barcelona, was made up of students who passed Level 2 of the Wine and Spirits Trust beverages program that the company Outlook Wine S.L. teaches in Barcelona.
Sensory descriptive analysis was performed according to the International Organization for Standardization (ISO) 11035. The wines were served in certified glasses according to ISO 3591-1977, with 50 mL in each glass, covered with a Petri dish so that the aromas reached equilibrium in the head space. The judges were first asked to evaluate the aromas orthonasally and record their intensity for each of the descriptors set out in the tasting sheet, on a scale of 0 to 5 for positive attributes and 0 to −5 for negative attributes or defects The judges were then asked to conduct the evaluation at the gustatory level with the same scale.
2.3. Statistical Analysis
A set of 17 wines were tasted and, subsequently, a partial least squares regression analysis was conducted with data obtained by using XLSTAT 2017 Addinsoft statistical software (40, rue Damrémont 75018 Paris, France).
Partial least squares regression statistical methodology is an analysis that is related to the regression of major components: Instead of finding hyperplanes of maximum variance between the response variable and independent variables, there is a linear regression through the projection of forecast variables and the observable variables to a new space.
In a first step, and in order to reduce the variables that would be part of the predictive mathematical algorithms, various selection criteria were taken into account [
4,
5].
High level of positive or negative correlation between the chemical compound and the “minerality” attribute and likewise for organoleptic attributes [
6].
Percentage of explanatory variance by the model and Q2 value accumulated as high and as close to 1 as possible.
Subsequently, a dynamic search process for the best PLS model was performed. For this, those compounds and chemical families with a relationship greater than 2 in their concentration between the maximum and minimum value and with activity aroma values (OAV) that met the condition OAVmax/OAVmin >1 were taken into consideration, since these are compounds that can contribute with significant differences in sensory perception against the scores of the “minerality” attribute by the panel of tasters. To reduce the number of variables of the models, a partial least squares (PLS) regression analysis was performed, retaining those chemical compounds that showed a significant correlation with a confidence level of 90% with the olfactory and gustatory “minerality” attribute.
2.4. Chemical Characterization
2.4.1. Volatile Composition
The minor compounds were analyzed by solid phase extraction (SPE) followed by analysis via Gas Chromatography and Mass Spectrometry (GC–MS) and major compounds by liquid–liquid extraction (LL) followed by Gas Chromatography (GC) with flame ionization detection (FID) [
7]. To perform the analysis, 5 mL of wine, 0.8 mL of acetonitrile, 0.1 mL of chloroform and an internal standard containing the deuterated compounds 3-octanol, 4-methyl-pentanol and 4-hydroxy-4-methyl-2-pentanol were added to a centrifuge tube with a 15 mL thread. The tube was centrifuged at 4800 rpm for 5 min. Once the phases were separated, the organic phase was recovered and injected into an Agilent gas chromatograph model 7890 (G3440A) under the following conditions: an initial temperature of 40 °C, which was maintained for 5 min and then increased by 3 °C/min to 200 °C. The gas used was Helium injected at a flow of 3 mL/min. Three milliliters were injected with a divided mode flow of 30 mL/min. The column (50 m × 0.32 mm) and film thickness of 0.5 μm used was DB-FFAP (nitroterephthalic-acid-modified polyethylene glycol (PEG) column of high polarity) from J & W Scientific (Folsom, CA, USA) and the identification and quantification was carried out by means of a mass detector. To perform the quantification of the majority and minority compounds, calibration graphs for 70 compounds were previously prepared by analyzing synthetic samples containing known quantities of the odorants analyzed.
2.4.2. Enological Parameters
The quantitative determination of these parameters was carried out following the guidelines of the official methods published in Boletín Oficial del Estado (BOE) number 1988-11256 and the International Organization of Vine and Wine (OIV).
The ethanol content of the samples was determined by near infrared (NIR, Anton Paar; Camino de la Fuente de la Mora, 9, 28050 Madrid, Spain) equipment. The values of pH and total acidity were determined by pH apparatus coupled to an automatic titrator (Mettler-Toledo S.A.E. Miguel Hernández 69-71, 08908 Hospitalet de Llobregat, Barcelona, Spain; 2000 series) calibrated according to certified standards. The parameters referring to the colorant composition of the samples were measured by spectrophotometric techniques using Lan Optics equipment (series 2000).
The amounts of free and total sulfur dioxide were analyzed by steam trawling following the Franz Paul approach and distilling equipment supplied by GAB Technologies. The determination of organic acids and sugar content (glucose + fructose) was based on automated enzymatic methods with measurement by spectrophotometry using enzymatic equipment (Analyzer Y15, Byosistem, Barcelona, Spain). In the case of succinic acid, a manual enzymatic method was followed using the kit supplied by Megazyme (
https://www.megazyme.com/) through the generation of calibration and measurement lines by spectrophotometry with Lan Optics equipment (2000 series).
2.4.3. Quantification of Metals
The quantitative determination of metals was made by means of the following methods. A prior digestion was conducted in sealed containers to mineralize the wine samples. The samples were subsequently analyzed by an optical emission spectrometer with excitation by induced argon plasma and a dispersive system as previously described [
8]. For the realization of the calibration lines, solutions of each of the reference standard mediating elements supplied by Sigma Aldrich in 5% NO
3H were prepared. The metal quantification analyses were carried out by the regional agricultural laboratory of La Grajera of the Government of La Rioja.
3. Results
3.1. Modelization of Aromatic “Minerality” Based on the Chemical Composition of Wines
For the study of the data obtained by the panel, a principal component analysis (PCA) of each attribute was performed, which was calculated from the average scores of the panel members. A correlation matrix was obtained for each attribute (wines in rows and tasters in columns). Thus, each of the attributes was represented in a factorial plane where the projections of each taster were placed around 360° of the correlation circle. With the average data of the scores established by each panel, a principal component analysis (PCA) was performed to evaluate the results obtained by the panel of non-producing tasting experts.
The PCA of each attribute was calculated with the average scores of the sensory judge members of the panel. For those descriptors in which the judges were grouped in the same part of the plane, it was interpreted as a sign that the panel had the same criteria in the interpretation of the attribute. On the contrary, those attributes in which the PCA showed the projection of the judges distributed throughout the plane could be explained as:
- (1)
the panelists did not interpret the attribute in the same way.
- (2)
the sensory differences for that attribute were too small to be perceived by most panelists.
For this reason, only those attributes that showed a PCA with a projection of at least 60% of the judges in the same plane were taken into account for the correlation analysis shown in
Table 2.
Table 2 describes the results obtained in the correlation study (
p < 0.1; 90% significance level) among the scores obtained by the panel of tasters, consisting of processors for the olfactory “minerality” descriptor, and volatile and non-volatile chemical compounds from the study samples. In bold are the variables with their correlation coefficients. Only the compounds isobutyric acid, octanoic acid, β-phenylethanol, isoamyl acetate, ethyl acetate, ethyl decanoate, isoamyl alcohol and 4-mercapto-4-4-methyl-2-2-pentanone were shown to be significant for the olfactory “minerality” descriptor, so these are included in the final PLS model. The crucial fact that isobutyric acid, isoamyl acetate and isoamyl alcohol correlate negatively must also be considered.
Next, a correlation study based on the proposed model was conducted for the “minerality” attribute and the variables that show a more positive or negative correlation among the quantified analytes.
Shown below is the proposed mathematical model once the statistical program was applied:
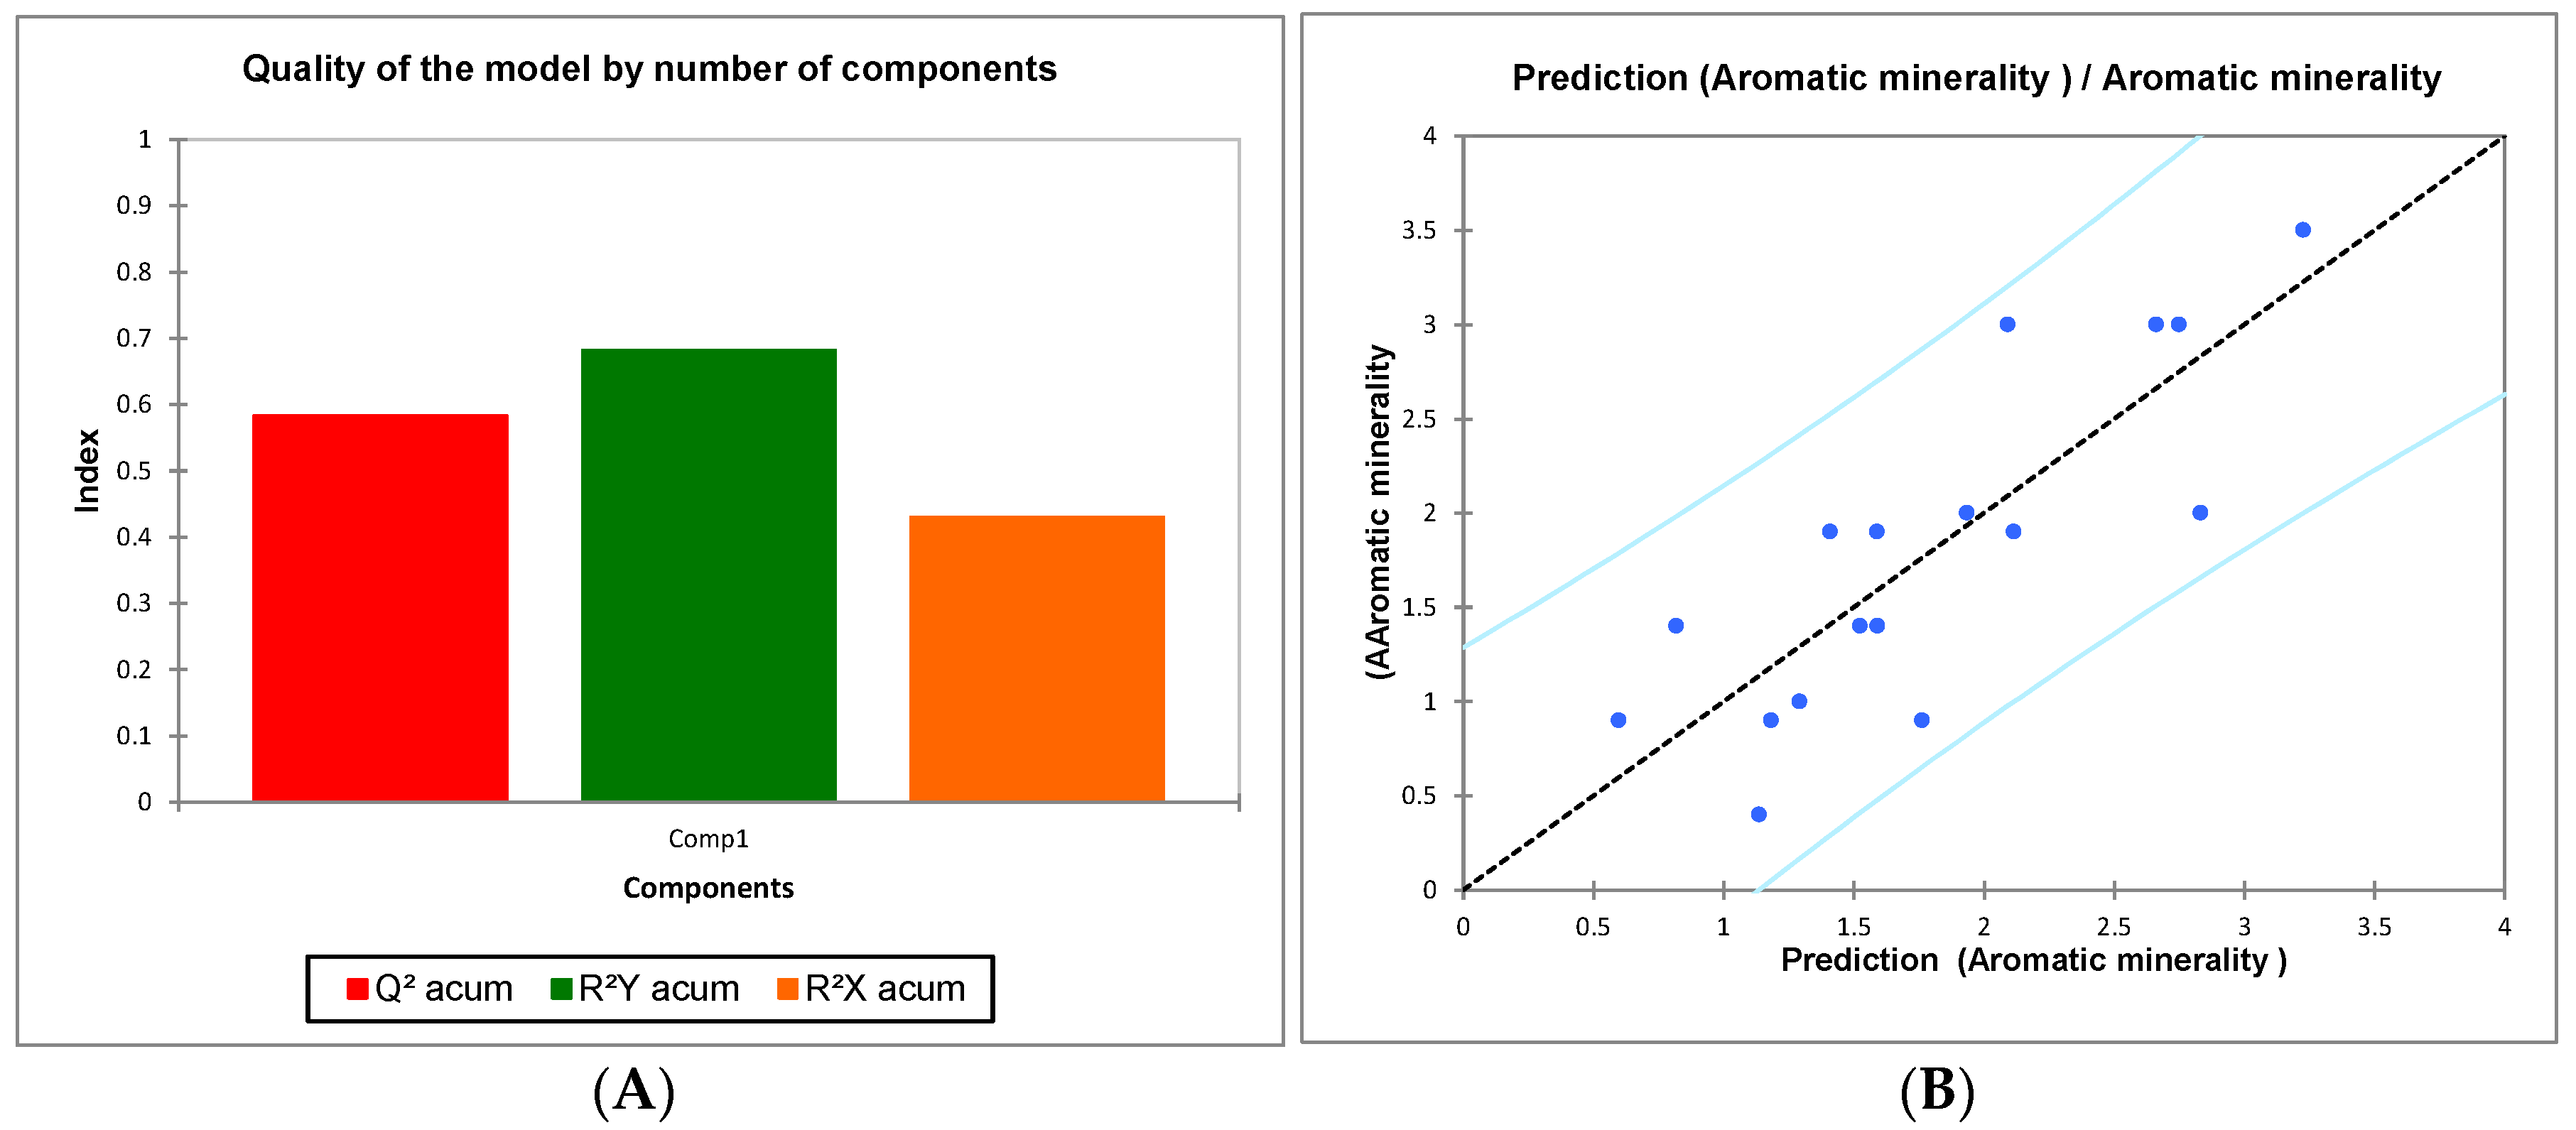
In the graph of quality of fit (
Figure 1B), we observe how values of 0.58 of cumulative Q
2 are reached, close therefore to the value of 0.6 required to ensure that the results are interesting. The Q
2 cumulated index measures the overall goodness of fit and the predictive quality of the models proposed.
The corresponding bar chart shown in
Figure 1A enables us to visualize the quality of the partial least squares regression as a function of the number of components.
The closer the cumulated R2Y and R2X that correspond to the correlations between the explanatory (X) and dependent (Y) variables and the components are to 1, the better the partial least squares model.
Likewise, the graph of distribution of samples shows how they are projected in a linear way, and how in none of them do the residual values for the model exceed the maximum value of 2 (
Figure 1A). These parameters indicate a good fit for the proposed model.
3.2. Modelization of Aromatic “Minerality” Based on the Sensory Properties of Wines
In a similar manner to that followed in the study, a partial least squares (PLS) regression analysis was carried out with data regarding the chemical composition and the volatile fraction of the wines in relation to the aromatic “minerality” attribute, taking into account the sensory attribute scores provided by the panel of expert judges. To choose the descriptors with significant differentiating capacity, those that showed a correlation of up to 90% level of confidence with the olfactory “minerality” descriptor were taken into account. As was stated in the review, it is reported that other descriptors such as granite, limestone, rock, etc., were associated with minerality [
9]. However, only “minerality” was included in the sensory analysis so as not to distract the judges from the aim of this study.
The results are described in
Table 3. In bold are the descriptors with significant values (
p < 0,1; 90% significance level) for the “minerality” olfactory descriptor oak, empyreumatic, animal, plant chlorophyll and oxidation, so that these are included in the mathematical predictive model.
Next, on the proposed PLS model, a study of the correlation between the “minerality” olfactory attribute and other sensory descriptors with higher correlation was conducted. The proposed mathematical model is shown here:
3.3. Modelization of Aromatic “Minerality” Based on the Chemical Composition and the Sensory Properties of Wines
A third model was elaborated taking into account chemical data with significant correlation (
p < 0.1, 90%) with the descriptor of “minerality” descriptor, as well as the scores of from descriptors with significant correlation with the aromatic “minerality” descriptor. The proposed model is presented here:
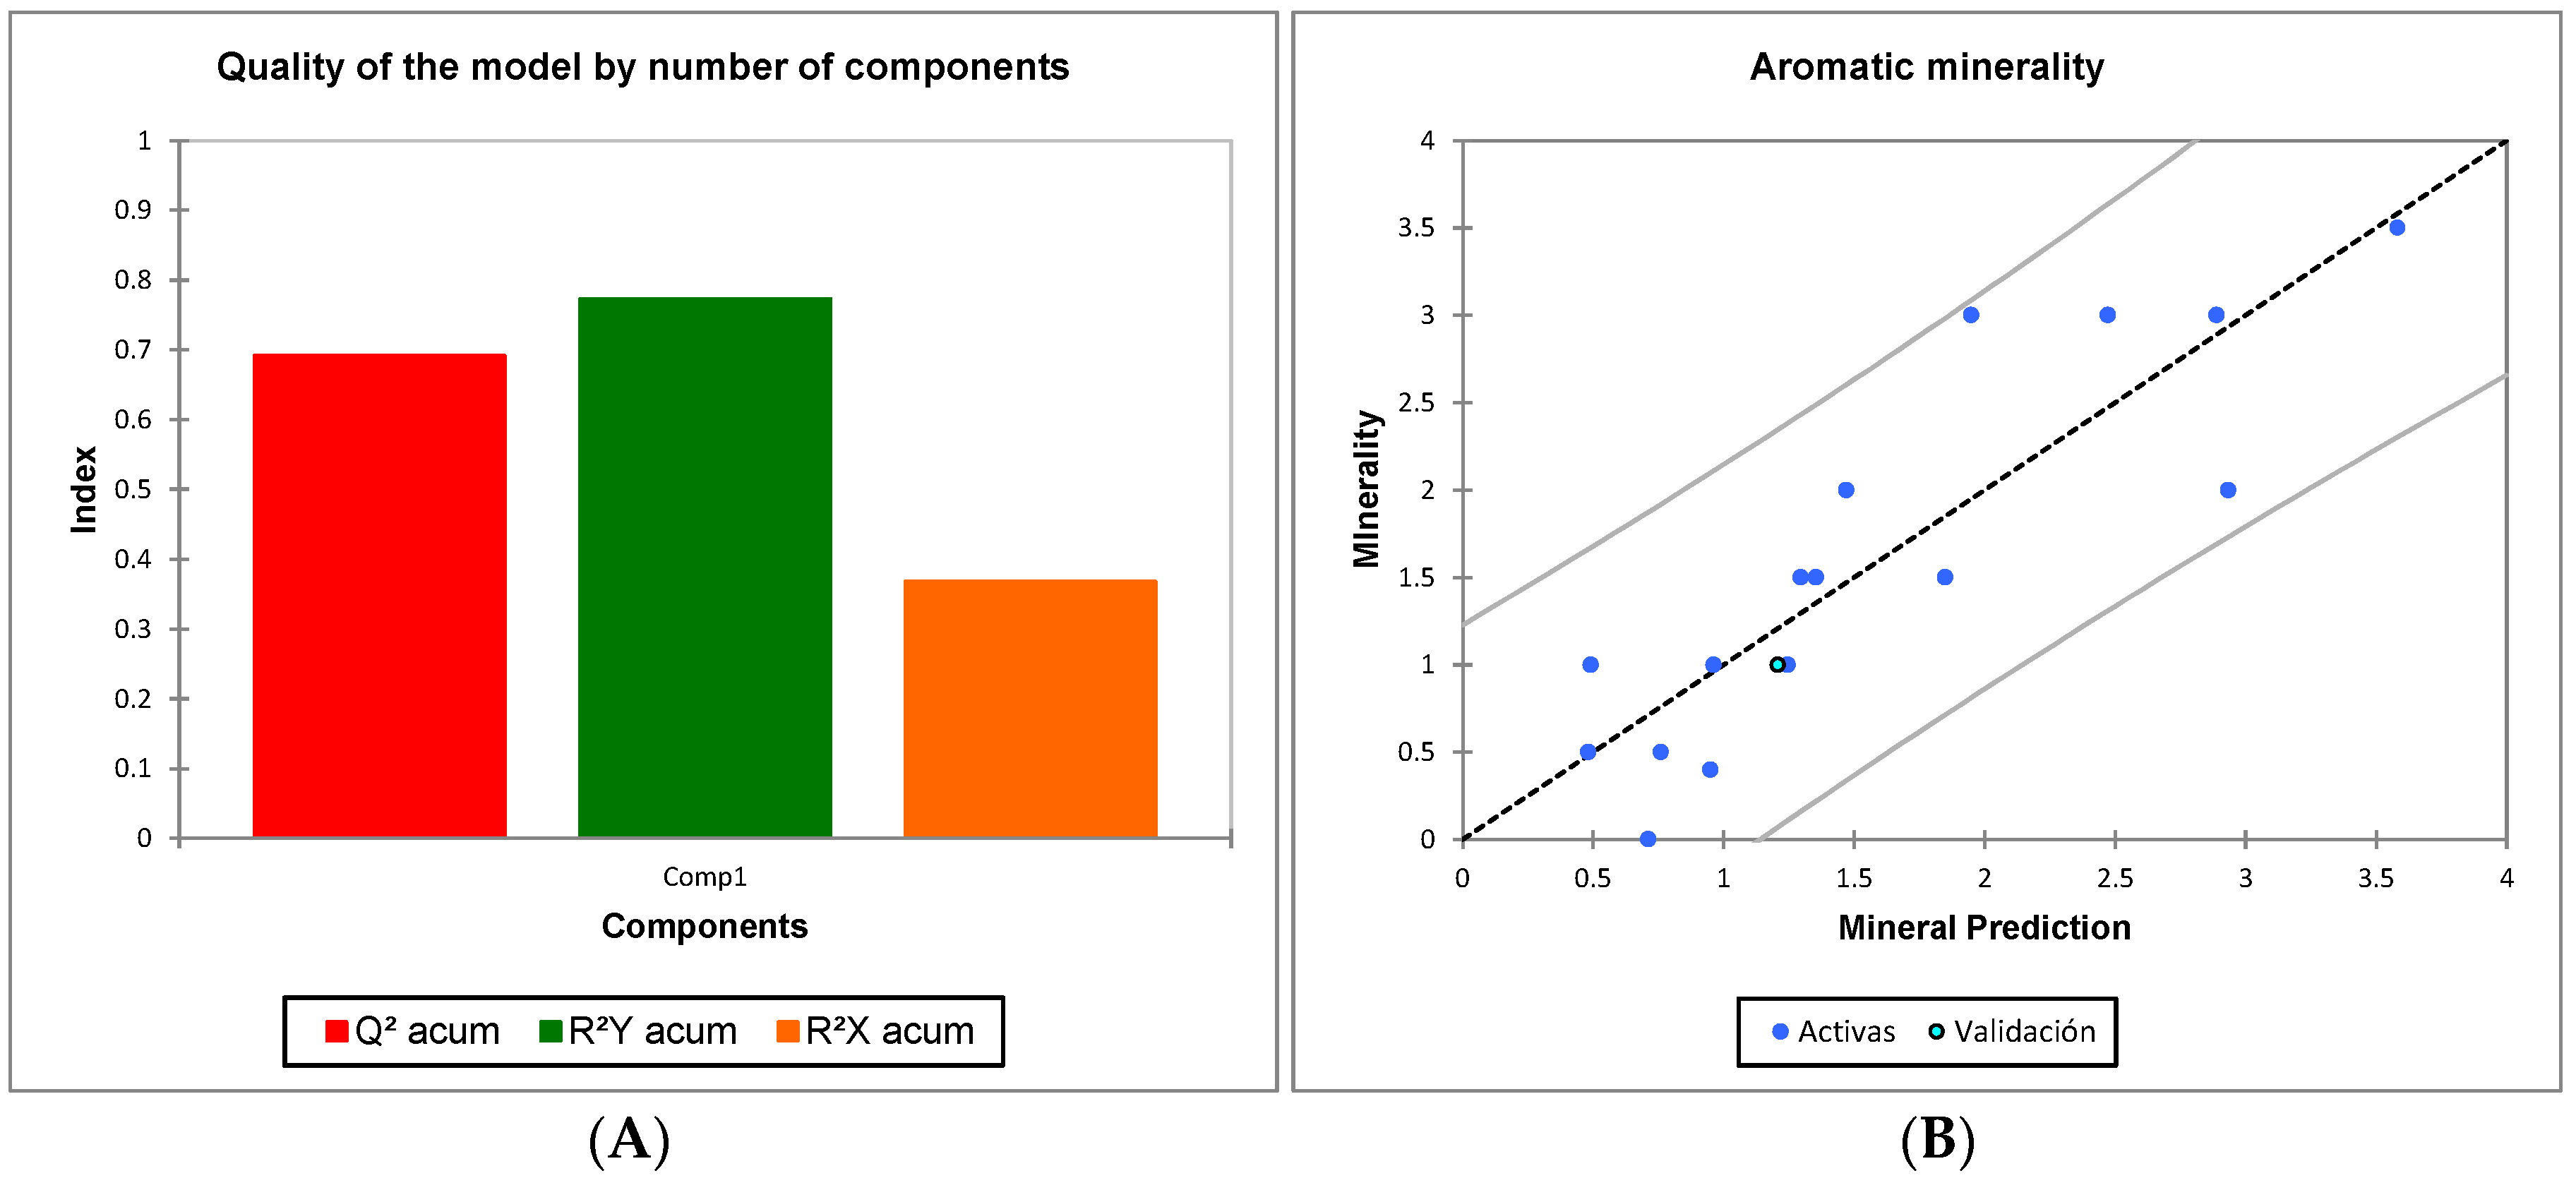
The graph of quality of fit (
Figure 2B) shows that Q
2 values of 0.69 are reached. Since a 1.0 Q
2 value is considered an optimal fit, we can judge the proposed model as satisfactory.
In the graphic representation of the samples (
Figure 2A), we can see how they are distributed in a linear way, and how in none of them do the residual values found for the model exceed the maximum value of 2. It can also be seen that the residual values found are generally very low.
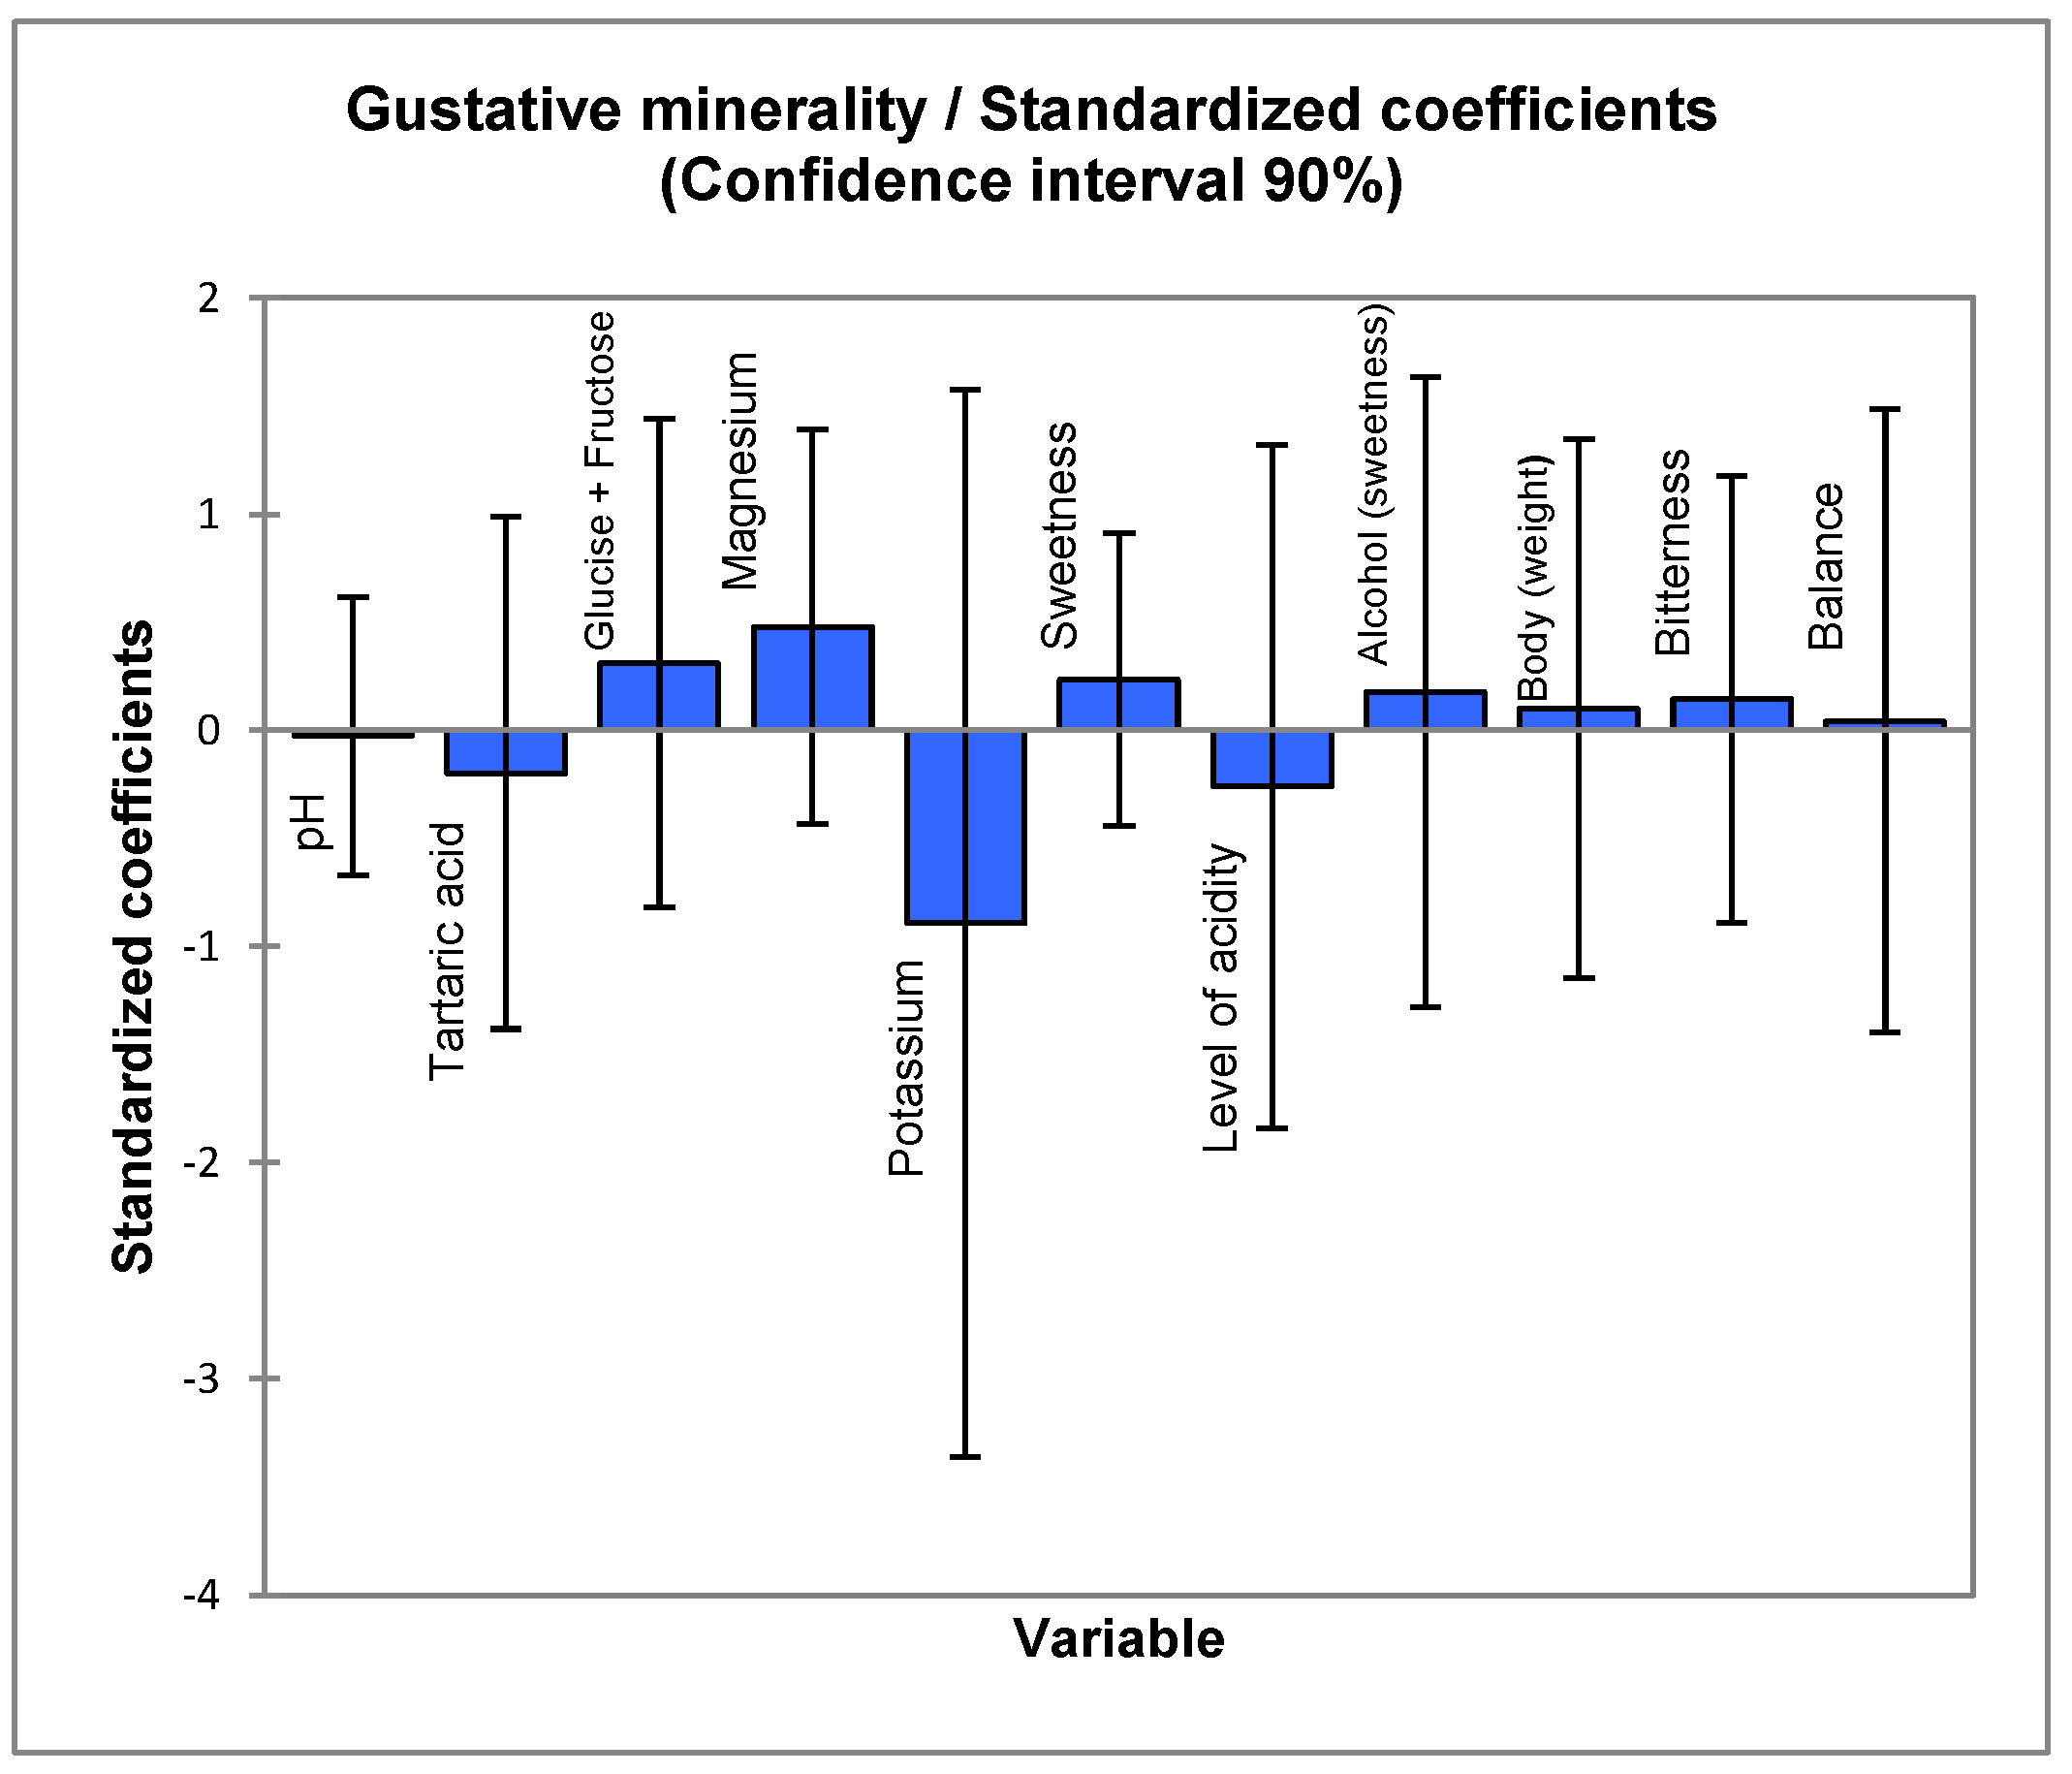
Figure 3 shows the standardized regression coefficients, in which it can be seen that all the variables of the model are within the recommended range of −1.96 to 1.96. Likewise, it can be observed that, according to this model, the “minerality” olfactory descriptor is positively correlated with the presence of organic acids such as octanoic acid as well as benzyl mercaptan. The model also indicates a relationship between herbaceous notes and oxidation with the “minerality” olfactory descriptor.
On the other hand, as noted in the model built based on active olfactory analysis, compounds such as ethyl acetate, nail lacquer aroma and glue, and other compounds such as isoamyl alcohol, fusel or distinctly fruity notes [
10,
11], as in the case of the banana-scented isoamyl acetate, contribute negatively to the mineral attributes. It is not surprising that the presence of fruity aromas such as those produced by organic esters contribute negatively or contrary to the perception of “minerality”, previously described this hypothesis by Par et al. [
12,
13,
14].
3.4. Modelization of the Gustatory “Minerality”
Similar to what was done with sensory results of the “minerality” attribute at olfactory level, a partial least squares regression (PLS) analysis was conducted with chemical and sensory data regarding gustatory “minerality” obtained by the panel of expert tasters.
Those compounds with a relationship in concentration between the maximum and minimum value greater than 2 were considered, because it is assumed that they are compounds that can make significant differences in gustatory perception. A second criterion was established for this analysis, taking into account only those compounds whose concentration regarding the gustatory sensory threshold was >1. Gustatory thresholds in the case of anions and cations were those considered as known in the water matrix [
15], since there are no publications related to wine.
Statistical analyses of the gustatory “minerality” attribute previously analyzed already showed that the results of the ANOVA were significant (p < 1.35 × 10⁻²) for the set of white and red wines, but less so when the white wines (p < 8.61 × 10⁻⁴) and the red wines (p < 5.61 × 10⁻²) were analyzed separately (data not shown here). Therefore, it was decided to analyze subgroups of white and red wines separately.
3.5. Gustatory “Minerality” Based on the Chemical Composition of White Wines
An initial approach through correlation to a 90% significance level revealed that there was only one compound with a positive correlation between the gustatory “minerality” and the chemical compounds studied. Therefore, it was decided to reduce the level of significance to 60%. A study of correlation was performed for each of the compounds with gustatory capacity, which fulfilled the criteria referred to above, in order to evaluate their discriminatory capacity and include them in the partial least squares regression model.
Table 4 describes the results obtained in the correlation study (
p < 0.4; 60% significance level) of the scores obtained by the tasting panel for the gustatory “minerality” descriptor and the analytical results of compounds related to the gustatory sensations. Descriptors with significant values are highlighted in bold.
Variables: volatile acidity, pH, L-lactic acid, tartaric acid, glucose and fructose, boron, magnesium and potassium were shown to be significant, contributing to the definition of the gustatory “minerality” descriptor in white wines, and are therefore included in the model (
Figure 4).
Compounds: succinic acid, L-malic acid, alcohol content, total acidity, glycerol, phosphorus, manganese and aluminum were eliminated from the model because its statistical quality improved after removal. Concerning the variable constituted by the sum of glucose and fructose, its coefficient or weight level in formula was very low (0.005), as may be expected, since a priori “minerality” is a difficult character to fit in sweet wines, although in this case we are speaking of dry wines. The proposed model is presented below:
Graph of quality of fit (
Figure 5B) shows how the Q
2 value lies in values greater than 0.6, which is the necessary minimum to obtain representative results (0.66). Likewise, none of the wines show residual values greater than 2.0, as shown in the graph of samples dispersion (
Figure 5A); therefore, all were retained for the construction of the PLS model.
It can be noted how the gustatory “minerality” descriptor in white wines was positively related to the increase in acidity. Therefore, the results indicate that increasing levels in tartaric acid and decreasing pH levels favor the emergence of the gustatory “minerality” descriptor in white wines. The model also suggests a positive relationship between the degree of sweetness and “minerality”, which is somewhat surprising, but may be due to the fact that one of the wines in the study from the Riesling variety was an “off-dry” style, with 5–7 g/L of residual sugar.
3.6. Gustatory “Minerality” Based on the Sensory Attributes of White Wines
Similarly to what was conducted previously with chemical compounds, a correlation of the gustatory “minerality” attribute with the tasting parameters evaluated in the gustatory phase of the sensory analysis was performed; the results are shown in
Table 5 from the scores obtained by the tasting panel for the gustatory “minerality” descriptor and the scores of “minerality”. Descriptors with significant values are highlighted in bold.
Below is the model proposed if taking only into account only the gustatory attributes:
Again, there is a positive correlation between increasing levels of acidity and the gustatory “minerality” observed by the judges on the panel of tasters. The proposed model reached in this case a value of 0.58 for accumulated index Q2, which gives the model moderate credibility, since it does not reach the critical value of 0.6.
3.7. Gustatory “Minerality” Based on the Chemical Composition and the Sensory Properties of White Wines
Finally, a third model was developed taking into account both the chemical data with significant correlation (
p < 0.4, 60%) with the gustatory “minerality” descriptor as well as the descriptors with significant correlation (
p < 0.4, 60%) with the same descriptor. The proposed model is presented below:
Fit values found for Q2 were 0.63 for the first components given that those values greater than 0.6 are acceptable, the proposed model was therefore considered valid.
In addition, and as can be seen in
Figure 6, in which the standardized regression coefficients are shown, all the variables of the model are within the recommended range of −1.96 to 1.96. Similarly, it is noted that according to this model, the increasing values of acidity, sweetness and alcohol are positively related to this descriptor. What is more, the absence of balance or the presence of some metals, such as potassium, can contribute negatively to mineral tastes.
3.8. Modelization of Gustatory “Minerality” Considering the Chemical Composition of Red Wines
As in the white wines, a test was performed on the correlation between the scores of the “minerality” attribute and the concentrations of the different chemical compounds analyzed. The study revealed that there was only one compound with a positive correlation between gustatory “minerality” and the chemical compounds analyzed. Therefore, it was decided to decrease the level of significance to 60%. Only the compounds showing a significant correlation were considered for inclusion in the partial least squares regression model.
Table 6 shows the analytical results of the compounds related to the gustatory sensations. The variables with significant values providing differences between samples are shown in bold. The factors alcoholic strength, L-lactic acid, succinic acid, aluminum, manganese, phosphorus and potassium proved to be significant for the gustatory “minerality” descriptor in red wines and were therefore included in the mathematical model.
Below is the proposed PLS model that considers the active chemical composition in the mouth at the sensory level of red wines:
3.9. Modelization of Gustatory “Minerality” Considering the Sensory Attributes of Red Wines
Table 7 describes the results obtained in the study of correlation (
p < 0.4; 60% significance level) of the scores obtained by the panel of expert tasters for the gustatory “minerality” descriptor in red wines
The proposed PLS model that considers the attributes of gustative sensory analysis is shown below:
The quality of fit of the two models displayed in
Section 3.1 and
Section 3.2 based on Q
2 parameters were 0.45 for the one which uses chemical parameters and 0.74 for the one which uses sensory attributes; the latter is therefore much more reliable.
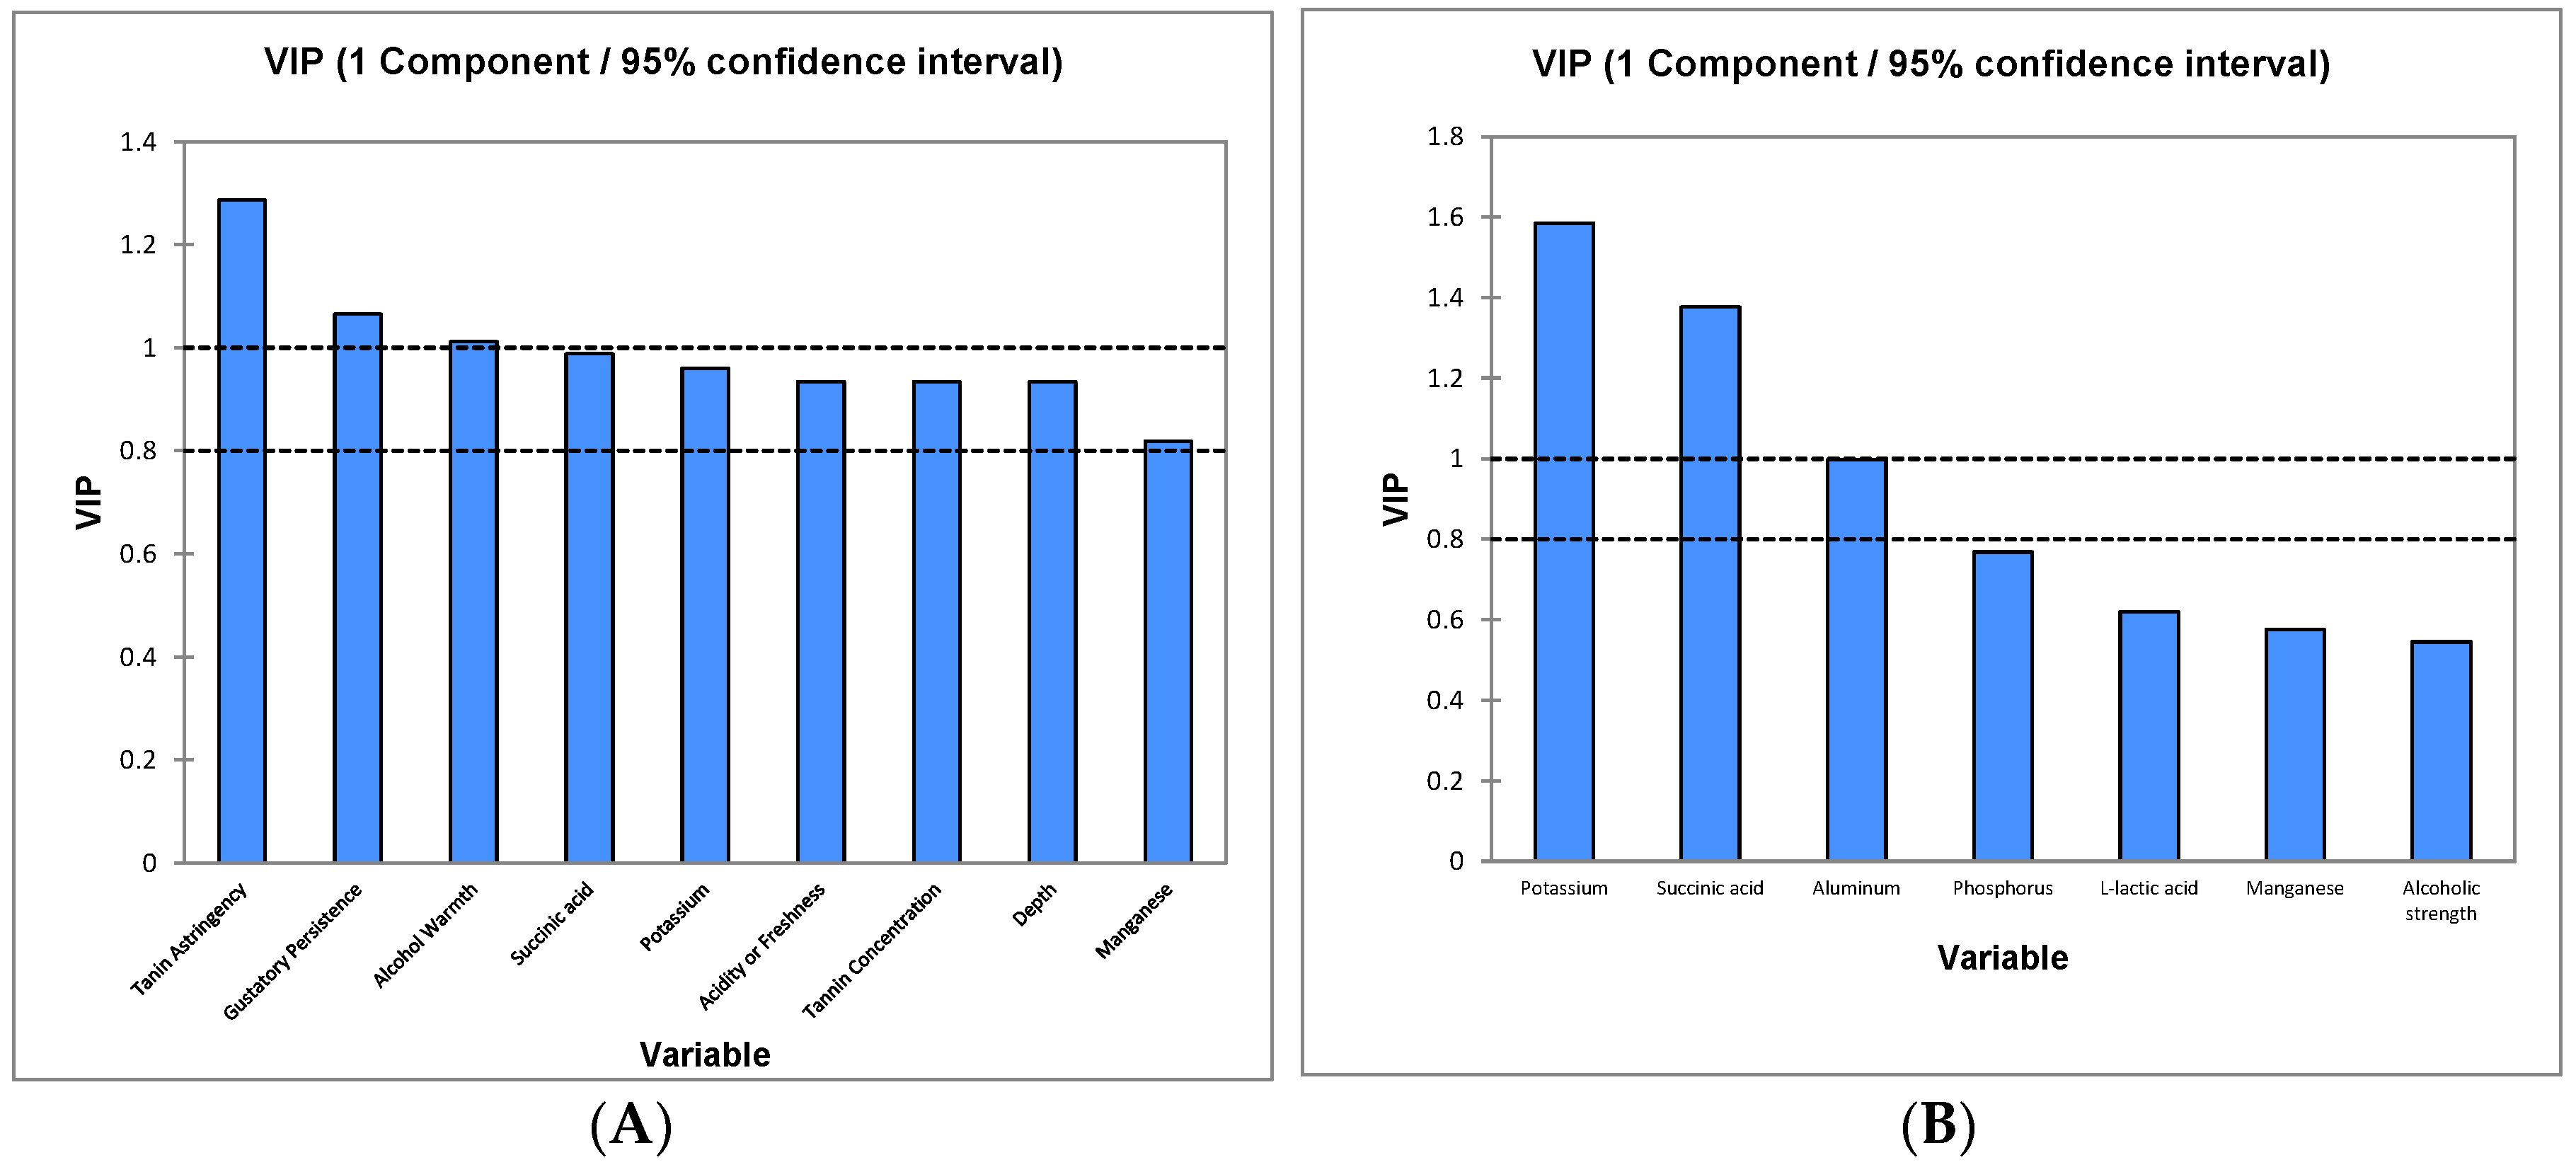
In order to improve the fit of the formula that considered the chemical composition, different models were performed eliminating variables whose importance in the projection was less than 0.8 (
Figure 7B); however, the model initially proposed for the PLS accumulated the best fit and so it was maintained as valid.
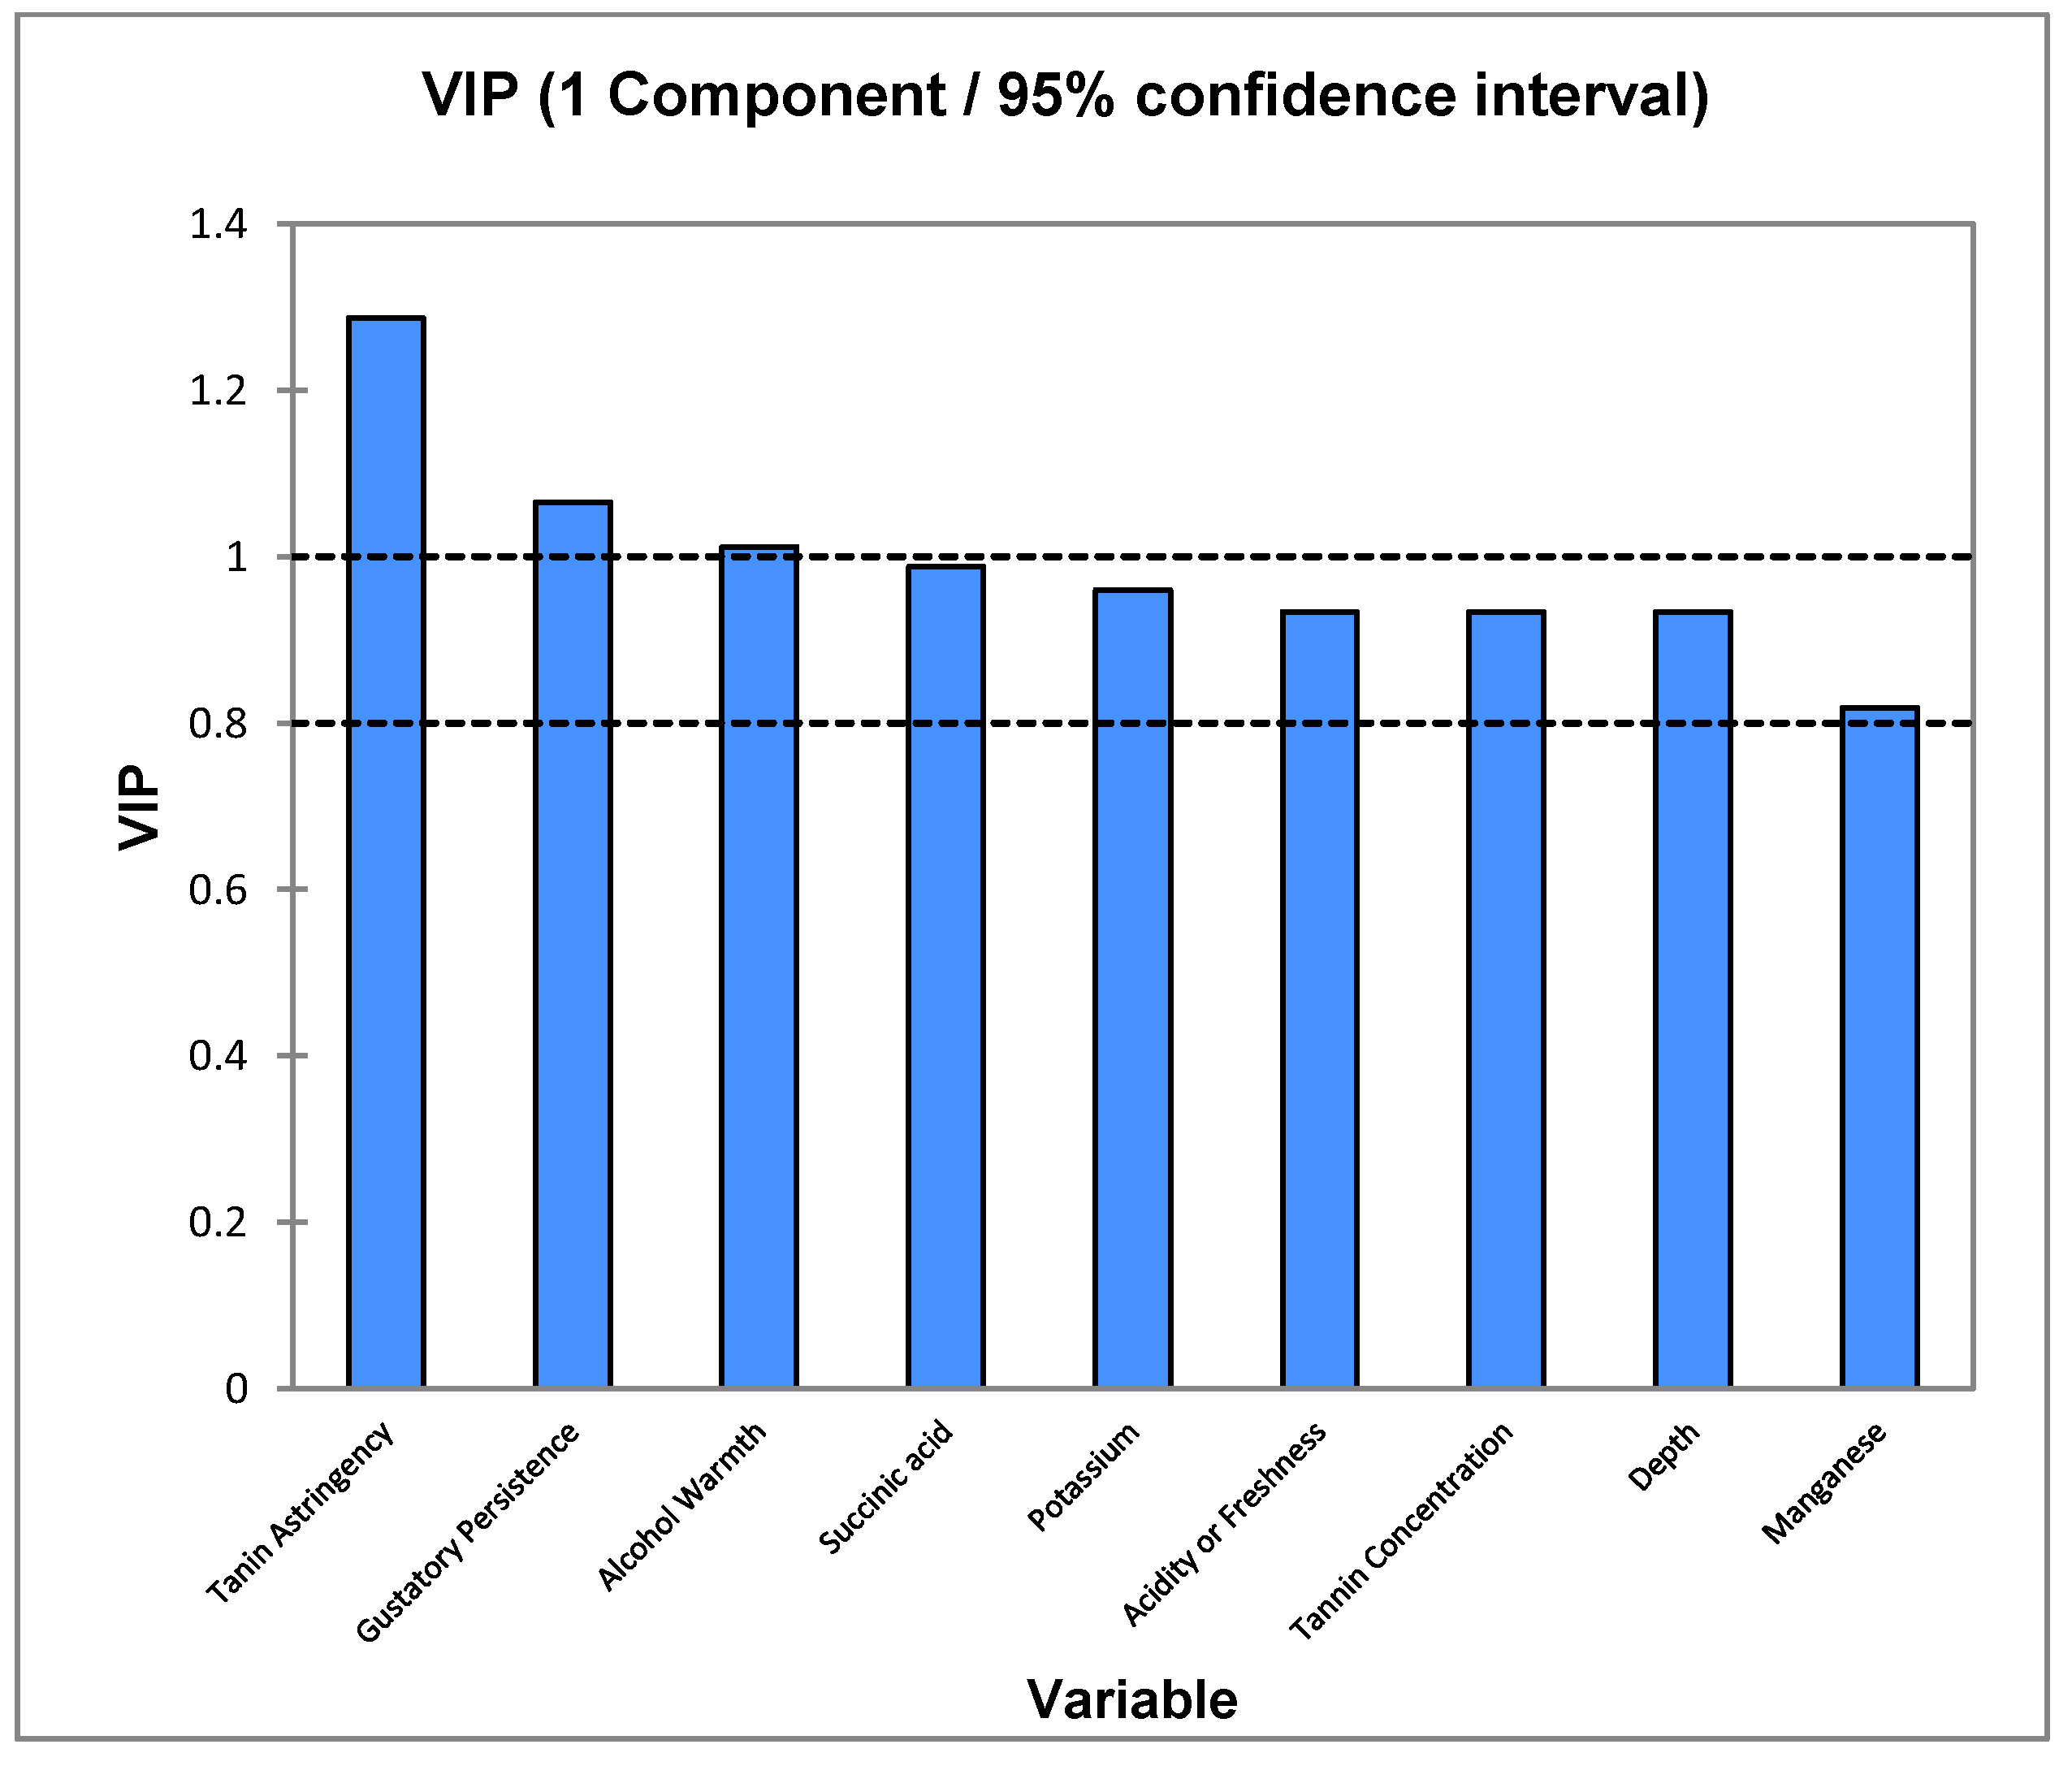
In the sensory model, and as is shown in the Variable Importance in Projection (VIP) graph (
Figure 7A), the descriptors tannin from oak and heartburn were eliminated from the model since the statistical quality improved after their removal. Additionally, all the descriptors that are part of the model exceeded the 0.8 cut-off values.
Concerning the chemical composition, it should be highlighted how the gustatory “minerality” descriptor in red wines is positively related to the alcoholic strength and does not seem to give importance to acidity, which was the case in white wines. However, a positive correlation of a compound with a saline character appears in the case of succinic acid. This relationship is already reflected in previous studies about “minerality” in wine.
Furthermore, in relation to the tasting attributes, similarly to what was seen in white wines, there is a positive correlation between the feeling of alcoholic warmth and gustatory “minerality”. However, contrary to what happens in white wines, the gustatory acidity in red wines is not decisive in the detection of a mineral character.
3.10. Modelization of Gustatory “Minerality” in Red Wines Considering the Chemical Composition and the Sensory Attributes
Finally, a third model was developed in red wines taking into account both chemical data with significant correlation (
p < 0.4, 60%) with the gustatory “minerality” descriptor and the sensory tasting parameters. The proposed model is presented below:
As shown in the graph of variable importance (
Figure 8), alcoholic strength, l-lactic acid, aluminum and phosphorus were eliminated from the model since its statistical quality improved after their removal. The model shows a fit of 0.64 based on the accumulated Q
2 parameter, so it can be considered that it exceeds the cutoff threshold established at 0.6.
The model constructed shows how increasing values of alcohol sensations (warmth) and tannins, both at the level of astringency and phenolic concentration, are positively related to this descriptor, and how the model, once again, appears to give no importance to the acidity, as occurred in white wines. However, there is again a positive correlation with a compound with a saline character, succinic acid. The presence of metals is irrelevant, since some of them, such as manganese, contribute positively to the final pls mathematical model and others, like potassium, do so negatively.
4. Discussion
Compared to other studies on “minerality”, the present analysis of this descriptor is an innovative approach as it combines sensory and chemical characterization.
Previous studies (followed a purely sensory approach to this aspect of wine. Our proposed models integrate chemical and sensory analysis in order to explain the “minerality” descriptor. Our theory is based on the idea that the role that this descriptor plays in sensory analysis cannot be explained by a unique chemical compound. The close examination of the data collected from the study revealed several models that integrate chemical and sensory descriptors.
Our results obtained after having performed the statistical analysis of the chemical composition with the sensory analysis suggest that some volatile chemical compounds are involved in the application of the term “minerality”, the origin of which is defined by the plant’s metabolism. However, due to the fermentative activity of yeast and bacteria these are transformed into active compounds from the sensory viewpoint; thus, the “minerality” of wine can also be dependent on winemaking techniques and enological itineraries used in the production of wine in the winery and during the process of wine aging, so it is not solely dependent on agroclimatic factors.
Concerning the olfactory spectrum, and based on the results obtained from the descriptive sensory analysis by the panel of expert tasters, different mathematical algorithms with more than reasonable predictive qualities were developed in the mineral description of wine at the olfactory level, which include the following terms or chemical compounds:
With a positive contribution: plant-chlorophyll, oxidation, octanoic acid, ethyl decanoate, isoamyl alcohol and benzyl mercaptan.
With a negative contribution: isobutyric acid, β-phenylethanol, isoamyl acetate and ethyl acetate.
The analysis of the proposed olfactory model revealed a positive association between oxidation and the term “minerality”, suggesting that in those samples with less floral and fresh fruit impact, “minerality” is more likely to appear in a sensory characterization. In addition, there is a negative association with the term “oak descriptors” according to the predictive model developed. In the light of these results, it could be concluded that tertiary flavors, such as those created by the oak barrel aging, are negative, but the oxidation process not related to oak barrel aging is positive.
The mathematical model obtained by partial least squares regression for the gustatory “minerality” in white wines suggested a positive relationship with high total acidity levels. In addition, in terms of elements involved in the mathematical relations, the following compounds should be considered:
With a positive contribution: tartaric acid, glucose, fructose (in the form of residual sugars in dry wines or “off-dry” type), magnesium, sweetness (sugar), level of total acidity, alcohol (sweetness), body and bitterness.
With a negative contribution: pH, potassium and balance in the mouth.
In red wines, the proposed mathematical model achieved good results for accounting for gustatory “minerality”. This model is positively related to organic acids, such as succinic acid with a salty taste and tannin concentration, and negatively related to the feeling of freshness and well-integrated or balanced acidity. The factors to be considered in this case are as follows:
With a positive contribution: alcohol (feeling of warmth), tannin concentration, gustatory depth, and persistence in the aftertaste, succinic acid, and potassium.
With a negative contribution: level of acidity in relation to freshness in the mouth, astringency of tannin and manganese.
As a conclusion, the present procedure, based on partial least squares regression, has demonstrated revealing and promising results. Based on these predictive models, it is possible to focus the technology used in the vineyard and the winery to imprint or to increase the mineral character in wine if required for reasons of marketing, product range, corporate communication, competitiveness or market strategy. The same approach is presumably equally applicable to other descriptors in the food sector that are nowadays not well characterized.


