Article

Copper(II) and Sulfur Dioxide in Chardonnay Juice and Shiraz Must: Impact on Volatile Aroma Compounds and Cu Forms in Wine

by
Xinyi Zhang
1,2,*,
Nikolaos Kontoudakis
1,2,3,
John W. Blackman
1,2 and
Andrew C. Clark
1,2
1
National Wine and Grape Industry Centre, Wagga Wagga, NSW 2678, Australia
2
School of Agricultural and Wine Sciences, Charles Sturt University, Wagga Wagga, NSW 2678, Australia
3
Department of Food Science & Human Nutrition, Laboratory of Oenology, Agricultural University of Athens, Iera Odos 75, 11855 Athens, Greece
*
Author to whom correspondence should be addressed.
Submission received: 8 November 2019 / Revised: 4 December 2019 / Accepted: 5 December 2019 / Published: 10 December 2019
(This article belongs to the Special Issue Improving Wine Quality and Safety)

Abstract

:
This work outlines the influence of Cu(II) and SO2 concentrations in Chardonnay juice or Shiraz must on the respective wine composition. Analyses were conducted pre- and post-fermentation, after cold stabilization, after bentonite treatment (Chardonnay only), at bottling, and 15 months after bottling. The quantification of total Cu was conducted by inductively coupled plasma optical emission spectrometry and free Cu by stripping potentiometry. Low molecular weight sulfur compounds, volatile aldehyde compounds, and general volatile compounds, including esters and terpenes, were quantified with gas-chromatography- or liquid-chromatography-QQQ-mass spectrometry. For Chardonnay, increased Cu concentration in the juice resulted in higher concentrations of Cu in the respective wine, while Shiraz wines showed no significant difference. Increased Cu addition to Chardonnay juice also produced significantly higher concentrations of H2S, 3-methylbutanal, and methional, but lower concentrations of methanethiol and phenylacetaldehyde, while SO2 addition increased 3-methylbutanal and phenylacetaldehyde, and decreased methanethiol production from post-fermentation to post-bottle aging. For the Shiraz, SO2 led to higher concentrations of H2S, and both SO2 and Cu addition increased the concentrations of hexanal, 3-methylbutanal, and phenylacetaldehyde in wine, but this effect diminished after cold stabilization. This study shows that SO2 and Cu in grape juice/must can have long-term implications for wine composition.

1. Introduction

Alcoholic fermentation is a critical step during wine production, as it allows ethanol production from sugars via yeast (mainly Saccharomyces cerevisiae) metabolism. Besides ethanol, other secondary metabolites are also produced, such as volatile compounds, including esters, terpenes, norisoprenoids, carbonyl compounds, and sulfur-containing compounds [1,2]. These compounds can contribute beneficial or detrimental aromas to the wine sensory profile [3].
Carbonyl compounds, especially aldehydes, are related to the oxidative off-flavors found in wines [4,5]. Aldehyde compounds can be oxidized from alcohol compounds [1], such as acetaldehyde from ethanol. They are also intermediate products of the Ehrlich pathway that occurs in yeast cells [6], or produced through Strecker degradation [1,7], which involves the reaction between amino acids and α-dicarbonyl or o-quinone compounds [8,9,10]. Sulfur dioxide (SO2) is the most commonly used additive in wineries to limit the production or accumulation of aldehyde compounds in wine [2]. Aldehyde compounds are prone to nucleophilic attack by hydrogen sulfite (HSO3, an equilibrium form of SO2) and hence readily form addition products that are odorless (non-volatile) [10,11,12]. However, as SO2 can be gradually depleted during aging [13,14], the addition products can progressively dissociate and release free aldehyde compounds [15,16] and the accompanying off-flavors.
In contrast to the aldehyde compounds, low molecular weight sulfur compounds (LMWSCs) can contribute significant ‘reductive’ off-flavors to wine [17]. Sulfur-containing pesticides [18] and gaseous sulfur dioxide (SO2) or potassium metabisulfite (PMS) [17] added after harvest are potential precursors for LMWSCs. Grape juice with high turbidity [19] and/or a lack of sufficient oxygen [20] and nitrogen [18,19,21,22] supply during fermentation also facilitates the production of these compounds. For example, hydrogen sulfide (H2S), a detrimental LMWSC in wine, can be generated by S. cerevisiae from elemental sulfur, sulfate, or sulfite [3,22,23] through the sulfate assimilation and reduction pathway [24]. Sufficient nitrogen and oxygen supply during fermentation can promote the yeast sulfide assimilation and thereby reduce H2S concentration in the finished wine [20]. Other LMWSCs are also produced through yeast metabolism [3,18,24], such as methanethiol (MeSH) [17,25,26] and dimethyl sulfide (DMS) [27,28,29]. Conventional wine production procedures utilized to remove LMWSCs include aeration, copper fining, and the addition of yeast lees [23,30]. In terms of copper fining, H2S can readily form copper(I) sulfide (Cu2S) upon reaction with Cu(II) in model wines [31]. Although the Cu2S is involatile, the particles formed are approximately 0.1–0.2 μm in diameter, do not readily settle, and are not readily removed via filtration [32].
SO2 is added to grape juice/must as an antiseptic, anti-oxidative, and antioxidasic agent [33]. A concentration of 50 mg/L SO2 is typically added during crushing and/or pressing [33]. Cu in juice/must mainly arises from the usage of copper-based sprays in the vineyard (e.g., Bordeaux mixture) and/or excessive Cu uptake from the soil by grapevine [34]. Consequently, a broad range of concentrations of SO2 and Cu are possible in the grape juice/must before fermentation.
Given the reactions of SO2 with volatile aldehyde compounds, and Cu(II) with LMWSCs, there is a potential for increased SO2 and Cu(II) concentrations in grape juice/must prior to fermentation to trap the aldehydes and LMWSCs generated by yeast. Consequently, Cu(II) and LMWSCs in juice/must may increase the yield of these volatile compounds in the finished wine. Therefore, the aim of this work is to examine the influence of SO2 or Cu treatments to grape juice/must on the concentrations of aldehyde compounds and LMWSCs throughout the wine production process and after 15 months of bottle aging. The trial was conducted with both Chardonnay and Shiraz grapes with two different SO2 and Cu levels.

2. Materials and Methods

2.1. Chemicals

All the standard compounds were supplied by Ajax (Taren Point, NSW, Australia), Alfa Aesar (Gymea, NSW, Australia), Fluka (Castle Hill, NSW, Australia), and Sigma-Aldrich (Castle Hill, NSW, Australia). Isotope-labeled analogues were purchased from CDN isotopes (Pointe-Claire, Quebec, Canada) (Table S1). Individual stock solutions of each analyte were prepared in pure ethanol or methanol, stored at −80 °C, and used within 3 months of preparation. All of the solvents and reagents were HPLC grade or analytical grade unless otherwise stated. Regenerated cellulose (RC) membrane syringe filters (Phenex, 0.2 µm) were all supplied by Phenomenex (Lane Cove West, NSW, Australia). The ultrapure water (18.2 MΩ cm) utilized was generated from a Milli-Q Plus purification system (Merck Millipore, Bayswater, VIC, Australia). The glassware used for metal measurement was soaked in 10% (v/v) nitric acid (VWR, Randor, PA, USA) overnight and rinsed with ultrapure water.

2.2. Wine Making and Bentonite Treatment

Chardonnay and Shiraz grapes were vinified and five different treatments were applied: control (no post-harvest addition), low copper treatment (LCu, 3 mg/L of copper addition as Cu(II) sulfate pentahydrate), high copper treatment (HCu, 6 mg/L of copper addition), low sulfur treatment (LSO2, 40 mg/L and 50 mg/L of SO2 addition for Chardonnay and Shiraz, respectively) and high sulfur treatment (HSO2, 60 mg/L and 80 mg/L of SO2 addition for Chardonnay and Shiraz, respectively). The concentrations of SO2 and copper were measured before and after the treatment. For each Chardonnay treatment, 9 L of juice was fermented in triplicate in 10 L demi-johns at 16 °C. The Shiraz triplicate treatments consisted of 2.8 kg of crushed/destemmed Shiraz grapes and were fermented in 3 L glass jars at 28 °C. Inoculation was with 250 mg/L S. cerevisiae Lalvin EC1118 yeast (Lallemand Australia, Edwardstown, Australia) and cap management consisted of a daily punch down. The fermentation was monitored twice daily with a DMA 35 N portable density meter (Anton Paar GmbH, Graz, Austria). After reaching consecutive negative Baumé readings, the Shiraz wines were pressed with a small air-inflated membrane press to 2 bar pressure, and the Chardonnay wines were racked off the yeast lees. This time point was referred to as post-alcoholic fermentation (PAF). Afterward, both Chardonnay and Shiraz wines had a 50 mg/L SO2 addition and were allowed to settle at 4 °C for 60 days (PCold for Chardonnay, PB for Shiraz). After the cold stabilization, each fermented Chardonnay wine was divided into two equal volumes, one of which was treated with 0.8 g/L Optibent bentonite (calcium bentonite, Martin Vialatte, Magenta, France, Bent), and the other had no bentonite addition (nonB). Then, both portions were stored at 18 °C for 3 days. Then, the Chardonnay and Shiraz wines were racked off the sediments (sampled as PB), added with 30 mg/L of SO2, and were bottled in 375 mL green glass bottles that had been purged with carbon dioxide and sealed with a screw cap. All of the bottled wines were stored at 14 °C for 15 months in darkness (15Mo).

2.3. Juice, Must, and Wine Compositional Analyses

Analyses were conducted at five stages for Chardonnay and four stages for the Shiraz treatments. For Chardonnay, measurements were performed on the juice (J), post-fermentation (PAF), post-cold stabilization (PCold), pre-bottling with and without bentonite treatment (PB_Bent and PB_nonB, respectively), and after 15 months of bottle aging (15Mo). For Shiraz, samples were analyzed from the must (M), PAF, pre-bottling (PB), and 15Mo. All of the measurements were conducted on fresh juice/must or wine samples immediately after collection, with the exception of aldehyde compounds that were analyzed after storage at −80 °C.
Free and total concentrations of SO2 were analyzed using the FIAStar 5000 analyzer (FOSS, Melbourne, VIC, Australia), and the pH and titratable acidity (TA) were measured by an 888 Titrando automatic titrator (Metrohm, Gladesville, NSW, Australia). Alcohol concentration was measured with an Anton Paar Alcolyzer (Wine, North Ryde, NSW, Australia).
The total metal concentrations in the wines were determined by inductively coupled plasma optical emission spectrometry (ICP-OES, Varian 710, Varian, Palo Alto, CA, USA) as described by Rousseva et al. [35]. Non-sulfide-bound Cu (free Cu) was measured by medium exchange constant current stripping potentiometry (ME-CCSP) utilizing a thin mercury film on screen-printed carbon electrodes as described by Clark et al. [36]. LMWSCs were analyzed by the method adopted from Siebert et al. [37]. The gas-chromatography (GC, Agilent 7890B GC system, Agilent Technologies Australia, Mulgrave, VIC, Australia) and sulfur chemiluminescence detector (SCD, Agilent 355 SCD, Agilent Technologies Australia) conditions were set up as per Rousseva et al. [35], and a DB-Sulfur SCD column (60 m, 0.32 mm, 4.2 µm, Agilent J&W Scientific, Agilent Technologies Australia) was utilized. The concentrations of volatile aldehyde compounds in wine were quantified by liquid-chromatography-QQQ-mass spectrometry (LC-QQQ-MS, Agilent 6400 LC system, and Agilent 6470 Triple Quardrupole MS system, Agilent Technologies Australia) as per Zhang et al. [38]. The column used for this technique was an Acquity UPLC BEH C18 column (1.7 µm, 2.1 mm × 50 mm, Waters Australia, Rydalmere, NSW, Australia). Esters, C6 compounds, terpenes, and lactones were determined by headspace solid-phase-microextraction (HS-SPME, DVB/CAR/PDMS fiber, Supelco, Bellefontem, PA, USA) coupled to GC-MS (Agilent 7890 GC and Agilent 5975C MS system, Agilent Technologies Australia), installed a DB-WAXetr capillary column (60 m, 0.25 mm, 0.25 μm, Agilent J&W Scientific), as described by Antalick et al. [39]. Wine color parameters were measured by spectrophotometer (UV-1700, Shimadzu, Kyoto, Japan) according to the methods outlined by Somers and Evans [40]. The protein concentrations of the samples were determined by the Bradford dye-binding microassay method [41]. In a cuvette, 1 mL of Brandford’s reagent and 0.1 mL of sample were mixed, left for 30 min, and then measured by spectrophotometer (Thermo Fisher Scientific Australia, Scoresby, VIC, Australia) at 595 nm. Quantification was achieved with an external calibration curve obtained from model wine solution spiked with bovine serum albumin (BSA) standard.

2.4. Statistical Analysis

Statistical analyses were performed on SPSS (IBM, Armonk, NY, USA). One-way analysis of variance (ANOVA) was conducted to compare the difference among the five treatments (control, LCu, HCu, LSO2, and HSO2) within the same wine at each sampling point. The means were separated using the Duncan’s test and different letters represent significant differences at p ≤ 0.05. The quoted uncertainty is the standard deviation of three replications within one treatment.

3. Results and Discussion

For the terminology associated with the measurement of Cu forms in wine utilizing the ME-CCSP method, the Cu detected is termed as ‘free Cu’, while that not detected is termed as ‘bound Cu’. This is a simplification of the terminology used for the same electrochemical technique in a recent publication [36], which referred to both forms as ‘non-sulfide bound Cu’ and ‘sulfide-bound Cu’, respectively.

3.1. Basic Parameters for Chardonnay and Shiraz Wines

After fermentation, pH, TA, and ethanol concentrations were determined for both Chardonnay and Shiraz wines. For Chardonnay, the average pH of all of the wine samples was 3.76 ± 0.01, TA was 4.40 ± 0.08 g/L tartaric acid equivalents, and the ethanol concentration was 13.3 ± 0.1% (v/v). The equivalent results for Shiraz wines were 4.24 ± 0.05, 4.32 ± 0.33 g/L tartaric acid equivalents, and 13.8 ± 0.2% (v/v), respectively.

3.2. Evolution of the Concentrations of Cu and SO2 during Wine Production

The concentrations of Cu and SO2 at each sampling time point are shown in Table 1 and Table 2. As expected, the concentrations of total Cu for each sample (i.e., control, LCu, HCu, LSO2, and HSO2) decreased dramatically in both Chardonnay and Shiraz wines (i.e., compare J/M to PAF, Table 1 and Table 2) as a consequence of fermentation. The observed decrease in concentration was greater than 90% and 70%, respectively, consistent with the results previously reported by Bekker et al. [42], Rousseva et al. [35], and Vystavna et al. [43].
After cold stabilization (PCold for Chardonnay, PB for Shiraz), an additional reduction in total Cu concentration was evident in both wines (Table 1 and Table 2). This was most likely due to the removal of Cu associated with the further settling of yeast lees and grape solids [42]. For the Chardonnay wine, the Cu treatments to the juice resulted in higher Cu concentrations in the final wine (i.e., compare control to LCu to HCu at PAF, Table 1). The bentonite treatment of the Chardonnay wines also removed 18%–44% of total Cu from the wine, as observed by Bekker et al. [42], but LCu and HCu samples still contained more than triple the total Cu than the control at PB. After 15 months of bottle aging, there were trends of lower total Cu concentrations, but the differences were not generally significant (p ≤ 0.05, Table 1). Consequently, the differences in total Cu concentrations at PAF induced by the treatments to the Chardonnay juice (J) remained in the finished wines (at PB) and the wines after bottle aging (at 15Mo), albeit with a reduced magnitude of difference. This was the case despite the multiple production steps between the juice and the bottle aged wines.
Alternatively, in the Shiraz wines, the total Cu concentrations were not significantly different (p ≤ 0.05) between treatments after fermentation (Table 2), with the final Cu concentration in the Shiraz wines seemingly independent of the Cu treatments to the must. The different outcome for total Cu in the two grape varieties is probably a consequence of the presence of grape solids in the Shiraz fermentation compared to the minimal amount of solids in the Chardonnay fermentation.
In Chardonnay at PAF, the concentrations of both free and bound Cu were higher with increasing additions of Cu to the juice (Table 1). Free Cu tended to increase from PAF to PB, while the opposite result was observed for bound Cu (Table 1). A portion of the decrease in bound Cu would be due to the decreases in total Cu, and the increases in free Cu were consistent with oxygen exposure to the wine during the different wine production steps. The oxidation of wine can lead to the dissociation of the Cu–sulfide complexes (bound Cu) and regeneration of Cu(II) (free Cu) [44,45]. For the Shiraz, the HCu treatment had the highest free Cu concentration at PAF, but by PB, there was minimal difference among all samples. In Shiraz wines, both free and bound Cu decreased significantly (p ≤ 0.05) after the cold stabilization (PB for Shiraz, Table 2). The large decrease in free Cu in the Shiraz HCu treatment may have been a consequence of the high phenolic concentration in the wine sample, leading to faster oxygen consumption compared to the white wine. This would have allowed a low oxygen concentration to be reached relatively rapidly in the Shiraz wine, and hence it favored free Cu in sequestering sulfide from sources in the wine. Low oxygen conditions in wine are known to induce a decrease in free Cu in certain wines [46].
The addition of SO2 to grape juice/must did not significantly (p ≤ 0.05) impact the total or free Cu concentration for either Chardonnay or Shiraz throughout the production process (Table 1 and Table 2). SO2 has been reported to lead to the degradation of polysulfanes to generate H2S [47], but in this study, the results did not reflect a significant (p ≤ 0.05) decrease in free Cu and increase in bound Cu for wines when the SO2 was added prior to fermentation.
The SO2-treated Shiraz musts (M) had particularly high total SO2 concentrations with poor precision, which was due to the difficulty of mixing and taking a representative sample from the must. As expected, free SO2 was largely absent in all the wine samples after fermentation (PAF), regardless of any SO2 addition to the grape juice/must (Table 1 and Table 2). In the Shiraz wines, the total SO2 concentrations were lower than those for Chardonnay, which was presumably due to more rapid oxidative losses in the must and/or due to the adsorption onto solid materials. After 15 months of aging (15Mo), both Chardonnay and Shiraz wines showed lower total SO2 concentrations than at bottling (PB-post SO2).

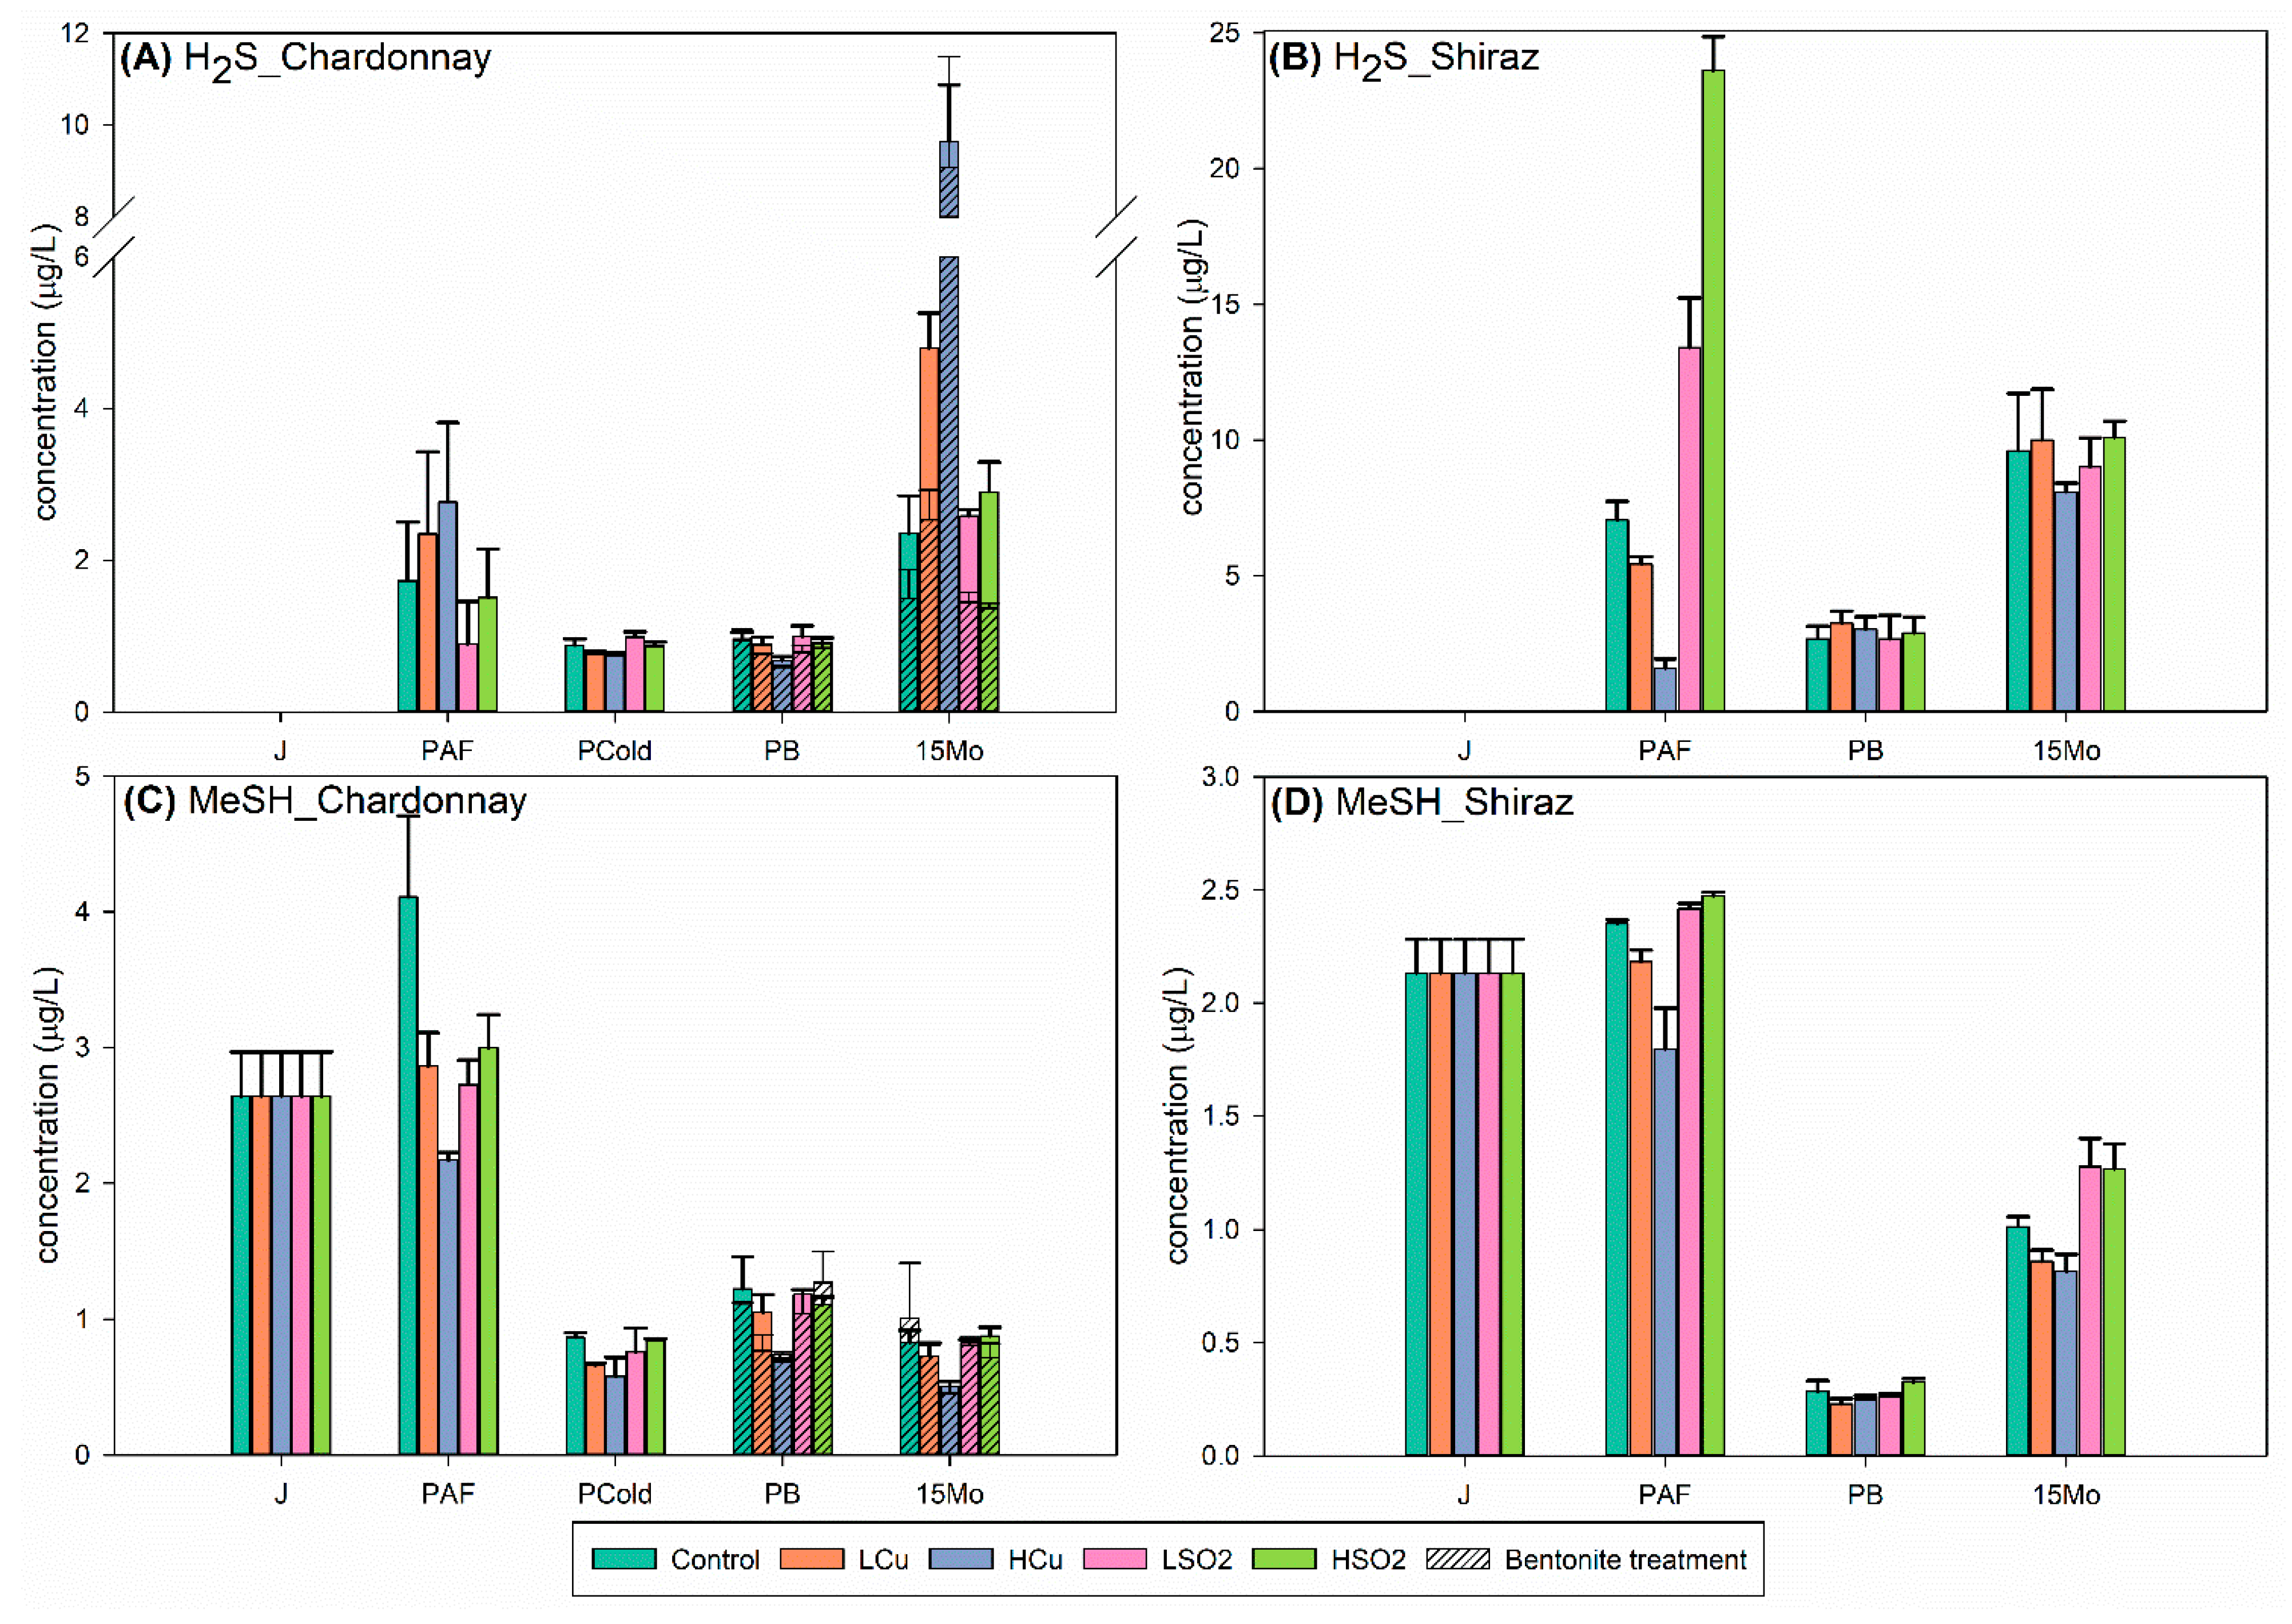
3.3. Impact of Cu or SO2 Addition to Juice/Must on Total Concentrations of Low Molecular Weight Sulfur Compounds (LMWSCs) in Wine

The method used to measure the LMWSCs in wine involved the saturation of wine with 300 g/L of NaCl and incubation for 30 min at 45 °C [37]. For the majority of LMWSCs, this method is recognized as measuring the total concentrations, including the forms bound to metals as well as non-metal bound forms. The exception is hydrogen sulfide/sulfide, for which the pretreatment is regarded as being insufficient to release all sulfide from metal complexes, particularly Cu. In this instance, the measured sulfide concentration represents the sulfide in wine that is not bound to metals and sulfide that can be released from metal complexes based on the pretreatment [48].
Of the measured LMWSCs, only H2S and MeSH were significantly (p ≤ 0.05) influenced by the Cu and SO2 treatments (Figure 1, Table S2). For Chardonnay, after fermentation (PAF), a trend to increased H2S concentration with higher Cu addition to the grape juice (J) was evident (Figure 1A). This is consistent with Cu being toxic for yeast [49], which consequently up-regulates the expression of sulfur metabolism related genes [50] to convert Cu to the less toxic sulfide-bound form. After the cold stabilization (PCold for Chardonnay), the concentrations of H2S dropped to below its odor threshold of 1.1 µg/L [37] in all of the Chardonnay treatments. This may have been a consequence of the oxidative wine production process [42], the removal of some colloidal sulfide (e.g., complexed to Cu) during racking, and volatile H2S losses.
It is interesting that the decrease in bound Cu (i.e., sulfide bound) with bentonite treatments (Table 1) did not show equivalent decreases in H2S (Figure 1A). The lack of change in H2S concentrations with bentonite treatments may be due to the incomplete dissociation of all bound sulfide from Cu during the LMWSCs quantification [48]. After 15 months of bottle aging (15Mo), the Cu addition treatments had significantly (p ≤ 0.05) increased H2S concentrations in the Chardonnay wines. However, the bentonite-treated low Cu addition samples (LCu) showed significantly (p ≤ 0.05) lower H2S concentrations after 15 months of bottle aging compared to the equivalent samples without bentonite treatment (Figure 1A). Cu has the ability to sequester sulfide when low oxygen conditions are reached in wine [46,51,52]. Therefore, the higher measured H2S concentrations in the non-bentonite aged wines may have resulted from the free Cu in the finished wines sequestering sulfide during bottle aging. As bentonite removes proteins, which may act as a potential source for sulfide in wine, this may explain why significantly (p ≤ 0.05) lower H2S concentrations were measured in several bentonite-treated wines after 15 months of bottle aging. Additionally, the elevated Fe concentration (Table S2) in bentonite-treated wines [35,42] may have accelerated wine oxidation, and contributed to an increased oxidative loss of H2S. Apart from Cu treatment, SO2 addition to the grape juice did not significantly (p ≤ 0.05) alter the H2S concentration in Chardonnay (Figure 1A).
The concentrations of H2S in the Shiraz wines were predominantly higher than the equivalent treatments for the Chardonnay wines, which may have been induced by a lower yeast assimilable nitrogen (YAN) concentration in the Shiraz must (180 mg/L) compared to the Chardonnay juice (340 mg/L) (Figure 1B). Additionally, in contrast to the trends observed in Chardonnay wines, the Shiraz wines at PAF had a progressively lower H2S concentration in the samples with increasing Cu addition to the must (Figure 1B). However, the measured bound Cu showed no decrease with Cu treatments from post-fermentation (PAF) to 15 months of aging (15Mo) (Table 2). Hence, the apparent decrease in H2S concentration may have been due to an incomplete dissociation of the copper sulfide complexes during quantification [48]. Again, in contrast to the Chardonnay wines, the elevated SO2 concentration in the grape must significantly (p ≤ 0.05) increased the H2S concentration in the Shiraz wines (Figure 1B). SO2 is a potential source of sulfur for the yeast during fermentation and can contribute to the H2S production [22], especially when nitrogen availability is low [17]. The Shiraz juice YAN of 180 mg/L is at the lower level of the suggested YAN concentration range for fermentation [53]. Therefore, in combination with elevated SO2, it may have facilitated the accumulation of H2S in the Shiraz wines.
Cu addition to the grape juice/must lowered the concentrations of MeSH after fermentation (PAF) in both wine matrices (Figure 1C,D). Similar to H2S, the concentrations of MeSH decreased significantly (p ≤ 0.05) after the cold stabilization in both Chardonnay (PCold) and Shiraz (PB) wines, and any differences that were previously evident were largely eliminated by PB (Figure 1C). This decrease in concentration was most likely caused by the oxygen exposure to the wines during production [52]. Bentonite treatment had little influence on MeSH concentration. After 15 months of bottle aging, the influence of juice/must Cu treatments to lower MeSH concentrations was evident and more prevalent for Shiraz than Chardonnay wines (Figure 1C,D). The relationship of increased Cu concentrations with lower MeSH concentrations during bottle aging has been previously described in wine [54]. Consequently, the presence of Cu in the juice/must created long-term MeSH concentration differences in both Chardonnay and Shiraz wines, despite this effect being not evident for Shiraz wine at bottling.
The SO2 treatment to the juice significantly (p ≤ 0.05) decreased the concentrations of MeSH in Chardonnay after fermentation (PAF), but this influence was not detected in any measurements after cold stabilization (PCold for Chardonnay, Figure 1C). In contrast, in Shiraz, the SO2 treatment did not display any significant (p ≤ 0.05) influence until 15Mo, with increased MeSH concentrations in both of the two SO2 treated wine samples at 15Mo (HSO2 and LSO2 treatments, Figure 1C,D). The presence of increased concentrations of SO2 in the Shiraz must may have led to increased precursors for MeSH, such as methionine, which may have been degraded during bottle adding to produce MeSH [55].

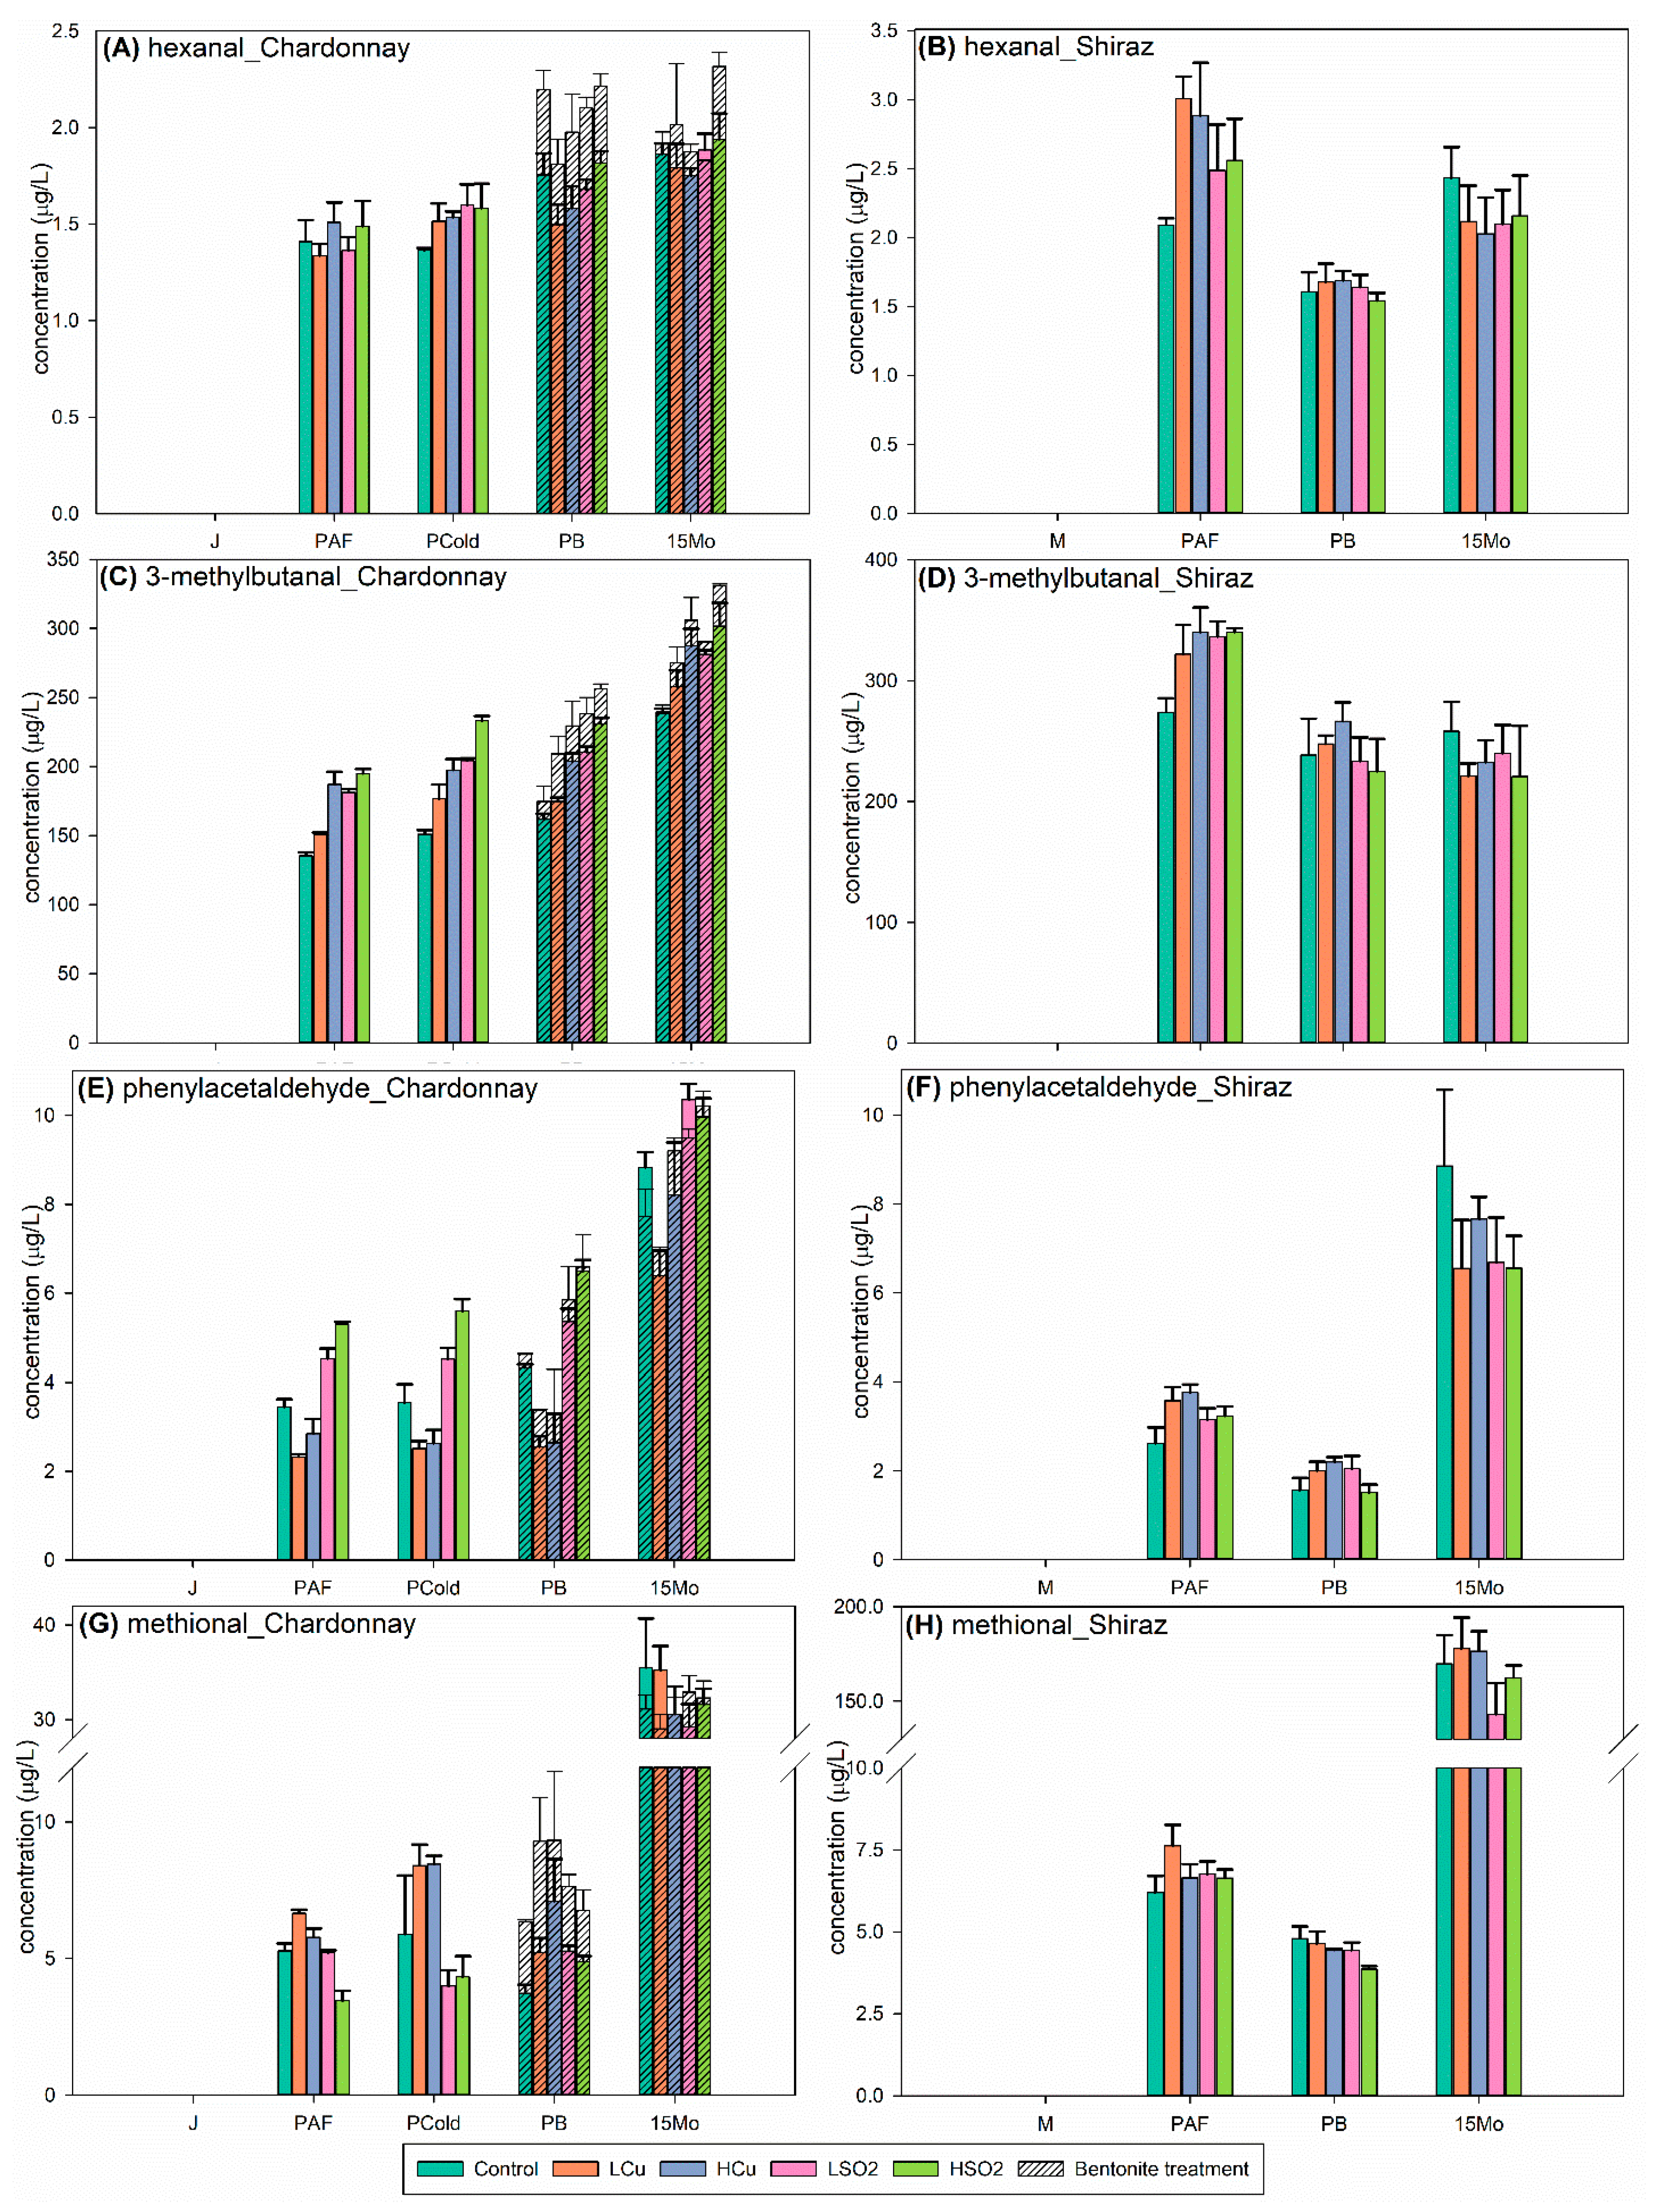
3.4. Impact of Cu or SO2 Addition to Juice/Must on Total Concentrations of Volatile Aldehyde Compounds in Wine

The addition of Cu or SO2 to grape juice/must influenced several of the measured volatile aldehyde compounds in the finished and bottle aged wines (Table S2), including certain Strecker aldehydes (e.g., 3-methylbutanal, phenylacetaldehyde, and methional) and hexanal. The effects of the added Cu or SO2 on these aldehyde compounds were different for the Chardonnay and Shiraz wines.
Most aldehyde compounds showed increasing concentrations in the Chardonnay wines throughout the wine production process (from PAF to PB), while a negligible change or a decrease occurred in the Shiraz wines (Table S2). Examples included 2-methylpropanal, 3-methylbutanal, phenylacetaldehyde, hexanal, benzaldehyde, and methional. Bueno et al. [56] reported a negative relationship between the accumulation of certain volatile aldehyde compounds in bottle aged red wines with the concentration of aldehyde-reactive phenolic compounds. The latter phenolic compounds included anthocyanins and procyanidins. The different aldehyde concentration changes observed for white and red wines were most likely a consequence of the lower aldehyde-reactive phenolic concentration and higher free SO2 concentration in the white wine compared to red wine. This would allow aldehyde compounds to accumulate more in white, albeit in their hydrogen sulfite-bound form. Although the SO2 concentrations in the Chardonnay and Shiraz wines were adjusted to similar concentrations after fermentation (Section 2.2), the free SO2 measured in red wines includes the portion that is actually bound to anthocyanins.
Cu and SO2 additions to the grape must, regardless of the magnitude of addition, increased the concentration of hexanal after fermentation in Shiraz wines (Figure 2B), while no significant (p ≤ 0.05) effect was observed in Chardonnay wines (Figure 2A). Somewhat surprisingly, in the Shiraz wines, the influence of Cu was more significant than SO2, despite SO2 having the ability to act as a binding agent for aldehyde compounds. However, it should be noted that the higher SO2 concentration in the juice/must may also stimulate the production of acetaldehyde by S. cerevisiae [57]. The generated acetaldehyde would bind SO2 more strongly than hexanal and hence limit the efficacy of SO2 to trap hexanal. If not bound to SO2, the hexanal present during fermentation may be more readily metabolized by yeast (e.g., reduced to hexenol) or react with flavonoid compounds, and thereby decrease in concentration. The role of Cu in increasing hexanal concentration is unclear. It is possible that Cu could influence the oxidative processes (i.e., chemical oxidation of lipids), particularly if oxygen concentrations increased toward the end of fermentation. However, although the effects of Cu and SO2 treatments were evident on hexanal concentrations in Shiraz wines at PAF, these differences had largely disappeared by bottling (PB). For Chardonnay, the bentonite treatment led to elevated concentrations of hexanal at PB, but this effect only remained significant (p ≤ 0.05) for the high SO2 treatment (HSO2) after 15 months of bottle aging. This concentration increase was possibly due to the higher Fe concentrations (Table S2) in the bentonite-treated wines [35], inducing a higher oxidative production of hexanal.
For 3-methylbutanal and phenylacetaldehyde, the impacts of Cu and SO2 treatments were significant (p ≤ 0.05) in both Chardonnay and Shiraz (Figure 2C–F). In all cases, the SO2 treatment led to increased concentrations of both aldehydes immediately after fermentation (PAF). In the Chardonnay, a further increase in the concentrations of the two aldehydes occurred after PAF as for hexanal, and the treatment effects remained significant (p ≤ 0.05) until after 15 months of bottle aging (15Mo, Figure 2C,E). This indicated that the Chardonnay juice SO2 concentration influenced the 3-methylbutanal and phenylacetaldehyde concentrations in wine until at least 15 months after bottling, regardless of the multiple wine production steps and the standard SO2 additions after fermentation. This in turn indicated that upon free SO2 depletion in the wine during aging (i.e., oxidatively or thermally), the wines with more SO2 addition to the juice had a larger reservoir of oxidative-aroma compounds to release.
With Cu treatment, phenylacetaldehyde concentrations decreased after fermentation (PAF) and remained reduced until PB. However, the differences were less evident after bottle aging (15Mo, Figure 2E). Bentonite treatment increased the concentrations of 3-methylbutanal in most Chardonnay samples at PB and/or 15Mo (Figure 2C,E). In the Shiraz, both SO2 and Cu treatments increased the concentrations of 3-methylbutanal and phenylacetaldehyde at PAF, which then decreased significantly (p ≤ 0.05) until PB, when no difference amongst treatments was found (Figure 2D,F). The increase in phenylacetaldehyde concentration during red wine aging, as observed in Figure 2F, has also been reported by Bueno et al. [56], who indicated that this compound was less reactive to flavonoids than other Strecker aldehydes.
Methional only showed a marginal difference in the Chardonnay wines after cold stabilization (PCold for Chardonnay, Figure 2G–H). Benzaldehyde, the least electrophilic compound of all the aldehydes studied, was the only aldehyde that showed no decrease in concentration during the Shiraz production (Figure S1). This is consistent with benzaldehyde having a particularly slow reaction rate with red wine flavonoid compounds [12]. The lack of an SO2-induced (SO2 treatment) effect on benzaldehyde is also consistent with it being a particularly weak binder to hydrogen sulfite [12].

3.5. Impacts of Cu or SO2 Addition to Juice/Must on Wine Color Parameters, Protein Concentration (Chardonnay Only), and Esters and Terpenes Concentrations in Wine

Results of the color parameters, esters and terpenes for both Chardonnay and Shiraz, and the protein concentration of the Chardonnay, are summarized in Tables S3 and S4. No significant (p ≤ 0.05) influences from the Cu or SO2 additions to the grape juice/must were observed for most of these features in either of the wine matrices.
Another interesting observation was that the Cu addition to the grape juice/must resulted in an increased concentration of certain esters after fermentation (PAF). Three higher alcohol acetates (HAAs), two ethyl esters of fatty acid (EEFAs), two ethyl esters of cinnamic acids (EECAs), and ethyl propanoate showed increased concentrations in Shiraz with Cu additions to the must. Alternatively, the Cu and SO2 addition to Shiraz must resulted in decreased ethyl phenylacetate concentrations after fermentation (PAF). For Chardonnay wines, five HAAs were increased at PAF with Cu additions to the juice (Table S4).

4. Conclusions

In Chardonnay, the concentration differences of total Cu and free Cu remained significant until bottle aging for 15 months. However, in the Shiraz wines, there was no significant difference for total Cu, except for free Cu at post-fermentation. Cu treatments increased the H2S concentration in Chardonnay, and SO2 must additions resulted in elevated H2S concentrations in the Shiraz wines. While none of the treatments were found to have an effect on H2S concentrations at bottling, the impacts of Cu treatment remerged after 15 months of aging in the Chardonnay wines, regardless of the bentonite treatment. Cu treatments in the juice/must repressed MeSH concentrations in all the wines after fermentation, regardless of variety. However, the differences were most evident in Chardonnay after fermentation and became less significant after 15 months of bottle aging. In Shiraz, differences in MeSH levels decreased at bottling, but remerged after bottle aging. Both of the Cu and SO2 additions increased the concentrations of hexanal, 3-methylbutanal, and phenylacetaldehyde after fermentation, showed no influences at the pre-bottling stage, and decreased their concentrations after bottle aging in Shiraz wines. In Chardonnay, only 3-methylbutanal and phenylacetaldehyde were impacted by Cu and SO2 treatments, and importantly, the treatment effects remained significant throughout the wine production and the bottle aging process. Bentonite treatments increased the concentrations of most measured aldehydes, and this effect largely remained throughout bottle aging. Hexanal and methional showed more subtle differences due to Cu treatments after the cold stabilization, and no differences were evident after bottle aging. This study shows that the SO2 and Cu composition of juice/must can have long-term implications for wine composition, and in particular it can impact wine compounds that are linked to oxidative and reductive wine aroma.

Supplementary Materials

The following are available online at https://0-www-mdpi-com.brum.beds.ac.uk/2306-5710/5/4/70/s1. Table S1. Analytical standards used for the chemical analysis; Table S2. Concentrations of Fe (mg/L) in Chardonnay wines, and concentrations (µg/L) of analysed LMWSCs and volatile aldehyde compounds in Chardonnay and Shiraz wines during production and bottle aging process; Table S3. Color parameters and protein concentrations (Chardonnay only) of Chardonnay and Shiraz wines at PB; Table S4. Concentrations (µg/L) of analyzed esters, C6 compounds, terpenes, and C13 compounds in Chardonnay and Shiraz wines during production and the bottle aging process; Figure S1. Concentrations of benzaldehyde in Chardonnay and Shiraz wines during production and the bottle aging process. The X-axis of the figure represented sampling time points: J/M, juice/must; PAF, post-alcoholic fermentation; PCold, post-cold stabilization; PB, pre-bottling; 15Mo, 15 months after bottle aging. (A) Benzaldehyde in Chardonnay wines; (B) benzaldehyde in Shiraz wines.

Author Contributions

Conceptualization, X.Z., N.K., and A.C.C.; methodology, X.Z. and J.W.B.; investigation, X.Z., N.K., and A.C.C.; resources, J.W.B.; data curation, X.Z. and N.K.; writing–original draft preparation, X.Z.; writing–review and editing, X.Z., N.K., J.W.B. and A.C.C.; visualization, X.Z.; supervision, A.C.C.

Funding

This research was funded by Charles Sturt University Postgraduate Research Scholarship and Wine Australia (AGW Ph1509).

Acknowledgments

This work was conducted as part of a Ph.D. program at the National Wine and Grape Industry Centre (NWGIC) supported by a Charles Sturt University Postgraduate Research Scholarship and an International Tuition Payment scholarship. Further stipend and operating support was provided by Wine Australia (AGW Ph1509). The NWGIC is a research centre within Charles Sturt University in alliance with the Department of Primary Industries New South Wales (NSW) and the NSW Wine Industry Association. Technical assistance from Michael Loughlin during LC-QQQ-MS analysis was greatly appreciated.

Conflicts of Interest

The authors declare no conflict of interest.

References

  1. Bueno, M.N.; Carrascón, V.; Ferreira, V. Release and formation of oxidation-related aldehydes during wine oxidation. J. Agric. Food Chem. 2016, 64, 608–617. [Google Scholar] [CrossRef] [PubMed] [Green Version]
  2. Laurie, V.F.; Clark, A.C. Wine oxidation. In Oxidation in Foods and Beverages and Antioxidant Applications. Volume 2: Management in Different Industry Sectors; Decker, E.A., Elias, R.J., McClements, D.J., Eds.; Woodhead Publishing Ltd.: Cambridge, UK, 2010; pp. 445–475. [Google Scholar]
  3. Robinson, A.L.; Boss, P.K.; Solomon, P.S.; Trengove, R.D.; Heymann, H.; Ebeler, S.E. Origins of grape and wine aroma. Part 1. Chemical components and viticultural impacts. Am. J. Enol. Vitic. 2014, 65, 1–24. [Google Scholar] [CrossRef] [Green Version]
  4. Culleré, L.; Cacho, J.; Ferreira, V. An assessment of the role played by some oxidation-related aldehydes in wine aroma. J. Agric. Food Chem. 2007, 55, 876–881. [Google Scholar] [CrossRef] [PubMed]
  5. Silva Ferreira, A.C.; Hogg, T.; Guedes de Pinho, P. Identification of key odorants related to the typical aroma of oxidation-spoiled white wines. J. Agric. Food Chem. 2003, 51, 1377–1381. [Google Scholar] [CrossRef] [PubMed]
  6. Hazelwood, L.A.; Daran, J.-M.; van Maris, A.J.A.; Pronk, J.T.; Dickinson, J.R. The Ehrlich pathway for fusel alcohol production: A century of research on Saccharomyces cerevisiae metabolism. Appl. Environ. Microbiol. 2008, 74, 2259–2266. [Google Scholar] [CrossRef] [PubMed] [Green Version]
  7. Grant-Preece, P.; Fang, H.; Schmidtke, L.M.; Clark, A.C. Sensorially important aldehyde production from amino acids in model wine systems: Impact of ascorbic acid, erythorbic acid, glutathione and sulphur dioxide. Food Chem. 2013, 141, 304–312. [Google Scholar] [CrossRef]
  8. Rizzi, G.P. Formation of strecker aldehydes from polyphenol-derived quinones and α-amino acids in a nonenzymic model system. J. Agric. Food Chem. 2006, 54, 1893–1897. [Google Scholar] [CrossRef]
  9. Pripis-Nicolau, L.; de Revel, G.; Bertrand, A.; Maujean, A. Formation of flavor components by the reaction of amino acid and carbonyl compounds in mild conditions. J. Agric. Food Chem. 2000, 48, 3761–3766. [Google Scholar] [CrossRef]
  10. Ugliano, M. Oxygen contribution to wine aroma evolution during bottle aging. J. Agric. Food Chem. 2013, 61, 6125–6136. [Google Scholar] [CrossRef]
  11. Barbe, J.-C.; de Revel, G.; Annick, J.; Lonvaud-Funel, A.; Bertrand, A. Role of carbonyl compounds in SO2 binding phenomena in musts and wines from botrytized grapes. J. Agric. Food Chem. 2000, 48, 3413–3419. [Google Scholar] [CrossRef]
  12. De Azevedo, L.C.; Reis, M.M.; Motta, L.F.; da Rocha, G.O.; Silva, L.A.; de Andrade, J.B. Evaluation of the formation and stability of hydroxyalkylsulfonic acids in wines. J. Agric. Food Chem. 2007, 55, 8670–8680. [Google Scholar] [CrossRef] [PubMed]
  13. Cruz, M.P.; Valente, I.M.; Gonçalves, L.M.; Rodrigues, J.A.; Barros, A.A. Application of gas-diffusion microextraction to the analysis of free and bound acetaldehyde in wines by HPLC–UV and characterization of the extracted compounds by MS/MS detection. Anal. Bioanal. Chem. 2012, 403, 1031–1037. [Google Scholar] [CrossRef] [PubMed]
  14. Mattivi, F.; Arapitsas, P.; Perenzoni, D.; Guella, G. Influence of storage conditions on the composition of red wines. In Advances in Wine Research; Ebeler, S.B., Sacks, G., Vidal, S., Winterhalter, P., Eds.; American Chemical Society: Washington, DC, USA, 2015; pp. 29–49. [Google Scholar]
  15. Ferreira, V.; Bueno, M.; Franco-Luesma, E. New insights into the chemistry involved in aroma development during wine bottle aging: Slow redox processes and chemical equilibrium shifts. In Advances in Wine Research; Ebeler, S.B., Sacks, G., Vidal, S., Winterhalter, P., Eds.; American Chemical Society: Washington, DC, USA, 2015; pp. 275–289. [Google Scholar]
  16. Escudero, A.; Cacho, J.; Ferreira, V. Isolation and identification of odorants generated in wine during its oxidation: A gas chromatography–olfactometric study. Eur. Food Res. Technol. 2000, 211, 105–110. [Google Scholar] [CrossRef]
  17. Smith, M.E.; Bekker, M.Z.; Smith, P.A.; Wilkes, E.N. Sources of volatile sulfur compounds in wine. Aust. J. Grape Wine Res. 2015, 21, 705–712. [Google Scholar] [CrossRef]
  18. Moreira, N.; Mendes, F.; Pereira, O.; Guedes de Pinho, P.; Hogg, T.; Vasconcelos, I. Volatile sulphur compounds in wines related to yeast metabolism and nitrogen composition of grape musts. Anal. Chim. Acta 2002, 458, 157–167. [Google Scholar] [CrossRef]
  19. Moreira, N.; Guedes de Pinho, P.; Santos, C.; Vasconcelos, I. Volatile sulphur compounds composition of monovarietal white wines. Food Chem. 2010, 123, 1198–1203. [Google Scholar] [CrossRef]
  20. Bekker, M.Z.; Day, M.P.; Holt, H.; Wilkes, E.; Smith, P.A. Effect of oxygen exposure during fermentation on volatile sulfur compounds in Shiraz wine and a comparison of strategies for remediation of reductive character. Aust. J. Grape Wine Res. 2016, 22, 24–35. [Google Scholar] [CrossRef]
  21. Hallinan, C.P.; Saul, D.J.; Jiranek, V. Differential utilisation of sulfur compounds for H2S liberation by nitrogen-starved wine yeasts. Aust. J. Grape Wine Res. 1999, 5, 82–90. [Google Scholar] [CrossRef]
  22. Swiegers, J.H.; Pretorius, I.S. Modulation of volatile sulfur compounds by wine yeast. Appl. Microbiol. Biotechnol. 2007, 74, 954–960. [Google Scholar] [CrossRef]
  23. Franco-Luesma, E.; Ferreira, V. Reductive off-odors in wines: Formation and release of H2S and methanethiol during the accelerated anoxic storage of wines. Food Chem. 2016, 199, 42–50. [Google Scholar] [CrossRef] [Green Version]
  24. Landaud, S.; Helinck, S.; Bonnarme, P. Formation of volatile sulfur compounds and metabolism of methionine and other sulfur compounds in fermented food. Appl. Microbiol. Biotechnol. 2008, 77, 1191–1205. [Google Scholar] [CrossRef] [PubMed]
  25. Bekker, M.Z.; Wilkes, E.N.; Smith, P.A. Evaluation of putative precursors of key ‘reductive’ compounds in wines post-bottling. Food Chem. 2018, 245, 676–686. [Google Scholar] [CrossRef] [PubMed]
  26. Ugliano, M.; Dieval, J.B.; Siebert, T.E.; Kwiatkowski, M.; Aagaard, O.; Vidal, S.; Waters, E.J. Oxygen consumption and development of volatile sulfur compounds during bottle aging of two Shiraz wines. Influence of pre- and postbottling controlled oxygen exposure. J. Agric. Food Chem. 2012, 60, 8561–8570. [Google Scholar] [CrossRef] [PubMed]
  27. He, J.; Zhou, Q.; Peck, J.; Soles, R.; Qian, M.C. The effect of wine closures on volatile sulfur and other compounds during post-bottle ageing. Flavour Fragr. J. 2013, 28, 118–128. [Google Scholar] [CrossRef]
  28. Ye, D.-Q.; Zheng, X.-T.; Xu, X.-Q.; Wang, Y.-H.; Duan, C.-Q.; Liu, Y.-L. Evolutions of volatile sulfur compounds of Cabernet Sauvignon wines during aging in different oak barrels. Food Chem. 2016, 202, 236–246. [Google Scholar] [CrossRef] [PubMed]
  29. De Mora, S.J.; Lee, P.; Shooter, D.; Eschenbruch, R. The analysis and importance of dimethylsulfoxide in wine. Am. J. Enol. Vitic. 1993, 44, 327–332. [Google Scholar]
  30. Longo, R.; Blackman, J.W.; Antalick, G.; Torley, P.J.; Rogiers, S.Y.; Schmidtke, L.M. A comparative study of partial dealcoholisation versus early harvest: Effects on wine volatile and sensory profiles. Food Chem. 2018, 261, 21–29. [Google Scholar] [CrossRef]
  31. Kreitman, G.Y.; Danilewicz, J.C.; Jeffery, D.W.; Elias, R.J. Reaction mechanisms of metals with hydrogen sulfide and thiols in model wine. Part 1: Copper-catalyzed oxidation. J. Agric. Food Chem. 2016, 64, 4095–4104. [Google Scholar] [CrossRef]
  32. Clark, A.C.; Grant-Preece, P.; Cleghorn, N.; Scollary, G.R. Copper(II) addition to white wines containing hydrogen sulfide: Residual copper concentration and activity. Aust. J. Grape Wine Res. 2015, 21, 30–39. [Google Scholar] [CrossRef]
  33. Ribéreau-Gayon, P.; Dubourdieu, D.; Donèche, B.; Aline, L. Hand book of Enology. Volume 1: The Microbiology of Wine and Vinifications, 2nd ed.; John Wiley & Sons Ltd.: Chichester, UK, 2006. [Google Scholar]
  34. Miotto, A.; Ceretta, C.A.; Brunetto, G.; Nicoloso, F.T.; Girotto, E.; Farias, J.G.; Tiecher, T.L.; De Conti, L.; Trentin, G. Copper uptake, accumulation and physiological changes in adult grapevines in response to excess copper in soil. Plant Soil 2014, 374, 593–610. [Google Scholar] [CrossRef] [Green Version]
  35. Rousseva, M.; Kontoudakis, N.; Schmidtke, L.M.; Scollary, G.R.; Clark, A.C. Impact of wine production on the fractionation of copper and iron in Chardonnay wine: Implications for oxygen consumption. Food Chem. 2016, 203, 440–447. [Google Scholar] [CrossRef] [PubMed]
  36. Clark, A.C.; Kontoudakis, N.; Barril, C.; Schmidtke, L.M.; Scollary, G.R. Measurement of labile copper in wine by medium exchange stripping potentiometry utilising screen printed carbon electrodes. Talanta 2016, 154, 431–437. [Google Scholar] [CrossRef] [PubMed]
  37. Siebert, T.E.; Solomon, M.R.; Pollnitz, A.P.; Jeffery, D.W. Selective determination of volatile sulfur compounds in wine by gas chromatography with sulfur chemiluminescence detection. J. Agric. Food Chem. 2010, 58, 9454–9462. [Google Scholar] [CrossRef] [PubMed]
  38. Zhang, X.; Kontoudakis, N.; Clark, A.C. Rapid quantitation of 12 volatile aldehyde compounds in wine by LC-QQQ-MS: A combined measure of free and hydrogen-sulfite-bound forms. J. Agric. Food Chem. 2019, 67, 3502–3510. [Google Scholar] [CrossRef]
  39. Antalick, G.; Perello, M.-C.; de Revel, G. Development, validation and application of a specific method for the quantitative determination of wine esters by headspace-solid-phase microextraction-gas chromatography–mass spectrometry. Food Chem. 2010, 121, 1236–1245. [Google Scholar] [CrossRef]
  40. Somers, C.T.; Evans, M.E. Spectral evaluation of young red wines: Anthocyanin equilibria, total phenolics, free and molecular SO2, “chemical age”. J. Sci. Food Agric. 1977, 28, 279–287. [Google Scholar] [CrossRef]
  41. Bradford, M.M. A rapid and sensitive method for the quantitation of microgram quantities of protein utilizing the principle of protein-dye binding. Anal. Biochem. 1976, 72, 248–254. [Google Scholar] [CrossRef]
  42. Bekker, M.Z.; Day, M.P.; Smith, P.A. Changes in metal ion concentrations in a Chardonnay wine related to oxygen exposure during vinification. Molecules 2019, 24, 1523. [Google Scholar] [CrossRef] [Green Version]
  43. Vystavna, Y.; Zaichenko, L.; Klimenko, N.; Rätsep, R. Trace metals transfer during vine cultivation and winemaking processes. J. Sci. Food Agric. 2017, 97, 4520–4525. [Google Scholar] [CrossRef]
  44. Kreitman, G.Y.; Danilewicz, J.C.; Jeffery, D.W.; Elias, R.J. Copper(II)-mediated hydrogen sulfide and thiol oxidation to disulfides and organic polysulfanes and their reductive cleavage in wine: Mechanistic elucidation and potential applications. J. Agric. Food Chem. 2017, 65, 2564–2571. [Google Scholar] [CrossRef]
  45. Kontoudakis, N.; Mierczynska-Vasilev, A.; Guo, A.; Smith, P.A.; Scollary, G.R.; Wilkes, E.N.; Clark, A.C. Removal of sulfide-bound copper from white wine by membrane filtration. Aust. J. Grape Wine Res. 2019, 25, 53–61. [Google Scholar] [CrossRef] [Green Version]
  46. Kontoudakis, N.; Clark, A.C. Sulfide-binding to Cu(II) in wine: Impact on oxygen consumption rates. Food Chem. in press.
  47. Bekker, M.Z.; Kreitman, G.Y.; Jeffery, D.W.; Danilewicz, J.C. Liberation of hydrogen sulfide from dicysteinyl polysulfanes in model wine. J. Agric. Food Chem. 2018, 66, 13483–13491. [Google Scholar] [CrossRef] [PubMed]
  48. Kreitman, G.Y.; Elias, R.J.; Jeffery, D.W.; Sacks, G.L. Loss and formation of malodorous volatile sulfhydryl compounds during wine storage. Crit. Rev. Food Sci. Nutr. 2019, 59, 1728–1752. [Google Scholar] [CrossRef]
  49. Cavazza, A.; Guzzon, R.; Malacarne, M.; Larcher, R. The influence of the copper content in grape must on alcoholic fermentation kinetics and wine quality. A survey on the performance of 50 commercial active dry yeasts. Vitis 2013, 52, 149–155. [Google Scholar]
  50. Yasokawa, D.; Murata, S.; Kitagawa, E.; Iwahashi, Y.; Nakagawa, R.; Hashido, T.; Iwahashi, H. Mechanisms of copper toxicity in Saccharomyces cerevisiae determined by microarray analysis. Environ. Toxicol. 2008, 23, 599–606. [Google Scholar] [CrossRef]
  51. Kontoudakis, N.; Schmidtke, L.M.; Bekker, M.Z.; Smith, M.; Smith, P.A.; Scollary, G.R.; Wilkes, E.N.; Clark, A.C. Analytical strategies for the measurement of different forms of Cu and Fe in wine: Comparison between approaches in relation to wine composition. Food Chem. 2019, 274, 89–99. [Google Scholar] [CrossRef]
  52. Ugliano, M.; Kwiatkowski, M.; Vidal, S.; Capone, D.; Siebert, T.; Dieval, J.-B.; Aagaard, O.; Waters, E.J. Evolution of 3-mercaptohexanol, hydrogen sulfide, and methyl mercaptan during bottle storage of Sauvignon Blanc wines. Effect of glutathione, copper, oxygen exposure, and closure-derived oxygen. J. Agric. Food Chem. 2011, 59, 2564–2572. [Google Scholar] [CrossRef]
  53. Yeat Assimilable Nitrogen (YAN). Available online: https://www.awri.com.au/industry_support/winemaking_resources/wine_fermentation/yan/ (accessed on 31 October 2019).
  54. Kontoudakis, N.; Guo, A.; Scollary, G.R.; Clark, A.C. The impact of aging wine in high and low oxygen conditions on the fractionation of Cu and Fe in Chardonnay wine. Food Chem. 2017, 229, 319–328. [Google Scholar] [CrossRef]
  55. Gruenwedel, D.W.; Patnaik, R.K. Release of hydrogen sulfide and methyl mercaptan from sulfur-containing amino acids. J. Agric. Food Chem. 1971, 19, 775–779. [Google Scholar] [CrossRef]
  56. Bueno, M.; Marrufo-Curtido, A.; Carrascón, V.; Fernández-Zurbano, P.; Escudero, A.; Ferreira, V. Formation and accumulation of acetaldehyde and strecker aldehydes during red wine oxidation. Front. Chem. 2018, 6. [Google Scholar] [CrossRef]
  57. Swiegers, J.H.; Bartowsky, E.J.; Henschke, P.A.; Pretorius, I.S. Yeast and bacterial modulation of wine aroma and flavour. Aust. J. Grape Wine Res. 2005, 11, 139–173. [Google Scholar] [CrossRef]
Figure 1. Concentrations of low molecular weight sulfur compounds (LMWSCs) in Chardonnay and Shiraz wines during production and bottle aging process. The X-axis of the figure represented sampling time points: J/M, juice/must; PAF, post-alcoholic fermentation; PCold, post-cold stabilization; PB, pre-bottling; 15Mo, 15 months after bottle aging. (A) H2S in Chardonnay wines; (B) H2S in Shiraz wines; (C) methanethiol (MeSH) in Chardonnay wines; and (D) MeSH in Shiraz wines. Note that different scales were used on the concentration axes of A–D to aid the clarity of differentiating the sample treatments within each graph.
Beverages 05 00070 g001
Figure 2. Concentrations of volatile aldehyde compounds in Chardonnay and Shiraz wines during production and bottle aging process. The X-axis of the figure represented sampling time points: J/M, juice/must; PAF, post-alcoholic fermentation; PCold, post-cold stabilization; PB, pre-bottling; 15Mo, 15 months after bottle aging. (A) Hexanal in Chardonnay wines; (B) hexanal in Shiraz wines; (C) 3-methylbutanal in Chardonnay wines; (D) 3-methylbutanal in Shiraz wines; (E) phenylacetaldehyde in Chardonnay wines; (F) phenylacetaldehyde in Shiraz wines; (G) methional in Chardonnay wines; and (H) methional in Shiraz wines. Note that different scales were used on the concentration axes of A–D and G–H to aid the clarity of differentiating sample treatments within each graph.
Beverages 05 00070 g002
Table 1. Concentrations of Cu and SO2 in different forms in Chardonnay and Shiraz wines during production and bottle aging process.
a,b ChardonnayControlLCuHCuLSO2HSO2
total Cu (µg/L)
J1222 ± 49 c4295 ± 92 b7299 ± 227 a1182 ± 21 c1225 ± 87 c
PAF124 ± 2 c311 ± 4 b430 ± 14 a124 ± 3 c121 ± 2 c
PCold86 ± 7 c186 ± 0 b321 ± 47 a76 ± 1 c73 ± 3 c
PB: nonB/Bent82 ± 1d46 ± 2 e203 ± 2 b153 ± 11 c335 ± 42 a229 ± 2 b79 ± 5 d45 ± 13 e73 ± 2 de 60 ± 6 de
15Mo: nonB/Bent11 ± 11 d38 ± 9 e167 ± 10 c136 ± 1 cd305 ± 49 a204 ± 13 b63 ± 10 e51 ± 10 e50 ± 1 e44 ± 9 e
free Cu (µg/L)
Jn/an/an/an/an/a
PAF17 ± 2 bc24 ± 9 b52 ± 2 a17 ± 1 bc10 ± 1 c
PCold28 ± 1 c55 ± 3 b80 ± 6 a24 ± 2 c22 ± 3 c
PB: nonB/Bent34 ± 4 e26 ± 2 fg66 ± 4 c50 ± 6 d93 ± 3 a75 ± 8 b33 ± 4 ef23 ± 2 g19 ± 1 g21 ± 0 g
15Mo: nonB/Bentnilnilnilnilnilnilnilnilnilnil
bound Cu (µg/L)
Jn/an/an/an/an/a
PAF107 ± 2 c287 ± 9 b390 ± 4 a108 ± 2 c110 ± 2 c
PCold58 ± 8 c131 ± 3 b224 ± 20 a52 ± 3 c51 ± 6 c
PB: nonB/Bent48 ± 5 d21 ± 1 e137 ± 5 b103 ± 15 c229 ± 20 a151 ± 4 b51 ± 6 d22 ± 10 e54 ± 1 d42 ± 1 d
15Mo: nonB/Bent110 ± 11 d38 ± 9 e167 ± 10 c136 ± 1 cd305 ± 49 a204 ± 13 b63 ± 10 e51 ± 10 e50 ± 1 e44 ± 9 e
total SO2 (mg/L)
J8 ± 0 c7 ± 0 c8 ± 0 c48 ± 1 b66 ± 1 a
PAF55 ± 1 e64 ± 1 d69 ± 3 c88 ± 3 b101 ± 2 a
PCold108 ± 1 c114 ± 3 bc120 ± 5 b144 ± 8 a151 ± 3 a
c PB: nonB/Bent129 ± 7 cd123 ± 4 d156 ± 4 ab152 ± 2 b163 ± 4 a161 ± 2 a136 ± 6 c131 ± 2 c132 ± 4 c132 ± 4 c
15Mo: nonB/Bent89 ± 3 e94 ± 10 e106 ± 5 d111 ± 4 cd119 ± 3 b120 ± 5 b120 ± 2 b118 ± 3 bc129 ± 3 a129 ± 2 a
free SO2 (mg/L)
J0 c0 c0 c25 ± 1 b39 ± 1 a
PAF0 a0 a0 a1 ± 0 a1 ± 0 a
PCold10 ± 2 a6 ± 1 b2 ± 1 c12 ± 2 a10 ± 1 a
c PB: nonB/Bent24 ± 2 b25 ± 2 ab26 ± 3 ab29 ± 5 a24 ± 1 b26 ± 1 ab18 ± 1 c20 ± 1 c11 ± 1 d12 ± 1 d
15Mo: nonB/Bent4 ± 1 ab5 ± 3 a4 ± 1 ab4 ± 1 ab2 ± 1 b3 ± 1 b4 ± 1 ab3 ± 1 ab4 ± 1 ab4 ± 0 ab
a The significant difference (p ≤ 0.05) among treatments was calculated across the row. At PB and 15Mo, samples without (nonB) and with (Bent) bentonite addition were considered as a single treatment for statistical analysis; b Sampling time points included: J, juice; PAF, post-fermentation; PCold, post cold stabilization; PB, pre-bottling; 15Mo, 15 months after bottling aging. PB and 15Mo included parallel treatments of without (nonB) and with (Bent) bentonite addition; c Results of SO2 concentrations after the SO2 addition at pre-bottling (after bentonite treatment).
Table 2. Concentrations of Cu and SO2 in different forms in Shiraz wines during production and bottle aging process.
a,b ShirazControlLCuHCuLSO2HSO2
total Cu (µg/L)
M2007 ± 76 c10577 ± 412 b15051 ± 2756 a1985 ± 70 c1807 ± 78 c
PAF567 ± 31 a679 ± 100 a598 ± 31 a565 ± 28 a577 ± 77 a
PB305 ± 34 bc351 ± 23 ab278 ± 27 c331 ± 22 abc383 ± 60 a
15Mo272 ± 33 a189 ± 20 b142 ± 0 c188 ± 18 b212 ± 30 ab
free Cu (µg/L)
Mn/an/an/an/an/a
PAF59 ± 5 b62 ± 8 b131 ± 26 a39 ± 1 bc28 ± 3 c
PB40 ± 2 a31 ± 3 b22 ± 4 c22 ± 0 c34 ± 2 ab
15Monilnilnilnilnil
bound Cu (µg/L)
Mn/an/an/an/an/a
PAF508 ± 30 ab618 ± 95 a467 ± 14 b526 ± 27 ab549 ± 79 ab
PB270 ± 32 b320 ± 23 ab256 ± 28 b306 ± 18 ab349 ± 58 a
15Mo272 ± 33 a189 ± 20 b142 ± 0 c188 ± 18 b212 ± 30 ab
total SO2 (mg/L)
M0 c0 c0 c135 ± 38 b244 ± 71
PAF6 ± 1 c6 ± 0 c5 ± 0 c12 ± 1 b20 ± 1 a
c PB (pre-SO2)65 ± 4 b66 ± 4 b75 ± 15 ab76 ± 8 ab88 ± 1 a
d PB (post-SO2)120 ± 8 b119 ± 5 b129 ± 6 ab138 ± 9 a129 ± 4 ab
15Mo79 ± 3 b80 ± 7 b91 ± 2 a89 ± 4 ab92 ± 3 a
free SO2 (mg/L)
M0 c0 c0 c57 ± 17 b109 ± 36 a
PAF0 a0 a0 a0 a1 ± 0 a
c PB (pre-SO2)5 ± 0 b5 ± 0 b4 ± 0 b8 ± 2 a8 ± 1 a
d PB (post-SO2)29 ± 10 a27 ± 1 a24 ± 0 a29 ± 1 a30 ± 4 a
15Mo23 ± 3 a21 ± 3 a21 ± 4 a25 ± 4 a26 ± 6 a
a The significant difference (p ≤ 0.05) among treatments was calculated across the row; b Sampling time points included: M, must; PAF, post-fermentation; PB, pre-bottling (after cold stabilization); 15Mo, 15 months after bottling aging; c Results of SO2 concentrations before the SO2 addition at pre-bottling; d Results of SO2 concentrations after the SO2 addition at pre-bottling.

