Understanding Australian Wine Consumers’ Preferences for Different Sparkling Wine Styles


1
School of Agriculture, Food and Wine, The University of Adelaide, Waite Campus, PMB 1, Glen Osmond, SA 5064, Australia
2
School of Pharmacy and Medical Sciences, University of South Australia, GPO Box 2471, Adelaide, SA 5001, Australia
*
Author to whom correspondence should be addressed.
†
Current address: The Australian Wine Research Institute, PO Box 197, Glen Osmond, SA 5064, Australia
Beverages 2020, 6(1), 14; https://0-doi-org.brum.beds.ac.uk/10.3390/beverages6010014
Submission received: 2 December 2019
/
Revised: 18 February 2020
/
Accepted: 24 February 2020
/
Published: 1 March 2020
(This article belongs to the Special Issue Sparkling Wine)
Abstract
:This study investigated the perceptions and preferences of Australian wine consumers towards different styles of sparkling wine, including French Champagne and Australian sparkling white, red and rosé wine, Moscato and Prosecco. An online survey of 1027 regular sparkling wine consumers captured demographic information, sparkling wine perceptions and preferences, and typical spending and consumption patterns. Consumers were segmented into three distinct clusters (‘No Frills’, ‘Aspirants’ and ‘Enthusiasts’) using the Fine Wine Instrument model. The majority of No Frills consumers were female and typically consumed sparkling wine once per month. Almost 55% of Aspirants were male with a household income of more than AU$75,000. Enthusiast consumers were also predominantly male and well educated, and 64% were under the age of 35 years. Sparkling white wine and Champagne were generally the preferred styles for each consumer group, followed by Moscato and sparkling rosé wine. Interestingly, Moscato scored favorably with both No Frills and Enthusiast segments. Almost 25% of respondents indicated that they were not familiar with Prosecco, while sparkling red wine was perceived similarly by male and female consumers. The findings from this study can be used by sparkling wine producers to better target their products and marketing to the specific needs and expectations of consumers within different segments of the Australian domestic market.
1. Introduction
When summarizing the key findings from wine consumer behavior research published over the past decade, Lockshin and Corsi highlighted the importance of researching premium and luxury wine behavior, successful marketing practices, and consumer behavior in emerging markets [1]. This included the value of wine tourism and marketing for value, as well as the relationship between grape and wine quality, and consumer behavior. Using market segmentation and a holistic approach to consumer behavior, a deeper understanding of consumer characteristics, habits, needs and expectations can be gained [2]. It is clear that a research gap exists with respect to classification of sparkling wine consumers and that categorization of consumers of this fine wine style would assist marketing strategies to target specific segments of the Australian domestic market.
Consumers’ understanding of wine quality is a multi-dimensional construct [3] that is substantially dependent on their level of involvement [4]. Research indicates that more highly involved consumers are inclined to conceptualize wine quality more objectively (i.e., using cognitive dimensions), whereas less involved consumers assess quality subjectively (i.e., in sensory dimensions) [4]. A qualitative study suggested that motivations to consume sparkling wine are complex, but include its celebratory symbolic function, as well as perceptions of experiential consumption [5]. Croatian consumers consider the intrinsic characteristics of sparkling wine to be most important (i.e., sensory properties, price and quality), whereas wine appearance, expert reviews and wine awards were deemed to be less significant [6]. Nevertheless, consumers’ reliance on extrinsic cues remains extremely robust even when sensory experiences are available [7]. In fact, it has been suggested that knowledge of how sparkling wine production methods impact wine style might influence consumer expectations [8]. The different methods of sparkling wine production strongly influence sparkling wine sensory profiles, and previous research involving segmentation of consumers based on their hedonic liking of different wines identified distinct consumer clusters [9].
Champagne is associated with feelings of luxury and gracious living [10], which are closely linked to perceptions of prestige [11]. However, the question of what constitutes a luxury offering depends upon the people involved, as well as the situational context [12]. According to Morton and colleagues, anecdotal evidence suggests perceptions of prestige and luxury in Champagne purchases are comprised of brand image, product presentation and taste [13]. Similarly, Italian Prosecco consumers often display high consumer loyalty due to the appeal of the appellation and its upper-tier price point [14]. Charters and colleagues previously noted that the fact that Champagne and sparkling wine is considered to be a special drink indicates that it should be marketed separately from other wine styles [15]. However, this approach requires careful consideration because although marketers would like this wine style to be distinct, they would also like people to consume it more than a few times each year [16]. In a simulated Champagne wine market, Steichen and Terrien demonstrated that in a repeated purchasing situation, personal capital and involvement somehow reduce the impact of the main determinants (reputation, price) used by consumers when making a purchase decision [17]. Territorial brands may benefit from maintaining open communication with competitors and creating collective trademarks in order increase their value [18].
New World wine consumers have a tendency to focus on the general impression of the image, and on the enjoyment and fun associated with drinking Champagne and sparkling wine [19]. Sparkling wine consumers often value a sense of belonging when considering their drinking behavior [20]. Federica and Perkins suggested that self-esteem, family life, and accomplishments were also important factors [21]. Sparkling wine consumption was higher among expert respondents [22] and consumers of sparkling wine have the greatest relative awareness of the shared appellations [23]. Expertise, specifically greater knowledge of wine, is strongly associated with higher consumption patterns and often predicts a higher liking of sparkling wine [24]. Interestingly, highly involved consumers are less likely to assume that Champagne is better than other sparkling wine styles, whereas less involved consumers are more at ease with traditional images of this product [25]. Advertising is given more consideration when consuming wine at impersonal occasions, whereas less conspicuous indicators (e.g., personal recommendations) are deemed more important for intimate consumption experiences [26]. Charters and Pettigrew noted complexity, a sensory descriptor frequently associated with high quality sparkling wine, was not a term commonly used by respondents with limited wine involvement [3]. Female consumers with low levels of expertise were found to consume significantly more sparkling wine than other consumer segments, with the exception of female consumers with medium levels of expertise [27]. Another study showed that white, sparkling and dessert wines represented a much higher proportion of female consumers’ wine consumption than for males, with women consuming twice as much sparkling wine than men [28].
Across Anglophone countries, there is similarity amongst generation Y consumers’ wine consumption behavior, including a perception that sparkling wine is a ‘women’s drink’ and that generation Y consumers will ‘grow into’ drinking sparkling wine [15]; whereas older, affluent and well-educated consumers’ sparkling wine purchasing decisions are more likely to be influenced by the country of origin [29]. However, gender was not found to have any impact on the magnitude of country of origin effects [29]. A subsequent study by Müller [30] distinguished six sparkling wine consumer groups, namely, the undemanding, the brand conscious, the ambitious, the region of origin conscious, the vine variety conscious and the experts. The study indicated that experts, the vine variety conscious and to a lesser extent the ambitious perceived the country of origin of the sparkling base wine to be important to their purchase decision making process and their willingness to pay [30]. Since reputation governs the preference order of all consumers, each purchaser will choose the product with the highest reputation he or she can afford [31]. It has been observed that individuals with higher internal values and more complex social identities were less susceptible to normative influence and placed less emphasis on social brand benefits [32]. Moreover, the most expensive and heavily advertised products are not automatically those preferred by regular wine consumers [33].
Rokka discussed how the image of Champagne has transformed from a practically insignificant no-brand wine label in the fifteenth century to an expression of modernity and icon for the global leisure class and celebration [34]. Australian contemporary counterparts made by traditional, Charmat, transfer and carbonation production methods have been shown to have varying chemical and sensory characteristics [35]. Segments of consumers of these sparkling wine styles, including Moscato, have disparate preferences for varietal and complex wines. Moreover, individual liking scores have enabled the identification of two consumer clusters with opposing preferences for distinct styles of Moscato [36]. Grape variety has a strong effect on the manufacture of sparkling wines, and those produced from innovative varieties (including Moscato Embrapa and Villenave) contain a high concentration of esters [37]. Additional research has also confirmed that the production method of Moscato Giallo wines (traditional, Charmat or Asti) influences the volatile composition of the sparkling products [38].
Previous research from Germany showed that Prosecco was mostly bought by people who preferred white wines or who did not have any preference for red wine [39]. An earlier Italian study examining the behavior of Prosecco consumers found that Controlled and Guaranteed Denomination of Origin (CGDO) consumers typically expressed a preference for CGDO products, and that they might be more loyal than Controlled Denomination of Origin (CDO) purchasers [40]. Italian consumers buying wine from supermarkets were surveyed, and substantial differences were observed amongst preferences for brand, certification of origin, and production practices (e.g., sparkling vs. semi-sparkling) [41]. A model to derive a reasonable pattern of differences in willingness to pay for Prosecco between CDO and Typical Geographic Indication types has also been developed [41]. Lastly, sparkling red is considered to be an iconic Australian wine style developed by French winemaker August D’Argent in 1881 for the Victorian Champagne Company [42]. However, Cohen and colleagues indicated that sparkling white wines have a higher likelihood of success and frequent purchase as opposed to sparkling red wines, which might indicate ‘change of pace’ tendencies [43].
Given the trend towards increased consumption of sparkling wine and Champagne, particularly at special occasions, further research is needed to better inform winemaking and marketing decisions to ensure industry meets the needs and expectations of different segments of the consumer market. This study therefore sought to understand Australian consumer awareness of and preferences for different sparkling wine styles, and the influence of occasion and price on consumption behavior, using the Fine Wine Instrument [44] to segment consumers according to their wine knowledge and purchasing behavior.
2. Materials and Methods
2.1. Consumer Survey
Themes identified from an extensive literature review were used to develop an online survey, which was administered nationally using SurveyMonkey™ (www.surveymonkey.com; San Mateo, CA, USA). Australian consumers (n = 1027) were recruited using a market research company (TKW Research Group, Seaford, Australia; www.surveytalk.com.au), with participants from a broad cross-section of states; prior to data collection, the survey was trialed by 10 South Australian consumers. Screening was performed using inclusion criteria that required participants to be at least 18 years of age and to have consumed sparkling wine at least 12 times per year on average. The survey took approximately 10–15 min to complete and data were collected over 2 weeks period. Participants were financially compensated for their time.
The questionnaire comprised three sections. The first section contained demographic questions relating to sex, age, education, and household income, as well as questions related to alcohol and wine consumption behavior. The second section measured fine wine behavior using the Fine Wine Instrument (FWI); a statistical model devised to segment consumers on the basis of wine connoisseur, knowledge and provenance variables [44]. Respondents were asked to indicate their level of agreement with a series of 18 statements using a 9 point category scale, where 1 = strongly disagree, 5 = neither agree nor disagree, and 9 = strongly agree. These statements were established in previous work by Johnson and Bastian [44] which investigated fine wine consumer involvement and identified three distinct types of consumers: ‘Enthusiast’ consumers, who exhibit connoisseur-like behavior, and are knowledgeable about wine and actively enjoy increasing that knowledge; ‘Aspirant’ consumers, who are less knowledgeable about wine, and less confident and adventurous in their wine-purchasing abilities; and ‘No Frills’ consumers, who display little connoisseur-type behavior, and who have little wine knowledge or involvement [44]. Section three of the survey examined participants’ attitudes towards and preferences for different sparkling wine styles, specifically, Champagne, Australian sparkling white, red and rosé wines, Moscato and Prosecco. Consumers were made aware that sparkling wine should only be called Champagne if it originates from the region of Champagne in France. For the purposes of this study, all other sparkling wine styles (white, red and rosé, Moscato and Prosecco) were assumed to be Australian. Survey questions asked participants to list words that they associated with each of the sparkling wine styles, as well as any known brands. Respondents indicated their preferences for different styles using 9 point Likert scales (where 1 = extremely dislike to 9 = extremely like). Participants were also asked whether they would be likely to consume different sparkling wine styles at a number of pre-determined occasions (e.g., birthdays, Christmas, New Year and others identified in a previous study [45]), again using a 9 point category scale (where 1 = never, 5 = sometimes and 9 = always). Finally, participants were asked how much they would typically spend on a bottle of each style of sparkling wine at a retail outlet; with response options being: never purchase; <AU$15; AU$15–$29; AU$30–$49; AU$50–$79; and >AU$80.
2.2. Data Analysis
Consumer data were analyzed using a combination of descriptive techniques (frequencies, percentages, medians, means and quartiles) as well as agglomerative hierarchical clustering and non-parametric testing. Mood’s median test [46] was used to test the equality of medians from two or more populations because the data are ordinal and the consumer segment responses did not follow a normal distribution. An examination of the interquartile ranges (IQR = 3rd quartile − 1st quartile) was also undertaken between the FWI segments for the different sparkling wine styles. The IQR is a measure of variability of FWI segment data (i.e., the spread of values), based on separation of a data set into quartiles. Fisher exact tests were used to test the association between qualitative variables given that some counts within contingency tables were less than 5. Statistical analyses were completed using XLSTAT 2016 (Addinsoft, New York, NY, USA). Qualitative analyses of word frequencies were performed using NVivo software Version 12 (QSR International Pty Ltd., Melbourne, Australia).
3. Results and Discussion
3.1. Influence of Consumer Segmentation on Preferences for Different Sparkling Wine Styles
Agglomerative hierarchical clustering using the questions developed by the FWI provided three distinct groups of wine consumers. As established by Johnson and Bastian [44], No Frills fine wine consumers demonstrate little connoisseur-type behavior, knowledge about wine or interest in the provenance of their wine purchases. The majority of consumers in this group were female (n = 287, 65.1%) and typically consumed sparkling wine only once per month (n = 256, 58.1%) (Table 1). Aspirants share some similarities with the Enthusiast segment; however, their wine knowledge and wine involvement scores were all significantly lower. These respondents were not as confident in their wine-purchasing abilities and valued the opinions of others, including friends and family, staff at restaurants, wine retailers and wine writers [44]. Almost 55% of this segment were male (n = 266, 54.7%) with a household income of more than AU$75,000 (n = 289, 59.5%). Finally, Enthusiasts exhibit connoisseur-like behavior by keeping records of their wine purchases, having a special wine storage space and ritually checking their wines for faults prior to consumption [44]. These consumers were also mostly male (n = 62, 62%) and well educated (n = 66, 66% holding tertiary qualifications), and 64% (n = 64) were under 35 years of age. This was in agreement with Johnson and Bastian [44], who found a significant proportion of Enthusiasts were male and/or under the age of 35, and therefore highlighted the potential value in tailoring wine marketing strategies towards this demographic. Australian sparkling wine producers might similarly benefit from targeting a younger, male demographic, in order to better engage Enthusiast consumers.
Consumers were asked to record the distribution of their alcoholic beverage consumption using percentage scales for alcohol type, wine type and wine style categories (0%–100%, summing to 100% for each consumer). Generally, regular sparkling wine consumers mostly drink wine (median = 50%), followed by beer (median = 10%), spirits (median = 10%) and cider (median = 1.0%) (Table 2). There were significant differences between the median percentages for wine (p = 0.001), beer (p < 0.0001), cider (p = 0.002) and other alcoholic beverages (p < 0.0001) consumed between all consumer segments (Table 2). The No Frills and Enthusiast categories, in addition to the Aspirant and Enthusiast groups, also demonstrated significantly different consumption percentages for the same alcohol types; (wine p = 0.001, beer p < 0.0001, cider p = 0.001, other p < 0.0001 and wine p = 0.000, beer p < 0.001, cider p < 0.001, other p = 0.013 respectively) (Table 2). Enthusiasts consumed the most varied styles of sparkling wine, specifically the most Champagne (median = 20%, IQR = 20%), Prosecco (median = 20%, IQR = 16.3%) and sparkling rosé (median = 10%, IQR = 20%). The No Frills segment did not consume Champagne (median = 0.0%, IQR = 10%), rather they preferred Australian sparkling white wine (median = 50.0%, IQR = 65.0%). Statistically significant differences between all segments (p < 0.05) were observed for each type of wine and style of sparkling wine. Furthermore, the majority of pairwise comparisons between groups (i.e., No Frills vs. Aspirants, No Frills vs. Enthusiasts and Aspirants vs. Enthusiasts) yielded statistically significant results (p < 0.05). However, there was no significant difference between the Moscato consumption of No Frills and Aspirant segments (p = 0.103), or the sparkling red consumption of Aspirants and Enthusiasts (p = 0.065) (Table 2).
3.2. Influence of Sparkling Wine Style on Consumer Perceptions and Preferences
Consumers were asked to list words and brands that they associated with each sparkling wine style, i.e., Champagne, sparkling white, red and rosé wines, Moscato and Prosecco. Forced open responses were collected, and participants could list as many or as few words/brands as desired. Similar to previous work undertaken by Verdonk and colleagues [47], word frequency analysis (including synonyms) was undertaken and is shown below, with results including word frequencies (i.e., the number of times each word appeared for each sparkling wine style) and weighted percentages for the top ten terms and brands (Table 3).
The words used to describe Champagne include ‘expensive’, ‘celebration’, ‘quality’, ‘France’ and ‘luxury’ (Table 3), supporting research indicating that Champagne houses have successfully projected an image of prestige, luxury and exclusivity [48]. Brands such as ‘Moët’ (19.6%) and ‘Chandon’ (8.5%), ‘Dom (5.4%) Perignon’ (4.6%), ‘Mumm’ (4.9%), ‘Bollinger’ (4.7%), ‘Veuve (4.7%) Cliquot’ (2.6%) and ‘Krug’ (1.8%) were most well-known. In contrast, Australian sparkling white wine was described as ‘bubbly’, ‘refreshing’, ‘light’, and ‘fruity’. There was little reference to quality or complexity; however, it should be noted that these wines were also associated with ‘celebration’ and special occasions. Furthermore, ‘Yellow’ (6.3%), ‘Jacob’s (5.5%) Creek’ (5.4%), ‘Yellowglen’ (4.8%), ‘Brown (4.9%) Brothers’ (4.2%), ‘Chandon’ (3.8%) and ‘Wolf (1.7%) Blass’ (1.8%) were mentioned. Respondents deemed sparkling red wine to be ‘red’, ‘bubbly’, ‘rich’, ‘dark’ and ‘heavy’ with ‘Brown (5.9%) Brothers’ (5.0%), ‘Jacobs (2.3%) Creek’ (2.6%), ‘Seppelt’ (2.3%), ‘Penfolds’ (2.2%) and ‘Yellowglen’ (1.9%) being named. Sparkling rosé was considered a ‘pink’, ‘sweet’ and ‘light’ wine, and ‘Jacobs (7.5%) Creek’ (7.2%), ‘Brown (5.2%) Brothers’ (4.5%), ‘Yellowglen’ (3.1%), ‘Mateus’ (2.2%) and ‘Yellow’ (1.9%) were the most well-known brands. The overwhelming impression of Moscato was that it is ‘sweet’. Nevertheless, positive language was used, including reference to the ‘refreshing’, and ‘delicious’ characteristics of the wine style, which is made by ‘Brown (17.8%) Brothers’ (15.7%), ‘Gossips’ (4.2%), ‘Jacobs (3.6%) Creek’ (3.4%) and ‘Banrock (3.2%) Station’ (2.8%). Consumer knowledge of Prosecco was limited, demonstrated by the high ranking of the words ‘none’ and ‘don’t know’. Some consumers were aware of the style’s country of origin (Italian, 6.4%), but used both ‘dry’ and ‘sweet’ to describe the sensory attributes. The most popular Prosecco brand was ‘Brown (8.7%) Brothers’ (7.4%), whereas other responses within the list indicated unfamiliarity (e.g., ‘none’, ‘don’t know’, ‘nil’, ‘can’t recall’, ‘not sure’ and ‘no idea’).
Of the consumers that had an opinion on the sparkling wine styles, statistically significant differences were observed amongst sparkling wine styles and consumer segments (p < 0.05) (Table 4). Enthusiasts consistently preferred all sparkling wine styles more than the Aspirant and No Frills segments. Pairwise comparisons of the sparkling white wine preferences found that only the No Frills vs. Aspirant scores demonstrated a significant difference (p = 0.010). All other pairwise comparisons for sparkling white wines were statistically insignificant. Overall, Champagne and sparkling white wine were most preferred (medians = 7.0 for both, IQRs = 4.0, 2.0 respectively), followed by sparkling rosé and Moscato (medians = 6.0 for both, IQRs = 2.0, 3.0 respectively). Surprisingly, Moscato received the highest median scores from the Enthusiast and No Frills segments (medians = 7.0 for both, IQRs = 4.0). Sparkling red wine had a median score of 6.0 (IQR = 3.0) and all segment comparisons for this style yielded statistically significant results (p < 0.05). Prosecco was preferred the least by No Frills and Aspirant segments (medians = 5.0 for both, IQRs = 2.0), with statistically significant differences observed between all groups (p < 0.05). This result is not surprising when the low level of familiarity with Prosecco is considered. Additional advertising and/or consumer exposure to Prosecco may improve sales of this wine style, given it has been suggested that wines that have been tasted previously seem to be preferred over recommended or prestigious wines [49].
Of the 1027 regular Australian sparkling wine consumers surveyed, only 6.2% (n = 64) indicated that they were not familiar with Champagne. In contrast, only 10 respondents were unable to state their preferences for sparkling white wine (Table 5). Overall, 253 (24.63%) consumers were not familiar with Prosecco, 6.6% (n = 68) did not have an opinion about Moscato, and only 3.5% (n = 36) and 3.7% (n = 38) did not indicate a preference score for sparkling rosé and red wines, respectively. In vast contrast to the Enthusiast segment, the No Frills consumers demonstrated the least familiarity with Prosecco (n = 157), Champagne (n = 44), Moscato (n = 38), sparkling rosé (n = 26) and sparkling red wines (n = 25). Aspirant frequencies for all wine styles, except sparkling white wine (n = 5), sat between the No Frills and Enthusiast segments. In summary, the observed trend was that respondents were most familiar with sparkling white wine (n = 10) and least familiar with Prosecco (n = 253) (Table 5).
Women consistently liked sparkling wine more than men, with the exception being for sparkling red wine (Table 6). Female respondents preferred sparkling white wine the most (median = 8.0, IQR = 2.0), followed by Champagne, sparkling rosé, Moscato (medians = 7.0 for all, IQRs = 4.0, 3.0, 4.0 respectively), sparkling red (median = 6.0, IQR = 4.0) and Prosecco (median = 5.0, IQR = 2.0). Additionally, the median scores provided by women for sparkling white, Moscato and sparkling rosé were all significantly higher than those of men (p < 0.05). These findings are consistent with previous research suggesting gender-based interest and/or preference in sparkling wine [45,50].
The younger consumers who participated in this study (i.e., those under 35 years of age), preferred Moscato and sparkling rosé (medians = 7.0 for both, IQRs = 4.0, 2.0 respectively) more than consumers from other age groups. Respondents over 55 years of age (median = 8.0, IQR = 2.0) preferred sparkling white wine the most. Pairwise comparisons between all age categories for sparkling white wine and Moscato identified significant differences (p < 0.05). Nonetheless, statistically significant differences were not observed between any of the age groups regarding sparkling red wine. Furthermore, consumers with postgraduate qualifications provided the highest scores for Prosecco (median = 6.0, IQR = 2.0). Whereas Moscato was most popular with respondents whose highest level of education was high school and trade qualifications (medians = 7.0 for both, IQRs = 3.0, 5.0). When comparing the median scores of all education segments collectively, Champagne (p < 0.0001), Prosecco (p = 0.001) and Moscato (p = 0.013) showed significantly different results. In addition, Champagne was the only sparkling wine style that provided significant differences between all income levels (p < 0.0001). A significant result (p < 0.001) was observed when comparing the lower Prosecco preferences of consumers who earn less than AU$50,000 to the higher scores of those who earn more than AU$150,000. Consumers with household incomes above AU$150,000 preferred Champagne the most (median = 8.0, IQR = 3.0), followed by sparkling white wine (median = 7.0, IQR = 2.0).
The No Frills segment showed females preferred sparkling white wine (p = 0.002), Moscato (p = 0.002) and sparkling rosé (p = 0.033), significantly more than their male counterparts. Male and female Aspirant responses for all styles (except sparkling red wine) were significantly different; with females preferring sparkling white (p = 0.001), sparkling rosé (p < 0.0001) and Moscato (p = 0.002). The preference scores of male and female consumers in the Enthusiast segment were not significantly different for any of the sparkling wine styles (Table S1 (Supplementary Materials)). When comparing the preference scores of individual age groups (i.e., <35 years, 35–55 years, >55 years) within the No Frills segment, significant differences were observed between all the age groups for sparkling white (p = 0.004).
Moscato (p = 0.019) and sparkling red (p = 0.020) wines. Aspirants of different ages also had significantly different preference scores for Champagne (p = 0.050), sparkling white (p = 0.008), Prosecco (p = 0.004), Moscato (p = 0.001) and sparkling rosé (p = 0.007). Younger consumers (<35 years) preferred Moscato more than older consumers (p < 0.0001), and statistically significant results were observed when all Aspirant age groups were compared; younger respondents rated Moscato higher. Only the preference scores for Moscato (p = 0.007) and sparkling rosé (p = 0.014) were significantly different across all age groups within the Enthusiast segment, where liking reduced as age increased (Table S2 (Supplementary Materials)).
Significant differences were found when comparing the No Frills and Aspirant consumers’ preferences for Champagne, according to those who had completed High School with those who had undergraduate (p = 0.025, p = 0.048 respectively) and postgraduate (p = 0.016, p = 0.001 respectively) qualifications. Aspirant respondents who had completed postgraduate study also provided significantly higher preference scores for Champagne than participants who had completed a trade qualification (p = 0.014). Preferences for Prosecco were higher from those who had finished postgraduate study compared to a trade qualification, for both the No Frills and Aspirant segments (p = 0.041, p = 0.019 respectively). Enthusiasts who had completed undergraduate education gave lower preference scores for Moscato when compared to High School and Trade School graduates (p = 0.001 for both) and Postgraduates (p = 0.011). A significant difference between Enthusiast preferences for Prosecco was also perceived amongst those who had been educated at undergraduate and postgraduate levels, where postgraduates preferred the style more (p = 0.041) (Table S3 (Supplementary Materials)).
Preferences of No Frills consumers of different income levels showed significant differences for sparkling white wine (p = 0.012) and Prosecco (p = 0.019). Those with incomes less than AU$50,000 were significantly different to those earning AU$50,000–$100,000 and greater than AU$150,000 (p = 0.019, p = 0.017 respectively for sparkling wine and p = 0.007 and p = 0.005 for Prosecco). In addition, significant differences were observed between the No Frills sparkling white wine preference scores of people who earned AU$100,001–$150,000 and AU$50,000–$100,000 (p = 0.031) and more than AU$150,000 (p = 0.021) (Table S4 (Supplementary Materials)).
When comparing preferences for Champagne across all segments of varying incomes, statistically significant results were observed (p < 0.001). In addition, within the Aspirant segment there were significantly different results across all income brackets (p < 0.0001). Mood’s test showed that the median Champagne scores were different when comparing Aspirants with incomes less than AU$50,000 to AU$50,000–$100,000 (p = 0.004), AU$100,001–$150,000 (p < 0.001) and greater than AU$150,000 (p < 0.0001). When considering Champagne, a significant difference was also observed for Aspirants earning AU$50,000–$100,000 and those with a household income over AU$150,000 (p = 0.004). Aspirants with a household income of less than AU$50,000 had significantly different preference scores for sparkling red wine to those earning AU$50,000–$100,000 (p = 0.006). Finally, the Champagne preference scores of Enthusiasts who earn AU$50,000–$100,000 were significantly lower than those who earn more than AU$150,000 (p = 0.039). Enthusiasts with an average household income less than AU$50,000 provided significantly higher scores for sparkling rosé wine, than those who earn AU$100,001–$150,000 (p = 0.021) (Table S4 (Supplementary Materials)).
3.3. Influence of Occasion on the Consumption of Different Sparkling Wine Styles
The ‘situational purchase context’ is a principal driver behind sparkling wine purchasing [13] and Champagne has been described as ‘the celebration wine’ [10] which Australian consumers typically purchase with the intention of sacralizing events [51]. Anchor and Lacinova found that the second biggest motivation for drinking wine, especially sec or demi sec sparkling wine, was ‘to celebrate something’ [52]. It has been argued that a number of variables are affected by this situational context, including the country of origin effect, the price consumers are willing to pay and perceptions of prestige and luxury [13]. In the current study, when survey participants were asked whether they would consume different sparkling wine styles at a number of pre-determined occasions (identified during focus groups previously conducted by Verdonk and colleagues [45]), the results showed highly significant differences between the ranked medians of the FWI segments for all occasions (p < 0.05). Each of the occasions specified showed an increase in the likelihood of consumption as consumer involvement increased (No Frills median ≤ Aspirant median ≤ Enthusiast median). As argued by Spawton [53], the association of sparkling wine with celebration is a key reason why this style is chosen in preference to other alcoholic beverages. This was supported in focus groups held by Olsen, which revealed that participants perceived sparkling wine to be most appropriate for celebrations [54], and a 2016 study found that Croatian sparkling wine consumers generally associated consumption with specific celebrations [6].
In this study, the Enthusiast segment was most likely to consume every style of sparkling wine at each of the listed occasions (median ≥ 2, i.e., anniversary, at home with food, at home without food, birthday, breakfast, by yourself, Christmas, during the week, funeral, girl’s/boy’s night out, hot weather, Melbourne Cup, New Year, on the weekend, pub/club, restaurant/café, wedding, work drinks). In fact, the median numbers were above 4 for all wine styles, except Prosecco. These consumers were most likely to drink Champagne, sparkling white, red and rosé wines, and Moscato (median ≥ 5) at an anniversary, at home with food, birthday, Christmas, during the week, Melbourne Cup, New Year, on the weekend, pub/club, restaurant/café, wedding and work drinks (Table 7).
The No Frills segment did not report consuming sparkling red, rosé, Moscato or Prosecco (median = 1) at an anniversary, at home with food, at home without food, birthday, breakfast, by yourself, during the week, funeral, girl’s/boy’s night out, hot weather, Melbourne Cup, New Year, on the weekend, pub/club, restaurant/café, wedding and work drinks. However, the Aspirant group was more likely to consume sparkling red and sparkling rosé (median ≥ 2) at an anniversary, at home with food, birthday, Christmas, New Year, on the weekend, restaurant/café and wedding. Of all the sparkling wine styles, Champagne and sparkling white wine were consumed the most at all occasions, with Enthusiasts consistently providing the highest scores. The highest median values for all segments consuming Champagne and sparkling white wine (i.e., No Frills median > 4.0, Aspirant median > 5.0, Enthusiast median > 6.0) were found on anniversaries, birthdays, Christmas, Melbourne Cup, New Year and weddings (p < 0.001 for all). Sparkling white wine was also regularly consumed on weekends (No Frills median = 4.0, Aspirant median = 5.0, Enthusiast median = 6.0) (p < 0.001) (Table 7).
Pairwise comparisons between the consumer segments showed that the majority (96.5% of combinations tested) of relationships were significantly different. However, statistically significant differences were not observed between the No Frills and Aspirant segments when comparing likelihood of consumption for sparkling white wine at Christmas (p = 0.064) and New Year (p = 0.066). The Mood test also found non-significant differences between the No Frills and Aspirant groups for Moscato at the following occasions: anniversaries (p = 0.062), at home with food (p = 0.395), at home without food (p = 0.092), birthdays (p = 0.121), by yourself (p = 0.067), Christmas (p = 0.643), during the week (p = 0.074), on a girls/boys night out (p = 0.560), Melbourne Cup (p = 0.056), New Year (p = 0.206), on the weekend (p = 0.097), at the pub/club (p = 0.089) and at a restaurant/café (p = 0.333). Detailed comparisons of each FWI segment at each listed occasion can be found in the appendices (Table S5 (Supplementary Materials)).
3.4. Influence of Price on Consumer Purchasing Behavior
Several studies have identified price as being an important consideration during wine purchasing decisions [53,55,56,57,58,59,60,61], with high prices being associated with superior quality [53,59]. Six attributes were found to be statistically important in explaining deviations from average wine prices: quality, cellar potential, grape variety/style, region, vintage and producer size [62]. Lecocq and Visser found that price differences could be explained by characteristics which were directly revealed to the consumer upon inspection of the bottle and its label (ranking, vintage and appellation), rather than sensory variables [63].
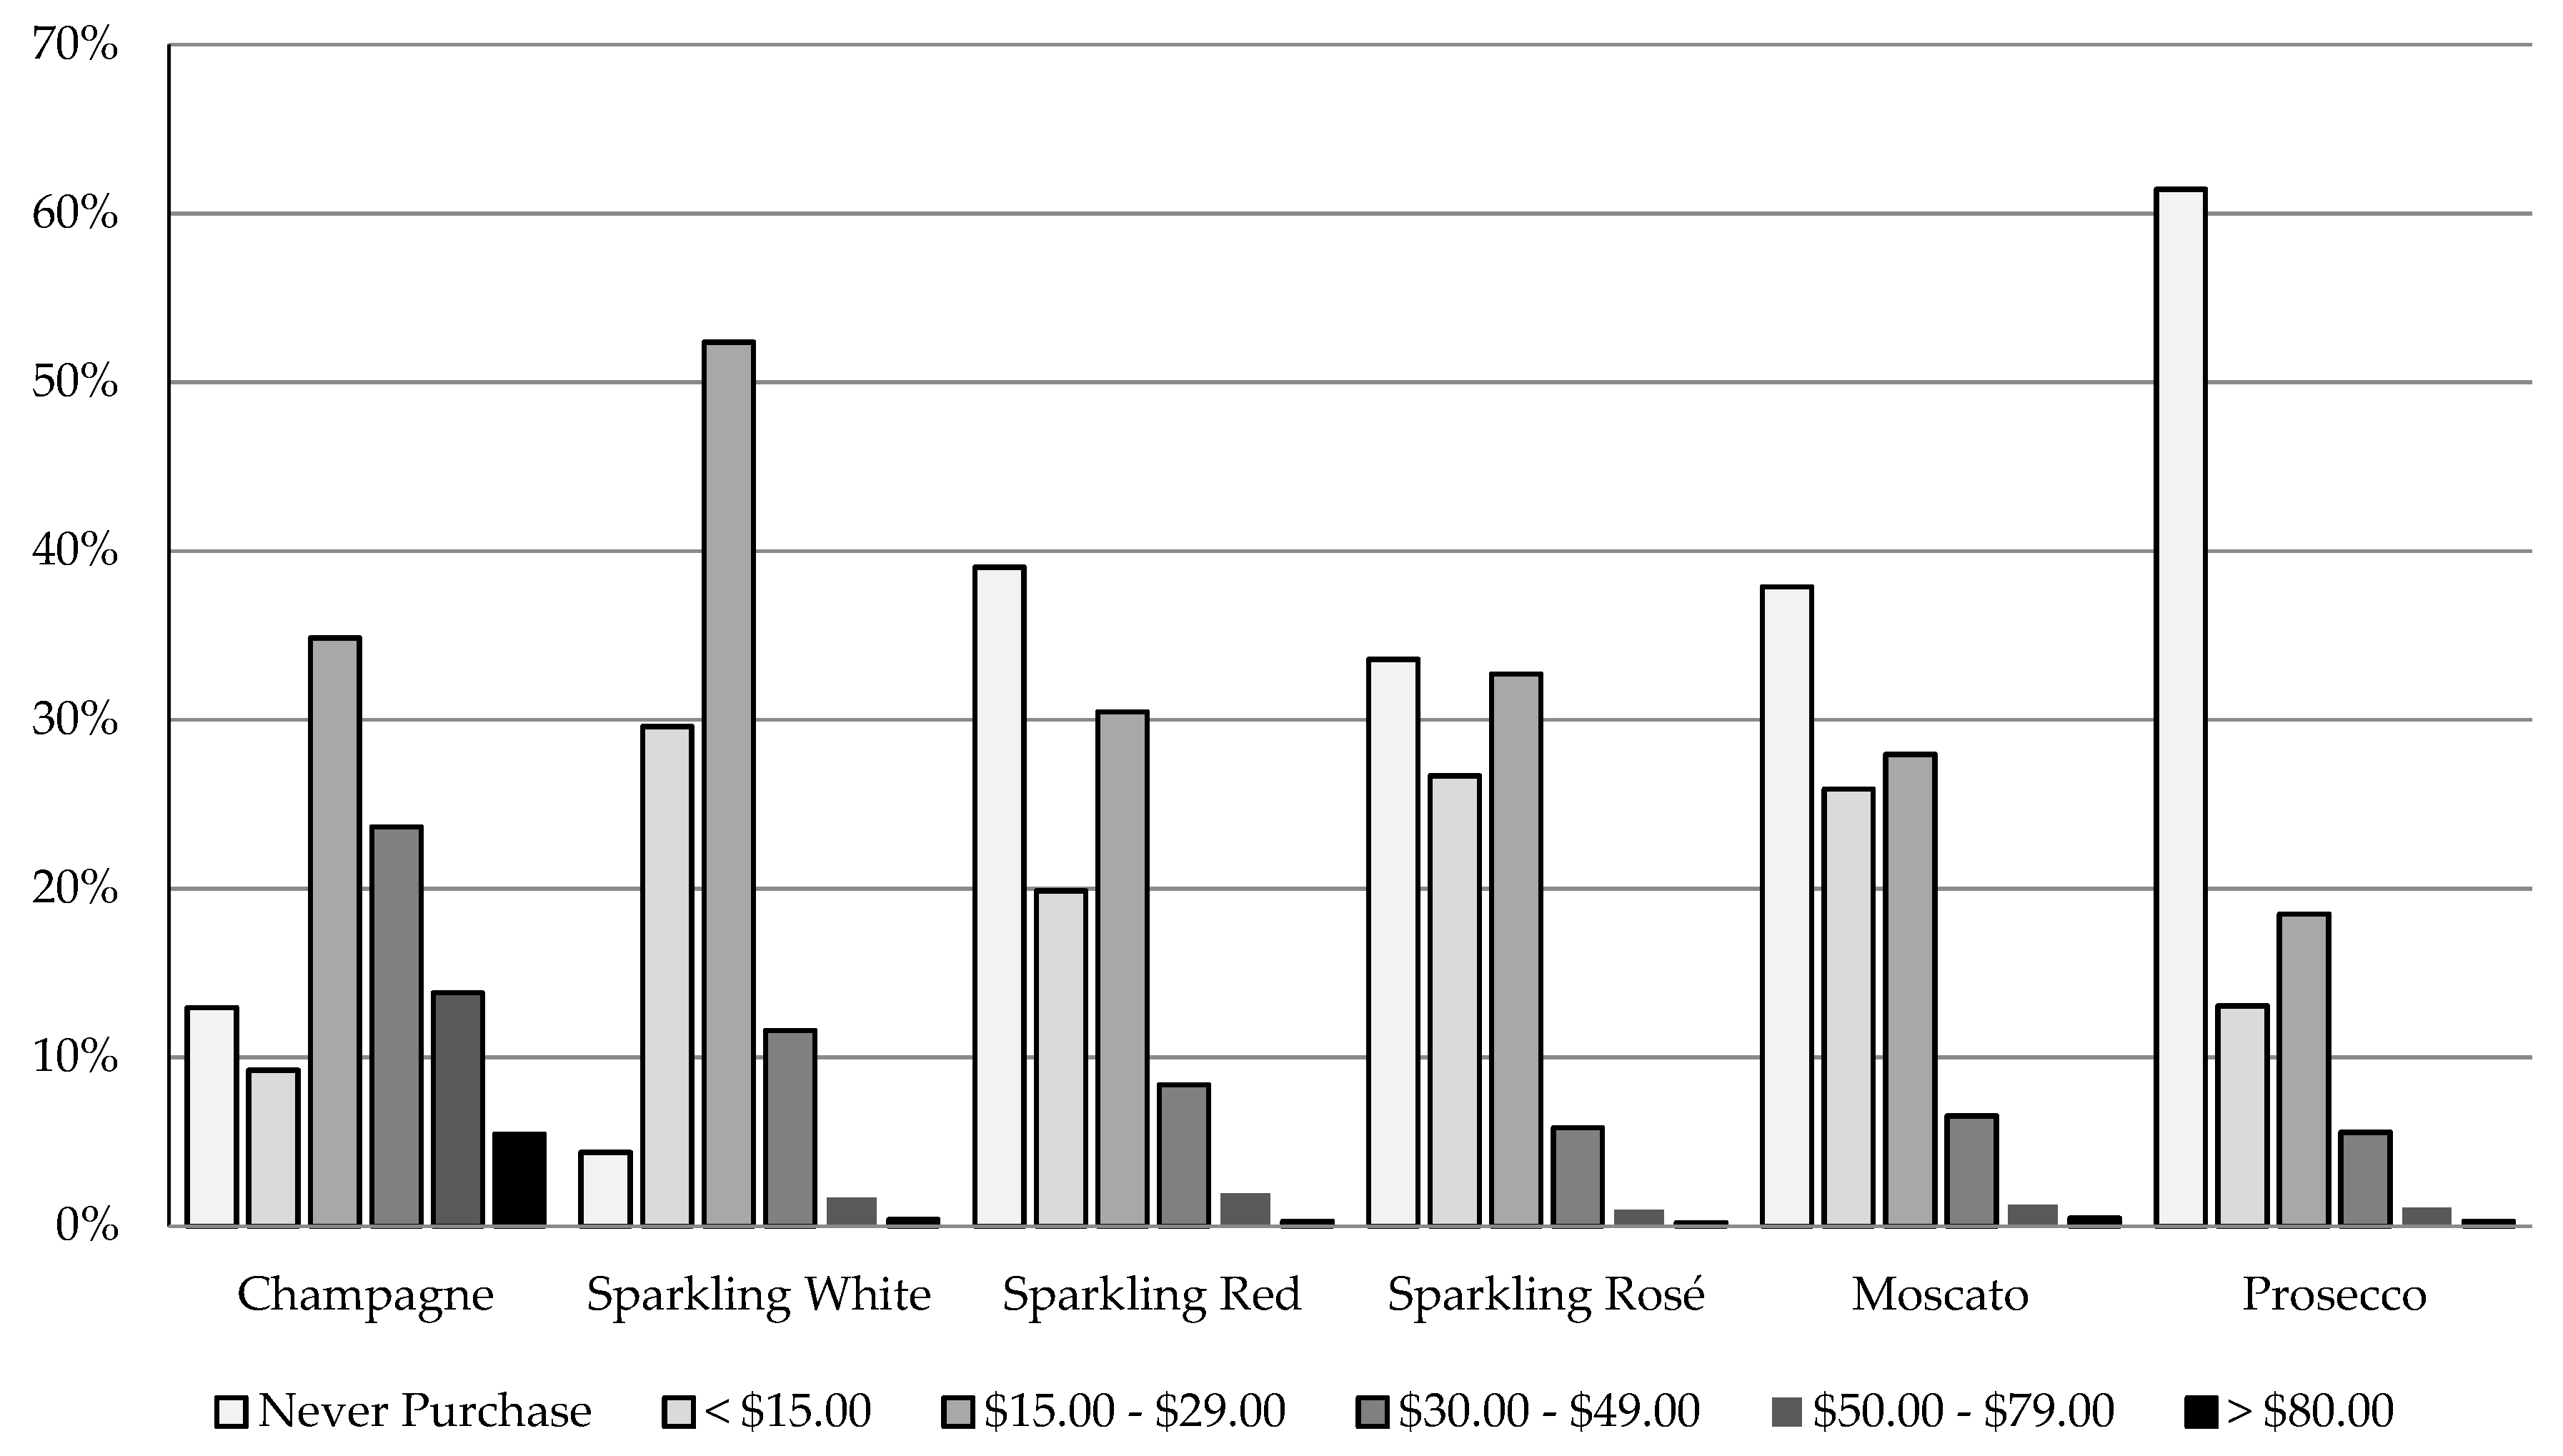
The most common sparkling wine purchased by consumers in this study was sparkling white wine priced between AU$15 and $29 per bottle (n = 538, 52%), followed by Champagne at the same price point (n = 358, 35%) (Figure 1). Participants typically purchased bottles of sparkling white at a price less than AU$30 (n = 887, 86%), and fewer than 2.1% (n = 21) spend more than AU$50 per bottle. More people were willing to spend upwards of AU$30 for Champagne (43%, n = 441 typically spending more than AU$30 per bottle), but only 5.5% (n = 56) usually spend more than AU$80. Approximately 60% of consumers (n = 631) never purchase Prosecco, 39% (n = 401) do not buy sparkling red wine, 38% (n = 389) never buy Moscato, and 34% (n = 345) do not purchase sparkling rosé wine (Table 8).
For all considered wine styles, there was a significant association between the consumer segments and the price they were willing to pay (p < 0.0001 for all) (Table 8). The No Frills consumers rarely pay more than AU$30 per bottle of Australian sparkling wine. When considering Prosecco, Moscato, sparkling rosé and sparkling red wine, at least 40% of the collective cohort do not purchase these styles. The majority of purchases made by Aspirants and Enthusiasts were under AU$50 and approximately 60% of each of these groups do not purchase Prosecco. The data show that No Frills consumers are most likely to purchase sparkling white wine at AU$15–$29 (n = 222, 50.3%) and never purchase sparkling red wine (n = 237, 54%) or Prosecco (n = 282, 64%). Only ~20% of the No Frills segment was willing to spend AU$15–$29 on sparkling red (n = 102, 23%), sparkling rosé (n = 119, 27%) and Moscato (n = 109, 25%).
Aspirants typically purchase sparkling white wine priced between AU$15 and $29 (n = 271, 56%) and most never purchase Prosecco (n = 290, 60%). At least 30% of the Aspirants purchase Champagne (n = 159, 33%), sparkling red (n = 180, 37%), sparkling rosé (n = 180, 37%) and Moscato (n = 153, 31.5%) at retail prices between AU$15 and $29. Proportionally, the Enthusiast group’s spread of data for the AU$15–$29 and AU$30–$49 was the most similar. The results ranged from 19% to 40% for the AU$15–$29 price bracket (n = 35, 35% for Champagne, n = 45, 45% for sparkling white wine, n = 31, 31% for sparkling red wine, n = 37, 37% for sparkling rosé wine, n = 25, 25% for Moscato, n = 19, 19% for Prosecco) and between 8% and 32% across all styles in the AU$30–$49 category (n = 28, 28% for Champagne, n = 32, 32% for sparkling white wine, n = 22, 22% for sparkling red wine, n = 22, 22% for sparkling rosé wine, n = 26, 26% for Moscato, and n = 8, 8% for Prosecco). Interestingly, only 1% (n = 1) of Enthusiasts did not purchase Champagne.
All consumer segments were willing to pay more for Champagne than any other style of sparkling wine. This likely reflects the influence of country of origin and price on consumer perceptions of wine quality [64,65]. Evidence also suggests purchasers are willing to spend more per bottle when wine is purchased for special occasions [49]. Although not specific to sparkling wine, it has been suggested that associating a given wine with an occasion might assist consumers with their purchasing decisions [66].
4. Conclusions
Different styles of sparkling wine (both fruit driven and complex styles) appeal to different segments of the domestic sparkling wine market. In the current study, sparkling white wine and Champagne were the preferred wine styles, followed by Moscato and sparkling rosé wine. However, preference scores for sparkling white and rosé wines were significantly higher for women, than for men, and younger consumers (i.e., those <35 years of age) preferred Moscato and sparkling rosé more than consumers from other age groups. Men and women liked sparkling red wine equally and Moscato appealed to both No Frills and Enthusiast consumers. Whereas Italian sparkling wines have enjoyed considerable (international) growth in recent years, most of the Australian consumers surveyed did not consume it regularly. In fact, almost 25% of consumers were unfamiliar with the style, suggesting Australian wine producers might benefit from further marketing this style. Perhaps not surprisingly, Enthusiasts consumed all sparkling wine styles, more often, and at different occasions, and were willing to spend more on Champagne, albeit, on average, the majority of respondents do not pay more than AU$50 per bottle for Australian sparkling wine.
The outcomes of this study can be used by sparkling wine producers to better tailor their products and marketing strategies to the specific needs and expectations of consumers within different segments of the Australian market. This research aimed to address a knowledge gap regarding the categorization of sparkling wine consumers to assist marketers in targeting specific segments of the Australian domestic market. There are several limitations to this study, due to possible sample and self-selection biases of survey respondents. Despite a recruited convenience sample of approximately 1000 Australian regular sparkling wine consumers, it should be acknowledged that the participants may not be entirely representative of the broader Australian sparkling wine consuming population. In addition, the survey required participants to self-report data, which could also lead to accuracy issues. Opportunities for future research include consumer tastings to determine sparkling wine preferences, as well as an exploration of consumers’ knowledge of sparkling wine production. Finally, this study could be replicated in other countries, to determine how cultural influences affect consumer behavior.
Supplementary Materials
The following are available online at https://0-www-mdpi-com.brum.beds.ac.uk/2306-5710/6/1/14/s1. Table S1: Influence of FWI segmentation and gender on preferences for different sparkling wine styles.; Table S2: Influence of FWI segmentation and age on preferences for different sparkling wine styles; Table S3: Influence of FWI segmentation and education on preferences for different sparkling wine styles; Table S4: Influence of FWI segmentation and household income (AUD) on preferences for different sparkling wine styles; Table S5: Influence of FWI segmentation on consumption occasions of different sparkling wine styles.
Author Contributions
All authors were involved in conceptualization; methodology and formal analysis, N.V.; writing—original draft preparation, N.V. and K.W.; writing—review and editing, R.R., J.C. and K.P.; supervision, K.W., R.R., J.C. and K.P.; funding, N.V. and K.W. All authors have read and agreed to the published version of the manuscript.
Funding
This research was funded by Wine Australia and N.V. was the recipient of a Wine Australia PhD scholarship (GWR Ph1309).
Acknowledgments
The authors gratefully acknowledge the services provided by TKW Research Group.
Conflicts of Interest
The authors declare no conflict of interest. The funders had no role in the design of the study, i.e., in the collection, analysis or interpretation of data, in the writing of the manuscript or in the decision to publish the results.
References
- Lockshin, L.; Corsi, A. Consumer behaviour for wine 2.0: A review since 2003 and future directions. Wine Econ. Policy 2012, 1, 2–23. [Google Scholar] [CrossRef] [Green Version]
- Riviezzo, A.; Nisco, A.; Garofano, A. Understanding wine purchase and consumption behavior: A market segmentation proposal. In Proceedings of the 6th AWBR International Conference, Bordeaux, France, 9–10 June 2011. [Google Scholar]
- Charters, S.; Pettigrew, S. The dimensions of wine quality. Food Qual. Prefer. 2007, 18, 997–1007. [Google Scholar] [CrossRef]
- Charters, S.; Pettigrew, S. Product involvement and the evaluation of wine quality. Qual. Mark. Res. Int. J. 2006, 9, 181–193. [Google Scholar] [CrossRef]
- Charters, S. Drinking sparkling wine: An exploratory investigation. Int. J. Wine Mark. 2005, 17, 54–68. [Google Scholar] [CrossRef]
- Cerjak, M.; Tomić, M.; Fočić, N.; Brkić, R. The importance of intrinsic and extrinsic sparkling wine characteristics and behavior of sparkling wine consumers in Croatia. J. Int. Food Agribus. Mark. 2016, 28, 191–201. [Google Scholar] [CrossRef]
- Veale, R.; Quester, P. Consumer sensory evaluations of wine quality: The respective influence of price and country of origin. J. Wine Econ. 2008, 3, 10–29. [Google Scholar] [CrossRef]
- Vecchio, R.; Lisanti, M.; Caracciolo, F.; Cembalo, L.; Gambuti, A.; Moio, L.; Siani, T.; Marotta, G.; Nazzaro, C.; Piombino, P. The role of production process and information on quality expectations and perceptions of sparkling wines. J. Sci. Food Agric. 2019, 99, 124–135. [Google Scholar] [CrossRef] [PubMed] [Green Version]
- Culbert, J.; Ristic, R.; Ovington, L.; Saliba, A.; Wilkinson, K. Influence of production method on the sensory profile and consumer acceptance of Australian sparkling white wine styles. Aust. J. Grape Wine Res. 2017, 23, 170–178. [Google Scholar] [CrossRef]
- Coates, C. An Encyclopedia of the Wines and Domaines of France; University of California Press: Berkeley, CA, USA, 2000; pp. 537–557. ISBN 9780520220935. [Google Scholar]
- Silverstein, M.; Fiske, N. Luxury for the masses. Harv. Bus. Rev. 2003, 81, 48–57. [Google Scholar] [CrossRef]
- Reyneke, M.; Berthon, P.; Pitt, L.; Parent, M. Luxury wine brands as gifts: Ontological and aesthetic perspectives. Int. J. Wine Bus. Res. 2011, 23, 258–270. [Google Scholar] [CrossRef]
- Morton, A.-L.; Healy, M.; Rivers, C. Beyond the bubbles: Identifying other purchase decision variables beyond country of origin effect that make Australians buy champagne. In Proceedings of the Australian New Zealand International Business Association Conference, Canberra, Australia, 5–6 November 2004. [Google Scholar]
- Rossetto, L.; Gastaldello, G. The loyalty structure of sparkling wine brands in Italy. J. Wine Econ. 2018, 13, 409–418. [Google Scholar] [CrossRef]
- Charters, S.; Velikova, N.; Ritchie, C.; Fountain, J.; Thach, L.; Dodd, T.; Fish, N.; Herbst, F.; Terblanche, N. Generation Y and sparkling wines: A cross-cultural perspective. Int. J. Wine Bus. Res. 2011, 23, 161–175. [Google Scholar] [CrossRef]
- Brunner, T.; Siegrist, M. Lifestyle determinants of wine consumption and spending on wine. Int. J. Wine Bus. Res. 2011, 23, 210–220. [Google Scholar] [CrossRef]
- Steichen, D.; Terrien, C. A model of demand in a repeated purchase situation: A simulation of the Champagne wine market. Int. J. Wine Bus. Res. 2009, 21, 354–372. [Google Scholar] [CrossRef]
- Charters, S.; Spielmann, N. Characteristics of strong territorial brands: The case of Champagne. J. Bus. Res. 2014, 67, 1461–1467. [Google Scholar] [CrossRef]
- Velikova, N.; Charters, S.; Fountain, J.; Ritchie, C.; Fish, N.; Dodd, T. Status or fun? A cross-cultural examination of young consumers’ responses to images of Champagne and sparkling wine. Br. Food J. 2016, 118, 1960–1975. [Google Scholar] [CrossRef]
- Charters, S.; Pettigrew, S. Why do people drink wine? A consumer-focused exploration. J. Food Prod. Mark. 2008, 14, 13–32. [Google Scholar] [CrossRef]
- Judicia, F.; Perkins, S. A means-end approach to the market for sparkling wines. Int. J. Wine Mark. 1992, 4, 10–18. [Google Scholar] [CrossRef]
- Johnson, R.; Bruwer, J. Regional brand image and perceived wine quality: The consumer perspective. Int. J. Wine Bus. Res. 2007, 19, 276–297. [Google Scholar] [CrossRef]
- Atkin, T.; Newton, S. Consumer awareness and quality perceptions: A case for Sonoma county wines. J. Wine Res. 2012, 23, 155–171. [Google Scholar] [CrossRef]
- Pickering, G.; Jain, A.; Bezawada, R. Segmentation and drivers of wine liking and consumption in US wine consumers. Int. J. Wine Res. 2014, 6, 9–19. [Google Scholar] [CrossRef] [Green Version]
- Charters, S. An ambivalent luxury: Images of Champagne in the Australian market. In Proceedings of the Beccus Wine Conference: Fourth Interdisciplinary and International Wine Conference, Dijon, France, 7–9 July 2009. [Google Scholar]
- Dobele, A.; Greenacre, L.; Fry, J. The impact of purchase goal on wine purchase decisions. Int. J. Wine Bus. Res. 2018, 30, 19–41. [Google Scholar] [CrossRef]
- Johnson, T.; Bastian, S. A preliminary study of the relationship between Australian wine consumers’ wine expertise and their wine purchasing and consumption behaviour. Aust. J. Grape Wine Res. 2007, 13, 186–197. [Google Scholar] [CrossRef]
- Bruwer, J.; McCutcheon, E. Marketing implications from a behaviourism perspective of consumption dynamics and socio-demographics of wine consumers. Asia Pac. J. Mark. Logist. 2017, 29, 519–537. [Google Scholar] [CrossRef]
- Schaefer, A. Do demographics have an impact on country of origin effects? J. Mark. Manag. 1997, 13, 813. [Google Scholar] [CrossRef]
- Müller, S. The country-of-origin effect of sparkling wine. In Proceedings of the 3rd International Wine Business Research Conference, Montpellier, France, 6–8 July 2006. [Google Scholar]
- Terrien, C.; Steichen, D. How Taste and Reputation Affect the Champagne Market. Available online: https://www.google.com/url?sa=t&rct=j&q=&esrc=s&source=web&cd=1&ved=2ahUKEwirp_qev_LnAhXVb30KHWXPAzQQFjAAegQIBBAB&url=http%3A%2F%2Fwww.vdqs.net%2FWorking_Papers%2FText%2FWP_2005%2Fterrien.pdf&usg=AOvVaw29o4mH42Iv329Chlj84o_I (accessed on 11 January 2019).
- Orth, U.; Kahle, L. Intrapersonal variation in consumer susceptibility to normative influence: Toward a better understanding of brand choice decisions. J. Soc. Psychol. 2008, 148, 423. [Google Scholar] [CrossRef]
- Vignes, A.; Gergaud, O. Twilight of the idols in the market for Champagne: Dissonance or consonance in consumer preferences? J. Wine Res. 2007, 18, 147–162. [Google Scholar] [CrossRef]
- Rokka, J. Champagne: Marketplace icon. Consum. Mark. Cult. 2017, 20, 275–283. [Google Scholar] [CrossRef]
- Culbert, J.; Cozzolino, D.; Ristic, R.; Wilkinson, K. Classification of sparkling wine style and quality by MIR spectroscopy. Molecules 2015, 20, 8341–8356. [Google Scholar] [CrossRef]
- Culbert, J.; Ristic, R.; Ovington, L.; Saliba, A.; Wilkinson, K. Sensory profiles and consumer acceptance of different styles of Australian Moscato. Aust. J. Grape Wine Res. 2018, 24, 96–104. [Google Scholar] [CrossRef]
- Caliari, V.; Burin, V.; Rosier, J.; BordignonLuiz, M. Aromatic profile of Brazilian sparkling wines produced with classical and innovative grape varieties. Food Res. Int. 2014, 62, 965–973. [Google Scholar] [CrossRef] [Green Version]
- Caliari, V.; Panceri, C.; Rosier, J.; Bordignon-Luiz, M. Effect of the traditional, Charmat and Asti method production on the volatile composition of Moscato Giallo sparkling wines. LWT Food Sci. Technol. 2015, 61, 393–400. [Google Scholar] [CrossRef]
- Dal Bianco, A.; Boatto, V.; Trestini, S.; Caracciolo, F. Understanding consumption choice of Prosecco wine: An empirical analysis using Italian and German homescan data. J. Wine Res. 2018, 29, 190–203. [Google Scholar] [CrossRef] [Green Version]
- Onofri, L.; Boatto, V.; Dal Bianco, A. Who likes it “sparkling”? An empirical analysis of prosecco consumers’ profile. Agric. Food Econ. 2015, 3. [Google Scholar] [CrossRef]
- Thiene, M.; Scarpa, R.; Galletto, L.; Boatto, V. Sparkling wine choice from supermarket shelves: The impact of certification of origin and production practices. Agric. Econ. 2013, 44, 523–536. [Google Scholar] [CrossRef]
- Dunstan, D. Better than Pommard! A History of Wine in Victoria; Australian Scholarly Publishing: North Melbourne, VIC, Australia, 1994; ISBN 1875606130. [Google Scholar]
- Cohen, J.; Lockshin, L.; Sharp, B. A better understanding of the structure of a wine market using the attribute of variety. Int. J. Bus. Glob. 2012, 8, 66–80. [Google Scholar] [CrossRef] [Green Version]
- Johnson, T.; Bastian, S. A fine wine instrument—An alternative for segmenting the Australian wine market. Int. J. Wine Bus. Res. 2015, 27, 182–202. [Google Scholar] [CrossRef]
- Verdonk, N.; Wilkinson, J.; Culbert, J.; Ristic, R.; Pearce, K.; Wilkinson, K. Toward a model of sparkling wine purchasing preferences. Int. J. Wine Bus. Res. 2017, 29, 58–73. [Google Scholar] [CrossRef]
- Odiase, J.I.; Ogbonmwan, S.M. Mood test. In International Encyclopedia of Statistical Science; Lovric, M., Ed.; Springer: Berlin/Heidelberg, Germany, 2011; pp. 863–864. ISBN 9783642048975. [Google Scholar]
- Verdonk, N.; Culbert, J.; Wilkinson, K. Sparkling wine: All that sparkles: Consumer perceptions of sparkling wine. Wine Vitic. J. 2015, 30, 71–73. [Google Scholar]
- Morton, A.; Rivers, C.; Charters, S.; Spinks, W. Champagne purchasing: The influence of kudos and sentimentality. Qual. Mark. Res. 2013, 16, 150–164. [Google Scholar] [CrossRef]
- Kallas, Z.; Escobar, C.; Gil, J. Assessing the impact of a Christmas advertisement campaign on catalan wine preference using choice experiments. Appetite 2012, 58, 285–298. [Google Scholar] [CrossRef] [PubMed]
- Bruwer, J.; Saliba, A.; Miller, B. Consumer behaviour and sensory preference differences: Implications for wine product marketing. J. Consum. Mark. 2011, 28, 5–18. [Google Scholar] [CrossRef] [Green Version]
- Pettigrew, S.; Ogilvie, M.; Ryan, M. Let’s party like it’s 1999: Intentions to consume alcohol on the eve of 2000. In Proceedings of the Australian & New Zealand Marketing Academy Conference, Gold Coast, Australia, 28 November–1 December 2000. [Google Scholar]
- Anchor, J.; Lacinova, T. Czech wine consumers: Maturing with age? Ekon. A Manag. 2015, 18, 169–182. [Google Scholar] [CrossRef]
- Spawton, A. Grapes and wine seminar—Prospering in the 1990s: Changing your view of the consumer. Int. J. Wine Mark. 1993, 3, 32–42. [Google Scholar] [CrossRef]
- Olsen, J. An exploratory study into wine drinking in bars, pubs and nightclubs in the United States. In Proceedings of the 4th International Conference of the Academy of Wine Business Research, Siena, Italy, 17–19 July 2008. [Google Scholar]
- Keown, C.; Casey, M. Purchasing behaviour in the Northern Ireland wine market. Br. Food J. 1995, 97, 17–20. [Google Scholar] [CrossRef]
- Chaney, I. External search effort for wine. Int. J. Wine Mark. 2000, 12, 5–21. [Google Scholar] [CrossRef]
- Gluckman, R. A consumer approach to branded wines. Int. J. Wine Mark. 1990, 2, 27–46. [Google Scholar] [CrossRef]
- Jover, A.; Montes, F.; del Mar Fuentes, M. Measuring perceptions of quality in food products: The case of red wine. Food Qual. Prefer. 2004, 15, 453–469. [Google Scholar] [CrossRef]
- Rao, A.; Monroe, K. The effect of price, brand name, and store name on buyers’ perceptions of product quality: An integrative review. J. Mark. Res. 1989, 351–357. [Google Scholar] [CrossRef]
- Skuras, D.; Vakrou, A. Consumers’ willingness to pay for origin labelled wine: A Greek case study. Br. Food J. 2002, 104, 898–912. [Google Scholar] [CrossRef]
- Schamel, G.; Anderson, K. Wine quality and varietal, regional and winery reputations: Hedonic prices for Australia and New Zealand. Econ. Rec. 2003, 79, 357–369. [Google Scholar] [CrossRef] [Green Version]
- Oczkowski, E. A hedonic price function for Australian premium table wine. Aust. J. Agric. Econ. 1994, 38, 93–110. [Google Scholar] [CrossRef] [Green Version]
- Lecocq, S.; Visser, M. What determines wine prices: Objective vs. sensory characteristics. J. Wine Econ. 2006, 1, 33–41. [Google Scholar] [CrossRef] [Green Version]
- Veale, R.; Quester, P. Do consumer expectations match experience? Predicting the influence of price and country of origin on perceptions of product quality. Int. Bus. Rev. 2009, 18, 134–144. [Google Scholar] [CrossRef]
- Culbert, J.; Verdonk, N.; Ristic, R.; Olarte Mantilla, S.; Lane, M.; Pearce, K.; Cozzolino, D.; Wilkinson, K. Understanding consumer preferences for Australian sparkling wine vs. French Champagne. Beverages 2016, 2, 19. [Google Scholar] [CrossRef]
- Viot, C. Subjective knowledge, product attributes and consideration set: A wine application. Int. J. Wine Bus. Res. 2012, 24, 219–248. [Google Scholar] [CrossRef] [Green Version]
Figure 1.
Consumer spending per bottle (AUD) on different sparkling wine styles.


Table 1.
Demographics of Fine Wine Instrument consumer segments (data are frequencies and percentages).
Table 1.
Demographics of Fine Wine Instrument consumer segments (data are frequencies and percentages).
| Frequency | Percentage (%) | |||||||||
| All Consumers | No Frills | Aspirants | Enthusiasts | ||||||
| (n = 1027) | (n = 441) | (n = 486) | (n = 100) | ||||||
| Gender | Male | 482 | 46.9 | 154 | 34.9 | 266 | 54.7 | 62 | 62.0 |
| Female | 545 | 53.1 | 287 | 65.1 | 220 | 45.3 | 38 | 38.0 | |
| Age | 18–24 | 53 | 5.2 | 18 | 4.1 | 25 | 5.1 | 10 | 10.0 |
| 25–34 | 307 | 29.9 | 122 | 27.7 | 131 | 27.0 | 54 | 54.0 | |
| 35–44 | 208 | 20.3 | 88 | 20.0 | 105 | 21.6 | 15 | 15.0 | |
| 45–54 | 181 | 17.6 | 77 | 17.5 | 91 | 18.7 | 13 | 13.0 | |
| 55–64 | 170 | 16.6 | 90 | 20.4 | 75 | 15.4 | 5 | 5.0 | |
| 65+ | 108 | 10.5 | 46 | 10.4 | 59 | 12.1 | 3 | 3.0 | |
| Household income (AUD) | <50,000 | 256 | 24.9 | 126 | 28.6 | 107 | 22.0 | 23 | 23.0 |
| 50,000–100,000 | 417 | 40.6 | 176 | 39.9 | 199 | 40.9 | 42 | 42.0 | |
| 100,001–150,000 | 232 | 22.6 | 92 | 20.9 | 115 | 23.7 | 25 | 25.0 | |
| >150,000 | 122 | 11.9 | 47 | 10.7 | 65 | 13.4 | 10 | 10.0 | |
| Education | High school | 236 | 23.0 | 132 | 29.9 | 88 | 18.1 | 16 | 16.0 |
| Trade | 298 | 29.0 | 141 | 32.0 | 139 | 28.6 | 18 | 18.0 | |
| Undergraduate | 271 | 26.4 | 109 | 24.7 | 132 | 27.2 | 30 | 30.0 | |
| Postgraduate | 222 | 21.6 | 59 | 13.4 | 127 | 26.1 | 36 | 36.0 | |
| Sparkling wine consumption | Once per month | 471 | 45.9 | 256 | 58.1 | 197 | 40.5 | 18 | 18.0 |
| Once every 2 weeks | 259 | 25.2 | 96 | 21.8 | 143 | 29.4 | 20 | 20.0 | |
| Once per week | 204 | 19.9 | 62 | 14.1 | 107 | 22.0 | 35 | 35.0 | |
| More than twice per week | 93 | 9.1 | 27 | 6.1 | 39 | 8.0 | 27 | 27.0 | |
| Chi-Square Test | Marascuilo Procedure | ||||||||
| All Segments | No Frills vs. Aspirants | No Frills vs. Enthusiasts | Aspirants vs. Enthusiast | ||||||
| Sparkling wine consumption | Once per month | <0.0001 * | Significant | Significant | Significant | ||||
| Once every 2 weeks | 0.012 * | Significant | Not Significant | Not Significant | |||||
| Once per week | <0.0001 * | Significant | Significant | Significant | |||||
| More than twice per week | <0.0001 * | Not Significant | Significant | Significant | |||||
*p values at significance level of 0.05.
Table 2.
Average alcohol, wine and sparkling wine consumption of Fine Wine Instrument consumer segments.
Table 2.
Average alcohol, wine and sparkling wine consumption of Fine Wine Instrument consumer segments.
| Minimum | Mean | Median | Maximum | |||||||||||||||||
| All Segments (n = 1027) | No Frills (n = 441) | Aspirants (n = 486) | Enthusiasts (n = 100) | ||||||||||||||
| Alcohol type | Wine | 0 | 52.3 | 50.0 | 100 | 0 | 52.2 | 50.0 | 100 | 2 | 54.3 | 50.0 | 100 | 7 | 43.1 | 40.0 | 100 |
| Beer | 0 | 18.9 | 10.0 | 100 | 0 | 17.6 | 5.0 | 100 | 0 | 19.0 | 10.0 | 90 | 0 | 24.4 | 22.5 | 80 | |
| Spirits | 0 | 16.1 | 10.0 | 95 | 0 | 16.4 | 10.0 | 95 | 0 | 16.0 | 10.0 | 95 | 0 | 15.0 | 10.0 | 60 | |
| Cider | 0 | 8.9 | 1.0 | 90 | 0 | 10.1 | 0.0 | 90 | 0 | 7.2 | 0.0 | 70 | 0 | 11.6 | 10.0 | 50 | |
| Other | 0 | 3.9 | 0.0 | 100 | 0 | 3.7 | 0.0 | 100 | 0 | 3.5 | 0.0 | 70 | 0 | 6.0 | 0.0 | 45 | |
| Wine type | Sparkling wine | 0 | 31.8 | 25.0 | 100 | 0 | 36.5 | 30.0 | 100 | 0 | 27.9 | 20.0 | 100 | 0 | 30.2 | 25.0 | 100 |
| White | 0 | 27.7 | 20.0 | 100 | 0 | 30.6 | 25.0 | 100 | 0 | 26.5 | 20.0 | 90 | 0 | 21.0 | 20.0 | 90 | |
| Rosé | 0 | 7.2 | 2.0 | 100 | 0 | 6.7 | 0.0 | 100 | 0 | 6.9 | 5.0 | 60 | 0 | 11.3 | 10.0 | 60 | |
| Red | 0 | 25.5 | 20.0 | 100 | 0 | 19.5 | 10.0 | 100 | 0 | 31.3 | 30.0 | 100 | 0 | 23.7 | 20.0 | 100 | |
| Dessert | 0 | 4.1 | 0.0 | 90 | 0 | 3.8 | 0.0 | 90 | 0 | 3.9 | 0.0 | 70 | 0 | 6.0 | 5.0 | 20 | |
| Fortified | 0 | 3.6 | 0.0 | 90 | 0 | 2.8 | 0.0 | 90 | 0 | 3.5 | 0.0 | 50 | 0 | 7.9 | 5.0 | 70 | |
| Wine style | Champagne | 0 | 13.9 | 5.0 | 100 | 0 | 8.1 | 0.0 | 100 | 0 | 16.6 | 10.0 | 100 | 0 | 27.2 | 20.0 | 100 |
| Sparkling white | 0 | 45.5 | 40.0 | 100 | 0 | 51.1 | 50.0 | 100 | 0 | 44.3 | 40.0 | 100 | 0 | 26.4 | 20.0 | 100 | |
| Sparkling red | 0 | 10.7 | 0.0 | 100 | 0 | 8.4 | 0.0 | 100 | 0 | 12.4 | 5.0 | 100 | 0 | 12.0 | 10.0 | 100 | |
| Sparkling rosé | 0 | 8.4 | 2.0 | 100 | 0 | 8.0 | 0.0 | 100 | 0 | 8.4 | 5.0 | 100 | 0 | 10.4 | 10.0 | 40 | |
| Moscato | 0 | 17.3 | 5.0 | 100 | 0 | 21.5 | 5.0 | 100 | 0 | 13.8 | 5.0 | 100 | 0 | 15.7 | 10.0 | 100 | |
| Prosecco | 0 | 4.2 | 0.0 | 100 | 0 | 3.0 | 0.0 | 100 | 0 | 4.6 | 0.0 | 90 | 0 | 8.3 | 10.0 | 40 | |
| Mood Test Multiple Pairwise Comparison p value | |||||||||||||||||
| All Segments | No Frills vs. Aspirants | No Frills vs. Enthusiasts | Aspirants vs. Enthusiasts | ||||||||||||||
| Alcohol type | Wine | 0.001 * | 0.361 | 0.001 * | 0.000 * | ||||||||||||
| Beer | <0.0001 * | 0.005 * | <0.0001 * | 0.000 * | |||||||||||||
| Spirits | 0.239 | 0.260 | 0.120 | 0.375 | |||||||||||||
| Cider | 0.002 * | 0.748 | 0.001 * | 0.000 * | |||||||||||||
| Other | 0.000 * | 0.014 * | <0.0001 * | 0.013 * | |||||||||||||
| Wine type | Sparkling wine | 0.002 * | 0.000 * | 0.134 | 0.256 | ||||||||||||
| White | <0.0001 * | 0.071 | <0.0001 * | 0.000 * | |||||||||||||
| Rosé | <0.0001 * | 0.000 * | <0.0001 * | <0.0001 * | |||||||||||||
| Red | <0.0001 * | <0.0001 * | 0.000 * | 0.002 * | |||||||||||||
| Dessert | <0.0001 * | <0.0001 * | <0.0001 * | 0.003 * | |||||||||||||
| Fortified | <0.0001 * | <0.0001 * | <0.0001 * | 0.05 * | |||||||||||||
| Wine style | Champagne | <0.0001 * | <0.0001 * | <0.0001 * | <0.0001 * | ||||||||||||
| Sparkling white | <0.0001 * | 0.002 * | <0.0001 * | <0.0001 * | |||||||||||||
| Sparkling red | <0.0001 * | <0.0001 * | <0.0001 * | 0.065 | |||||||||||||
| Sparkling rosé | 0.000 * | 0.004 * | 0.001 * | 0.025 * | |||||||||||||
| Moscato | <0.0001 * | 0.103 | 0.001 * | <0.0001 * | |||||||||||||
| Prosecco | <0.0001 * | <0.0001 * | <0.0001 * | <0.0001 * | |||||||||||||
Data are the means and medians of a percentage scale (0–100%). * p values at significance level of 0.05.
Table 3.
Frequencies (and weighted percentages) of the top ten words and brands that consumers associated with different sparkling wine styles.
Table 3.
Frequencies (and weighted percentages) of the top ten words and brands that consumers associated with different sparkling wine styles.
| Word or Brand | Frequency | Weighted Percentage (%) | |||||||||||||||||
| Champagne | Sparkling White | Sparkling Red | |||||||||||||||
| expensive | 224 | 11.7 | Moet | 421 | 19.6 | bubbly | 237 | 11.9 | Yellow | 143 | 6.3 | red | 109 | 6.7 | none * | 80 | 6.9 |
| bubbly | 137 | 7.1 | Chandon | 182 | 8.5 | refreshing | 209 | 9.0 | Jacobs | 123 | 5.5 | bubbly | 79 | 4.5 | Brown | 69 | 5.9 |
| celebration | 88 | 4.6 | Dom | 117 | 5.4 | light | 122 | 4.3 | Creek | 121 | 5.4 | rich | 78 | 4.3 | Brothers | 58 | 5.0 |
| quality | 60 | 3.1 | Mumm | 105 | 4.9 | fresh | 162 | 4.2 | Brown | 110 | 4.9 | none* | 69 | 4.2 | Creek | 30 | 2.6 |
| French | 51 | 2.7 | Bollinger | 102 | 4.7 | fun | 62 | 3.3 | Yellowglen | 109 | 4.8 | sweet | 58 | 3.0 | Jacobs | 27 | 2.3 |
| luxury | 51 | 2.4 | Veuve | 102 | 4.7 | celebration | 47 | 2.4 | Brothers | 94 | 4.2 | sparkling | 56 | 2.7 | Seppelt | 27 | 2.3 |
| classy | 50 | 2.6 | Perignon | 98 | 4.6 | good | 46 | 2.3 | Chandon | 86 | 3.8 | strong | 42 | 2.5 | Penfolds | 26 | 2.2 |
| special | 49 | 2.5 | Cliquot | 56 | 2.6 | crisp | 46 | 2.3 | Glen | 49 | 2.2 | dark | 39 | 2.3 | Yellowglen | 22 | 1.9 |
| sparkling | 43 | 1.9 | Verve | 52 | 2.4 | fruity | 39 | 2.1 | Wolf | 42 | 1.9 | wine | 32 | 2.0 | n * | 20 | 1.7 |
| dry | 38 | 2.0 | Krug | 39 | 1.8 | nice | 39 | 2.1 | Blass | 40 | 1.8 | heavy | 34 | 1.9 | nil * | 20 | 1.7 |
| Sparkling Rosé | Moscato | Prosecco | |||||||||||||||
| pink | 161 | 9.4 | Jacobs | 88 | 7.5 | sweet | 485 | 27.1 | Brown | 271 | 17.8 | none* | 130 | 9.0 | none * | 110 | 15.0 |
| sweet | 153 | 7.6 | Creek | 85 | 7.2 | none * | 62 | 3.6 | Brothers | 239 | 15.7 | (don’t) know * | 116 | 7.9 | Brown | 64 | 8.7 |
| light | 128 | 6.0 | none* | 79 | 6.7 | light | 74 | 3.3 | none * | 70 | 4.6 | Italian | 93 | 6.4 | Brothers | 54 | 7.4 |
| bubbly | 85 | 4.7 | Brown | 61 | 5.2 | fruity | 43 | 2.5 | Gossips | 64 | 4.2 | dry | 79 | 5.5 | (don’t) know | 37 | 5.1 |
| refreshing | 82 | 3.7 | Brothers | 53 | 4.5 | refreshing | 57 | 2.3 | Jacobs | 55 | 3.6 | sweet | 69 | 4.5 | nil * | 25 | 3.4 |
| none* | 53 | 3.1 | Yellowglen | 37 | 3.1 | wine | 36 | 2.1 | Creek | 52 | 3.4 | nothing * | 56 | 3.9 | n * | 23 | 3.1 |
| red | 50 | 2.9 | Mateus | 26 | 2.2 | (don’t) know * | 35 | 1.8 | Banrock | 48 | 3.2 | (not) sure * | 42 | 2.9 | (can’t) recall | 17 | 2.3 |
| nice | 37 | 2.1 | (can’t) recall | 22 | 1.9 | bubbly | 31 | 1.7 | Station | 43 | 2.8 | wine | 38 | 2.6 | (not) sure * | 17 | 2.3 |
| wine | 31 | 1.8 | Yellow | 22 | 1.9 | delicious | 31 | 1.7 | Bros | 29 | 1.9 | never* (tried) | 36 | 2.5 | na * | 15 | 2.1 |
| (don’t) know * | 34 | 1.6 | nil | 21 | 1.8 | nice | 28 | 1.6 | Moscato | 25 | 1.6 | sparkling | 42 | 2.4 | (no) idea | 12 | 1.6 |
* Descriptors which indicated that respondents were unfamiliar with the sparkling wine style. In these circumstances, ‘none’, ‘nil’, ‘na’ and ‘n’ were taken to indicate that no words or brand could be associated with the wine style; ‘know’, ‘never’ and ‘sure’ were associated with ‘don’t know’, ‘never tried’ and ‘not sure’, respectively. Consumers were asked to the list words and brands that they associated with each sparkling wine style (as many or as few words/brands as desired, but at least one response).
Table 4.
Liking scores of Fine Wine Instrument consumer segments for different sparkling wine styles.
Table 4.
Liking scores of Fine Wine Instrument consumer segments for different sparkling wine styles.
| 1st Percentage Quartile | Mean | Median | 3rd Percentage Quartile | ||||||||||||||||
| All Segments(n = 1027) | No Frills (n = 441) | Aspirants (n = 486) | Enthusiasts (n = 100) | |||||||||||||
| Champagne | 5.0 | 6.8 | 7.0 | 9.0 | 5.0 | 6.3 | 7.0 | 8.0 | 6.0 | 7.0 | 7.0 | 9.0 | 7.0 | 7.7 | 8.0 | 9.0 |
| Sparkling white | 7.0 | 7.3 | 7.0 | 9.0 | 7.0 | 7.3 | 8.0 | 9.0 | 7.0 | 7.3 | 7.0 | 9.0 | 7.0 | 7.5 | 7.0 | 9.0 |
| Sparkling red | 4.0 | 5.7 | 6.0 | 7.0 | 3.0 | 5.1 | 5.0 | 7.0 | 5.0 | 5.9 | 6.0 | 7.0 | 6.0 | 6.9 | 7.0 | 8.0 |
| Sparkling rosé | 5.0 | 6.0 | 6.0 | 7.0 | 5.0 | 6.0 | 6.0 | 7.0 | 5.0 | 5.8 | 6.0 | 7.0 | 6.0 | 6.9 | 7.0 | 8.0 |
| Moscato | 5.0 | 6.0 | 6.0 | 8.0 | 5.0 | 6.1 | 7.0 | 9.0 | 4.0 | 5.7 | 6.0 | 7.0 | 5.0 | 6.8 | 7.0 | 9.0 |
| Prosecco | 5.0 | 5.3 | 5.0 | 7.0 | 4.0 | 5.0 | 5.0 | 6.0 | 5.0 | 5.3 | 5.0 | 7.0 | 5.0 | 6.5 | 7.0 | 8.0 |
| Mood Test Multiple Pairwise Comparison p value | ||||||||||||||||
| All Segments | No Frills vs. Aspirants | No Frills vs. Enthusiasts | Aspirants vs. Enthusiasts | |||||||||||||
| Champagne | <0.0001 * | <0.0001 * | <0.0001 * | <0.0001 * | ||||||||||||
| Sparkling white | 0.035 * | 0.010 * | 0.645 | 0.657 | ||||||||||||
| Sparkling red | <0.0001 * | 0.002 * | <0.0001 * | <0.0001 * | ||||||||||||
| Sparkling rosé | <0.0001 * | 0.049 * | <0.0001 * | <0.0001 * | ||||||||||||
| Moscato | <0.0001 * | 0.002 * | 0.050 * | <0.0001 * | ||||||||||||
| Prosecco | <0.0001 * | 0.015 * | <0.0001 * | <0.0001 * | ||||||||||||
Data are the means, medians and quartiles of 9 point Likert scale scores (where 1 = extremely dislike, 5 = neither dislike nor like, 9 = extremely like, and 0 = never consumed). * p values at significance level of 0.05.
Table 5.
Frequency of Fine Wine Instrument consumer segments’ unfamiliarity with different sparkling wine styles.
Table 5.
Frequency of Fine Wine Instrument consumer segments’ unfamiliarity with different sparkling wine styles.
| Wine Type | Frequency | |||
|---|---|---|---|---|
| All Segments (n = 1027) | No Frills (n = 441) | Aspirants (n = 486) | Enthusiasts (n = 100) | |
| Champagne | 64 | 44 | 19 | 1 |
| Sparkling white | 10 | 3 | 5 | 2 |
| Sparkling red | 38 | 25 | 10 | 3 |
| Sparkling rosé | 36 | 26 | 8 | 2 |
| Moscato | 68 | 38 | 25 | 5 |
| Prosecco | 253 | 157 | 88 | 8 |
Table 6.
Quartile and median liking scores and comparisons of gender, age, education and household income (AUD) segments for different sparkling wine styles.
Table 6.
Quartile and median liking scores and comparisons of gender, age, education and household income (AUD) segments for different sparkling wine styles.
| 1st Quartile Percentage | Median | 3rd Quartile Percentage | ||||||||||||||||||
| Champagne | Sparkling White | Sparkling Red | Sparkling Rosé | Moscato | Prosecco | |||||||||||||
| All segments | 5.0 | 7.0 | 8.0 | 7.0 | 7.0 | 9.0 | 4.0 | 6.0 | 7.0 | 5.0 | 6.0 | 7.0 | 4.0 | 6.0 | 8.0 | 5.0 | 5.0 | 6.0 |
| Male | 5.0 | 7.0 | 8.0 | 6.0 | 7.0 | 8.0 | 5.0 | 6.0 | 7.0 | 5.0 | 6.0 | 7.0 | 4.0 | 6.0 | 7.0 | 4.0 | 5.0 | 7.0 |
| Female | 5.0 | 7.0 | 9.0 | 7.0 | 8.0 | 9.0 | 3.0 | 6.0 | 8.0 | 5.0 | 7.0 | 8.0 | 5.0 | 7.0 | 9.0 | 5.0 | 5.0 | 7.0 |
| <35 years | 5.0 | 7.0 | 8.0 | 6.0 | 7.0 | 9.0 | 4.0 | 6.0 | 7.0 | 5.0 | 7.0 | 9.0 | 5.0 | 7.0 | 9.0 | 5.0 | 5.0 | 7.0 |
| 35–55 years | 5.0 | 7.0 | 9.0 | 7.0 | 7.0 | 9.0 | 5.0 | 6.0 | 7.0 | 5.0 | 6.0 | 7.0 | 5.0 | 6.0 | 8.0 | 5.0 | 5.0 | 6.5 |
| >55 years | 5.0 | 7.0 | 9.0 | 7.0 | 8.0 | 9.0 | 3.0 | 6.0 | 7.0 | 5.0 | 5.0 | 7.0 | 3.0 | 5.0 | 7.0 | 3.0 | 5.0 | 6.0 |
| High school | 5.0 | 7.0 | 8.0 | 6.0 | 7.5 | 9.0 | 4.0 | 6.0 | 7.0 | 5.0 | 6.0 | 7.0 | 5.0 | 7.0 | 8.0 | 5.0 | 5.0 | 6.0 |
| Trade | 5.0 | 7.0 | 8.0 | 7.0 | 7.0 | 9.0 | 4.0 | 6.0 | 7.0 | 5.0 | 6.0 | 7.0 | 4.0 | 7.0 | 9.0 | 4.0 | 5.0 | 6.0 |
| Undergraduate | 6.0 | 7.0 | 9.0 | 7.0 | 7.0 | 9.0 | 5.0 | 6.0 | 7.0 | 5.0 | 6.0 | 7.0 | 5.0 | 6.0 | 7.0 | 5.0 | 5.0 | 7.0 |
| Postgraduate | 6.0 | 8.0 | 9.0 | 7.0 | 7.0 | 9.0 | 5.0 | 6.0 | 8.0 | 5.0 | 6.0 | 7.0 | 5.0 | 6.0 | 8.0 | 5.0 | 6.0 | 7.0 |
| <50,000 | 5.0 | 7.0 | 7.0 | 7.0 | 8.0 | 9.0 | 4.0 | 6.0 | 7.0 | 5.0 | 6.0 | 7.0 | 5.0 | 6.0 | 8.0 | 4.0 | 5.0 | 6.0 |
| 50,000–100,000 | 5.0 | 7.0 | 7.0 | 7.0 | 7.0 | 8.0 | 5.0 | 6.0 | 7.0 | 5.0 | 6.0 | 7.0 | 5.0 | 6.0 | 8.0 | 5.0 | 5.0 | 7.0 |
| 100,001–150,000 | 6.0 | 7.0 | 7.0 | 7.0 | 8.0 | 9.0 | 4.0 | 6.0 | 7.0 | 5.0 | 6.0 | 7.0 | 4.0 | 6.0 | 8.0 | 5.0 | 5.0 | 6.5 |
| >150,000 | 6.0 | 8.0 | 8.0 | 7.0 | 7.0 | 9.0 | 4.0 | 6.0 | 7.0 | 5.0 | 6.0 | 7.0 | 4.0 | 6.0 | 8.0 | 5.0 | 5.0 | 7.0 |
| Mood Test Multiple Pairwise Comparison p value | ||||||||||||||||||
| Champagne | Sparkling White | Sparkling Red | Sparkling Rosé | Moscato | Prosecco | |||||||||||||
| Both genders | 0.129 | <0.0001 * | 0.053 | <0.0001 * | 0.000 * | 0.193 | ||||||||||||
| All age groups | 0.024 * | <0.0001 * | 0.397 | 0.003 * | <0.0001 * | 0.000 * | ||||||||||||
| <35 years vs. 35–55 years | 0.048 * | 0.038 * | 0.252 | 0.206 | <0.0001 * | 0.006 * | ||||||||||||
| <35 years vs. >55 years | 0.467 | <0.0001 * | 0.232 | 0.001 * | <0.0001 * | <0.0001 * | ||||||||||||
| 35–55 years vs. >55 years | 0.011 * | 0.003 * | 0.88 | 0.021 * | 0.045 * | 0.113 | ||||||||||||
| All education levels | <0.0001* | 0.676 | 0.258 | 0.492 | 0.013 * | 0.001 * | ||||||||||||
| High school vs. Trade | 0.118 | 0.969 | 0.692 | 0.76 | 0.786 | 0.747 | ||||||||||||
| High school vs. Undergraduate | 0.003 * | 0.677 | 0.618 | 0.337 | 0.005 * | 0.298 | ||||||||||||
| High school vs. Postgraduate | <0.0001 * | 0.283 | 0.207 | 0.698 | 0.379 | 0.001 * | ||||||||||||
| Trade vs. Undergraduate | 0.142 | 0.687 | 0.906 | 0.183 | 0.004 * | 0.147 | ||||||||||||
| Trade vs. Postgraduate | 0.000 * | 0.274 | 0.084 | 0.915 | 0.419 | 0.000 * | ||||||||||||
| Undergraduate vs. Postgraduate | 0.018 * | 0.485 | 0.072 | 0.179 | 0.058 | 0.019 * | ||||||||||||
| All income levels | <0.0001 * | 0.611 | 0.303 | 0.911 | 0.845 | 0.097 | ||||||||||||
| 50,000 vs. 50,000–100,000 | 0.053 | 0.273 | 0.067 | 0.931 | 0.759 | 0.124 | ||||||||||||
| 50,000 vs. 100,001–150,000 | 0.000 * | 0.633 | 0.228 | 0.839 | 0.831 | 0.553 | ||||||||||||
| 50,000 vs. >150,000 | <0.0001 * | 0.653 | 0.643 | 0.554 | 0.558 | 0.018 * | ||||||||||||
| 50,000–100,000 vs. 100,001–150,000 | 0.040 * | 0.259 | 0.661 | 0.755 | 0.949 | 0.381 | ||||||||||||
| 50,000–100,000 vs. >150,000 | 0.001 * | 0.718 | 0.355 | 0.482 | 0.382 | 0.19 | ||||||||||||
| 100,001–150,000 vs. >150,000 | 0.137 | 0.626 | 0.599 | 0.677 | 0.448 | 0.064 | ||||||||||||
Data are the medians and quartiles of 9 point Likert scale (1 = extremely dislike, 5 = neither dislike nor like, and 9 = extremely like). * p values at significance level of 0.05.
Table 7.
Median consumption scores at occasions and comparisons of Fine Wine Instrument consumer segments for different sparkling wine styles.
Table 7.
Median consumption scores at occasions and comparisons of Fine Wine Instrument consumer segments for different sparkling wine styles.
| No Frills Median | Aspirants Median | Enthusiasts Median | ||||||||||||||||||
| Champagne | Sparkling White | Sparkling Red | Sparkling Rosé | Moscato | Prosecco | |||||||||||||
| Anniversary | 4.0 | 5.0 | 7.0 | 5.0 | 5.0 | 6.0 | 1.0 | 2.0 | 5.0 | 1.0 | 2.0 | 5.0 | 1.0 | 1.0 | 5.0 | 1.0 | 1.0 | 3.0 |
| At home with food | 1.0 | 3.0 | 5.0 | 3.0 | 4.0 | 6.0 | 1.0 | 2.0 | 5.0 | 1.0 | 2.0 | 5.0 | 1.0 | 1.0 | 5.0 | 1.0 | 1.0 | 3.0 |
| At home without food | 1.0 | 3.0 | 5.0 | 2.0 | 4.0 | 5.0 | 1.0 | 1.0 | 5.0 | 1.0 | 1.0 | 4.0 | 1.0 | 1.0 | 5.0 | 1.0 | 1.0 | 3.0 |
| Birthday | 4.0 | 5.0 | 7.0 | 5.0 | 5.0 | 6.0 | 1.0 | 2.0 | 5.0 | 1.0 | 2.0 | 5.0 | 1.0 | 2.0 | 5.0 | 1.0 | 1.0 | 3.0 |
| Breakfast | 1.0 | 2.0 | 5.0 | 1.0 | 2.0 | 5.0 | 1.0 | 1.0 | 4.0 | 1.0 | 1.0 | 4.0 | 1.0 | 1.0 | 4.0 | 1.0 | 1.0 | 2.0 |
| By yourself | 1.0 | 2.0 | 5.0 | 1.0 | 2.0 | 5.0 | 1.0 | 1.0 | 5.0 | 1.0 | 1.0 | 4.0 | 1.0 | 1.0 | 5.0 | 1.0 | 1.0 | 2.0 |
| Christmas | 5.0 | 6.0 | 7.0 | 5.0 | 5.0 | 6.0 | 1.0 | 3.0 | 5.0 | 2.0 | 3.0 | 5.0 | 2.0 | 2.0 | 5.0 | 1.0 | 1.0 | 3.0 |
| During the week | 1.0 | 3.0 | 5.0 | 2.0 | 3.0 | 5.0 | 1.0 | 1.0 | 5.0 | 1.0 | 1.0 | 5.0 | 1.0 | 1.0 | 5.0 | 1.0 | 1.0 | 3.0 |
| Funeral | 1.0 | 1.0 | 5.0 | 1.0 | 2.0 | 5.0 | 1.0 | 1.0 | 4.0 | 1.0 | 1.0 | 4.0 | 1.0 | 1.0 | 4.5 | 1.0 | 1.0 | 3.0 |
| Girl’s/boy’s night out | 1.0 | 2.0 | 6.0 | 3.0 | 3.0 | 5.5 | 1.0 | 1.0 | 5.0 | 1.0 | 1.0 | 5.0 | 1.0 | 1.0 | 4.5 | 1.0 | 1.0 | 3.0 |
| Hot weather | 1.0 | 3.0 | 5.0 | 3.0 | 5.0 | 5.5 | 1.0 | 1.0 | 5.0 | 1.0 | 2.0 | 4.0 | 1.0 | 1.0 | 5.0 | 1.0 | 1.0 | 3.0 |
| Melbourne Cup | 2.0 | 4.0 | 6.5 | 3.0 | 4.0 | 6.0 | 1.0 | 1.0 | 5.0 | 1.0 | 1.0 | 5.0 | 1.0 | 1.0 | 5.0 | 1.0 | 1.0 | 3.0 |
| New Year | 5.0 | 6.0 | 7.0 | 5.0 | 5.0 | 6.0 | 1.0 | 2.0 | 5.0 | 1.0 | 2.0 | 5.0 | 1.0 | 2.0 | 5.0 | 1.0 | 1.0 | 4.0 |
| On the weekend | 2.0 | 5.0 | 6.0 | 4.0 | 5.0 | 6.0 | 1.0 | 2.0 | 5.0 | 1.0 | 2.0 | 5.0 | 1.0 | 2.0 | 5.0 | 1.0 | 1.0 | 3.0 |
| Pub/club | 1.0 | 2.0 | 5.0 | 2.0 | 3.0 | 5.0 | 1.0 | 1.0 | 5.0 | 1.0 | 1.0 | 5.0 | 1.0 | 1.0 | 5.0 | 1.0 | 1.0 | 2.0 |
| Restaurant/café | 2.0 | 3.0 | 5.0 | 3.0 | 5.0 | 6.0 | 1.0 | 2.0 | 5.0 | 1.0 | 3.0 | 5.0 | 1.0 | 2.0 | 5.0 | 1.0 | 1.0 | 3.0 |
| Wedding | 5.0 | 6.0 | 7.0 | 5.0 | 5.0 | 6.5 | 1.0 | 2.0 | 5.0 | 1.0 | 2.0 | 5.0 | 1.0 | 1.0 | 5.0 | 1.0 | 1.0 | 3.0 |
| Work drinks | 1.0 | 3.0 | 5.5 | 2.0 | 3.0 | 5.5 | 1.0 | 1.0 | 5.0 | 1.0 | 1.0 | 5.0 | 1.0 | 1.0 | 5.0 | 1.0 | 1.0 | 3.0 |
| Mood Test P value | ||||||||||||||||||
| Champagne | Sparkling White | Sparkling Red | Sparkling Rosé | Moscato | Prosecco | |||||||||||||
| Anniversary | <0.0001 * | <0.0001 * | <0.0001 * | <0.0001 * | <0.0001 * | <0.0001 * | ||||||||||||
| At home with food | <0.0001 * | <0.0001 * | <0.0001 * | <0.0001 * | <0.0001 * | <0.0001 * | ||||||||||||
| At home without food | <0.0001 * | <0.0001 * | <0.0001 * | <0.0001 * | <0.0001 * | <0.0001 * | ||||||||||||
| Birthday | <0.0001 * | <0.0001 * | <0.0001 * | <0.0001 * | <0.0001 * | <0.0001 * | ||||||||||||
| Breakfast | <0.0001 * | <0.0001 * | <0.0001 * | <0.0001 * | <0.0001 * | <0.0001 * | ||||||||||||
| By yourself | <0.0001 * | <0.0001 * | <0.0001 * | <0.0001 * | <0.0001 * | <0.0001 * | ||||||||||||
| Christmas | <0.0001 * | <0.0001 * | <0.0001 * | <0.0001 * | <0.0001 * | <0.0001 * | ||||||||||||
| During the week | <0.0001 * | <0.0001 * | <0.0001 * | <0.0001 * | <0.0001 * | <0.0001 * | ||||||||||||
| Funeral | <0.0001 * | <0.0001 * | <0.0001 * | <0.0001 * | <0.0001 * | <0.0001 * | ||||||||||||
| Girl’s/boy’s night out | <0.0001 * | <0.0001 * | <0.0001 * | <0.0001 * | <0.0001 * | <0.0001 * | ||||||||||||
| Hot weather | <0.0001 * | <0.0001 * | <0.0001 * | <0.0001 * | <0.0001 * | <0.0001 * | ||||||||||||
| Melbourne Cup | <0.0001 * | <0.0001 * | <0.0001 * | <0.0001 * | <0.0001 * | <0.0001 * | ||||||||||||
| New Year | <0.0001 * | <0.0001 * | <0.0001 * | <0.0001 * | <0.0001 * | <0.0001 * | ||||||||||||
| On the weekend | <0.0001 * | <0.0001 * | <0.0001 * | <0.0001 * | <0.0001 * | <0.0001 * | ||||||||||||
| Pub/club | <0.0001 * | <0.0001 * | <0.0001 * | <0.0001 * | <0.0001 * | <0.0001 * | ||||||||||||
| Restaurant/café | <0.0001 * | <0.0001 * | <0.0001 * | <0.0001 * | <0.0001 * | <0.0001 * | ||||||||||||
| Wedding | <0.0001 * | <0.0001 * | <0.0001 * | <0.0001 * | <0.0001 * | <0.0001 * | ||||||||||||
| Work drinks | <0.0001 * | <0.0001 * | <0.0001 * | <0.0001 * | <0.0001 * | <0.0001 * | ||||||||||||
Data are the medians and quartiles of 9 point Likert scale (1 = never, 5 = sometimes, and 9 = always). * p values at significance level of 0.05.
Table 8.
Typical spending (AUD per bottle) of Fine Wine Instrument consumer segments on different sparkling wine styles.
Table 8.
Typical spending (AUD per bottle) of Fine Wine Instrument consumer segments on different sparkling wine styles.
| Frequency | Percentage (%) | |||||||||||||
| Champagne | Sparkling White | Sparkling Red | Sparkling Rosé | Moscato | Prosecco | ||||||||
| All Segments | Never purchase | 133 | 13.0 | 45 | 4.2 | 401 | 39.0 | 345 | 33.6 | 389 | 37.9 | 631 | 61.4 |
| <$15 | 95 | 9.3 | 304 | 28.4 | 204 | 19.9 | 274 | 26.7 | 266 | 25.9 | 134 | 13.0 | |
| $15–$29 | 358 | 34.9 | 538 | 50.2 | 313 | 30.5 | 336 | 32.7 | 287 | 27.9 | 190 | 18.5 | |
| $30–$49 | 243 | 23.7 | 119 | 11.1 | 86 | 8.4 | 60 | 5.8 | 67 | 6.5 | 57 | 5.6 | |
| $50–$79 | 142 | 13.8 | 17 | 1.6 | 20 | 1.9 | 10 | 1.0 | 13 | 1.3 | 11 | 1.1 | |
| >$80 | 56 | 5.5 | 4 | 0.4 | 3 | 0.3 | 2 | 0.2 | 5 | 0.5 | 3 | 0.3 | |
| No Frills | Never purchase | 98 | 22.2 | 31 | 7.0 | 237 | 53.7 | 177 | 40.1 | 181 | 41.0 | 282 | 64.0 |
| <$15 | 52 | 11.8 | 162 | 36.7 | 90 | 20.4 | 132 | 29.9 | 137 | 31.1 | 58 | 13.2 | |
| $15–$29 | 164 | 37.2 | 222 | 50.3 | 102 | 23.1 | 119 | 27.0 | 109 | 24.7 | 72 | 16.3 | |
| $30–$49 | 76 | 17.2 | 24 | 5.4 | 11 | 2.5 | 12 | 2.7 | 13 | 3.0 | 23 | 5.2 | |
| $50–$79 | 35 | 7.9 | 2 | 0.5 | 1 | 0.2 | 0 | 0.0 | 1 | 0.2 | 6 | 1.4 | |
| >$80 | 16 | 3.6 | 0 | 0.0 | 0 | 0.0 | 1 | 0.2 | 0 | 0.0 | 0 | 0.0 | |
| Aspirants | Never purchase | 34 | 7.0 | 14 | 2.9 | 147 | 30.3 | 154 | 31.7 | 190 | 39.1 | 290 | 59.7 |
| <$15 | 36 | 7.4 | 128 | 26.3 | 98 | 20.2 | 124 | 25.5 | 110 | 22.6 | 64 | 13.2 | |
| $15–$29 | 159 | 32.7 | 271 | 55.8 | 180 | 37.0 | 180 | 37.0 | 153 | 31.5 | 99 | 20.4 | |
| $30–$49 | 139 | 28.6 | 63 | 13.0 | 53 | 10.9 | 26 | 5.4 | 28 | 5.8 | 26 | 5.4 | |
| $50–$79 | 89 | 18.3 | 9 | 1.9 | 8 | 1.7 | 2 | 0.4 | 3 | 0.6 | 3 | 0.6 | |
| >$80 | 29 | 6.0 | 1 | 0.2 | 0 | 0.0 | 0 | 0.0 | 2 | 0.4 | 3 | 0.6 | |
| Enthusiasts | Never purchase | 1 | 1.0 | 0 | 0.0 | 17 | 17.0 | 14 | 14.0 | 18 | 18.0 | 59 | 59.0 |
| <$15 | 7 | 7.0 | 14 | 14.0 | 16 | 16.0 | 18 | 18.0 | 19 | 19.0 | 12 | 12.0 | |
| $15–$29 | 35 | 35.0 | 45 | 45.0 | 31 | 31.0 | 37 | 37.0 | 25 | 25.0 | 19 | 19.0 | |
| $30–$49 | 28 | 28.0 | 32 | 32.0 | 22 | 22.0 | 22 | 22.0 | 26 | 26.0 | 8 | 8.0 | |
| $50–$79 | 18 | 18.0 | 6 | 6.0 | 11 | 11.0 | 8 | 8.0 | 9 | 9.0 | 2 | 2.0 | |
| >$80 | 11 | 11.0 | 3 | 3.0 | 3 | 3.0 | 1 | 1.0 | 3 | 3.0 | 0 | 0.0 | |
| Fisher Exact p-Value | |||||||||||||
| Champagne | Sparkling White | Sparkling Red | Sparkling Rosé | Moscato | Prosecco | ||||||||
| Price vs. Segment Association | <0.0001 * | <0.0001 * | <0.0001 * | <0.0001 * | <0.0001 * | <0.0001 * | |||||||
*p values at significance level of 0.05.
© 2020 by the authors. Licensee MDPI, Basel, Switzerland. This article is an open access article distributed under the terms and conditions of the Creative Commons Attribution (CC BY) license (http://creativecommons.org/licenses/by/4.0/).
Share and Cite
MDPI and ACS Style
Verdonk, N.; Ristic, R.; Culbert, J.; Pearce, K.; Wilkinson, K. Understanding Australian Wine Consumers’ Preferences for Different Sparkling Wine Styles. Beverages 2020, 6, 14. https://0-doi-org.brum.beds.ac.uk/10.3390/beverages6010014
AMA Style
Verdonk N, Ristic R, Culbert J, Pearce K, Wilkinson K. Understanding Australian Wine Consumers’ Preferences for Different Sparkling Wine Styles. Beverages. 2020; 6(1):14. https://0-doi-org.brum.beds.ac.uk/10.3390/beverages6010014
Chicago/Turabian StyleVerdonk, Naomi, Renata Ristic, Julie Culbert, Karma Pearce, and Kerry Wilkinson. 2020. "Understanding Australian Wine Consumers’ Preferences for Different Sparkling Wine Styles" Beverages 6, no. 1: 14. https://0-doi-org.brum.beds.ac.uk/10.3390/beverages6010014
Note that from the first issue of 2016, this journal uses article numbers instead of page numbers. See further details here.