The State of Automated Facial Expression Analysis (AFEA) in Evaluating Consumer Packaged Beverages

Department of Food, Nutrition and Packaging Sciences, Clemson University, 105 Sikes Hall, Clemson, SC 29634, USA
*
Author to whom correspondence should be addressed.
Beverages 2020, 6(2), 27; https://0-doi-org.brum.beds.ac.uk/10.3390/beverages6020027
Submission received: 16 December 2019
/
Revised: 14 February 2020
/
Accepted: 27 March 2020
/
Published: 21 April 2020
(This article belongs to the Special Issue Wide World of Beverage Research: Reviews of Current Topics)
Abstract
:In the late 1970s, analysis of facial expressions to unveil emotional states began to grow and flourish along with new technologies and software advances. Researchers have always been able to document what consumers do, but understanding how consumers feel at a specific moment in time is an important part of the product development puzzle. Because of this, biometric testing methods have been used in numerous studies, as researchers have worked to develop a more comprehensive understanding of consumers. Despite the many articles on automated facial expression analysis (AFEA), literature is limited in regard to food and beverage studies. There are no standards to guide researchers in setting up materials, processing data, or conducting a study, and there are few, if any, compilations of the studies that have been performed to determine whether any methodologies work better than others or what trends have been found. Through a systematic Preferred Reporting Items for Systematic Reviews and Meta-Analyses (PRISMA) review, 38 articles were found that were relevant to the research goals. The authors identified AFEA study methods that have worked and those that have not been as successful and noted any trends of particular importance. Key takeaways include a listing of commercial AFEA software, experimental methods used within the PRISMA analysis, and a comprehensive explanation of the critical methods and practices of the studies analyzed. Key information was analyzed and compared to determine effects on the study outcomes. Through analyzing the various studies, suggestions and guidance for conducting and analyzing data from AFEA experiments are discussed.
1. Introduction
1.1. Neuromarketing and Its Benefits
The Consumer Packaged Goods (CPGs) industry relies on iterative tactics to develop new products and increase revenue. While CPGs generally maintain formulations and brand names for established products, they experiment with and invest significantly in new product development, advertising, and packaging. These research, development, and marketing functions are the primary mediums for A/B testing of how efforts influence revenue.
Traditional product and packaging A/B testing, such as ballots, interviews, and questionnaires are uncertain because consumers can say one thing, then do something completely different. It is difficult, maybe even impossible, to ask an individual to reflect, report, and quantitatively evaluate subconscious decisions accurately. From food and beverage sensory analysis to package and labeling appeal, traditional market research relies on the interpretations, speculations, and guesswork from the participant to the research team.
The disconnect between self-reported ballots and market performance catalyzed researchers to better understand the cognitive mechanisms and autonomic responses that govern consumer choices with the goal of improving marketing strategies [1]. The field of neuromarketing leverages biometric sensors such as eye trackers, automated facial expression analysis (AFEA), galvanic skin response (GSR), electroencephalography (EEG), and functional magnetic resonance imaging (fMRI) to measure physiological responses of the body to marketing treatments.
Biometrics in marketing are used to fill in the gaps and round out A/B market testing. Asking whether a participant noticed a claim or visual element, or how one felt at the moment of sale, relies on the participant’s memory of an event, but these questions are answered quickly, efficiently, and precisely through biometrics. Unlike traditional self-reporting methods, which rely on explicit cognitive processes, the use of biometric technologies is able to probe the nonconscious consumer response. It is believed that this nonconscious reaction is a better indicator of both marketability and the processes that occur when consumers are making product-related judgements. In real-world scenarios, it is most likely that a combination of explicit cognitive judgements and implicit autonomic and emotional reactions contribute to the overall performance and acceptability of products.
The potential for biometrics in beverage development is significant. Benefits include increased speed to market, data-driven formulations, greater investor confidence, validated market testing, and numerous competitive advantages. When competing within a global marketplace, it can only be advantageous for CPGs to leverage technologies that provide a comprehensive understanding of the consumer.
1.2. Expression and Emotion Analysis History
Questionnaires and interviews have been traditionally used to query emotion; many involved the use of scales based on standardized emotion lexicons and relied on self-reporting methodology [2]. In the late 1970s, new techniques began to emerge which allowed for a new approach in the study of emotional responses.
The Facial Action Coding System (FACS) was developed by Ekmin and Friesen. FACS methodology involved manual evaluation—frame-by-frame analysis by trained coders—of images and 44 anatomically separate and distinguishable facial movements defined as action units [3]. Other manual coding methods include facial expression coding systems (FACES), a maximally discriminative facial coding system (MAX), and the monadic phases coding system (MP) [4,5,6]. Much of the initial work surrounding facial coding has been applied in the field of clinical research. This technology has led to breakthroughs in understanding the onset of schizophrenia and understanding the emotional mechanisms of addiction [7,8].
The development of video-based automatic coding systems radically changed facial expression analysis by removing the lengthy process of manual coding and increasing accessibility to facial expression analysis. A wide selection of AFEA software packages is available commercially. Table 1 shows the software companies that are known to the authors from their past research in selecting products appropriate to their individual projects.
1.3. Relationship between Emotion and Facial Expression
Both the experience and the expression of emotion are essential to human survival and social interactions. Humans process the world through logic and emotion. The evolutionary benefits of emotion enable snap judgements of stimuli based on previous experiences and feelings. Emotion is defined as a short-lived response to stimuli, having the potential to reinforce actions or feelings. Mood, on the other hand, is a prolonged state influenced by emotions [24]. There are six basic emotions: happiness, surprise, scared (fear), sadness, disgust, and anger [25]. Emotional states can be classified as positive or negative: happiness is positive, surprise can be either positive or negative, and the remaining emotions are negative [26]. Participant emotion can also exist in a neutral state. The reinforcement potential is particularly important when thinking about marketing and product development considerations.
Emotional processes can be implicit (subconscious and autonomic) or explicit (conscious and influenced by logic and higher-order thinking) [2]. Facial expressions are a means of reflexive nonverbal communication. Similar to the perceived emotional experience, emotional responses are partially reflexive, as they can be influenced by conscious modification. Using taste aversion as an example, it is easy to see how these systems serve us. Poisonous compounds tend to produce strong, bitter flavors. For humans, this negative experience, coupled with the negative emotional response elicited when tasting the bitter flavor, reinforces that they should avoid certain foods; the expression of disgust in response to the bitter taste also communicates this experience to others. The reverse can be seen for reinforcement behaviors associated with sweet foods [27,28].
1.4. Targeting Specific Source of Emotion
Food-based emotion is more complicated than a physical reaction to a basic taste, and food stimuli can elicit a number of emotional responses. Desmet and Schifferstein [29] outline five sources of food emotion that are summarized in Table 2.
Probing these distinct emotional responses requires different experimental designs [2,29]. Querying sensory attributes can be achieved with the AFEA of a general population, while other designs involve comparison of responses between distinct populations. Probing anticipated consequences can be achieved by selecting a very health-conscious population, keeping health consequences on the participants’ minds during experimentation, and/or by explicit methods such as asking questions that directly address the source of food emotion.
Through well-thought-out experimental design, experimenters can effectively target the desired source of emotion. Difficulties arise as most foods elicit mildly positive emotions in people and this response seems to be unrelated to an individual’s preferences for the food [30]. The role of the experimenter is to facilitate proper stimuli/response pairings and prevent extraneous emotional responses from participants during the course of the study. In the following sections, various experimental designs will be examined, along with limitations and considerations for targeting the desired stimuli/response pairing.
2. Materials and Methods
2.1. Research Goals
In the present systematic literature review, the following research goals were investigated:
- What software is currently being used?
- What population sizes are researchers studying?
- How are researchers developing experimental designs and what are their trends?
- Which methodologies have proven effective?
- Are there any general trends in results?
- How can AFEA be employed in product development settings?
2.2. PRISMA Systematic Literature Review
The procedures for researching the stated goals followed the Preferred Reporting Items for Systematic Reviews and Meta-Analyses (PRISMA) guidelines. PRISMA guidelines provide a multi-industry standard for conducting research, helping authors provide structure to the way they find, review, and analyze literature, and help to improve the quality of reporting of systematic reviews by helping to eliminate or reduce publication bias. The steps for conducting a PRISMA-type review include (1) identifying resources to be reviewed; (2) screening the resources by applying relevant search criteria and eliminating duplicates; (3) assessing the abstracts to determine which of the remaining resources should be included or excluded; and, (4) conducting a full review and analysis of the remaining resources [31].
The Clemson University Library Database was queried for articles using the search string “facial expression emotion”. Search filters were applied to limit results to only journal articles published between 2009 and 2019. Eligibility for inclusion was checked by reviewing and excluding papers that were duplicates or that did not pertain to food and beverage studies, such as medical studies, industrial reports, advertising research, and animal studies; articles about manual FACS coding were also eliminated, as our review concerns automated facial coding. Included articles were further filtered using the search terms: “AFEA food/beverage studies”, “software validation studies”, and “review articles”. A total of 38 articles were identified using this process; the flow chart in Figure 1 illustrates the screening process used to identify the 38 articles reviewed in this article.
3. Results and Discussion
3.1. Systematic Literature Review
The PRISMA review resulted in 38 expression analysis studies published between 2009 and 2019 on the subject of AFEA, food, and packaging (Figure 2). There has been an upward trend in annual publications over the ten-year period.
Quantitative data, such as mean age, sample size, and number of excluded participants, was extracted from the reviewed articles. The authors also made note of countries of origin, the different methodologies, and the various software programs that were used in the studies. Methods, results, and discussion for all studies have been qualitatively analyzed in detail. A summary of the information gathered and analyzed has been included in Appendix A.
The studies reviewed included publications in 18 different journals, one master’s thesis, and one conference paper, as noted in Table 3. They covered a wide range of industries—all of which use biometric screening in some capacity to conduct their research.
3.2. Study Objectives
Relating to beverage development, a number of product development objectives can be queried through AFEA-based techniques. Study objectives include differentiation of samples by expressed emotions, assessing ingredient differences, assessing food spoilage, assessing how package design influences purchasing behavior, determining how different cultures respond to different packaging elements, determining the relationship between taste, autonomic nervous system (ANS) responses, and emotions, analyzing the response of various sweeteners, examining how food composition influences the relationship between consumption and food emotion, or determining how facial reactions respond to basic tastes [26,27,32,33,34,35,36,37,38,39,40]. While techniques using AFEA to assess product development are still in their infancy, researchers have built a foundation for how best to employ these technologies to achieve a wide range of product development-related research goals.
3.3. Participants
In the studies, all participants were aware they were taking part in a study and none of the studies employed passive concealed surveillance. The data ranged from a minimum of six to a maximum of 505 participants; two outliers existed at 258 and 505 (Figure 3). The mean number of participants in the various trials was 68.7, with a standard deviation of 81.2. The median was 50 and the interquartile range was 30–75.75 participants. The participants’ ages ranged from 6 to 70, with the average age being 28.7. Most of the participants were recruited from university pools and consisted of students, faculty, staff, and community members; consumer populations have also been used in studies.
3.4. Country of Origin
Experiments were conducted in institutions around the world, though the majority of studies took place in the US and the Netherlands (Figure 4). Country of origin is meaningful as cross-cultural differences in emotional responses have been observed by the authors and in the literature. Both in-house observations and literature reports show that the population must be taken into consideration when interpreting the results of the study; results from one population should not be applied to all populations [32].
3.5. Implicit vs. Explicit Methodology
Implicit methodologies require the observation of a natural response to stimuli; they are thought to have features of autonomic processes and do not rely on higher-order cognitive reasoning (e.g., participants observe a stimulus and their natural response is recorded). On the other hand, explicit processes require intentionality and are reflective of higher-order cognitive processes (e.g., participants are asked to produce a facial expression that represents like or dislike of the sample). Figure 5 shows how often the various studies employed the explicit and implicit methodologies in the reviewed articles.
Implicit and explicit processes yield different results, as they trigger different cognitive processes [33]. Compared to explicit processes, implicit measurements are often better indicators of dislike [41,42,43]. It is thought that implicit measurements may be a better representation of subconscious processes. However, if the goal is querying a more abstract emotion, such as anticipated consequences, then explicit measurements may be a better choice. If investigating the perception of the health impact of various beverages, an experimenter could instruct, “Thinking about the impact on health, make a facial expression that represents your feelings about the sample”. In another scenario, if the stimuli and response are separated by a considerable amount of time, experimenters would want to choose an explicit route; in this case, researchers would be probing memories and impressions of the stimuli and not the direct response. Finally, if the product being evaluated is highly accepted, then explicit methodology would be useful [44], as positive emotions are better queried through explicit methodology [33].
3.6. Stimuli Presentation
How participants interact with a stimulus is another experimental design consideration. Participants could be asked to smell, consume, or observe a sample. Figure 6 shows the breakdown of stimuli across the 38 studies related to AFEA, beverages, and/or packaging.
A study involving 26 female participants showed that an unpleasant fish odor influenced a number of autonomic nervous system (ANS) responses and resulted in disgusted and angry expressions (p < 0.05) [45]. The consumption of solid food has been tested in a few studies, but is subject to a number of limitations, mainly due to the action of chewing interfering with the software’s emotion coding processes [30,46,47].
The majority of the referenced literature involves the consumption of beverages [48]. Unlike solid samples, no chewing is required. Liquid samples can be quickly consumed and removed from the line of sight between the camera and the face, capturing the reflexive responses to consumption. Chewing disrupts the software’s emotion coding processes and results in inconclusive or mis-identified emotions. Various beverages could be differentiated through both explicit and implicit responses of participants [33,34,49]. Aroma of samples can also be queried through AFEA [50,51].
Visual inspection of stimuli is also a common strategy, especially when it comes to assessing the appearance of food or packaging. Visual inspection can occur by having a participant inspect a physical sample or by evaluating images of a sample [26,32,35,46]. Minor changes in package design iterations can be compared through AFEA technologies. Vergura et al. presented an experimental design where the location of a subject was placed in the foreground and background for two packages, and the emotional response imparted on the consumer was evaluated by AFEA in response to a series of images flashed on a monitor [26]. Rather than a “side-by-side” comparison, package design elements can be altered and presented in a series of images containing various combinations of the elements and statistical models can be used to evaluate the impact of each design element. In a study by Pentus et al., the influence of the product name, package text, font size, slogan, portion, nutritional information, and amount of sugar were simultaneously evaluated through evaluation of 19 combinations of the elements. Rather than focusing on all emotions, the analysis focused on happy and engagement responses. A conjoint analysis technique was used to find the impact of the conditions on the population [35]. JMP statistical software’s “design of experiment” function could be used to carry out a similar task. It is both an effective and approachable tool for conducting these analyses, in which a handful of optimal combinations are selected to allow for analysis of the impact of multiple factors.
Most of the studies reviewed involve presentation of the stimuli in a single event. Considering that consumption does not occur in a single bite or sip, researchers set out to determine the emotional response associated with a multiple sip temporal experimental design in which participants consumed a beverage over time through multiple sips, leveraging AFEA across the consumption period versus a single consumption event [38]. Another study focusing on a temporal design revealed that repeated bites of the same food show an initial peak in happy emotions, with each successive bite showing a less intense response. The decrease is less if the next bite has a different flavor [52]. A temporal experimental design may be a more realistic model for evaluating beverages than a single consumption event and will certainly provide a broader set of data for analysis, yet literature is limited. It should be noted that a temporal experimental design should not be confused with the temporal statistical analysis described below.
3.7. Sensory Environment Setup
Researchers leveraging AFEA must give careful attention to the environmental setup. The authors have determined that a backdrop of a dark, solid color behind the participant is ideal. Additional lighting, such as a ring light around the camera, that illuminates the participant’s face and removes all shadows, produced favorable results. Additional forward-facing lights may be required to remove facial shadows that result from overhead lighting.
Placing participant instructions at or near camera height was found to be ideal, as looking down to read or observe information resulted in mis-identified emotions. It was found that printing clear, concise instructions for the participants was more favorable than oral instructions, as participants often smiled or laughed after being orally instructed to complete a task. This reaction did not occur when participants read instructions for themselves.
The authors found through various experiments that elevating the height of the table where treatments are placed reduced the chance of the participant looking down and triggering false emotion readings. Adjusting the camera to be centered on each participant’s face produced higher quality results. Alternative setups (such as employment of an Observer XT camera with a dome) can allow for designs where the participant isn’t staring directly at the camera.
The average person does not eat food in controlled sensory environments, and it has been shown that the environmental context in which people eat food has an influence on the emotions associated with the food. This concept is referred to as evoked context [2,53]. Researchers had 18 participants eat food samples on ten consecutive days. The testing location was alternated daily: half of the AFEA occurred at the participants’ homes on individual laptop webcams, and half the analyses occurred in a controlled sensory laboratory. The ballots for both the lab and self-reporting settings contained questions to allow researchers to differentiate between food samples in both settings. AFEA was able to differentiate between environments; in contrast, self-reported ballot results were not able to differentiate between the two testing environments [53]. Another study reported using images of breakfast foods to evoke emotions in participants taking part in the study via webcam [54]. These techniques can be employed with relative ease, allowing for large and diverse samples. More research needs to be performed to refine these methods.
AFEA is not often performed in isolation, rather it is one of a number of tools used to glean insights within an experiment. iMotions is a software platform that enables researchers to use a variety of biometric devices along with qualitative and quantitative measures to assess behavioral impacts of treatments in a single study. The authors experimented with combining AFEA and eye tracking in a dynamic shopping environment, which required developing an apparatus to secure and extend a camera while wearing eye-tracking glasses. This setup is not ideal, since glasses, hair, or any other object that obscures the face may influence AFEA performance. Experiments which combine AFEA with less intrusive methods, such as interviews, GSR, ANS, surveys, and questionnaires, work seamlessly within multi-sensor platforms such as iMotions.
3.8. Procedural Nature
Beyond examining experimental design considerations (described above), investigating the actual procedural nature of selected studies shines light on how AFEA can be used in a number of different settings. The details of how participants and samples are managed in the context of experimental design is essential in understanding and implementing these analyses.
The research by Danner et al. examined explicit vs. implicit methodology when evaluating various orange juice samples. The experiment took place in a controlled sensory lab. For the explicit scenario, participants sat facing a webcam and consumed the entire sample cup containing 30 mL of juice, quickly dropping the cup out of the line of sight between the face and the camera. Next, participants reflected for 20 s, gave a hand signal to denote the start of measurements, made a face that “best represented their liking of the sample”, and then rated their experience on a 9-point hedonic scale. There was no time limit set for the duration of the participants’ facial expressions [33].
The implicit scenario was very similar: the participants tasted the sample and looked at the camera for 20 s thinking about “how much the sample appealed to them”. After 20 s of implicit facial expression capture, the participants filled out a 9-point hedonic scale to assess self-reported liking. Analysis relied on differentiation of experimental samples within groups, and differences in responses between groups. Randomization and other techniques to remove sensory bias were not discussed in the experimental design setup [33].
De Wijk et al. also analyzed participant response to consuming beverages employing AFEA, ANS analyses, and a 10-point rating scale. The experiment took place in a psychological laboratory located in the Restaurant of the Future in the Netherlands. Participants were tethered to biometric recorders for ANS measurement. In a controlled sensory laboratory, participants directly faced the camera and monitor. The monitor was used to communicate instructions to the participant. Drinks were presented in a randomized order and provided to participants in a clear 250 mL glass with a straw. Participants were guided through a practice trial before beginning the experiment. The straw was used to reduce motor artifacts that obscure facial expression capture [55].
During testing, participants focused on a monitor that had a camera mounted directly behind it. The camera was arranged to record the participants’ faces. The participants were presented with a picture of a drink on the monitor for ten seconds, after which, they put their mouth on the straw without drinking for six seconds. The participants then had ten seconds to drink the sample through the straw. Following consumption, participants had eleven seconds to rate how much they liked the sample on a 10-point hedonic scale. When they were done, the researcher removed the cup and presented the next beverage [55]. While the participant handling in this paper is both novel and effective, rating on the 10-point scale is problematic, as the scale is unbalanced (i.e., there is no middle answer). In sensory research, 9-point scales are preferred [55].
Kostyra et al. employed a novel multi-faceted approach to evaluating solid food (various smoked ham samples). The study consisted of four trials: (1) a quantitative descriptive analysis (QDA) with trained panelists, (2) a consumer test employing a 9-point hedonic scale, (3) an AFEA study, and (4) an eye-tracking study. Each stage of the study was independent, and the same 30 consumers were used for stages 2, 3, and 4, though stage 4 also had 10 additional participants. Sensory evaluation was conducted in a sensory laboratory which met ISO requirements [46].
In the QDA, trained participants tasted the ham samples and inspected photographs. In the eye-tracking study, participants inspected photos of the ham samples. In the AFEA study, participants tasted the ham samples. Prior to the AFEA study, participants reviewed the procedure in a training session. Ham samples were presented in a random order and presented to consumers in a container labeled with a randomized 3-digit code. Participants consumed the ham sample and, ten seconds after swallowing, gave a start signal with their hand. While looking directly at the camera, participants presented an explicit, intentional, facial expression indicative of their liking of the sample. Since solid samples were used, the 10 s interval after eating was necessary to avoid motor artifacts from chewing that interfere with the emotion capture process; since AFEA could not be conducted at the moment of tasting, explicit measurements were a necessity [46].
Vergura et al. published a novel methodology that allowed for analyzing the emotional impact of various packaging design elements, specifically the spatial orientation of the object in the foreground or background of the package. Participants received instructions prior to taking part in the study. They sat directly in front of a computer with a mounted webcam used to record their responses. A video was presented on the screen showing the experimental image and other random pictures (landscapes, foods, and animals). Each participant was presented with 17 images, each lasting three seconds. The images of the package were spaced 12 s apart in the video. To ensure participants kept their attention throughout the duration of the experiment, a red dot was presented at the center of the screen at two points during the video. When participants observed the red dot, they were instructed to say “red”. Four 60 s videos were presented in total, with each video containing a unique experimental condition. After AFEA, the participants received a picture of the package and responded to a questionnaire querying demographic information and purchase intention [26].
Ploom et al. set out to determine how responses to package design elements varied between Northern Europeans and Northeast Asian consumers. The elements tested were three variations of color and three picture locations. The researchers employed AFEA, eye tracking, and conjoint analysis. Nine biscuit packages were designed with various combinations of the experimental design factors. In a testing room adapted for the purposes of this study, a Tobii X2-60 computer screen eye tracker and a webcam were setup to simultaneously record eye-tracking data and video for AFEA. Data was collected as participants observed various package designs appearing on the screen for five seconds. Beyond showing differences in responses across populations, the researchers were able to use both methods in tandem, providing a novel approach which allows for in-depth package design analysis [32]. In much of the literature, eye tracking and AFEA are completed in different study stages.
3.9. Suggestions for Successful Implementation
Through this literature review, the following trends have emerged on how to best carry out AFEA experiments:
- Crist et al. recommends between 10 and 50 participants for a trial [48]; however, Kostrya et al. refers to a sample size of 30 as small [46]. A group of ten participants does not have much statistical power. The interquartile range for the number of participants in study was 30–75 participants (Figure 3), which seems to be an appropriate participant range in studies.
- Before participants begin, the study protocol should be thoroughly reviewed [48].
- Studies should occur in an isolated sensory booth to minimize distractions [48].
- Only one participant should be in the sensory booth during experimentation [48].
- The camera and a monitor presenting the instructions should be at face level to keep participants’ focus on the camera [48].
- The height, distance, and angle of the camera should be adjustable to keep the participant’s face and head in the middle of the screen [57].
- Lighting is essential—100% overhead daylight lighting with a diffuse frontal light helps remove shadows, which can obscure the image [48].
- If liquid samples are used, the participant should drink the entire sample, quickly dropping the cup below their face. Video analysis should begin post-consumption, which is the moment the cup is not obscuring the face [48].
- Participants should avoid sudden movements and should not look away from the camera during the post-consumption period [48].
- Continuous calibration should be used during analysis [48].
3.10. Data Management and Analysis
Most of the AFEA software relies on the techniques of the FACS, and a number of strategies have been employed to analyze the vast amount of data produced. There are 44 AUs—each of which can be measured on a 0–1 intensity scale. The majority of video capture hardware referenced within the literature records at 30 Hz. The majority of AFEA software processes each video frame for each AU. Therefore, a five-second time frame could generate 6600 unique data points per participant and condition, and, assuming a two-condition experimental design, this number potentially increases to 13,200. In a study involving participants, researchers may manage 792,000 data points for AFEA alone. Often, multiple experimental groups are compared [35,57]. Temporal experimental designs operate under the assumption that food/packaging stimuli are not a single event experience and a given experiment will have a number of stimuli per condition, further increasing the amount of data points [38]. In most cases, the results of the AFEA are used in a regression model, adding in ANS data, ballot data, and/or questionnaire responses.
When managing the output of AFEA software, various methods are employed in the literature to make sense of the large spread of data produced. The AUs can be looked at individually; however, most AFEA software platforms can simplify the data and calculate a 0–1 intensity for the six basic emotions, neutral, valence (−1 to +1 scale), and attention/engagement for each timepoint. Valence relates to the positivity or negativity of the expressed emotional state; values greater than zero reflect positive states, and values less than zero refer to negative states. How AFEA software calibrates and processes data from AUs is not always disclosed. Each software package uses its own proprietary programming to process the recorded emotions.
Due to the nature of AFEA software and the large variability of results within datasets, a significant amount of background noise is produced [48]. Increasing the sample size is one effective way to improve statistical power; however, participants show biases toward some emotions over others. To correct for this, it is recommended that a “continuous calibration” setting be enabled when using AFEA software [48]. In a study comparing calibration modes, variability was lowered upon enabling continuous calibration [48]. In FaceReader software packages, continuous calibration can be applied afterward, during analysis [58]. Before analysis, videos should be screened for analysis failure and exclusions should be made based on failing frames or failing participants. Strong data analysis methods are essential in increasing the signal-to-noise ratio in a way that identifies significant differences in populations. A data management plan should be outlined during the experimental design phase.
Researchers have used manual baseline calibration with a neutral response in which the mean intensity response to an experimental sample was subtracted from the mean intensity response to a water sample. Difference tests were used to determine whether the response to the sample was different than the response to water to ensure the emotion expressed was not an artifact of testing. This was also thought to correct for baseline differences in neutral expressions for the various participants. This approach is novel and warrants further examination; however, in the current study, no statistical differences could be observed between samples, and very small, if any, correlations were observed between samples and self-reported ballots [39].
Static methods characterizing facial expressions based on intensity (a 0–1 scale) are most commonly used. The max and mean intensity over the testing period for each category are the most common metrics used in analysis. It has been observed that using max intensities (as opposed to mean intensities) in regression models resulted in stronger correlations with self-reported ballots [33,34,50]. The area under the curve method uses the integral of signal intensity versus time as the metric for comparison. The area under the curve analysis has had success in some studies; however, unexpected results were noted in a doctoral dissertation from E. A. Arnade when the area under the curve data did not show the same significant differences picked up by the mean intensity analysis [38,40,49].
The mean relative percent time, or overall emotional state, looks at time and requires experimenters to find the relative percent time spent in each emotional state for the analysis time frame. When looking at mean relative percent time, longer time frames resulted in lower signal-to-noise ratios. The data became diluted with more neutral responses and more extraneous emotion responses not associated with the stimuli [49,57]. The time frame chosen for analysis influenced the outcome of the intensity analysis [57].
It has been suggested that intensity methods were more useful when dealing with sample consumption, but mean percent time data may have applications in scenarios such as investigating the emotional responses of video marketing [24]. Analyzing differences in variances has also been used in studies [32]. Comparing variance between experimental conditions may be a useful tool to promote a product with a consistent desired response among a population.
Another consideration influencing data output was the time frame used for analysis-impacted results [38,49]. A standard method of defining the time frame of analysis has not been established. It was observed that expressions adhere to the pattern of onset, peak, and fade, which lasts approximately 500–4000 ms after the stimulus event [49]. Another study showed that disgust and sad intensity scores peaked between 1000 and 1500 ms. Happiness peaks start to emerge after 1250 ms. Angry and happy reached max intensities between 3000 and 3500 ms. However, the later happy peak is often correlated with negative valences. Between 1250 and 2000 ms showed the highest correlation between valence and intensity and self-reported results, and expression analysis showed higher coefficients of correlation at 2000 ms [50]. Using only maximum or average values may not accurately represent the emotional profile of participants during testing, and, as a result, more studies have started to use time-series data to fully reflect emotional changes [47,51,60,61].
Temporal statistical analysis methods have also been used in literature to better characterize how facial expressions change over time when compared to static methods. When averaging a value, such as signal amplitudes or signal means over a given time frame, lower signal-to-noise ratios occur, as important signal amplitudes can be short lived. Frequency parameters and dynamic parameters have been employed in tandem with static measurements to better understand the characterization of an AFEA dataset. A frequency parameter counts the highest amplitude for every time point, essentially a count of how many times a particular emotion had the highest amplitude at a given time. A dynamic parameter can be thought of as a weighted max intensity value and takes into account amplitudes and frequencies of all signals over time. Researchers determined that the dynamic parameter resulted in a higher correlation, compared to the frequency parameter, with the self-reported ballot scores. It was recommended that both the static max intensity and the dynamic parameter be utilized for analyzing AFEA datasets [57].
Once data is managed and characterized, it is analyzed and compared. To determine differences between groups, an analysis of variance (ANOVA) is performed. Significant difference tests are chosen based on the sample size and sample distribution being evaluated (e.g., Tukey HSD, student t-test, Mann–Whitney U-test).
ANOVA and difference tests can be used to show differences in expressed emotion between groups, but stronger conclusions can be gleaned when AFEA is used in tandem with other methods such as ballots, eye tracking, and ANS data. If looking at multiple Y-responses, a multi-variate analysis of variance (MANOVA) should be employed. Coefficients of determination are often used to show how AFEA results compare with a self-reported 9-point hedonic scale data and ANS responses [33,34]. Coefficients of correlation (p < 0.05) have also been used to show relationships with other methods [39,46]. Regressions and multi-variate models can be used to determine the relationship between expression of different emotions, traditional self-reporting data, and other ANS data. When results for multiple experimental methods align, researchers can possess more confidence regarding data interpretation. When trying to determine the clustering of variability within the data, principal component analyses are a useful tool.
This technology is still evolving, and stronger data analysis methods are needed. Rather than looking at the differences in single emotions, responses may best be characterized by how all the emotions are expressed over time. Researchers noted this as a current limitation in AFEA experimental designs [54]. Fuentes et al. discusses the potential role of machine learning in creating complex models to better characterize AFEA data [62].
3.11. Differentiation of Stimuli by Expressed Emotion
Differences between results obtained explicitly and implicitly were noted in the studies reviewed. Both of these methods can be used to differentiate samples, but different methods generate variations in responses. Danner et al. used both explicit and implicit methodologies to determine whether a number of juices could be differentiated by AFEA and correlated to a 9-point scale [32,33]. In the explicit scenario, differentiation of liked, disliked, and neutral samples could be detected. Linear regression produced the following coefficients of determination for angry, disgusted, and happy: 0.83, 0.74, and 0.63, respectively. The implicit scenario gave higher intensity values for negative emotions and could only differentiate between the most disliked samples and the rest. Linear regression of implicit data produced the following coefficients of determination for angry, disgusted, and happy: 0.88, 0.88, and 0.03, respectively [34]. Linear regression data gives an indication of how well the results align with the self-reported ballots. While both explicit and implicit experimental designs could be used for indicators of taste preference, implicit measurements are more apt to deal with dislike; these observations have been confirmed in various other studies [34,35,43]. The implicit scenario’s higher intensity values for negative emotions was supported by other studies [34,38]. When researchers were evaluating a number of juices through explicit and implicit methods, differentiation could be achieved through both methods used. It should be noted that the order slightly differed from self-reported data. The authors hypothesized that AFEA and ANS data may be a better indicator of market performance and this discrepancy warrants further investigation [34].
Other researchers noted that disgust was the most useful emotion for differentiation of samples [57]. Often neutral and surprise will indicate positive valence in implicit studies. When taking implicit measurements to evaluate differences in response to chocolate milk and unflavored milk, researchers noted that surprised values correlated stronger to liked samples and scared responses were correlated with disliked samples [46]. One study used the reduction in negative responses as an indicator of positive preference [63]. Studies on odors and images have shown that arousal/attention may be more important than valence for the characterization of samples by AFEA [51,64].
The experiment from Pentus et al., in which seven minor packaging elements were analyzed in a single experimental design, sheds light on the importance of various packaging elements and how that relates to the consumer. Differences in happy emotions and engagement differed for presentation of various designs. The various elements were ranked by percentage of importance through AFEA and conjoint analysis. Sugar or carbohydrate information on the nutrition label ranked first with 25.663% importance, followed closely by slogan or no slogan with 25.231%. The name of the product was ranked third, with 17.954%, which was surprising as name and branding is often thought of as a central element of the package. The rankings of the final elements are as follows: size of portion on nutritional label (10.513%); size of juice percentage font (8.568%); energy or preservatives (or no text) on info label (7.417%); and made from concentrated apple juice (or no text) (4.565%) [35]. When it comes to visuals, Yu et al. studied how stylistic differences of graphic images of dragons influenced AFEA results. Significant trends in happiness, surprise, and disgust were observed across the experimental images. Researchers noted that while simple elements and sharp edges showed higher attention and valence, higher valence was observed for pictorial images as opposed to computer-generated images [64]. A study on chocolate packaging did not find any significant differences in AFEA data for the experimental package images [65].
3.12. Population Influence
The population in question often has an influence on the observed results. The population influence is nuanced and based on the relationship between the stimuli and the given demographic. When using AFEA in product development, the target demographic should be reflected in experimental design. In some studies, gender does not influence the results, whereas gender was seen to have an influence in others. In the two studies by Danner et al., where participants drank different juices, gender differences were not present in either the explicit or implicit scenario [33,34]. When yogurt was tested along with fruit juices, gender differences were noted [55]. In a study evaluating red wine extracts, gender differences were also observed. This observation was present in both self-reported and AFEA results, suggesting that the difference was due to gendered trends in liking and not due to differences in emotional expression between the genders [38]. Another study observed and discussed gender differences during wine consumption, with both EEG and AFEA results showing stronger emotional responses from female participants. Some researchers recommend specific sample demographics matched to specific categories, such as female sample pools for wine evaluation [56].
Body mass index (BMI) also has an influence on the emotional response to consumption. Participants were divided based on BMI; high BMI was >20 and low BMI was <20. When participants were given bitter liquids, those in the high BMI group showed more disgust responses (p = 0.07). Results from self-reported ballots did not detect differences in liking across the BMI. While conscious self-reported methods could not detect a difference, AFEA was able to shed light on varying physiological responses between the two groups. This variability in AFEA response across BMI could help explain food choice and eating behavior; this BMI influence should also be considered during experimental design as it influences AFEA analysis [40]. In another study, participants with depression had significantly different AFEA responses when exposed to food, which led the researchers to the conclusion that emotional states influence food preferences and emotional responses to food [66]. These studies demonstrate that mental and physical characteristics of populations may have an influence on the observed responses.
Individual preferences in taste can also influence AFEA results. When studying the responses of bitter food, participants fell into two categories: “bitter likers” and “bitter dislikers”. Bitter likers showed less adverse emotional responses and gave higher self-reported scores [67]. While conducting their own studies, the authors noted that participant responses for sweet and bitter solutions were highly variable and based on personal preferences.
The perception of food and packaging differs across cultures. When developing products for international markets, tailoring product development is not a one-size-fits-all approach, and the desired demographic must be taken into account. In regard to food, it is thought that cross-cultural differences are driven by familiarity [68]. When using AFEA to look at salt level preference, US participants showed a significant positive response to increasing amounts of salt [69]. Another study looking into responses to chocolate stimuli also observed cultural differences between western and Asian participants [70].
When comparing European and Asian populations in AFEA analysis of packaging, no difference in facial expression was observed in regard to image location, even though eye-tracking showed a difference. Color showed statistically significant differences in expressions between the two populations. Yellow had more positive responses for Northern Europeans (p = 0.033) and blue was more positive for Northeast Asians (p = 0.049). Color has different meanings from culture to culture and could be the driver between the differing results [32]. These findings provide a framework for practical and strategic decision making when designing packages for distinct markets.
3.13. Expression Bias, Interpretation, and Calibration
Participant expression bias has also been noted in studies. Participants exhibiting a “poker face” show neither positive nor negative facial expression in response to the sample and the data shows low intensities with predominantly neutral expressions [46]. When data from groups that include participants exhibiting a “poker face” is analyzed, the resulting mean signal may be diminished. Clemson researchers observed that many participants smile excessively when being video recorded. Furthermore, individual physiognomy and resting facial expression influences the emotion coding process [71]. Calibration aids in reducing the influence of individual bias.
Two studies by Danner et al. showed that 15–25% of participants exhibited a “poker face” during analysis [33,34]. Juodeikiene also mentions poker face but did not determine the number of participants exhibiting this lack of expression. The “poker face” phenomenon, therefore, can create more variability in the data, decreasing the signal-to-noise ratio [30]. It has also been observed that many participants will smile approximately 3000 ms after an unpleasant stimulus.
Crist et al. attribute this phenomenon to the Social Display Rule, which describes how expression is governed by societal expectations. Smile responses can be evoked by a number of situations and are not always correlated with self-reported happy feelings [48]. True happiness readings are less intense and seem to be detected earlier, between 1250 and 2000 ms [50]. Understanding the patterns of emotional expression allows researchers to determine the meaning behind signals and allow for accurate interpretation of results. The Social Display Rule can also help guide experimental setup. The authors have witnessed that when researchers are facing participants, significantly more smiling was observed.
AFEA has many potential benefits to beverage companies, but there are limitations within the technology, including calibration and proprietary algorithms. Calibration is an important step in A/B testing to establish a baseline of comparison. It is not always clear how various software providers calibrate, when calibration occurs, and the frequency of calibration. This limitation overlaps with the proprietary nature of AFEA software companies. How software operates is a competitive differentiator, and it is not always apparent how emotions are grouped from facial analysis across software vendors.
3.14. Data Exclusion
Many studies have excluded participant data due to a number of issues. For the purposes of comparison, it should be noted that 11 of the 38 papers (28.9%) reviewed excluded participants and one paper excluded problematic video frames (Figure 7). Of the papers that excluded participants, the average percentage of participants excluded was 28.07%, a standard deviation of 16.74%, a median of 22.73%, a range of 6.67–56.25%, and an interquartile range of 18.43–40.39% (Figure 8).
The inability of facial analysis software to recognize a face due to facial occlusion is the most common cause of a failed analysis. Participants’ glasses, hairstyles, facial hair, hands, cups, and inappropriate postures (such as resting the chin in the hand) can obscure the face [33]. Participants’ head and body movements also influence data collection [33,38]. When dealing with solid food, the act of chewing will interfere with the image capture, and analysis must be performed after swallowing has occurred [46]. In preliminary experiments conducted by the present authors, it was noted that interaction between the experimenter and the participant would cause the participant to smile. It was also observed that when a study treatment was located below the camera, forcing the participant to look downwards, AFEA software recorded negative emotions where there were none.
In some cases, insignificant data was due to some participants forgetting the experimental process or forgetting to follow the instructions [33,36,46]. This kind of error also occurred in more complicated experimental schemes. For example, participants might have forgotten to provide hand signals before making intentional facial expressions [33]. One article mentioned the influence of lighting problems (such as overexposure) causing the data to fail [49]. More video acquisition problems will occur when participants are asked to record themselves. Wijk et al. conducted an experiment taking place in participants’ homes, and more than half (18/32) of the participants’ submitted videos could not be used due to poor video quality and network problems [53].
3.15. Software Influence
Differences in the algorithms used by various software packages may have an influence on the data. Figure 9 shows the distribution of software used across the 38 AFEA studies. Most studies (83.3%) utilized FaceReader software, with Face SDK, iMotions, Observer, and Project Oxford utilized in one study each.
FaceReader has been widely used in academic and nonacademic fields since its release in 2007 [72]. It was one of the first AFEA software programs to enter the market, and there are currently more than 1250 papers citing the software [73]. Three validation studies on FaceReader showed that the software was accurate at predicting intended emotion 79–89% of the time. Validation studies in the literature may give researchers confidence in FaceReader over other software [71,74].
A study validating and comparing measurements for iMotions and Affectiva noted large variations in accuracy across emotions and databases. In the study, iMotions was more accurate than Affectiva for predicting standardized pictures of facial expressions. For natural facial expressions, Affectiva performed better [75]. Bias may occur based on the software package used. More validation studies are needed to determine how different platforms compare.
4. Conclusions
The intent of this article is to summarize the state of automated facial expression analysis (AFEA) as it relates to food and beverages across recent and relevant peer-reviewed publications. Our research included 38 articles published over a span of ten years related to AFEA beverages and/or packaging. Each study had its own unique research goal, but each one still had to define its methodology and procedures. The studies took place around the world, and, while country of origin does have an impact on study results, the decision as to which methodology to use was still an important one. Each participant had to interact with a stimulus by smelling it, consuming it, or observing it, and the researchers had to decide whether they wanted to study natural responses (implicit) or reflective responses (explicit).
For the environment of the studies, locations ranged from controlled labs to participants’ homes. It was found that the controlled labs produced the most reliable results as the researchers were able to control lighting, stimulus placement, and other various factors, but that allowing portions of studies to be conducted in participants’ homes provided greater insight into how consumers react with stimuli over time.
There are clear benefits to using AFEA in product and package development, specifically in developing a more comprehensive understanding of the consumer. AFEA works well in tandem with many analysis methods and enriches scientific reporting. Many of the researchers who performed comparative analysis of AFEA against traditional ballots found significant positive correlations and unveiled insights that would not have been observable with traditional methods alone.
The ability to consume beverages quicker than food, without the need for chewing, positions beverages as an ideal medium for AFEA testing. AFEA also provides the opportunity to observe changes in emotion over a period of consumption (temporal design), which would be redundant and impractical for a traditional ballot study.
Significant findings have been observed through AFEA, though the technology is still in its infancy. Available software providers are growing, and much of the published work has not fully explored current technology capabilities. AFEA enables researchers to explore the influence of beverages on consumers in realistic settings, capturing high-frequency data across the entire consumption experience versus a single moment (or sip) in time. Current AFEA hardware, such as dome and array-based cameras, have the ability to leverage and compensate for natural environments, capture the expressions of multiple participants at once, and reduce many of the issues of standard camera devices. AFEA is a practical, economical, and useful tool that complements and enriches traditional beverage sensory analysis.
Author Contributions
All authors have read and agree to the published version of the manuscript and contributed to the investigation and synthesis of the literature reviewed.
Funding
This research received no external funding.
Conflicts of Interest
The authors declare no conflict of interest.
Appendix A
Summaries of the 38 AFEA studies from 2009 to 2019. Methodology formats are indicated by the following abbreviations:
DHQ: diet history questionnaire,
ECG: electrocardiography,
EEG: electroencephalography,
FCQ-SP: food choice questionnaire in Spanish population,
FFQ: food frequency questionnaire,
HR: heart rate,
PrEmo: product emotion measurement instrument,
PVA: pulse volume amplitude,
QDA: quantitative descriptive analysis method,
SCR: skin conductance response,
ST: skin temperature,
SCL: skin conductance level, and
VAS: visual analogue line scale.
| Author | Mean Age | Pop. | Sample | Process | AFEA Software | Other Analyses | Country |
| Arnade [49] | n/a | 52 | Milk | Implicit | Face Reader 4.0 | EsSense, 9-point hedonic scale | USA |
| Bartkiene [66] | 18–85 | 505 | Solid food | Implicit | Face Reader 6.0 | Questionnaire, 10-point hedonic scale | Lithuania |
| Crist [60] | 18–70 | 65 | Caffeine solutions | Implicit | Face Reader 6.0 | 9-point hedonic scale | USA |
| Danner [33] | 23 | 75 and 78 | Orange juice | Implicit and Explicit | Face Reader 4.0 | 9-point hedonic scale | Austria |
| Danner [34] | 22.9 | 99 | Juices | Implicit and Explicit | Face Reader 5.0 | SCL, ST, HR, PVA, 9-point hedonic scale | Austria |
| de Wijk [41] | 15.5 | 16 | Various foods | Implicit | Face Reader | SCR, HR, ST | The Netherlands |
| de Wijk [53] | 18–65 | 32 | Cooked food (chicken, tofu, veggie chicken) | Implicit | Face Reader 7.0 | VAS, HR | The Netherlands |
| de Wijk [55] | 30.1 (female), 36.2 (male) | 19 | Breakfast drinks | Implicit | Face Reader 4.0 | HR, SCL, ST, VAS | The Netherlands |
| Fuentes [62] | n/a | 30 and 59 | Beers; Images | Implicit | Face Reader 7.1 | Questionnaire, VAS, HR, ST | Australia |
| Garcia-Burgos [40] | 24.2 | 40 | Bitter solutions | Implicit | Face Reader 4.0 | Eating behavior questionnaire (FPQ, FFQ, DHQ, FCQ-SP), caloric intake, 9-point hedonic scale | Spain |
| Garcia-Burgos [67] | 24.8 | 59 | Bitter foods | Implicit | Face Reader 4.0 | 9-point scale, questionnaire | Spain |
| Gunaratne [65] | 25–55 | 60 | Chocolate packaging | Implicit | Face Reader 6.0 | Questionnaire, eye tracking | Australia |
| He [50] | 20–25 | 26 | Food odors | Implicit | Face Reader 4.0 | VAS, PrEmo | The Netherlands |
| He [51] | 18–30 | 28 | Food odors | Implicit | Face Reader 5.0 | VAS, PrEmo, HR, SCL, ST | The Netherlands |
| He [52] | 23 | 24 | Semi-liquid foods | Implicit | Face Reader 4.0 | Questionnaire, SC, ST, HR | The Netherlands |
| Horska [56] | n/a | 22 | Wine | Implicit | Face Reader | 9-point hedonic scale, EEG | Slovak Republic |
| Juodeikiene [30] | 22 | 12–20 | Confectionary products | Explicit | Face Reader 5.0 | 7-point hedonic scale | Lithuania |
| Juodeikiene [76] | 21–24 | 109 | Bread and chocolate | Explicit | Face Reader 5.0 | Questionnaire, 9-point hedonic scale | Lithuania |
| Kerrihard [69] | 23.8 | 100 | Salt levels in mashed potato | Implicit | Face Reader | Questionnaire, | USA |
| Kostyra [42] | 23 | 30 | Smoked ham | Implicit | Face Reader 4.0 | n/a | Poland |
| Kostyra [46] | 23 | 30 | Smoked ham | Explicit | Face Reader 4.0 | QDA, eye tracking, 9-point hedonic scale | Poland |
| Leitch [39] | 20–60 | 31 | Tea | Implicit | Face Reader 5.0 | 9-point hedonic scale, modified EsSense | USA |
| Mahieu [47] | 18–65 | 44 | Chocolates, perfume, video ads | Implicit | Project Oxford | n/a | France |
| Pentus [35] | n/a | 107 | Juice packaging | Implicit | Realeyes | none | Estonia |
| Ploom [32] | n/a | 57 and 258 | Biscuit packaging | Implicit | Face Reader 7.0 | Eye tracking, online survey | Estonia |
| Rocha [77] | 18–58 | 50 | Herbal infusions | Implicit | Face Reader 6.0 | EsSense, 9-point hedonic scale | Portugal |
| Rocha-Parra [38] | 22.3 | 73 | Wine extract | Implicit | FACET SDK | 10-point rating scale | Argentina |
| Samant [27] | 39 | 102 | Basic solutions | Implicit | iMotions 6.1 | EsSense, SCR, HR, ST, VAS, 9-point hedonic scale | USA |
| Samant [63] | 41.13 | 100 | Vegetable juices | Implicit | iMotions | 9-point scale, VAS, EsSense | USA |
| Torrico [70] | 18–60 | 60 | Images and chocolate | Implicit | Face Reader 6.1 | ST, BP, 3-point face scale | Australia |
| Vergura [26] | 24; 26 | 40 and 60 | Package images | Implicit | Face Reader 5.0 | 9-point hedonic scale and questionnaire | Italy |
| Walsh [36] | 18–25 | 27 | Milk | Implicit | Face Reader 5.0 | EsSense, 9-point hedonic scale | USA |
| Walsh [54] | 18–29 | 40 | Videos showing food quality and safety concerns | Implicit | Face Reader 6.0 | EEG, ECG (HR), 7-point hedonic scale, EsSense | USA |
| Walsh [61] | 18–29 | 40 | Videos of breakfast meals | Implicit | Face Reader 6.0 | EEG, HR, 7-point hedonic scale, EsSense | USA |
| Yu [64] | 22.6 | 120 | Graphics | Implicit | Face Reader | Verbal self-reports | Taiwan |
| Zeinstra [43] | 8.5 | 6 | Juices | Implicit | Observer TM | 3-point face scale, ranking | The Netherlands |
| Zhi [57] | 24.1 | 46 | Fruit juices | Implicit | Face Reader 5.0 | 9-point hedonic scale | China |
| Zhi [78] | 18–39 | 50 | Basic solutions | Implicit | Face Reader 5.0 | 9-point hedonic scale, VAS | China |
References
- Stasi, A.; Songa, G.; Mauri, M.; Ciceri, A.; Diotallevi, F.; Nardone, G.; Russo, V. Neuromarketing Empirical Approaches and Food Choice: A Systematic Review. Food Res. Int. 2017, 108, 650–664. [Google Scholar] [CrossRef] [PubMed]
- Köster, E.P.; Mojet, J. From Mood to Food and from Food to Mood: A Psychological Perspective on the Measurement of Food-Related Emotions in Consumer Research. Food Res. Int. 2015, 76, 180–191. [Google Scholar] [CrossRef]
- Ekman, P.; Friesen, W.V. Manual of the Facial Action Coding System (FACS); Consulting Psychologists Press: Palo Alto, CA, USA, 1978. [Google Scholar]
- Kring, A.M.; Kerr, S.L.; Smith, D.A.; Neale, J.M. Flat Affect in Schizophrenia does not Reflect Diminished Subjective Experience of Emotion. J. Abnorm. Psychol. 1993, 102, 507. [Google Scholar] [CrossRef]
- Izard, C.E. The Maximally Discriminative Facial Coding System; University of Delaware: Newark, NJ, USA, 1979. [Google Scholar]
- Tronick, E.; Als, H.; Brazelton, T.B. Monadic Phases: A Structural Descriptive Analysis of Infant-Mother Face to Face Interaction. Merrill-Palmer Q. Behav. Dev. 1980, 26, 3–24. [Google Scholar]
- Kohler, C.G.; Martin, E.A.; Stolar, N.; Barrett, F.S.; Verma, R.; Brensinger, C.; Gur, R.C. Static Posed and Evoked Facial Expressions of Emotions in Schizophrenia. Schizophr. Res. 2008, 105, 49–60. [Google Scholar] [CrossRef] [PubMed] [Green Version]
- Sayette, M.A.; Smith, D.W.; Breiner, M.J.; Wilson, G.T. The Effect of Alcohol on Emotional Response to a Social Stressor. J. Stud. Alcohol Drugs 1992, 53, 541–545. [Google Scholar] [CrossRef] [PubMed]
- Affectiva. Available online: https://www.affectiva.com (accessed on 27 January 2020).
- CrowdEmotion. Available online: https://www.crowdemotion.co.uk/ (accessed on 27 January 2020).
- EmoVu. Available online: https://www.eyeris.ai/ (accessed on 27 January 2020).
- Face++. Available online: https://www.faceplusplus.com/ (accessed on 27 January 2020).
- FaceReader. Available online: https://www.noldus.com/facereader (accessed on 27 January 2020).
- FacioMetrics. Available online: https://research.fb.com/category/augmented-reality-virtual-reality/ (accessed on 27 January 2020).
- Findface. Available online: https://findface.pro/en/ (accessed on 27 January 2020).
- iMotions. Available online: https://imotions.com/ (accessed on 27 January 2020).
- Insight SDK. Available online: https://sightcorp.com/insight/ (accessed on 27 January 2020).
- Kairos. Available online: https://www.kairos.com/ (accessed on 27 January 2020).
- Nviso. Available online: https://www.nviso.ai/ (accessed on 27 January 2020).
- Observer. Available online: https://www.noldus.com/observer-xt (accessed on 27 January 2020).
- Project Oxford. Available online: https://azure.microsoft.com/en-us/services/cognitive-services/face/ (accessed on 27 January 2020).
- Realeyes. Available online: https://www.realeyesit.com/ (accessed on 27 January 2020).
- SkyBiometry. Available online: https://skybiometry.com/ (accessed on 27 January 2020).
- Meiselman, H.L. A Review of the Current State of Emotion Research in Product Development. Food Res. Int. 2015, 76, 192–199. [Google Scholar] [CrossRef]
- Ekmann, P. Universal Facial Expressions in Emotion. Studia Psychol. 1973, 15, 140–146. [Google Scholar]
- Vergura, D.T.; Luceri, B. Product Packaging and Consumers’ Emotional Response. Does Spatial Representation Influence Product Evaluation and Choice? J. Consum. Mark. 2018, 35, 218–227. [Google Scholar] [CrossRef]
- Samant, S.S.; Chapko, M.J.; Seo, H.S. Predicting Consumer Liking and Preference Based on Emotional Responses and Sensory Perception: A Study with Basic Taste Solutions. Food Res. Int. 2017, 100, 325–334. [Google Scholar] [CrossRef]
- Erickson, K.; Schulkin, J. Facial Expressions of Emotion: A Cognitive Neuroscience Perspective. Brain Cogn. 2003, 52, 52–60. [Google Scholar] [CrossRef]
- Desmet, P.M.; Schifferstein, H.N. Sources of Positive and Negative Emotions in Food Experience. Appetite 2008, 50, 290–301. [Google Scholar] [CrossRef] [PubMed]
- Juodeikiene, G.; Basinskiene, L.; Vidmantiene, D.; Klupsaite, D.; Bartkiene, E. The Use of Face Reading Technology to Predict Consumer Acceptance of Confectionery Products. In Proceedings of the Food for Consumer Well-Being, 9th Baltic Conference on Food Science and Technology, Jelgava, Latvia, 8–9 May 2014; pp. 276–279. [Google Scholar]
- Moher, D.; Liberati, A.; Tetzlaff, J.; Altman, D.G. Preferred Reporting Items for Systematic Reviews and Meta-Analyses: The PRISMA Statement. PLoS Med. 2009, 151, 264–269. [Google Scholar] [CrossRef] [Green Version]
- Ploom, K.; Pentus, K.; Kuusik, A.; Varblane, U. The Effect of Culture on the Perception of Product Packaging: A Multimethod Cross-Cultural Study. J. Int. Consum. Mark. 2019, 1–15. [Google Scholar] [CrossRef]
- Danner, L.; Sidorkina, L.; Joechl, M.; Duerrschmid, K. Make a Face! Implicit and Explicit Measurement of Facial Expressions Elicited by Orange Juices Using Face Reading Technology. Food Qual. Prefer. 2014, 32, 167–172. [Google Scholar] [CrossRef]
- Danner, L.; Haindl, S.; Joechl, M.; Duerrschmid, K. Facial Expressions and Autonomous Nervous System Responses Elicited by Tasting Different Juices. Food Res. Int. 2014, 64, 81–90. [Google Scholar] [CrossRef]
- Pentus, K.; Mehine, T.; Kuusik, A. Considering Emotions in Product Package Design through Combining Conjoint Analysis with Psycho Physiological Measurements. Procedia-Soc. Behav. Sci. 2014, 148, 280–290. [Google Scholar] [CrossRef] [Green Version]
- Walsh, A.M.; Duncan, S.E.; Potts, H.; Gallagher, D.L. Comparing Quality and Emotional Responses as Related to Acceptability of Light-Induced Oxidation Flavor in Milk. Food Res. Int. 2015, 76, 293–300. [Google Scholar] [CrossRef]
- Walsh, J.A.; Creighton, S.E.; Rutherford, M.D. Emotion Perception or Social Cognitive Complexity: What Drives Face Processing Deficits in Autism Spectrum Disorder? J. Autism Dev. Disord. 2016, 46, 615–623. [Google Scholar] [CrossRef]
- Rocha-Parra, D.; García-Burgos, D.; Munsch, S.; Chirife, J.; Zamora, M.C. Application of Hedonic Dynamics Using Multiple-Sip Temporal-Liking and Facial Expression for Evaluation of a New Beverage. Food Qual. Prefer. 2016, 52, 153–159. [Google Scholar] [CrossRef] [Green Version]
- Leitch, K.A.; Duncan, S.E.; O’Keefe, S.; Rudd, R.; Gallagher, D.L. Characterizing Consumer Emotional Response to Sweeteners Using an Emotion Terminology Questionnaire and Facial Expression Analysis. Food Res. Int. 2015, 76, 283–292. [Google Scholar] [CrossRef] [Green Version]
- García-Burgos, D.; Zamora, M.C. Facial Affective Reactions to Bitter-Tasting Foods and Body Mass Index in Adults. Appetite 2013, 71, 178–186. [Google Scholar] [CrossRef] [PubMed] [Green Version]
- De Wijk, R.A.; Kooijman, V.; Verhoeven, R.H.G.; Holthuysen, N.T.E.; de Graaf, C. Autonomic Nervous System Responses on and Facial Expressions to the Sight, Smell, and Taste of Liked and Disliked Foods. Food Qual. Prefer. 2012, 26, 196–203. [Google Scholar] [CrossRef]
- Kostyra, E.; Rambuszek, M.; Waszkiewicz-Robak, B.; Laskowski, W.; Blicharski, T.; Poławska, E. Consumer Facial Expression in Relation to Smoked Ham with the Use of Face Reading Technology. The Methodological Aspects and Informative Value of Research Results. Meat Sci. 2016, 119, 22–31. [Google Scholar] [CrossRef]
- Zeinstra, G.G.; Koelen, M.A.; Colindres, D.; Kok, F.J.; De Graaf, C. Facial Expressions in School-Aged Children Are a Good Indicator of ‘Dislikes’, but Not of ‘Likes’. Food Qual. Prefer. 2009, 20, 620–624. [Google Scholar] [CrossRef]
- Lagast, S.; Gellynck, X.; Schouteten, J.J.; De Herdt, V.; De Steur, H. Consumers’ Emotions Elicited by Food: A Systematic Review of Explicit and Implicit Methods. Trends Food Sci. Technol. 2017, 69, 172–189. [Google Scholar] [CrossRef]
- He, W.; Boesveldt, S.; De Graaf, C.; De Wijk, R.A. Dynamics of Autonomic Nervous System Responses and Facial Expressions to Odors. Front. Psychol. 2014, 5, 110. [Google Scholar] [CrossRef] [Green Version]
- Kostyra, E.; Wasiak-Zys, G.; Rambuszek, M.; Waszkiewicz-Robak, B. Determining the Sensory Characteristics, Associated Emotions and Degree of Liking of the Visual Attributes of Smoked Ham. LWT-Food Sci. Technol. 2016, 65, 246–253. [Google Scholar] [CrossRef]
- Mahieu, B.; Visalli, M.; Schlich, P.; Thomas, A. Eating Chocolate, Smelling Perfume or Watching Video Advertisement: Does It Make Any Difference on Emotional States Measured at Home Using Facial Expressions? Food Qual. Prefer. 2019, 77, 102–108. [Google Scholar] [CrossRef]
- Crist, C.A.; Duncan, S.E.; Gallagher, D.L. Protocol for Data Collection and Analysis Applied to Automated Facial Expression Analysis Technology and Temporal Analysis for Sensory Evaluation. J. Vis. Exp. 2016, 114. [Google Scholar] [CrossRef]
- Arnade, E.A. Measuring Consumer Emotional Response to Tastes and Foods through Facial Expression Analysis. Master’s Thesis, Virginia Tech, Blacksburg, VA, USA, 2014. [Google Scholar]
- He, W.; Boesveldt, S.; de Graaf, C.; de Wijk, R.A. The Relation between Continuous and Discrete Emotional Responses to Food Odors with Facial Expressions and Non-Verbal Reports. Food Qual. Prefer. 2016, 48, 130–137. [Google Scholar] [CrossRef]
- He, W.; de Wijk, R.A.; de Graaf, C.; Boesveldt, S. Implicit and Explicit Measurements of Affective Responses to Food Odors. Chem. Senses 2016, 41, 661–668. [Google Scholar] [CrossRef] [PubMed]
- He, W.; Boesveldt, S.; Delplanque, S.; de Graaf, C.; de Wijk, R.A. Sensory-Specific Satiety: Added Insights from Autonomic Nervous System Responses and Facial Expressions. Physiol. Behav. 2017, 170, 12–18. [Google Scholar] [CrossRef] [Green Version]
- De Wijk, R.A.; Kaneko, D.; Dijksterhuis, G.B.; van Zoggel, M.; Schiona, I.; Visalli, M.; Zandstra, E.H. Food Perception and Emotion Measured over Time In-Lab and in-Home. Food Qual. Prefer. 2019, 75, 170–178. [Google Scholar] [CrossRef]
- Walsh, A.M.; Duncan, S.E.; Bell, M.A.; O’Keefe, S.F.; Gallagher, D.L. Integrating Implicit and Explicit Emotional Assessment of Food Quality and Safety Concerns. Food Qual. Prefer. 2017, 56, 212–224. [Google Scholar] [CrossRef] [Green Version]
- De Wijk, R.A.; Mensink, M.G.; Verhoeven, R.H.; De Graaf, C. ANS Responses and Facial Expressions Differentiate between the Taste of Commercial Breakfast Drinks. PLoS ONE 2014, 9, e93823. [Google Scholar] [CrossRef]
- Horska, E.; Bercik, J.; Krasnodebski, A.; Matysik-Pejas, R.; Bakayova, H. Innovative Approaches to Examining Consumer Preferences When Choosing Wines. Agric. Econ. (Czech) 2016, 62, 124–133. [Google Scholar] [CrossRef] [Green Version]
- Zhi, R.; Wan, J.; Zhang, D.; Li, W. Correlation between Hedonic Liking and Facial Expression Measurement Using Dynamic Affective Response Representation. Food Res. Int. 2018, 108, 237–245. [Google Scholar] [CrossRef]
- FaceReader Reference Manual Version 6.1. Noldus Information Technology 2015. Available online: https://student.hva.nl/binaries/content/assets/serviceplein-a-z-lemmas/media-creatie-en-informatie/media--communicatie/observatorium/factsheet-facial-coding-reference-manual.pdf?2900513938585/ (accessed on 27 January 2020).
- Beringer, M.; Spohn, F.; Hildebrandt, A.; Wacker, J.; Recio, G. Reliability and Validity of Machine Vision for the Assessment of Facial Expressions. Cogn. Syst. Res. 2019, 56. [Google Scholar] [CrossRef]
- Crist, C.A.; Duncan, S.E.; Arnade, E.A.; Leitch, K.A.; O’Keefe, S.F.; Gallagher, D.L. Automated Facial Expression Analysis for Emotional Responsivity Using an Aqueous Bitter Model. Food Qual. Prefer. 2018, 68, 349–359. [Google Scholar] [CrossRef]
- Walsh, A.M.; Duncan, S.E.; Bell, M.A.; O’Keefe, S.F.; Gallagher, D.L. Breakfast Meals and Emotions: Implicit and Explicit Assessment of the Visual Experience. J. Sens. Stud. 2017, 32. [Google Scholar] [CrossRef]
- Fuentes, S.; Gonzalez Viejo, C.; Torrico, D.D.; Dunshea, F.R. Development of a Biosensory Computer Application to Assess Physiological and Emotional Responses from Sensory Panelists. Sensors 2018, 18, 2958. [Google Scholar] [CrossRef] [Green Version]
- Samant, S.S.; Seo, H. Using Both Emotional Responses and Sensory Attribute Intensities to Predict Consumer Liking and Preference toward Vegetable Juice Products. Food Qual. Prefer. 2019, 73, 75–85. [Google Scholar] [CrossRef]
- Yu, C.; Ko, C. Applying FaceReader to Recognize Consumer Emotions in Graphic Styles. Procedia CIRP 2017, 60, 104–109. [Google Scholar] [CrossRef]
- Gunaratne, N.M.; Fuentes, S.; Gunaratne, T.M.; Torrico, D.D.; Ashman, H.; Francis, C.; Gonzalez Viejo, C.; Dunshea, F.R. Consumer Acceptability, Eye Fixation, and Physiological Responses: A Study of Novel and Familiar Chocolate Packaging Designs Using Eye-Tracking Devices. Foods 2019, 8, 253. [Google Scholar] [CrossRef] [PubMed] [Green Version]
- Bartkiene, E.; Steibliene, V.; Adomaitiene, V.; Juodeikiene, G.; Cernauskas, D.; Lele, V.; Klupsaite, D.; Zadeike, D.; Jarutiene, L.; Guiné, R.P.F. Factors Affecting Consumer Food Preferences: Food Taste and Depression-Based Evoked Emotional Expressions with the Use of Face Reading Technology. BioMed Res. Int. 2019, 2019. [Google Scholar] [CrossRef] [PubMed]
- Garcia-Burgos, D.; Zamora, M.C. Exploring the Hedonic and Incentive Properties in Preferences for Bitter Foods via Self-Reports, Facial Expressions and Instrumental Behaviours. Food Qual. Prefer. 2015, 39, 73–81. [Google Scholar] [CrossRef] [Green Version]
- Prescott, J. Comparisons of Taste Perceptions and Preferences of Japanese and Australian Consumers: Overview and Implications for Cross-Cultural Sensory Research. Food Qual. Prefer. 1998, 9, 393–402. [Google Scholar] [CrossRef]
- Kerrihard, A.L.; Khair, M.B.; Blumberg, R.; Feldman, C.H.; Wunderlich, S.M. The Effects of Acclimation to the United States and Other Demographic Factors on Responses to Salt Levels in Foods: An Examination Utilizing Face Reader Technology. Appetite 2017, 116, 315–322. [Google Scholar] [CrossRef]
- Torrico, D.D.; Fuentes, S.; Gonzalez Viejo, C.; Ashman, H.; Gunaratne, N.M.; Gunaratne, T.M.; Dunshea, F.R. Images and Chocolate Stimuli Affect Physiological and Affective Responses of Consumers: A Cross-Cultural Study. Food Qual. Prefer. 2018, 65, 60–71. [Google Scholar] [CrossRef]
- Skiendziel, T.; Rösch, A.G.; Schultheiss, O.C. Assessing the Convergent Validity between the Automated Emotion Recognition Software Noldus FaceReader 7 and Facial Action Coding System Scoring. PLoS ONE 2019, 14. [Google Scholar] [CrossRef] [PubMed] [Green Version]
- FaceReader Output Visualization. Available online: http://www.vicarvision.nl/products/facereader/#outputvisualization (accessed on 5 February 2020).
- Noldus: FaceReader Benefits. Available online: https://www.noldus.com/facereader/benefits (accessed on 5 February 2020).
- Lewinski, P.; den Uyl, T.M.; Butler, C. Automated Facial Coding: Validation of Basic Emotions and FACS AUs in FaceReader. J. Neurosci. Psychol. Econ. 2014, 7, 227–236. [Google Scholar] [CrossRef] [Green Version]
- Stöckli, S.; Schulte-Mecklenbeck, M.; Borer, S.; Samson, A.C. Facial Expression Analysis with AFFDEX and FACET: A Validation Study. Behav. Res. Methods 2018, 50, 1446–1460. [Google Scholar] [CrossRef] [PubMed]
- Juodeikiene, G.; Zadeike, D.; Klupsaite, D.; Cernauskas, D.; Bartkiene, E.; Lele, V.; Adomaitiene, V. Effects of Emotional Responses to Certain Foods on the Prediction of Consumer Acceptance. Food Res. Int. 2018, 112, 361–368. [Google Scholar] [CrossRef]
- Rocha, C.; Lima, R.C.; Moura, A.P.; Costa, T.; Cunha, L.M. Implicit Evaluation of the Emotional Response to Premium Organic Herbal Infusions through a Temporal Dominance Approach: Development of the Temporal Dominance of Facial Emotions (TDFE). Food Qual. Prefer. 2019, 76, 71–80. [Google Scholar] [CrossRef]
- Zhi, R.; Cao, L.; Cao, G. Asians’ Facial Responsiveness to Basic Tastes by Automated Facial Expression Analysis System. J. Food Sci. 2017, 82, 794–806. [Google Scholar] [CrossRef]
Figure 1.
Preferred Reporting Items for Systematic Reviews and Meta-Analyses (PRISMA) flow chart used to conduct the systematic literature review [31].
Figure 1.
Preferred Reporting Items for Systematic Reviews and Meta-Analyses (PRISMA) flow chart used to conduct the systematic literature review [31].

Figure 2.
Publication count by year for the 38 studies related to AFEA, beverages, and/or packaging.
Figure 2.
Publication count by year for the 38 studies related to AFEA, beverages, and/or packaging.

Figure 3.
Number of participants across the 38 studies related to AFEA, beverages, and/or packaging.
Figure 3.
Number of participants across the 38 studies related to AFEA, beverages, and/or packaging.

Figure 4.
Countries of origin for the first author’s institution across the 38 studies related to AFEA, beverages, and/or packaging.
Figure 4.
Countries of origin for the first author’s institution across the 38 studies related to AFEA, beverages, and/or packaging.

Figure 5.
Comparison of explicit vs. implicit AFEA methodologies observed across the 38 studies related to AFEA, beverages, and/or packaging.
Figure 5.
Comparison of explicit vs. implicit AFEA methodologies observed across the 38 studies related to AFEA, beverages, and/or packaging.

Figure 6.
Stimuli utilized across the 38 studies related to AFEA, beverages, and/or packaging.

Figure 7.
Comparison of studies excluding participants across the 38 studies related to AFEA, beverages, and/or packaging.
Figure 7.
Comparison of studies excluding participants across the 38 studies related to AFEA, beverages, and/or packaging.

Figure 8.
Percentage of participants excluded across 11 studies.

Figure 9.
Comparison of AFEA software utilized across the 38 studies related to AFEA, beverages, and/or packaging.
Figure 9.
Comparison of AFEA software utilized across the 38 studies related to AFEA, beverages, and/or packaging.


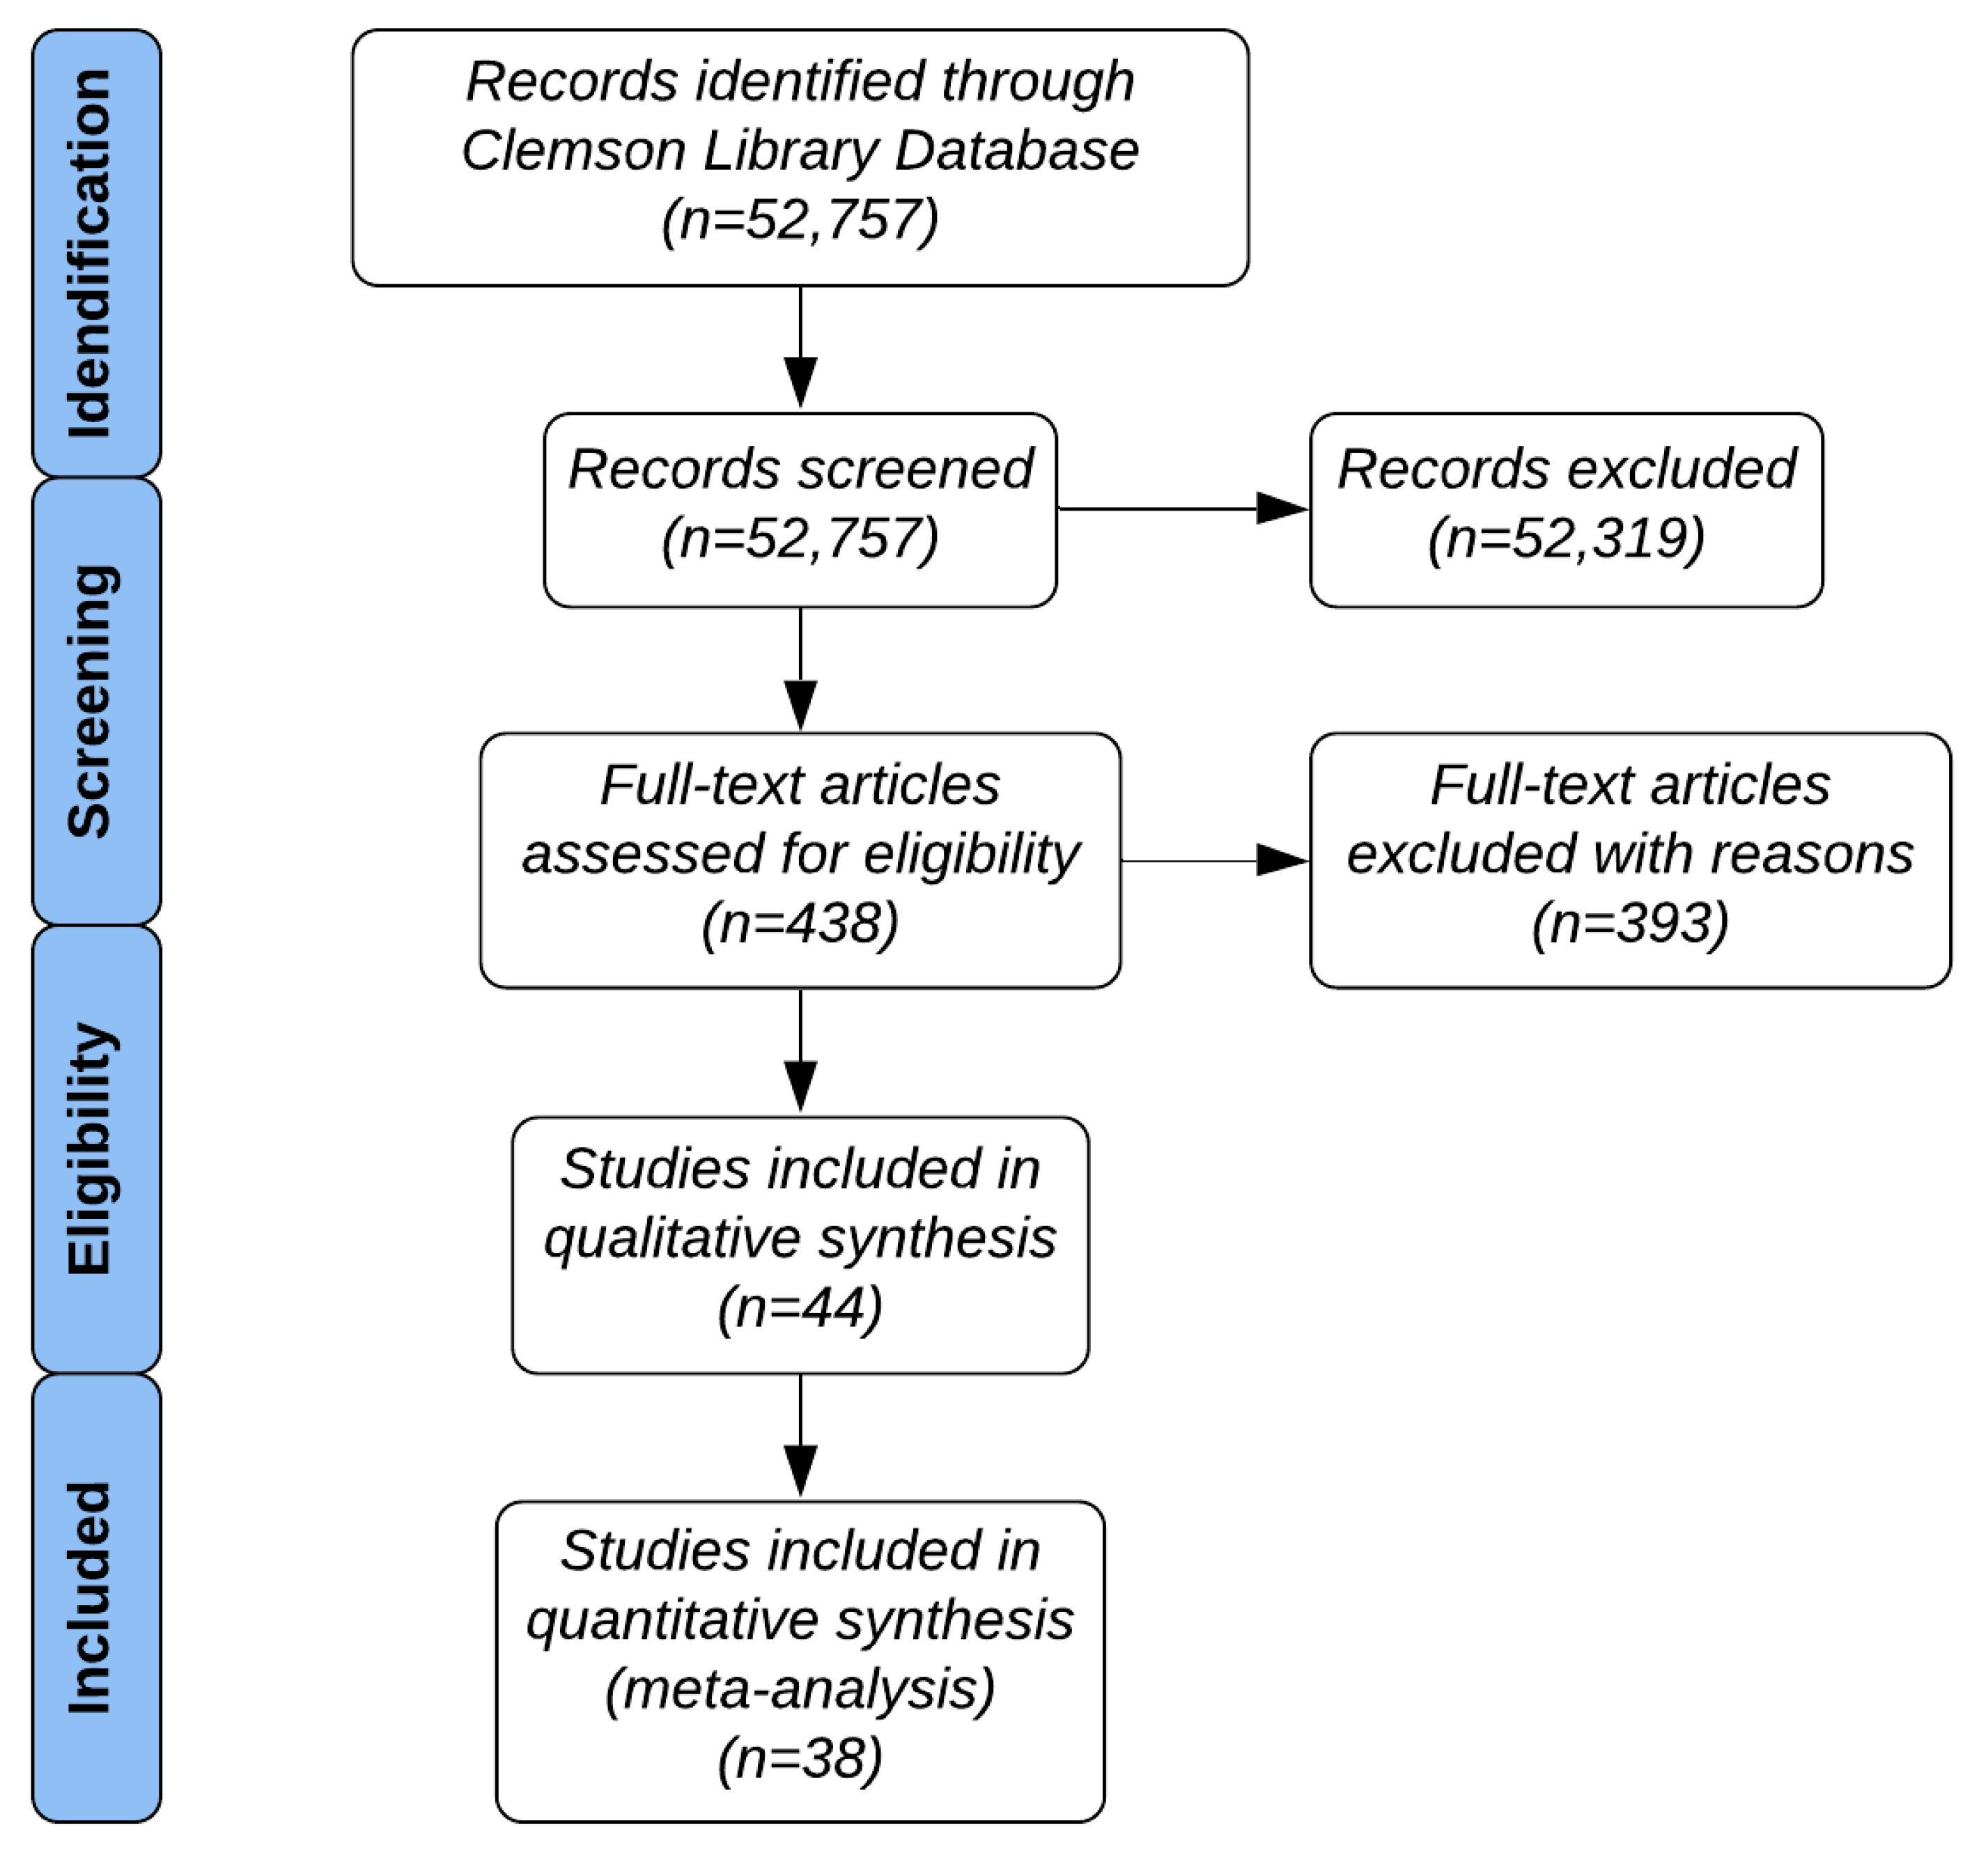
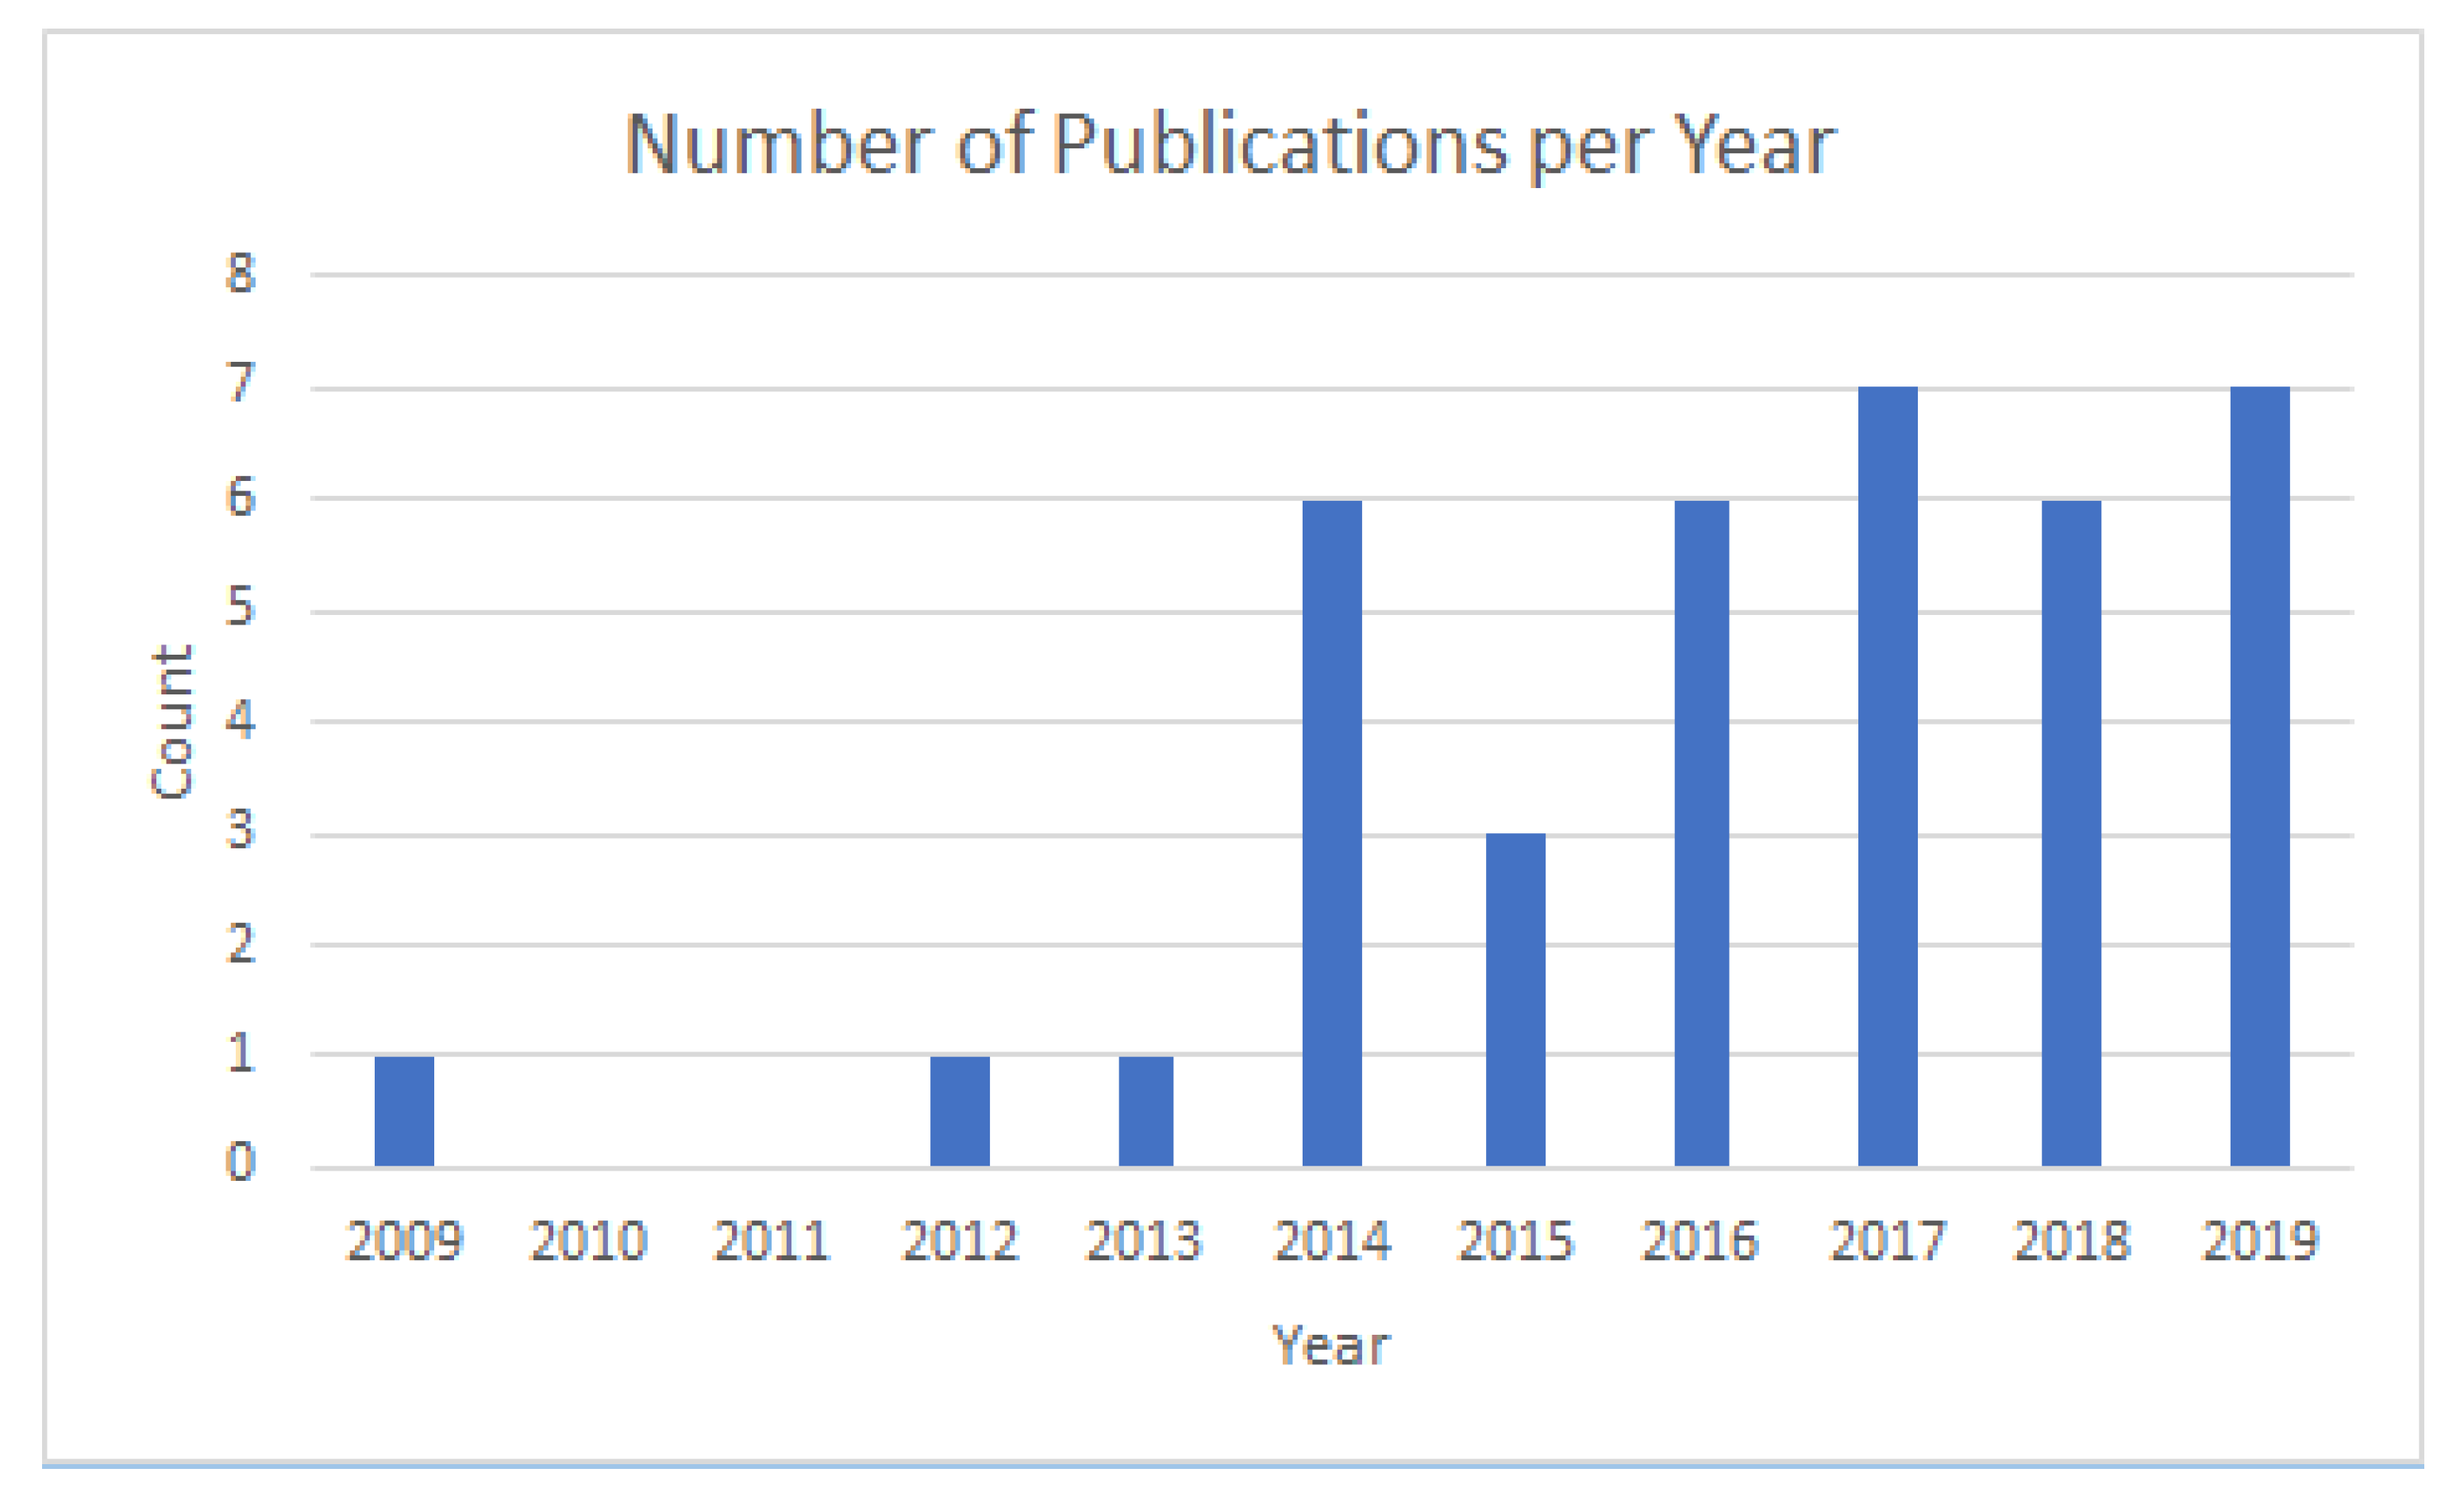
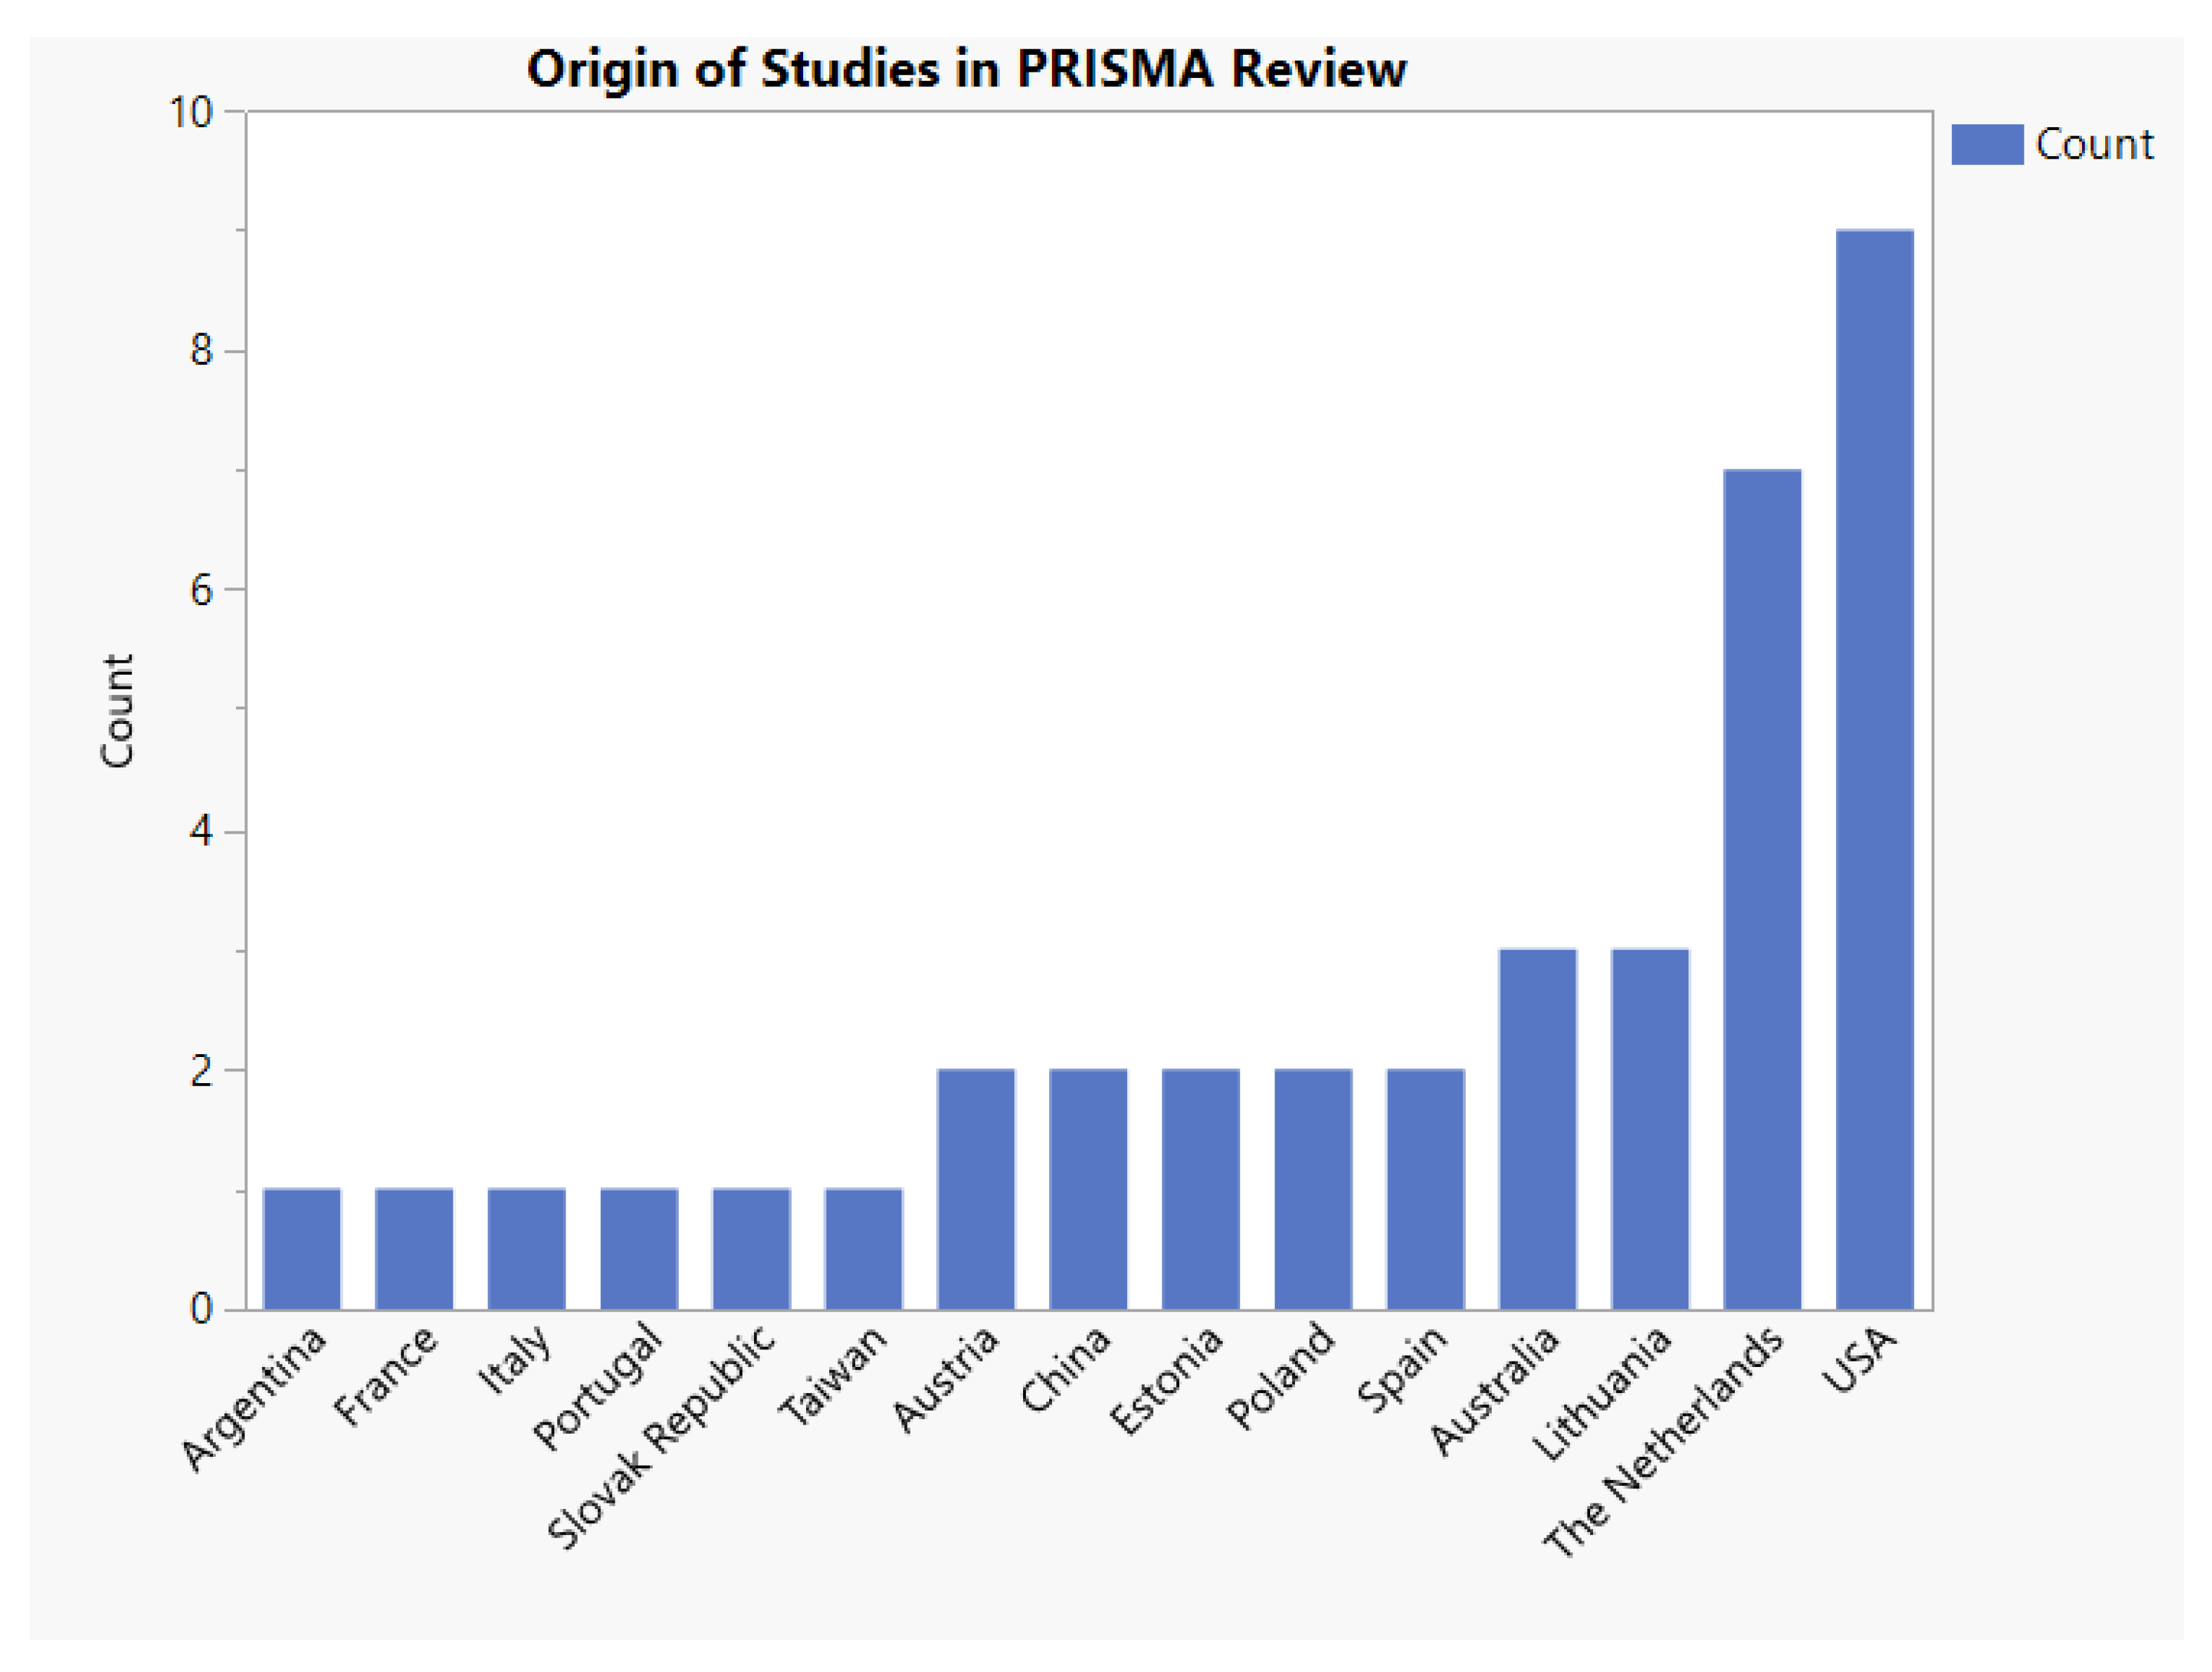
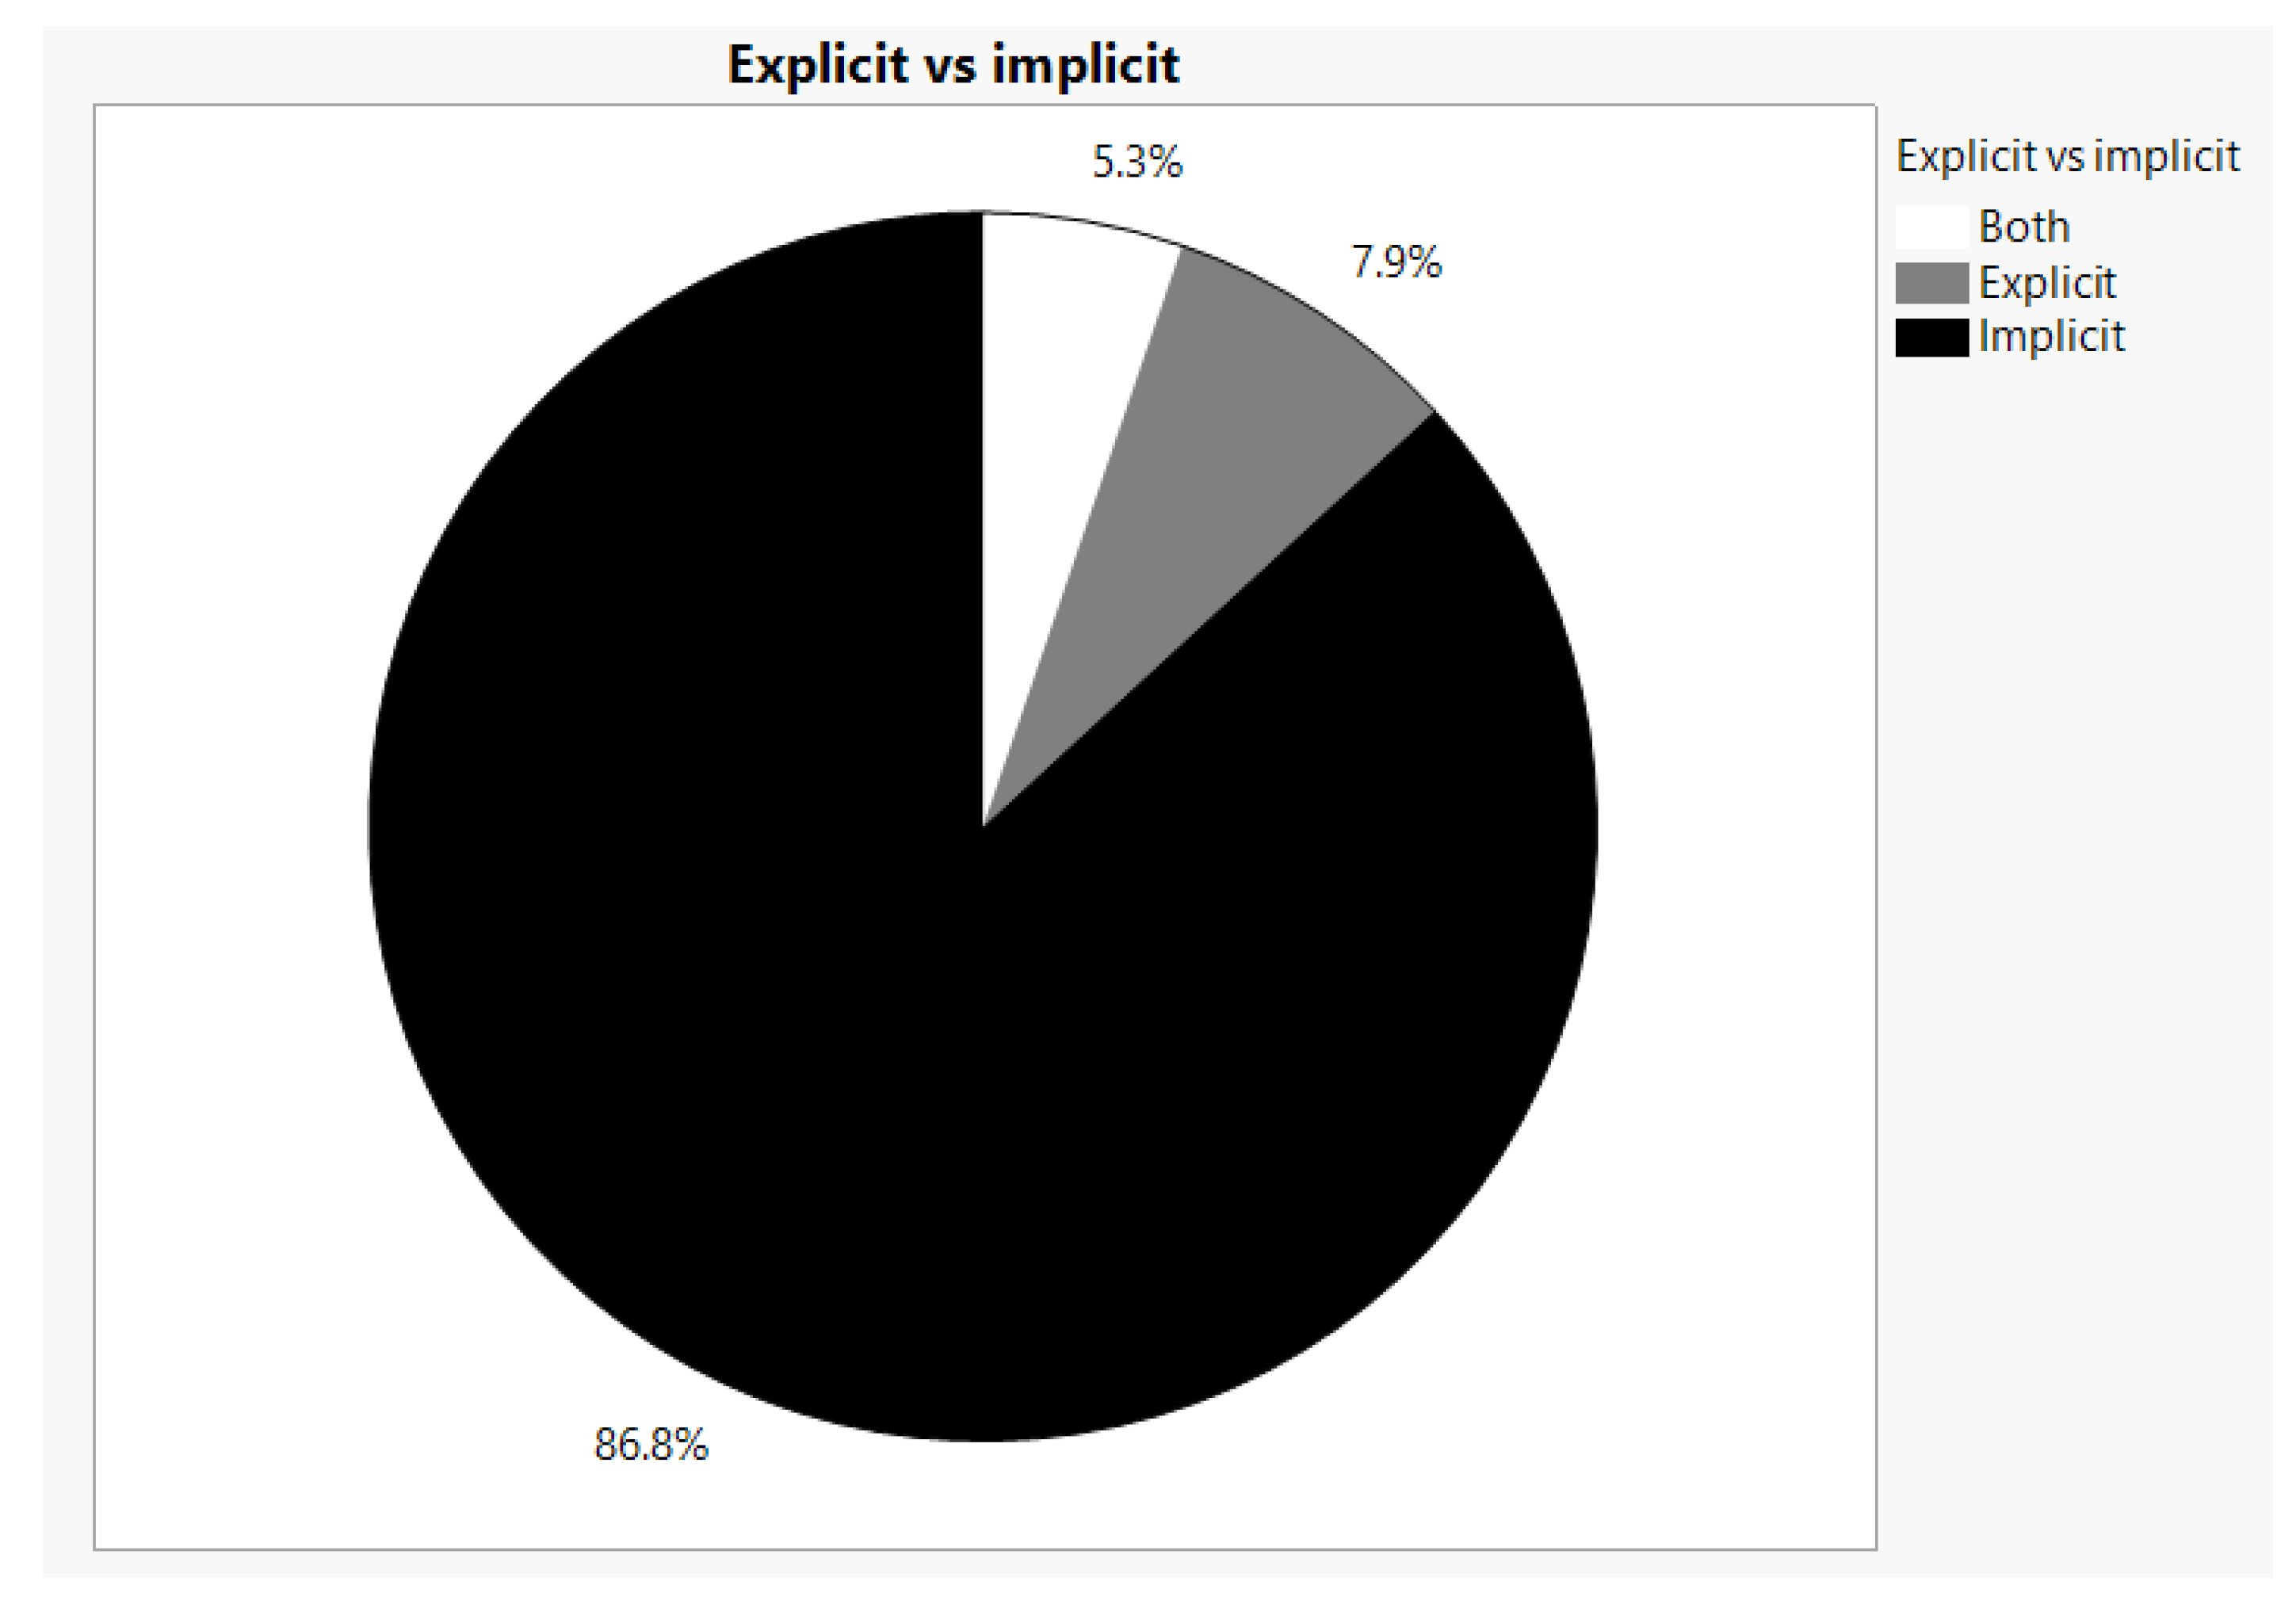
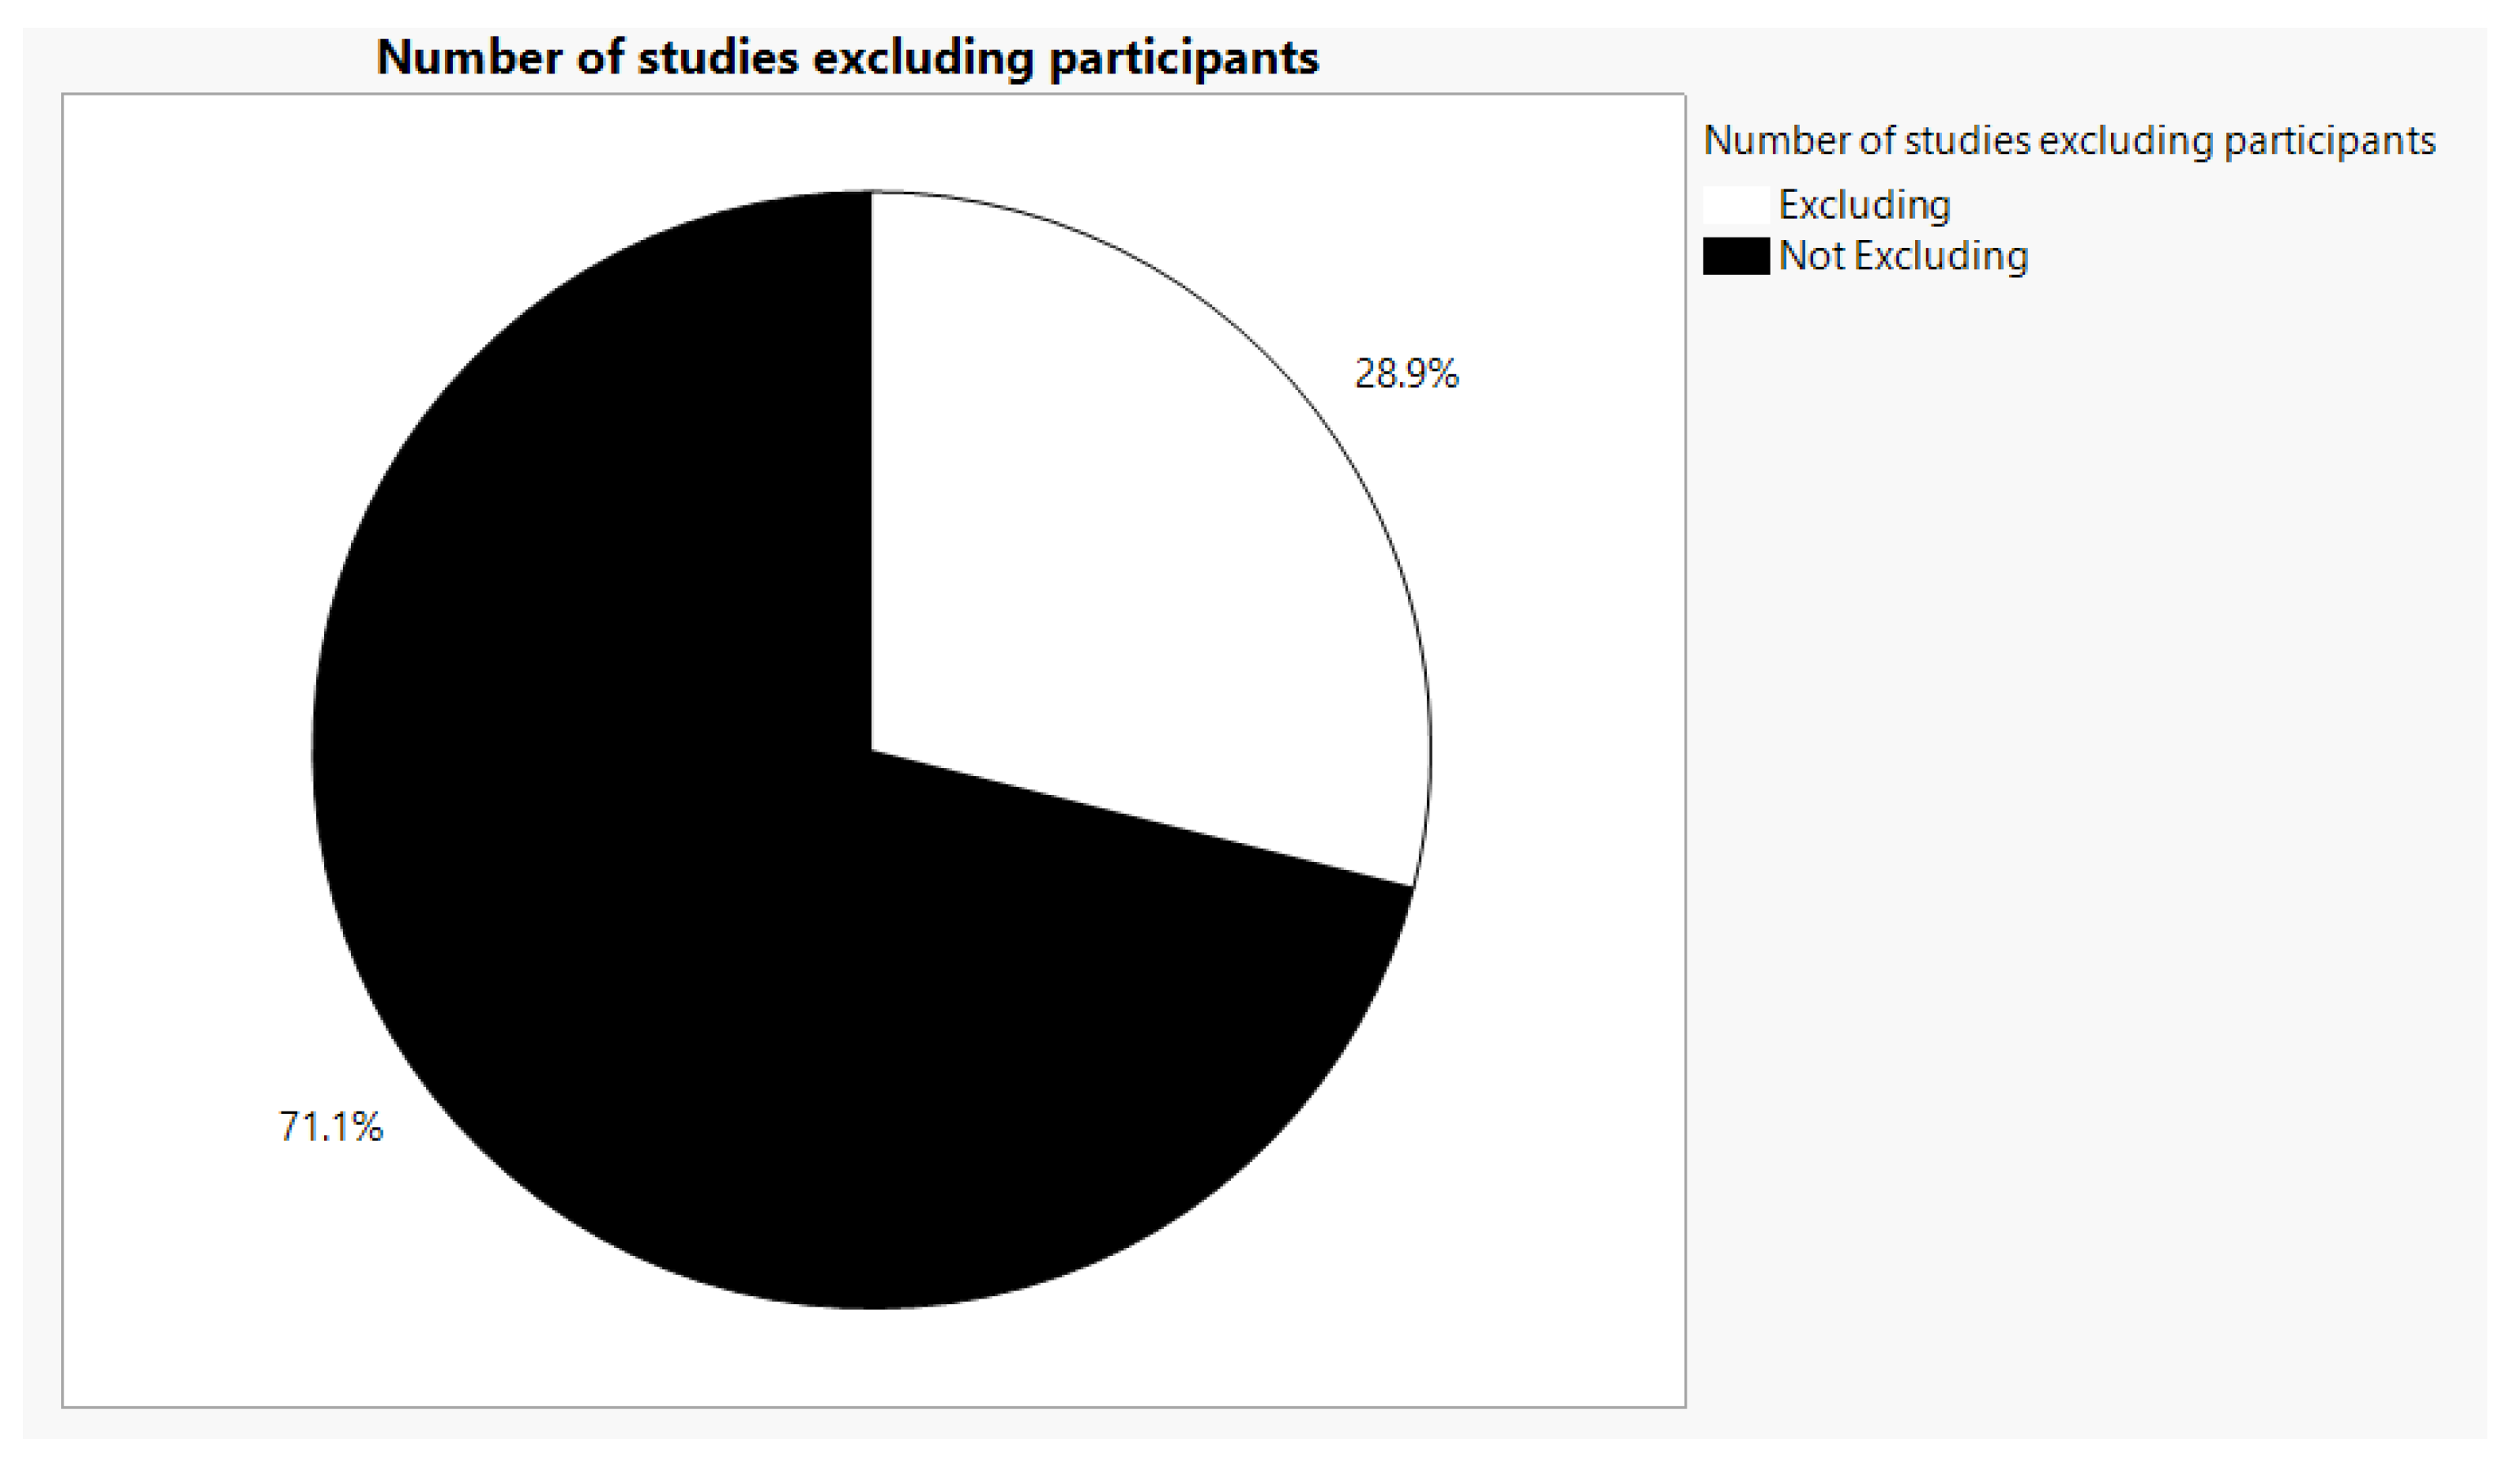
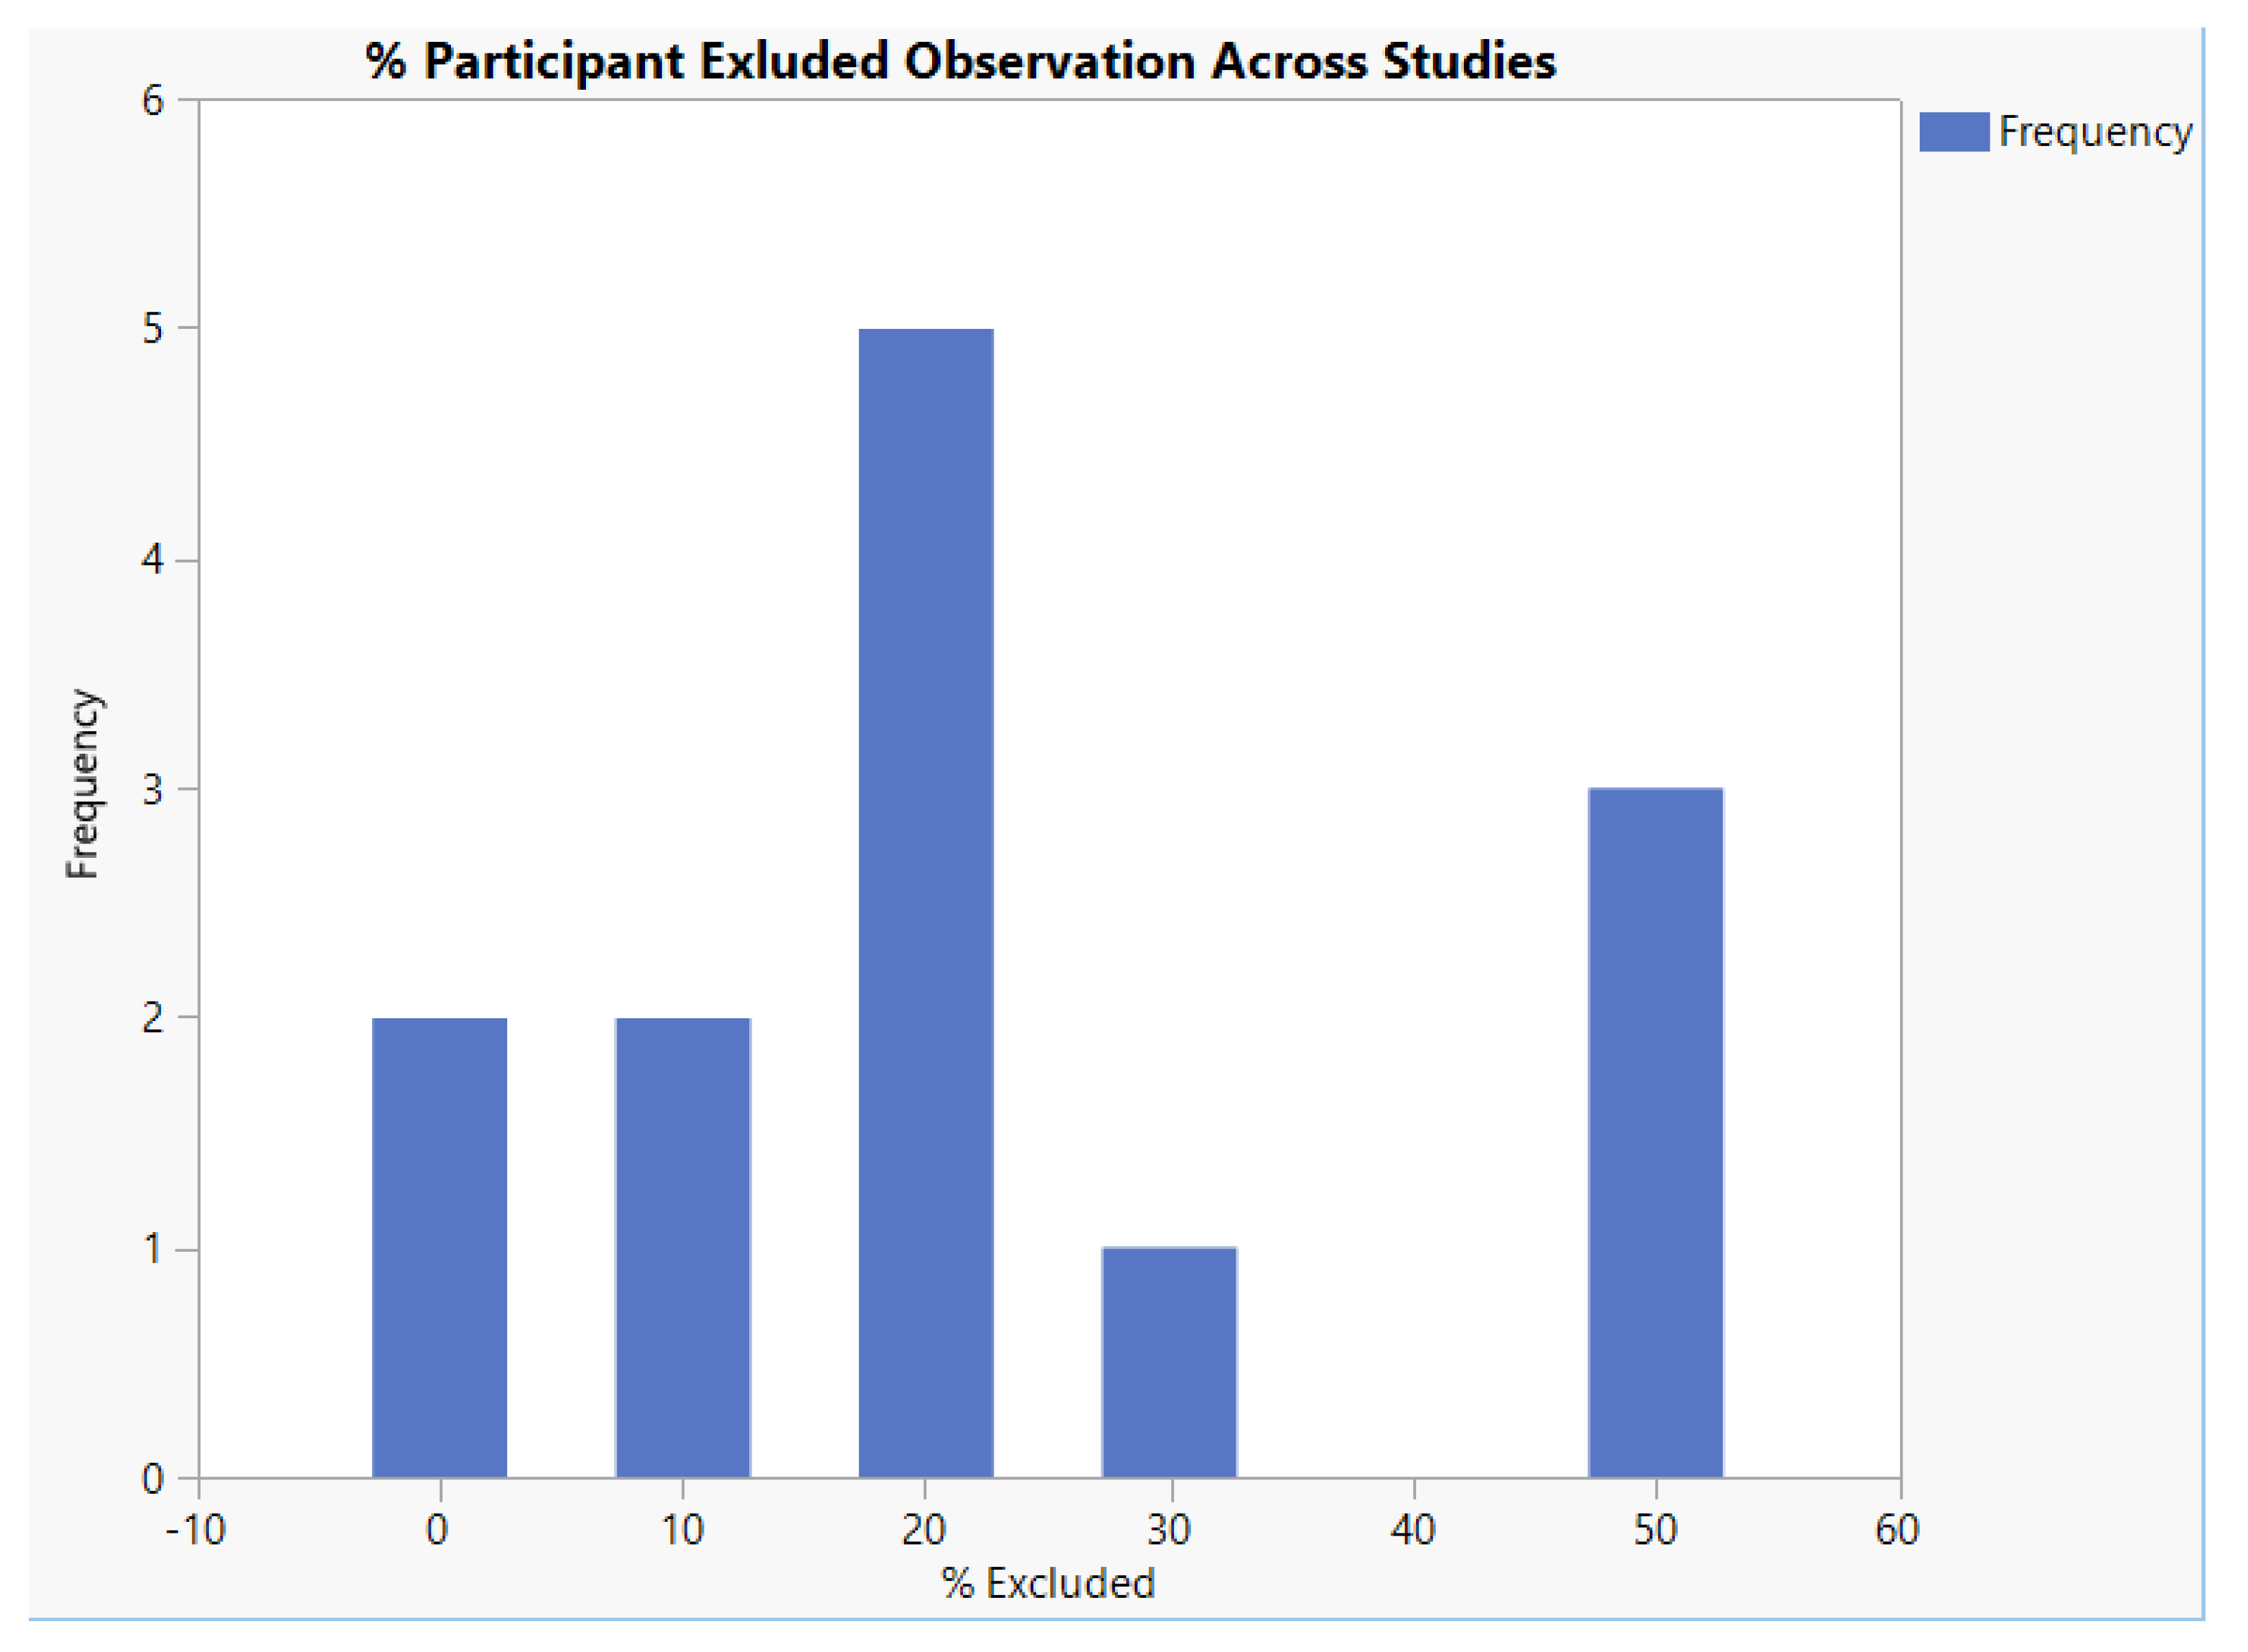
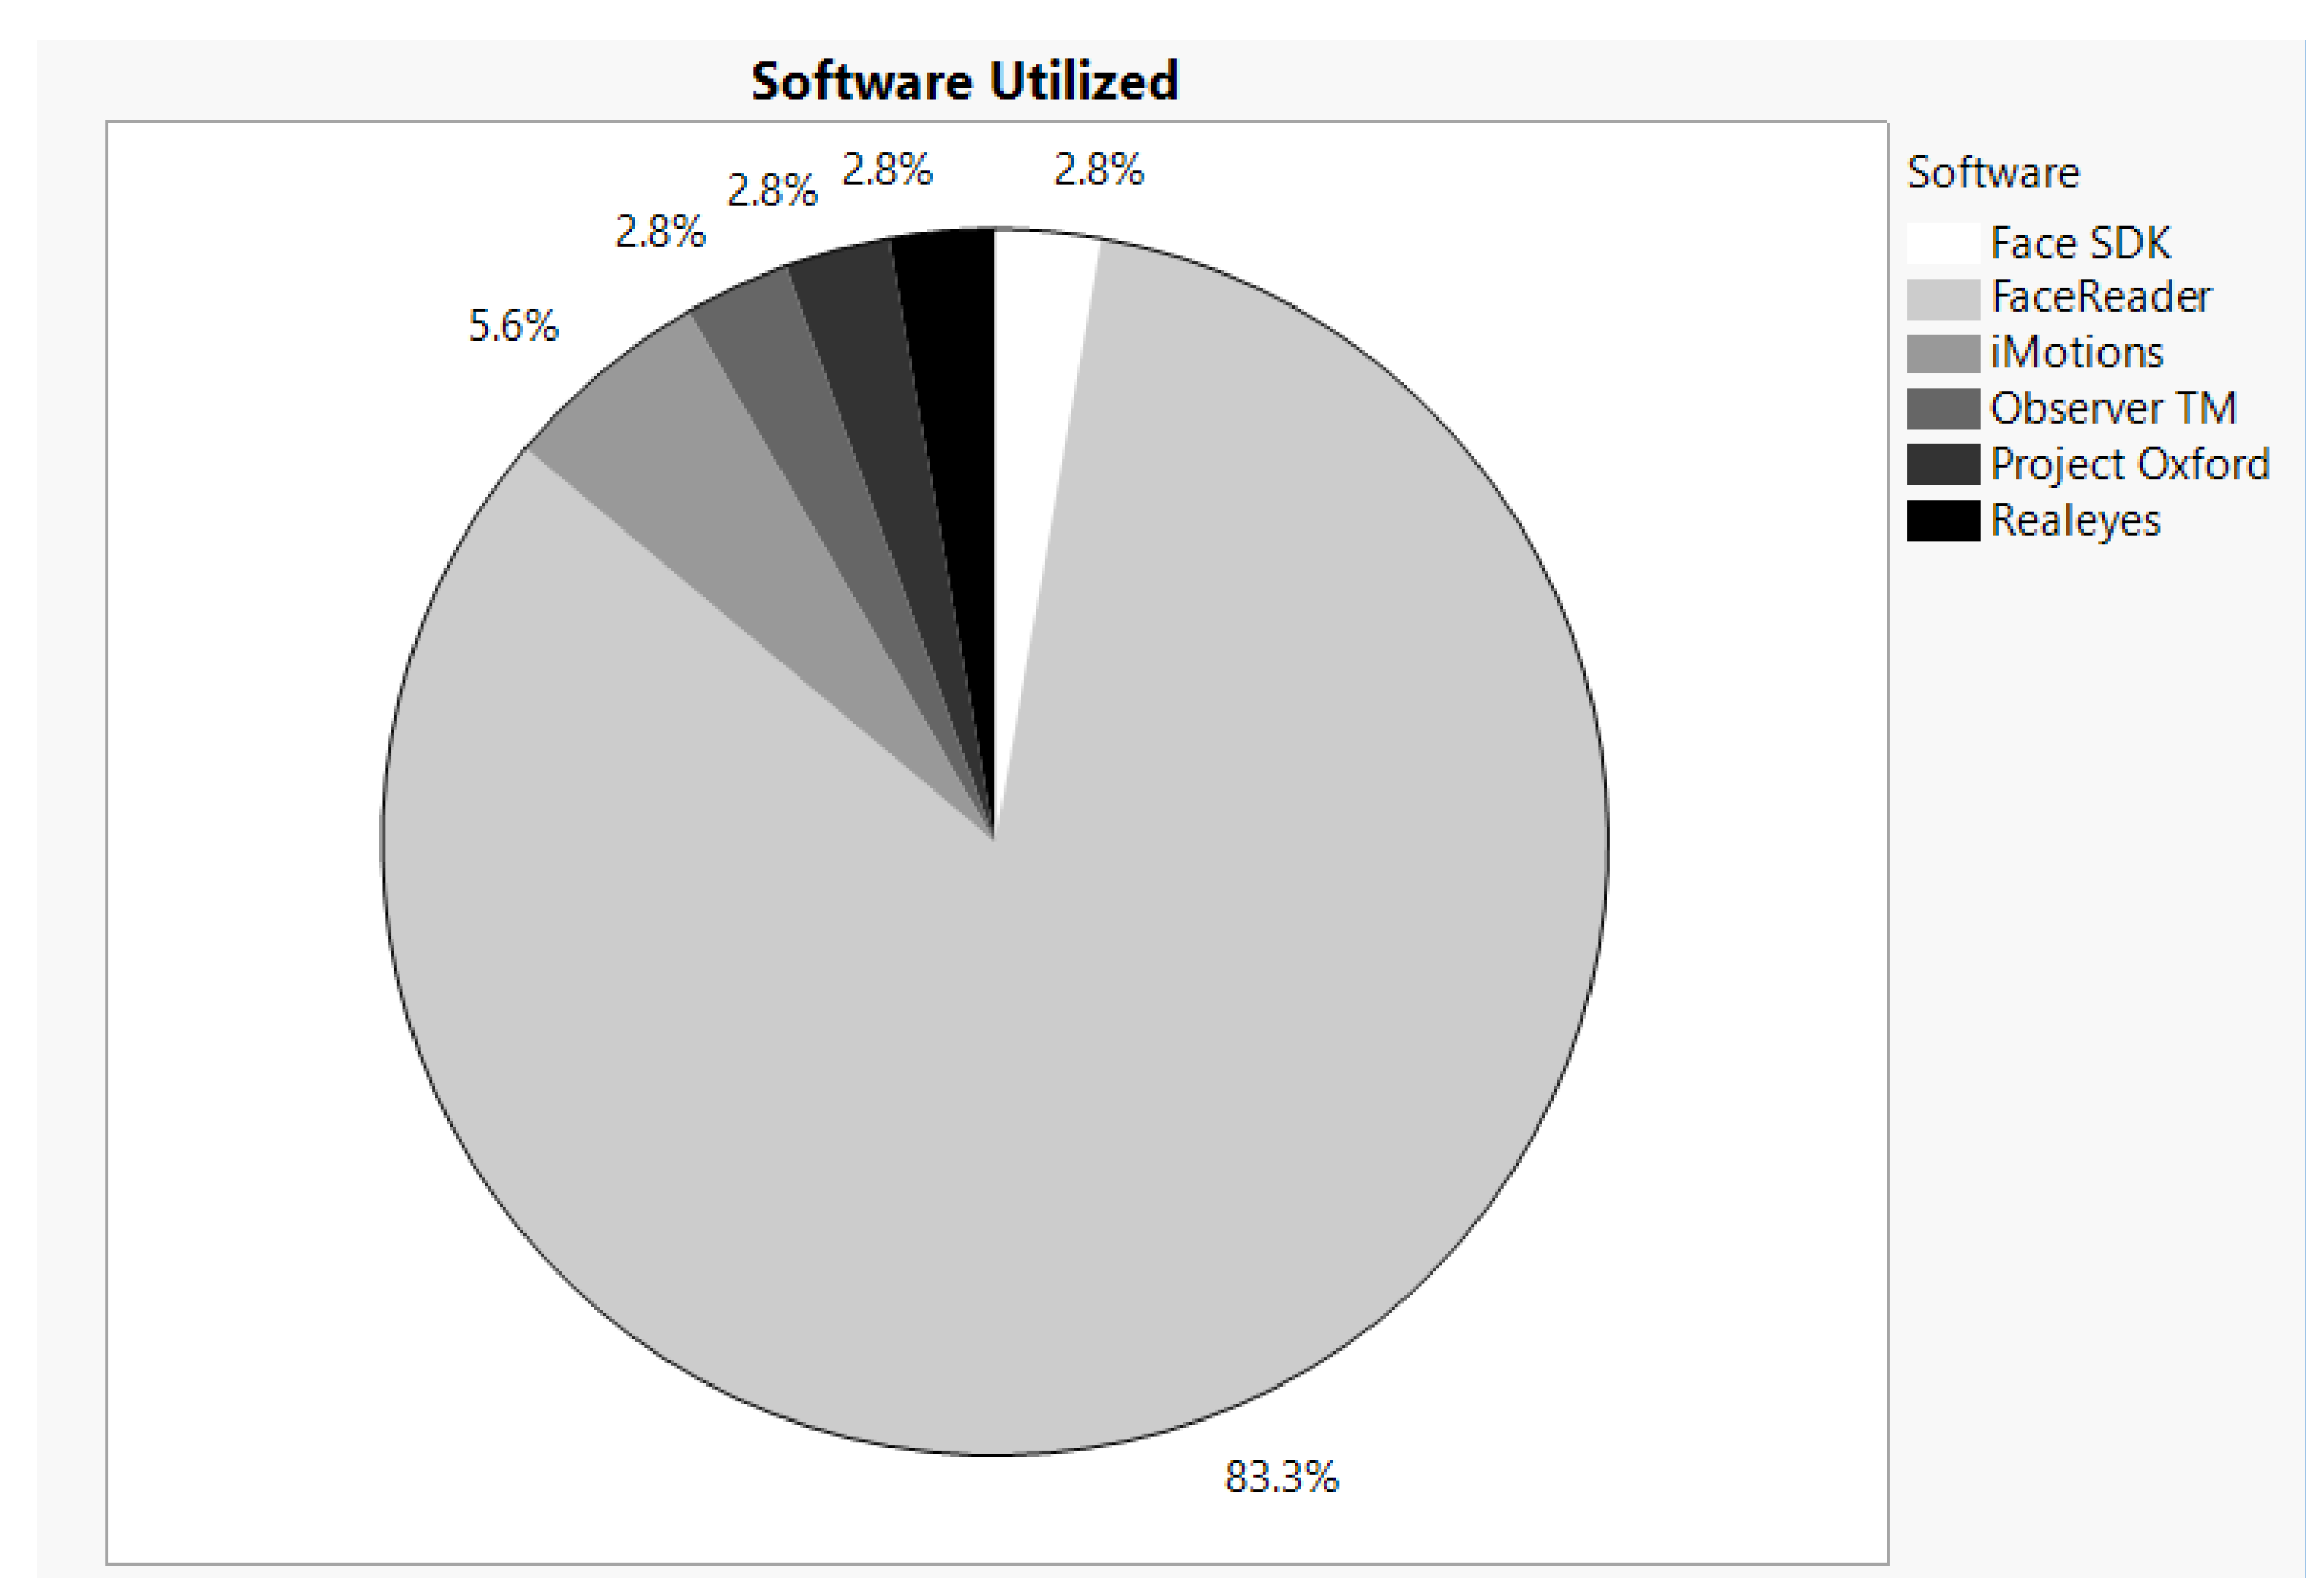
Table 1.
Commercially available automated facial expression analysis (AFEA) software as of December 2019.
Table 1.
Commercially available automated facial expression analysis (AFEA) software as of December 2019.
| A Sampling of Commercially Available AFEA Software | ||
|---|---|---|
| Affectiva [9] | CrowdEmotion [10] | EmoVu [11] |
| Face++ [12] | FaceReader [13] | FacioMetrics [14] |
| Findface [15] | iMotions [16] | Insight SDK [17] |
| Kairos [18] | Nviso [19] | Observer [20] |
| Project Oxford [21] | Realeyes [22] | SkyBiometry [23] |
Table 2.
Sources of food emotion and example stimuli for guidance of AFEA experimental design [29].
Table 2.
Sources of food emotion and example stimuli for guidance of AFEA experimental design [29].
| Source of Food Emotion | Example |
|---|---|
| Sensory attributes | Sweetness of beverage |
| Experienced consequences | Relief of thirst |
| Anticipated consequences | Health effects associated with soda |
| Personal or cultural meanings | Root beer reminds me of childhood |
| Actions of associated agents | Contempt towards those that consume water from disposable plastic bottles |
Table 3.
List of sources from the systematic literature review (in alphabetical order).
|
|
|
|
|
|
|
|
|
|
|
|
|
|
|
|
|
|
|
|
© 2020 by the authors. Licensee MDPI, Basel, Switzerland. This article is an open access article distributed under the terms and conditions of the Creative Commons Attribution (CC BY) license (http://creativecommons.org/licenses/by/4.0/).
Share and Cite
MDPI and ACS Style
Kessler, S.J.; Jiang, F.; Hurley, R.A. The State of Automated Facial Expression Analysis (AFEA) in Evaluating Consumer Packaged Beverages. Beverages 2020, 6, 27. https://0-doi-org.brum.beds.ac.uk/10.3390/beverages6020027
AMA Style
Kessler SJ, Jiang F, Hurley RA. The State of Automated Facial Expression Analysis (AFEA) in Evaluating Consumer Packaged Beverages. Beverages. 2020; 6(2):27. https://0-doi-org.brum.beds.ac.uk/10.3390/beverages6020027
Chicago/Turabian StyleKessler, Samuel J., Funan Jiang, and R. Andrew Hurley. 2020. "The State of Automated Facial Expression Analysis (AFEA) in Evaluating Consumer Packaged Beverages" Beverages 6, no. 2: 27. https://0-doi-org.brum.beds.ac.uk/10.3390/beverages6020027
Note that from the first issue of 2016, this journal uses article numbers instead of page numbers. See further details here.