Coffee Flavor: A Review


Center for Sensory Analysis and Consumer Behavior, Kansas State University, Manhattan, KS 66502, USA
*
Author to whom correspondence should be addressed.
Beverages 2020, 6(3), 44; https://0-doi-org.brum.beds.ac.uk/10.3390/beverages6030044
Submission received: 1 June 2020
/
Revised: 22 June 2020
/
Accepted: 3 July 2020
/
Published: 8 July 2020
(This article belongs to the Special Issue Current Reviews in Beverages - 2021)
Abstract
:Flavor continues to be a driving force for coffee’s continued growth in the beverage market today. Studies have identified the sensory aspects and volatile and non-volatile compounds that characterize the flavor of different coffees. This review discusses aspects that influence coffee drinking and aspects such as environment, processing, and preparation that influence flavor. This summary of research studies employed sensory analysis (either descriptive and discrimination testing and or consumer testing) and chemical analysis to determine the impact aspects on coffee flavor.
1. Introduction
The coffee market is currently worth USD 15.1 billion and growing. This market is mainly comprised of roasted, instant, and ready-to-drink (RTD) coffee [1]. The flavor of a roasted coffee brew is influenced by factors such as the geographical location of origin, variety, climatic factors, processing methods, roasting process, and preparation methods [2,3,4,5,6,7,8,9,10]. The differences in sensory properties can, in turn, affect consumers’ preferences for and emotions or attitudes toward coffee drinking [11].
1.1. Motivations for Drinking Coffee
As indicated by Phan [12], the motivations for drinking coffee can be grouped under 17 constructs: liking, habits, need and hunger, health, convenience, pleasure, traditional eating, natural concerns, sociability, price, visual appeal, weight control, affect regulation, social norms, social image [13], choice and variety seeking [12,14,15]. These motivational constructs have, however, been found to vary depending on location and culture, age group, gender, and mealtime [15,16,17,18]. Additionally, Rogers’ [19] earlier investigation into the precursors of consumers’ liking revealed that the feelings and emotions experienced when drinking coffee significantly influence consumer liking. In his study, people liked drinking coffee because it increased their feelings of relaxation, clear-headedness, and calmness while decreasing drowsiness. It was findings such as those that inspired the development of an emotion questionnaire for the coffee drinking experience that includes terminology such as happiness, activeness, alertness, and decreased depression among many others [20]. Chambers et al. [15] stated that for all mealtimes “liking” remains the leading motivation for eating and drinking foods (coffee included). However, today with consumers’ increased access to health benefit information via different types of media (print media, Internet, broadcast media, and outdoor media) that are designed to promote coffee drinking, the “Health” motivation construct appears to have gained more ground [21,22,23]. The physical and physiological health benefit claims include reduced risk of developing type 2 diabetes [24,25,26,27], reduced risk of heart and liver complications and reduced risk of certain cancers such as endometrial cancer, colon cancer [25,28,29,30,31,32,33]. Coffee is a source of antioxidants [25,34], therefore it may improve the short-term memory and maintenance of cognitive performance, work out performance [35], and may reduce the risk of developing diseases such as Alzheimer’s disease, gout, Parkinson’s disease [21,25,26,29,36]. A case in point of these benefits was shown in a longitudinal study by Marc [37], which involved a group of 226,732 women belonging to the Generation X and Boomers age groups who completed a baseline survey questionnaire that asked about their consumption behavior for regular and decaffeinated coffee. For an average of nine years, the researchers followed-up on the health data of the women. The findings showed that women that routinely drank coffee (either regular or decaffeinated) were less likely to suffer from endometrial cancer. Results from another longitudinal study (1995–2008) showed that coffee drinking was inversely related to deaths due to heart disease, respiratory disease, stroke, diabetes, and infections among men and women aged 50 to 71 years [38]. Naganuma [29] had earlier refuted beliefs that coffee consumers were more likely to suffer from oral, pharyngeal, and esophageal cancers as compared to those who did not consume coffee.
1.2. Sensory Characteristics of Coffee
Wang and Yu [39] suggested that consumers tend to form perceptions based on functional characteristics, packaging, branding, and sensory characteristics of coffee with the latter accounting for the major portion. Variations in sensory profiles of coffee can be attributed to several intrinsic and extrinsic factors. These factors include inherent differences in varieties, agronomic and environmental conditions, processing (primary, secondary and tertiary), storage, packaging, and brewing and serving. Table 1 lists sensory attributes used in various studies to describe coffee flavor.
General overall characteristics and specific sensory descriptors are the two criteria that are used to determine the sensory characteristics of brewed coffee [42,45,48,49,50,51]. General overall characteristics were developed by the Specialty Coffee Association (SCA) as part of the cupping “Q” and “R“ protocols for scoring Arabica and Robusta coffees” respectively [49,51]. Cupping is an evaluation practice commonly used in the industry to assess the aroma, taste, and flavor of brewed coffee based on general overall characteristics. Cupping is differentiated from descriptive sensory analysis by its use of industry experts who have coffee quality control experience and judge coffee quality on a quality scale. They are not trained sensory descriptive panelists who instead describe coffee in terms of character notes and do not judge quality per se. Cuppers use terminology provided in various coffee wheels to add notes to the coffee cupping profile while trained descriptive sensory panels use established sensory lexicons to refine and quantify sensory characteristics that describe a specific coffee product or product category.
The overall cupping characteristics include terms such as Fragrance/Aroma, Flavor, Aftertaste, Acidity, Balance, Body, Sweetness, Defects, Uniformity, Cleanliness, and Overall score. A final cupping score is attained by summing up all the scores for each characteristic and then subtracting the defects. It is the final score that is used to categorize a coffee as either Specialty or not Specialty. A study that evaluated Colombian brewed coffees using both cupping and descriptive sensory evaluation method found that the two approaches collected different types of information. Terminology consisting of 59 terms was developed by the descriptive panelists to profile the 13 Colombian samples while “Q”-grader/Star cuppers employed SCA’s overall characteristics and “descriptors” to assess the same coffees. The descriptive sensory analysis provided more detailed flavor profiles for the brewed coffees as compared to the information collected from the cupping sessions, but the cuppers’ information provided quality grading information that the descriptive panel did not. The cuppers’ information was reasonably consistent related to quality grading, but the cuppers were highly variable in terms of flavor evaluation [45].
Specific sensory descriptors are sensory characteristics that can explain variations in brewed coffees. The need for a tool to guide the descriptive evaluation of sensory characteristics of brewed coffees encouraged World Coffee Research and Chambers et al. [42] to develop the coffee lexicon for brewed coffee. A total of 110 sensory characteristics (aroma, flavor, and texture) and corresponding references were identified by a highly trained panel that evaluated more than 100 different coffee samples sourced from 14 countries. Furthermore, the researchers pinpointed 11 flavor characteristics recommended for the quick evaluation of coffees for research on genetic variations. These included characteristics such as Bitter (taste), Coffee Impact, Floral, Fruity, Green, Nutty, Roasted, Sweet (taste), Sour (taste), Sweet aromatics, and Woody flavor. They noted that other characteristics may be more important for other research purposes. Those authors noted that the lexicon should be considered “living”, in that additional specific defined terms will need to be added as new characteristics are noted, particularly those related to defects, which were not studied in that research.
Seo, Lee, and Hwang [40] developed a sensory attribute pool of brewed coffee that contained a total of 74 terms of which 33 were consumer verified as aroma descriptors, while 28 were descriptors for flavor. That lexicon is different from a conventional lexicon, which serves the purpose of guiding a trained panel in describing the sensory characteristics of all products. Instead, that lexicon [40] developed a sensory attribute pool to educate consumers and provide a lexicon source to be used by both trained panels and consumers to evaluate products that vary a lot in sensory characteristics. Similarly, to help product developers and sensory analysts effectively meet the needs of their coffee consumers in Japan, Hayakawa et al. [44] developed a list of 127 sensory descriptors. Thirty of these could be used in qualitative and quantitative coffee consumer studies, while 60 were considered more appropriate for descriptive sensory analysis research with untrained coffee professionals in the coffee industry in Japan. The process in which aroma attributes are developed as green coffee beans make their journey through the different processing stages (roasting, grinding, and brewing) was reported by Bhumiratana et al. [7]. A total of 15 aroma attributes were identified by the descriptive panel who evaluated the coffee brews that were prepared from coffees from El Salvador, Ethiopia, and Hawaii. Additionally, all stages that were investigated were found to significantly impact the aroma profiles. For example, green beans were mainly characterized by non-coffee-like aromas such as musty/earthy and green while the darker roasts produced brews that had higher intensities for coffee-like aromas and flavors such as coffee, roasted, and burnt/acrid.
Masi et al. [47] employed descriptive sensory analysis to categorize the sensory characteristics for brews made from under-roasted coffees into coffee- and non-coffee-like characteristics. The coffee-like group included terms such as burnt and bitter coffee while non-coffee-like groups included terms such as earthy, grassy, oats, and cereals. Other authors [43] have used a descriptive sensory lexicon to describe differences in coffees made with various brewing methods.
Bhumiratana et al. [11] used a descriptive sensory analysis of six coffee samples to identify 12 key sensory drivers for emotional responses that were experienced by consumers when they drank coffee. The 12 sensory attributes (based on aroma, flavor, and texture) included terms such as acidity, ashy, bitter, body (mouthfeel), burnt, citrus, cocoa, coffee, rioy (a coffee term describing “harsh taste”), roast, stale, and tobacco flavor. This information can be used to create different consumer segments that would allow for a more efficient and effective way of meeting their needs. For example, differentiating sensory properties of dark roasted coffee such as bitter taste, roast, and burnt aroma were associated with positive emotions, such as pleasant and content, while the acidity and citrus flavors in brewed coffee were associated with off-balance, a negative emotion.
1.3. Volatile and Non-Volatile Compounds of Coffee
The sensory characteristics of brewed coffee can be attributed to non-volatile and volatile compounds (e.g., pyrazines and pyridines [52]) that are produced during all phases of coffee production including growing, fermentation, roasting, and brewing processes. Arabica and Robusta green beans have different chemical compositions and consequently varying flavor profiles when roasted. Green and roasted Robusta coffee beans have a higher chlorogenic acid content than corresponding Arabica beans [2,53,54]. For example, Chlorogenic acids such as the feruloylquinic and caffeoylquinic acids found in Robusta roasted beans are 1.5 to 2 times higher in concentration as compared to those in Arabica beans [2,3,55,56]. During the coffee roasting process, the total chlorogenic acids are reduced to about 50% at the medium roast level and to small quantities at the dark roast level [2,53,57,58]. Chlorogenic acids contribute to the bitter taste, acidity, and astringent flavor of the coffee when it is brewed. Additionally, chlorogenic acids act as precursors to the formation of phenols and catechols [2,53].
During the coffee roasting process, the initial drying phase is mainly characterized by small endothermic reactions which lead to loss of free water, browning, and increase in volume. The moisture content of the roasted coffee ranges from 1.5% to 5% and this depends on the roasting degree attained. The sucrose in the beans caramelizes when their internal temperature reaches 130 °C which explains the yellowish color of the beans. With the bean temperature increasing beyond 160 °C, the color changes to light brown, and the beans further increase in volume [2,58,59]. The flavor formed is a result of the endothermic and exothermic reactions when the coffee beans reach a temperature of about 190 °C. Some of the free amino acids and peptides are used in the Strecker degradation process while other amino acids and sucrose are involved in the Maillard reactions, and this results in the bean color change from light brown to almost black. At this point, air or water is used to rapidly cool the coffee beans and consequently stopping the exothermic reactions [2,58,59].
Various compounds impact the bitterness of the coffee brew. Caffeine, a methylxanthine, is heat stable and has bitter sensory characteristics. Roasted Robusta beans contain two times the caffeine concentration contained in Arabica beans [2,3,60]. This accounts for a large proportion of the higher bitterness usually found in coffee brews made from Robusta beans.
Trigonelline, an alkaloid, also contributes to the bitterness of coffee brew. Unlike caffeine, trigonelline is degraded during roasting and produces nicotinic acid and other volatile compounds such as pyridines and pyrroles [55,60,61,62]. Trigonelline and proteins are broken down through Maillard reactions with sugars that are present in green beans to produce volatile compounds such as pyridines, pyrroles, and pyrazines (Table 2). The pyrazines, pyrroles, and pyridines are responsible for aroma attributes such as nutty, roasted, and toasted notes in the coffee aroma [3,4,5,8,9,58,63,64].
Dulsat-Serra et al. [81] discussed the impact of thiols on the aroma and flavor of both roasted coffee and coffee brew. For example, 3-methyl-2-buten-1-thiol, a thiol with a low aroma threshold, was expressed by a skunky odor in brewed coffee [78]. Further, 2-Furfurylthiol was characterized by fresh coffee aroma and roasted aroma, and the intensity of the aromas varied depending on the concentration of the pound [58,78,79]. On the other hand, Methanethiol that is present in higher concentrations in roasted and brewed coffee, as compared to other thiols, was also associated with fresh coffee aroma by McGorrin [79]. Hofmann and Schieberle [83] explained the staling process that occurs when roasted coffee is brewed. Quantification using stable isotope analysis and headspace analysis of volatile thiols and melanoidins which were followed by Liquid Chromatography-Mass Spectrometry (LC-MS) and Gas Chromatography-Mass Spectrometry (GC-MS) revealed that the concentrations of thiols such as 2-furfurylthiol declined as a result of thiols covalently bonding with melanoidins in presence of pyrazinium radical cations. This was shown by the decreased intensity of burnt, sulfurous, and roasty aroma of the coffee brew. Bernard et al. [84] conducted a similar study but used solid-phase microextraction followed by GC-MS (SPME-GC-MS), establishing that thiol degradation occurred mainly either through nucleophilic addition (requires oxygen) for aliphatic thiols such as methanethiol or through a radical process for benzylic thiols such as 2-furfurylthiol, as explained by [83].
2. Impact of Coffee Species (Arabica and Robusta)
Arabica green beans contain more sucrose than Robusta green beans. This sucrose contributes to the acidity of the coffee brew after roasting. In part, this is the reason Arabica coffee is marketed as a superior flavor as compared to corresponding Robusta coffee. The carbohydrates including the soluble polysaccharides are broken down during the roasting process to produce furans that explain the Sweet aromatics, Caramel, and Burnt aromas of coffee brew [63,87,88]. Lactic acids and acetic acids are responsible for the Fruity, winey, and Fermented aromas [3,63]. The high molecular weight polysaccharides present in the roasted beans are responsible for the viscosity (body) of coffee brew [2].
One study [41] reported that the species of coffee beans has a significant impact on the flavor profile of “cold brew” coffee. Those authors compared two samples each of Arabica and Robusta beans with one of each type being dry-processed while the other was wet-processed. This study reported that Robusta cold brews had higher intensities for aroma (a) and flavor (f) attributes such as woody (a), chocolate/dark chocolate (a), smoky (f), ashy (f), woody (f), burnt(f), acrid (f), musty/earthy (f), bitter taste, mouthfeel (f), bitter aftertaste, coffee ID, overall impact, and longevity as compared to Arabica coffee brews. Coffee ID or fullness is the foundation of flavor notes that gives substance to the coffee brew. The perception of robust flavor is rounded with the body of the coffee brew [42]. Conversely, Arabica cold brews had higher intensities for nutty (a), sweet aromatics (f), green (f), floral (f), fruity (f), fermented (f), sweet taste, and balance/blended as compared to brews from Robusta coffee. Green Arabica has been shown to contain significantly higher concentrations of diterpene alcohols such as kahweol as compared to green Robusta beans. Kahweol has been found to contribute to the bitter taste of roasted coffee and the subsequent brew [89,90].
Mondello et al. [91] used a combination of headspace solid phase microextraction and gas chromatography-mass spectroscopy (HS-SPME-GC-MS) analysis to determine the volatile compounds in Arabica and Robusta coffee samples from six countries. The results provided differentiation between Arabica samples (Costa Rica, El Salvador, and Brazil) and Robusta samples (India, Togo, and Vietnam) (note there is a species by country interaction). For example, Phenols such as guiacols (e.g., 2-Methoxyphenol) had significantly higher concentrations in Robustas as compared to Arabica samples. Additionally, pyrazines such as 2,5-dimethylpyrazine (nutty, roasted) and 2,6-dimethylpyrazine (cocoa, chocolate) had slightly higher concentrations in Robusta samples as compared to Arabica coffees. In contrast, furans such as 2-acetylfuran (sweet, balsam) and furfural (sweet, almond) had significantly higher concentrations in Arabica samples as compared to the Robusta samples [92]. Keidel [90] used Fourier Transform Raman spectroscopy to estimate the relative content of kahweol in six whole green Arabica and Robusta beans each. Kahweol is a diterpene alcohol that has been shown to contribute to the perceived bitter taste of brewed coffee in addition to other physiological effects. The average spectral kahweol indices for Arabica beans were significantly higher as compared to those of the green whole Robusta beans.
3. Impact of Coffee Variety
Yusianto et al. [93] compared six Indonesian Arabica coffee varieties (BP 416 A, BP 430 A, BP 432 A, BP 509 A, BP 542 A, and P 88) with three control samples (AS 1, S 795 and USDA 762) which were also varieties of Indonesian Arabica coffee. Differentiation among the different varieties was shown when the samples were assessed based on physical, chemical, and sensory characteristics such as flavor profile, bean size, the color of green and roasted beans, pH, and bulk density. For example, the control sample AS 1 along with varieties such as P88 and BP 542A were most differentiated from the other Arabica varieties by a fruity flavor. Another study [94] compared coffee brews of four varieties of Arabica beans (Catuaí, Caturra, Pache, and Catimor) that were grown in Peru. The coffee brews were prepared and evaluated by five coffee tasters based on four sensory characteristics (aroma, flavor, acidity, balance) according to the cupping protocols developed by the Specialty Coffee Association of America. Overall, Caturra attained higher scores for sensory characteristics such as aroma and flavor as compared to Catimor and Catuaí. Both Catimor and Catuaí had a more balanced flavor as compared to Caturra and Pache. Even more, Catimor had a significantly lower intensity of acidity as compared to the other three varieties. However, it is worth noting that the significant impact of the coffee variety that was realized could have been influenced by the interaction between coffee variety and altitude at which the coffees were grown. For example, two-way interactions between the Caturra and Pache varieties and altitude for acidity and balance sensory characteristics were found to be significant.
It is commonly claimed that the shape and size of the bean have a significant impact on the flavor of the coffee with the larger beans being more flavorful as compared to the smaller beans. It is also believed that similarity in the size of coffee beans allows for an even degree of the roast as compared to a dull roast with beans of varying sizes or grades [95]. The findings of Luna Gonzalez et al. [96] support this claim but also showed that this can vary based on the coffee variety. Their study involved eight trained cuppers who evaluated three Arabica Catimors (Colombia, Costa Rica, and Oro Azteca) that had been exposed to similar agronomic, post-harvest, and roasting conditions. Sensory evaluation was based on nine attributes in addition to the overall impression score using a 6 to 10 cupping scale with quarter-point increments. The results showed that for size 5.16 mm (13/64 inches) in diameter of Colombia, flat beans were rated higher than the corresponding peaberry; however, this was not the case for the other two varieties. The small size beans (5.16 and 5.56 mm) of Costa Rica and Oro Azteca that were not sorted by shape had higher intensities of acidity as compared to the bigger beans (5.95, 6.35, and 7.14 mm) of the respective varieties. There is a need for more descriptive sensory analysis research on the impact of bean size and shape with a highly trained panel that can provide for reproducibility and replicability of results.
Dong et al. [97] measured the caffeine, chlorogenic acids, and total protein content to compare seven varieties of Robusta green coffee beans that were grown in the Hainan province of China. Caffeine and chlorogenic acids are known to contribute to the bitter taste of roasted coffee brew while the proteins function as flavor precursors in Maillard reactions during the roasting process. Varieties X1 and RY2 were found to have significantly higher caffeine content as compared to other varieties such as RY1 and XCM. Additionally, the XCM variety had a significantly higher crude protein content as compared to the RY1 variety that had the least among all seven varieties. Furthermore, with regards to chlorogenic content and 5-CQA in particular, varieties X28 and RY2 contained higher concentrations of 5-CQA as compared to other varieties such as XCM, RY1, and X24-2.
4. Impact of Environment
4.1. Impact of Climatic Factors
Several studies have examined the impact of macro- and microclimates on coffee. Barbosa et al. [98] reported the findings of cupping evaluation that was conducted during a Minas coffee quality contest that involved a total of 60 coffee samples that were assessed based on nine general overall characteristics that were developed by SCA. The coffee samples were sourced from four regions in Brazil (Cerrados de Minas, Chapadas de Minas, Matas de Minas, and Sul de Minas) that varied in microclimates (rainfall, humidity, temperature, altitudes). Coffee brew samples that received high cupping scores were most differentiated from the rest by the temperature of the regions and non-volatile compounds such as caffeine and trigonelline while brews that had low cupping scores were most differentiated by factors such as humidity index, rainfall and chlorogenic acids (5-CQA).
One study [68] determined the impact of climatic factors on volatiles in green coffee grown on Réunion Island (a department of France in the Indian Ocean). A single variety of Arabica seeds were grown on 16 plots that varied in altitude (150 m to 1032 m) and other environmental conditions such as temperature and rainfall received. Chemical analysis was conducted to determine the sugar, caffeine, chlorogenic acid, and lipid content of both the freshly harvested and wet-processed beans. Results showed that coffee beans from trees grown at higher altitudes had higher glucose content as compared to those that were grown on a lower altitude [98,99,100]. Even more, the glucose content in the fresh cherries influenced the sorbitol content found in the green beans after wet processing [10]. The mean air temperature during bean development was also found to be critical. Volatiles such as ethanal and acetone that were identified with samples from cool plots had intensities of acidity and fruity flavor characteristics. Conversely, volatiles such as aldehydes and ketones that are associated mostly with earthy and green aromas were identified at higher levels among green coffee samples from plots with elevated temperatures [71]. However, this is not always the case. Donfracesco, Guzman, and Chambers [101] explained that although factors such as geographical area, storage methods, and conditions, farming practices have been shown to influence the perceived intensities for flavor attributes such as acrid, burnt, metallic and sour taste and sweetness of the brewed coffee, the impact could be limited by the proximity of the farms from which the cherries are picked.
Certified organic and shade-grown coffees are known to fetch a higher price compared to conventionally grown coffees. Studies have revealed that while consumers often perceive organic coffees as healthier, consumers usually prefer to purchase shade-grown coffees based on different food values such as emotional attachment and origin but not nutrition or sensory experience gained from consumption of this kind of coffee [102,103]. According to Santos et al. [104], Arabica coffee trees that were exposed to high temperatures (above 23 °C) were characterized by a faster rate of ripening of the coffee cherries per the available resources for photosynthesis and produced immature green coffee beans. The immature coffee beans (defective beans) had significantly higher levels of sucrose, trigonelline, and chlorogenic acids and had a more bitter and astringent flavor profile as compared to beans from shade-grown trees that had lower levels of sucrose and higher levels of reducing sugars [105]. Krol et al. [106] used High-Performance Liquid Chromatography (HPLC) analysis to compare the bioactive compounds of organic coffee and conventional Arabica Brazilian coffee. The study showed that organic coffee beans contained higher concentrations of total phenolic, phenolic compounds (e.g., caffeic and chlorogenic acids), and flavonoids as compared to conventional coffee beans. Currently, research on the impact of shade-grown coffees and organic farming on the flavor of coffee is limited.
4.2. Impact of Coffee Origin
Yener et al. [76] used Proton Transfer Reaction-Time of Flight-Mass Spectrometry (PTR-ToF-MS) to analyze the headspace of brewed and roasted and ground Arabica coffee from Brazil, Colombia, Costa Rica, Ethiopia, Guatemala, and India. It was found that the coffee origin (location) had a huge impact on the volatile compounds of both the brewed coffee and the coffee grounds. For example, Colombian coffees were most differentiated by higher concentrations of sulphur compounds such as dimethyldisulfide (cabbage-like aroma) while African (Ethiopia) was most identified by higher concentrations of monoterpenes (citrus-like aroma). These findings supported an earlier study by Yener et al. [107] in which PTR-ToF-MS was used to analyze the headspace of three roasted and ground medium roasted Arabica coffee samples (Brazil, Ethiopia, and Guatemala). The ground coffee from Brazil had significantly higher concentrations for volatile compounds such as Ethyl-dimethyl-pyrazine (pyrazine), and 2-acetyl-1-ethylpyrrole (pyrrole) as compared to the samples from Ethiopia and Guatemala.
Another study conducted by Keidel [90] that used Raman spectroscopy to discriminate between different green coffee beans showed that the Brazilian Arabicas on average had a higher concentration of as kahweol compared to Arabicas that were sourced from Kenya. Toledo et al. [86] reported another study that compared the volatile compounds of different Arabica coffee samples Yunnan (China), Sidikalang, and Sidikalang Kopi Luwak (Indonesia), and Doi Chang (Thailand). A combination of Flame Ionization Detector (FID) with GC-MS and HPLC were used to analyze and quantify the chemical compounds from the coffee sample extracts. Coffee extracts from Yunnan (China) were found to have higher concentrations of p-vinylguaiacol (phenol) and 2-furfurylthiol (thiol) as compared to any of the other coffee sample extracts [108]. One study [8] used the dynamic headspace (SPME) sampling method and GC-MS analysis to compare the volatile compounds of roasted Indonesian and Vietnamese Robusta beans. At both light and medium roasting degrees, pyrazines such as 2-ethyl-6-methylpyrazine (flowery, fruity) and 2-ethyl-5-methylpyrazine (coffee-like) had higher concentrations in the Vietnamese Robusta as compared to the Indonesian Robusta. On the other hand, pyridine had higher concentrations in the Indonesian Robusta as compared to the Vietnamese Robusta.
5. Impact of Age (i.e., Plant and Cherry Age and storage of Green and Roasted Beans and Coffee Grounds)
5.1. Impact of the Level of Cherry Maturation
According to Setoyama et al. [109], a total of nine Arabica coffee cherry samples were each harvested and grouped into four stages—namely, immature, semi-mature, mature, and overripe—based on their color. The cherries were wet-processed and dried to produce green beans which were analyzed by liquid chromatography-mass spectrometry (LC-MS) to develop metabolic profiles. One of the chemical compounds found was tryptophan. This amino acid was consequently identified by a partial least square regression model to be closely associated with immature beans as compared to the later stages of cherry development such as mature and overripe [109].
These results build on earlier findings by Montavon et al. [110] who indicated that, although immature beans had initially higher concentrations of amino acids (proteins) and chlorogenic acids (phenolic compounds), they experienced higher losses of the same due to oxidation and aerobic incubation, respectively. This study was aimed at determining the impact of the coffee cherry level of maturation on the sensory and biochemical properties of brewed Robusta coffee. The three stages of maturation that were considered included the green mature (light-green pericarp), red ripe (yellow-orange to red pericarp), and the over-ripe (dark-red to brown pericarp). Overall, the flavor quality of the coffee brews was shown to increase with the increase in maturation when the brewed coffee was evaluated by trained tasters who conducted the assessments based on a total of 11 flavor attributes (coffee (a), moldy/musty (f), bitter taste, Robusta (f), body, rubbery (f), green (f), chemical/phenolic (f), fermented (f), earthy (f)).
5.2. Impact of Shelf Life
Lyman, Benck, and Merle [111] employed cupping protocols to compare the flavor profiles of wet-processed single-origin Arabica that was subjected to two drying methods and kept in storage for a year. The brews of the fresh green beans were described as sweet with orange-like acidity. Furthermore, the brews from the cherries that were mechanically dried had a lighter body and were less intense in flavor as compared to the sun-dried coffee brews. However, a year later, mechanically dried beans produced brews that were characterized by reduced acidity, woody flavor, and dry cloying aftertaste, while the sun-dried beans maintained a heavy body, sweet taste, and orange-like acidity. Fourier Transform Infrared Spectroscopy results on the aged and fresh green beans showed that oxidation and enzymatic degradation of unsaturated compounds that occurred in the green beans over the 12 months could be attributed to the reduced concentrations of key volatile compounds such as the esters and aldehydes that are produced during the roasting process.
These results supported the initial findings of Selmar et al. [112], who indicated that germination processes—such as enzymatic reactions (the breakdown of carbohydrates) and lipid oxidation reactions—in addition to the stress metabolism that the green beans were exposed to during the post-harvest practices such as drying and storage, produced chemical compounds that influenced the flavor profile of the coffee brew [85]. Rendon et al. [113] determined the impact of chemical reactions such as lipid oxidation on the sensory characteristics of natural and pulped natural coffee beans that were stored for 15 months. Brews for coffee beans that had been stored for 15 months were characterized by a higher intensity for woody and stale flavors and lower coffee flavor as compared to the fresh beans that had a higher coffee and green tea flavor [85].
Manzocco and Lagazio [114] also reported that the flavor profiles of ground coffee evolve while coffee is left on the shelf. In their study, a trained descriptive and discriminative sensory panel evaluated dark-roasted coffee over six consecutive days, assessing flavor attributes such as acidity, bitterness, and off-flavor, of which acidity attained the greatest impact. The acidity of the coffee that was shown by an increase in sour taste strongly and positively correlated with the hydrogen ion concentration of the brews over the six days. According to Kreuml et al. [115], the sensory characteristics of brewed coffee were influenced by how long it had been stored (freshly roasted, 9 and 18 months) after roasting. A team of 10 trained assessors used quantitative descriptive analysis and based on 30 sensory characteristics to evaluate the brew of two coffee samples that were vacuum packed and stored after roasting. The assessors found that the sensory profiles of the coffee samples changed over time. For example, characteristics such as sourness and bitterness, staleness, woody significantly were more abundant in the 18-month coffee brews as compared to the fresh brews. Conversely, sensory characteristics, such as brew-like (aromatics associated with freshly brewed roasted coffee) and roasty, significantly decreased in both coffee samples across the 18 months of storage. With the caffeine concentration shown to have increased in the stored beans (12 months in storage), Krol et al. [106] supported [115] that the bitterness of coffee brews increased the longer the beans were kept in storage.
6. Impact of Processing
6.1. Impact of Fermentation
The use of starter cultures in semi-dry processing was identified by [6] as one way of establishing coffees with consistent flavor profiles. Starter cultures of yeasts such as Saccharomyces cerevisiae were found to produce coffee beverages with a caramel flavor as compared to the control to which no yeast strain was added. These results correlated with the findings of [70], who conducted inoculated fermentation with starter cultures of Pichia fermentans during the wet processing of coffee beans. The coffee beverage from these beans was characterized by flavor attributes such as vanilla and floral aroma. According to Kim et al. [52], who used solid-phase micro-extraction (SPME) and GC-MS to analyze green and roasted beans, found a significantly higher proportion of pyrazines and pyridines in fermented coffee beans as compared to the unfermented roasted coffee beans. Additionally, the coffee cherry fermentation process was reported to produce several chemical compounds such as aldehydes, esters, alcohols, and ketones which have a significant contribution to the aroma and flavor of the roasted beans and coffee brew [85,116].
Lyman et al. [111] used both cupping and Fourier Transform Infrared Spectroscopy (FTIR) spectroscopy to determine the impact of different levels of fermentation on the flavor profiles of brewed coffee. Coffees that were subjected to the standard washing process (36 h in a fermentation tank) when cupped were found to be sweet with a pointed acidity, medium body, and clean finish in addition to chocolate cocoa and malt flavors. On the other hand, pulp naturals (sun-dried immediately after depulping) had a heavy body and lasting sweet fruity flavor and dark-fruit flavor with significantly low acidity as compared to the washed coffee. The spectroscopy results indicated that the pulp-naturals overall had a higher number and concentration of volatile compounds such as lipid esters as compared to washed coffees. This would explain the higher intensity of body and lasting flavor. Even more, an intricate mix of volatile compounds such as lactones, esters, and aldehydes produced the dark fruit flavor that was observed with pulp naturals. Based on these findings, roasters and coffee baristas among other factors may need to also take into consideration the levels of fermentation (non-fermented, pulp-natural, standard washed) when sourcing green beans if they are to effectively and efficiently meet the needs of the final coffee consumer (heavy body vs. light/medium body, fruity vs. no fruity flavor of brewed coffee).
6.2. Impact of Defective Beans
In Brazil, two studies were conducted to explore the potential use of volatile compounds that are unique to defective beans as identifiers to increase efficiency in the control of quality for export-ready green coffee beans. Toci and Farah [67] analyzed both raw and corresponding roasted coffee beans from two lots each that contained healthy or sound beans and defective beans (black, green, or immature, sour) in varying proportions. SPME and GC-MS Analysis were used to develop volatile profiles for defective beans. For the raw beans, black-immature beans were differentiated by compounds such as 2-methylpyrazine and 2-furylmethanol acetate while sour beans were differentiated by gamma-butyrolactone. Benzaldehyde and 2,3,5,6-tetramethylpyrazine were associated with all defective raw beans. However, when the defective beans were roasted, the markers that they were identified with included volatile compounds such as isopropyl p-cresol sulfide,2-methyl-5-(1-propenyl)pyrazine, hexanoic acid, 4-ethyl-guayacol, and 2,3-butanediol.
Agresti et al. [68] conducted a similar study (SPME and GC-MS analysis) but only roasted coffee and identified five volatile compounds that were associated with defective bean samples. These markers included compounds such as 1,5-Dimethyl-2-pyrrolecarbonitrile, Benzene acetic acid, 2-Isoamyl-6-methylpyrazine, methyl ester, 1H-pyrrole, and 4-Methylthiazole. Additionally, a hierarchical cluster analysis showed that black beans could be attributed to fermentation of immature beans, whereas sour beans resulted from the fermentation of sound beans. The association of black beans with immature beans that was indicated by [67,68] was later confirmed by Belay et al. [117] who differentiated between defective beans (black, sour, and immature) and healthy coffee beans based on their physical attributes. Their results showed that full sour beans had higher mass and volume as compared to the full black beans. Additionally, all defective beans were found to have a higher percentage of moisture content on a dry basis as compared to the healthy beans. These findings together with those of [67,68] can be used by coffee regulatory authorities in producing countries such as Brazil and Uganda to control the quality of the green beans.
6.3. Impact of the Drying Process
Lyman et al. [111] also used FTIR analysis and sensory analysis to investigate the impact of drying methods on the flavor attributes of brewed single-origin wet-processed Arabica coffee cherries. The cupping results for sun-dried and mechanically dried wet-processed coffee revealed that the brews were characterized by sweet, juicy, orange-citrus flavor. The mechanically dried brews had a lighter body and were less intense in flavor as compared to the sun-dried coffee brews. The sensory evaluation (cupping) findings were explained by the spectroscopy results that attributed the higher flavor intensity of the sun-dried coffee brews to higher concentrations of aldehyde and lipid ester compounds.
6.4. Impact of Roasting
The roasting process is also responsible for the development of key coffee-like sensory characteristics such as roasted flavor and aroma, coffee identity, burnt, bitterness [7,42,46]. The volatile and non-volatile chemical compounds that are produced as a result of Maillard, pyrolysis and Strecker degradation reactions during roasting contribute significantly to the perceived sensory characteristics of the coffee brew [85]. The intensity of these characteristics can vary depending on the degree of roast attained by the beans. A study investigated the characterization of flavor compounds that are released during grinding of roasted coffee. The results suggested that variation in the volatiles can be based on origin and species variety in addition to the degree of roasting [8]. Seninde et al. [41] confirmed the findings of [8] and also showed that dark roasted coffees produced brews that had higher intensities for flavor attributes such as sweet aromatics (a), fermented (a), smoky (f), ashy (f), woody (f), roasted (f), acrid (f), bitter taste, bitter aftertaste, coffee ID, Overall Impact, and longevity as compared to corresponding medium roasted beans.
According to Shibamoto and Moon [69], the higher intensities of the majority of these flavor properties that were found in the dark roasted coffee brews could be explained by the significant increase in the concentrations of volatile compounds such as lactones, phenols and chemical compounds produced as a result of degradation of chlorogenic acid. On the other hand, the brews of medium roasted beans had higher intensities for flavor attributes such as cocoa (a) and balanced or blended. Additionally, [69] identified volatile compounds that were most associated with the different degrees of roasting. For example, furfuryl alcohol, and 5-furfural were found in light roasted beans, while 5-furfural, furfuryl alcohol, and gamma-butyrolactone identified with medium roasted beans. Even more, city roasted beans were most differentiated by gamma-butyrolactone, furfuryl alcohol, and 2-acetylpyrrole, whereas the French roasted beans were characterized by the presence of catechol, and gamma-butyrolactone, furfuryl alcohol. The researchers concluded that coffee samples roasted at lower degrees of roasting contained higher concentrations of furanones and furfural derivatives, but the concentrations of pyridines and pyrroles were lower as compared to corresponding samples, and vice versa.
Masi et al. [47] reported that when under-roasting coffee, an increase in temperature (above 150 °C) consequently increased the intensities of the coffee-like attributes such as burnt and bitter taste and a decrease in the non-coffee-like attributes such as earthy, grassy and nutshell.
6.5. Impact of Steam Pressure Treatment
According to [9], steam pressure treatment (5 bar/16 min) improved the flavor profile of roasted coffee by decreasing its levels of the negative flavor compounds such as 2,3-diethyl-5-methyl-pyrazine (moldy aroma), methional (potato-like aroma), and isovaleric acid (rancid, cheesy aroma). This treatment also increased the content of the positive flavor compounds such as maltol (caramel-like), and 2,6-dimethyl pyrazine (cocoa, toast nuts, and roasted meat). A potential application of defective beans in coffee brewing by baristas and product developers in the food industry was demonstrated when a blend of 30% steamed coffee and 70% Arabica beans were well-liked in a consumer test. This practical application was supported by [118] a case where brews from blends containing 50% steamed defective coffee was well-liked by consumers. This study, however, noted that the intensities of the flavor attributes of the blended coffee were lower as compared to those of the unblended coffees.
7. Impact of Brewing and Serving
The preparation of coffee can vary depending on many different factors such as origin and species variety of the roasted coffee beans, roasting degree, ground level of the bean, coffee to water ratio, temperature, length of contact time, and level of agitation during the extraction process [8,43,64,119,120]. These several factors have been shown to affect consumer acceptability or preference and the descriptive flavor profiles of brewed coffee. Researching the effects of different brewing methods and appliances on the sensory profiles of coffees can help coffee companies have a better understanding of the products they market and what type of consumer group(s) they should be marketing to [43,121,122]. The high temperature usually used in the extraction process increases the volatility of several of the chemical compounds that account for the flavor attributes in coffee [2,123,124,125].
7.1. Impact of Grinding
Particle size reduction through grinding was shown to increase the availability of a wide range of volatile and non-volatile compounds of roasted beans during coffee brewing [8]. Grinding increases the contact surface for the roasted beans during the extraction process which improves the permeability of flavor chemicals into the water. Cordoba et al. [126] evaluated two Colombian specialty coffees to determine the impact of grinding (medium and coarse) on the chemical compounds and flavor attributes of cold-brewed coffee. Grinding was found to have a critical impact on the extraction yield, and other aspects that influence the flavor of cold brews such as total phenolic content and total dissolved solids. For example, cold brews from coarse grounds were characterized by a higher concentration of total dissolved solids and a higher percentage of extraction yield as compared to cold brews prepared from medium-level grounds. The authors ascribed these findings to the indirect immersion cold brewing method (coffee grounds were placed in a filter bag that was placed in a holding container with water for a pre-set time) that was used. The brewing method when used with coarse grounds (larger particle size) allowed for increased diffusion and mass transfer during the coffee extraction process which was not the case for the medium-grind coffee particles.
According to Fuller and Rao [127], medium and coarse ground coffees produced cold-brews that had similar concentrations of caffeine and chlorogenic acids. However, this contradicts with Lee, Kim, and Lee [128] who investigated the impact of reversed grinding on the volatile compounds of coffee. When compared to beans that had been conventionally processed (roasting then grinding), reverse ground coffee beans (grinding then roasting) were found to produce coffees that had higher proportions of trigonelline and volatile aldehydes such as benzaldehyde that was characterized by an intense sweet bitter almond aroma. This suggests that the flavor properties of brewed coffee from these two grinding approaches could be different.
7.2. Impact of Coffee to Water Ratio
A descriptive sensory analysis of cold-brews made using 80 g/L and 120 g/L coffee to water ratios showed that cold brewing using the coffee to water ratio (C2WR) recommended by the International Organization for Standardization [129] (80 g/L) produced brews that were more balanced or blended with a more intense nutty flavor as compared to corresponding coffees that were cold-brewed using a higher C2WR (120 g/L). However, as expected, cold-brews with a higher C2WR were characterized by a stronger bitter taste and aftertaste and by higher intensities for flavor attributes such as mouthfeel, coffee ID, overall impact, longevity, roasted (a) (f), chocolate/dark chocolate (f), cocoa (a), fruity (a), fermented (a), smoky (f), ashy (f), woody (f), and fermented (f) [41]. These results support earlier research by Andueza et al. [130] that showed that espresso coffee (EC) brews with a high C2WR were more bitter and had higher intensities for burnt, roasted, acrid, and fermented flavors as compared to espresso coffee made with a low C2WR.
7.3. Impact of Brewing Method
According to Sanchez and Chambers [43], brewing methods produced brews that had varying aroma and flavor profiles. The infusion method used in coffee grading was the most different from the other brewing methods showing higher intensities for roasted, burnt, and acrid aromas and flavors. In that study, a highly trained sensory descriptive panel compared three high-quality Columbia coffee samples using four different methods of appliance preparation: an average consumer drip coffee maker, an automated espresso machine, a “cupping” process typical of coffee graders, and a filtered infusion approach. The water temperature, level of grind, and ratio of coffee ground to water were controlled and kept constant to prevent variability in differences in intensity of flavor and aftertaste attributes. These trained panelists evaluated for aroma, flavor, and aftertaste attributes for all the samples and methods of brewing.
As expected, those different coffee samples and different brewing appliance methods were almost all significantly different in terms of attributes. Results showed that flavor and aftertaste of each coffee sample depended heavily on the method of preparation. Consumers and restaurants use various methods, including ones not studied by those researchers such as cold brew and espresso; therefore, the final consumer-made coffee can have a markedly different flavor to barista-made coffee.
An investigation into the impact of brew basket geometry on the flavor profile and consumer acceptance of drip-brewed coffee showed that even such issues such as the shape of the drip container can impact coffee flavor [91]. Two specialty samples with one lightly roasted and the other dark roasted were each ground to three different levels of particle size (0.8, 1.0, and 1.2 mm) and brewed using a flat-bottom brew basket and a semi-conical brew basket. The brewed coffees were subjected to discrimination tests, descriptive sensory analysis, and consumer tests and Total Dissolved Solids (TDS). The discrimination tests showed that the brews from the flat-bottom and the semi-conical baskets were different. The semi-conical basket produced a coffee brew that had a significantly higher proportion of TDS as compared to the flat-bottomed basket. Based on the 26 flavor terms that were evaluated during descriptive analysis, brew basket geometry was found to interact with the roast degree and grind level for a total of seven flavor terms. The flavor terms that had these two interactions also were the drivers of liking for the consumers, and these included terms such as bitterness, berry flavor, burnt wood/ash, citrus flavor, earthy flavor, sourness, and floral aroma. These findings suggest that to maintain consistency, baristas need to consider the geometry of the brew basket in addition to the roast degree and grind level of roasted beans when preparing drip-brewed coffees [121].
One study [131] used HS-SPME-GC-MS to determine the impact of temperature (88, 92, and 98 °C) and pressure (7, 9, and 11 bar) on the sensory characteristics of Espresso coffee (EC). Two coffee samples were described based on 10 volatile compounds (six linked to positive aromas and four linked to negative aromas). Both pressure and temperature had a significant effect on the espresso flavor that was developed. For example, when the water temperature was 92 °C, the EC produced had the least negative aromas and highest positive aromas. As for the pressure, 9 bar produced an EC with a significantly higher intensity as compared to 7 and 11 bar pressures.
Another study [132] examined Caffè Firenze (CF), an espresso brewing method, to establish the effect of temperature (75, 80, and 85 °C) and pressure (15 and 20 bar) on the physical and chemical properties of the EC. CF is more flexible (provides control of the temperature of the extraction chamber), a static way of preparing Espresso coffee that uses a higher pressure as compared to the traditional espresso brewing method. EC that was produced by CF had a higher viscosity and a more persistent and greater foam as compared to EC made using the capsule method (benchmark). Furthermore, for CF, concentrations of volatile compounds such as pyrazines (e.g., 2-ethyl-3 6-dimethylpyrazine and 2-ethyl-6-methylpyrazine) and phenols such as guaiacol increased with each rise in temperature. Similarly, headspace concentrations for 4-vinyl guaiacol and 3-hexanone increased with an increase in temperatures. In contrast, the pressure did not have a significant impact on the volatile compounds of EC.
Gloess et al. [133] compared nine hot coffee brewing methods using descriptive sensory analysis. The brewing methods included EC and lungo from a fully automatic coffee machine, EC and lungo from a semi-automatic coffee machine, EC from a single-serve capsule system, lungo prepared with French Press extraction, lungo extracted with a Bayreuth coffee machine, mocha made with a percolator, and filter coffee. A trained sensory panel of seven evaluated the coffee brew samples based on six flavor and four aftertaste attributes. The findings showed that EC that was prepared using either a fully automatic machine or semi-automatic machine had the higher intensities for roasty aroma and overall aroma intensity as compared to the Lungo coffee that was prepared using either filter coffee or Bayreuth coffee machine. As expected, EC brews were characterized by higher intensities of roasty flavor and a more bitter taste and aftertaste while Lungo coffees (those made with filter coffee and Bayreuth coffee machine) were more balanced in flavor.
Much as roasted coffee is usually brewed using hot water to make its flavor compounds more soluble, it can also be cold brewed. Cold brew coffee is brewed by utilizing time to extract the flavor compounds of roasted coffee grounds. This slow extraction occurs over a longer time as compared to any hot brewing method which is believed to improve the retention of the flavor compounds [120,123,124]. The full-immersion cold brewing method relies on dispersion and diffusion to extract the soluble components from the coffee grounds into the water while the slow- or cold-drip method relies on increased agitation and increased surface area of the coffee grounds for extraction [134]. Cold brews are usually marketed as more flavorful, smoother, and less acidic than the hot-brewed coffees that are produced using the traditional brew process [135,136,137].
A comparison between full-immersion and slow-drip cold brewing methods was recently reported [122]. Those authors conducted physical, chemical, and sensory analysis on a single batch of coffee that was cold brewed using the two commonly used methods at two brewing temperatures (5 and 22 °C). The fully immersed coffees were steeped for 3 and 6 h while the slow-dripped coffees had grounds–water contact times of 1 drop/5 s and 1 drop/10 s. A French press brewed (hot brewed) benchmark was also prepared at 95 °C and extraction of coarse grounds lasted for 5 min. The dripped brews that were more bitter with a higher astringency and overall intensity of odor as compared to steeped brews and the benchmark (French press). These findings were validated by chemical tests that showed a higher caffeine concentration in the cold drip brews as compared to those that were brewed by full-immersion and French press. On the other hand, fully immersed brews had a sweeter taste as compared to the slow-dripped brews and those brewed using the French press. Though an increase of temperature from 5 to 22 °C was found to increase the intensity of the flavor attributes, a significant interaction between brewing temperature and contact time was realized.
Seninde et al. [41] also evaluated cold-brewed samples that were prepared using the steeping and dripping methods. The four samples (2 Arabica and 2 Robusta) were roasted to medium and dark roasting degrees and the brews were evaluated based on 42 attributes by a trained descriptive sensory panel of five. Similar to the findings of [122], the slow-drip brew was more bitter and had a higher intensity for astringency as compared to the brews prepared by full-immersion. However, although all aspects (coffee variety, degree of roasting, coffee to water ratio, and brewing method) that were investigated were found to have a significant impact on the sensory properties of cold brews, their effects were mitigated by their interaction with other factors. This was evidenced by the significant two-, three-, and four-way interactions among the four aspects investigated. This further highlights the need to consider sample combinations when evaluating the flavor quality of cold-brewed coffee.
7.3.1. Impact of Serving Temperature
The terminology and corresponding references that were established by Adhikari et al., [46] were used in a coffee study that confirmed that the consumption temperature has a significant impact on the flavor properties of hot brewed coffee. In this study, a team of seven highly trained descriptive sensory panelists evaluated a total of 36 flavor characteristics for four hot brewed coffee samples (two Arabicas, one Robusta, and a blended sample). The samples were consumed at different temperatures (50, 60, and 70 °C). Results showed that consumption temperature was critical to the flavor profiles of each of the samples. Significant interactions between the consumption temperature and the coffee samples for characteristics such as coffee fullness, fidelity, and balance suggested that sample combinations should be considered when developing hot coffee flavor profiles. These findings supported earlier claims by Lee and O’Mahony [138] that consumers preferred drinking coffee at about 60 °C regardless of whether it was black or contained added additives such as creamer and sweetener.
7.3.2. Impact of Coffee Additives
Piccone et al. [72] used SPME and headspace analysis to compare the volatile compounds contained in EC and ready-to-drink (RTD) coffee that were prepared from the same blend of Arabica beans. The RTD had a higher concentration of volatile compounds such as aldehydes (e.g., 3-ethyl-3-methyl maleic anhydride) and furfuryl derivatives (e.g., furfuryl methyl sulfide and furfuryl formate). On the other hand, EC had a higher concentration for esters, ketones, and pyrroles. Now, when 100 g/L of sugar additives (fructose, glucose, lactose, and sucrose) were added to each of these two coffees (EC and RTD), volatile compounds such as furans (e.g., 2-furfurl furan) and sulfides (e.g., furfuryl methyl sulfide) for the EC increased while the pyrazines decreased. Much as no significant changes were observed for the RTD coffees, there was a significant impact from the type of sugar (except for lactose which maintained a similar volatile compound profile to that of without sugar added).
An additional factor to consider while researching consumer acceptance and preference with different coffee preparation is the addition of additives such as cream, syrups, and sugars. As more and more consumers are ordering lattes instead of the standard cup of black coffee, sensory researchers and coffee companies should take into account how their target consumer typically prepares and enjoys their coffee. By allowing consumers to prepare coffee samples with these additives during sensory testing, sensory researchers and coffee companies could more accurately determine if a sample is disliked or not preferred because of the characteristics of the coffee sample or the consumer just does not enjoy black coffee.
8. Impact of Coffee Flavor on Consumer Acceptance and Emotion
A total of 86 terms were identified in a study that investigated the emotions that consumers experienced when they drank coffee. The developed Coffee Drinking Experience (CDE) lexicon included terms such as Active, Awake, Energetic, and Relaxed among many others [20]. By mapping the emotion data with data from the descriptive analysis of the same six samples, the authors identified key flavor attributes that drive the feelings of the coffee drinkers. For example, while cocoa aroma was found to drive positive emotions such as good and pleasant, characteristics such as acidity and citrus flavor were most associated with the negative feeling of off-balance [11].
Another study with Korean and Chinese coffee consumers revealed that culture and context are critical to the feelings experienced by coffee drinkers. Building from the previously established 86 terms of the CDE lexicon, Hu and Lee [139] developed coffee emotion lexicons for China (53 terms) and Korea (29 terms). According to [140], comparison between the EsSence Profile and CDE scale showed that negative feelings such as bored, guilty, and worried had lower intensities as compared to positive emotions such as energetic, and pleased that were experienced by coffee drinkers. The motivations for coffee drinking have been shown to impact the level of the emotions experienced by consumers.
It was reported by [141] that consumers whose motivation for drinking coffee was enjoyment had higher positive emotions than their colleagues whose motivation for drinking coffee was stimulation. An investigation into the influence of consumption temperature of hot-brewed coffee on the emotional experience revealed that consumption of coffee at 65 °C was associated with positive feelings while when the same coffee was consumed at 25 and 5 °C, it was characterized by negative emotions [142]. These findings support an earlier study by Stokes et al. [143], who suggested that the hedonic flavor attributes of black coffee that was served in paper-based cups positively correlated with the higher temperatures (70.8 and 74.4 °C) while low temperatures such as 31.0 °C were negatively correlated to hedonic attributes.
Adhikari et al. [46] supported this claim by demonstrating that intensities of coffee-like attributes such as coffee identity and fidelity increased with an increase in temperature and also suggested that the flavor profile of hot brewed coffee can be affected by the temperature at which it is consumed. Cusielo et al. [144] examined the sensory influence of the addition of sweetener (sucrose, stevia, and sucralose) to traditional and decaffeinated espresso. The Acceptance test showed that consumers were segmented based mainly on the type of sample rather than the added sweetener and that coffee flavor and sweet taste were the two attributes that drove the liking among the consumers.
Corso et al. [145] developed four formulations with each having 2.5 times more 5-caffeoylquinic (chlorogenic acid) as compared to conventional instant coffees. Consumer testing showed that all four formulations were accepted and could be introduced on the market. Another study profiled eight filtered and five instant coffees using descriptive sensory analysis and conducted consumer tests to determine their acceptability. The overall liking of the filtered coffees increased with an increase in aroma and flavor while for the instant coffees except for one, all decreased with an increase in aroma and flavor [146].
Kwak et al. [147] proved that yeast fermentation of green coffee beans significantly increased their antioxidant activity. In this study, three different yeasts belonging to the Saccharomyces species were assessed along with two controls. Consumers did not identify any defective flavors that were associated with the fermented beans even though they liked the fermented beans slightly less than the controls.
Klimas and Webb [102] investigated consumer preferences for shade-grown coffee certification. In this study, the stated and realized preferences for shade-grown coffee were compared with those of conventionally grown coffee. The results showed that consumers that had a closer association with environmental attitudes and personal norms for pro-environmental behavior were willing to pay more for shade-grown coffee. It was surprising to learn that flavor liking was not a key driver for consumer willingness to pay more for these certified coffees.
Yan and Li [28] reported that culture and tradition had a significant impact on coffee flavor perception among consumers from different countries. University students in China who participated in this survey consumed more coffee as compared to their counterparts in Sweden. Results showed that while Swedish students were motivated to drink coffee because they liked its taste and flavor and for health reasons such as keeping alert, Chinese students overall were not motivated to drink coffee because of tradition (China is a tea-drinking country). In addition, when Chinese students drank coffee it usually was because they wanted to be social, maintain a social image, or were variety seeking.
9. Conclusions
Coffee usually is processed and marketed as either instant, RTD or roasted coffee; however, the majority of published physical, chemical, and sensory research has been conducted on roasted coffee. According to Mintel [1], the RTD segment, which is ahead of the times and easily accessible to consumers, currently holds the greatest share of the coffee market. This highlights a need for more research studies that can provide more understanding of the coffee flavor and flavor attributes that drive consumer liking for these novel products. We summarized studies that investigated the different aspects that impact coffee flavor properties. A larger proportion of these studies employed analytical approaches such as descriptive and discrimination sensory evaluation, and chemical volatile analysis while other studies used affective methods such as qualitative and quantitative consumer research. A few studies such as used both analytical and affective methods to provide a deep understanding of the impact of the coffee flavor properties on consumer acceptance.
The inherent volatiles and non-volatiles of roasted beans have a huge impact on the perceived flavor characteristics of the coffee brew. However, the individual concentrations and profiles of these compounds can be influenced by various external aspects a coffee cherry encounters on its way from farm to cup across the coffee value chain. This review explained how each of these aspects individually or in combination can alter the flavor of brewed coffee. To develop consistent and sustainable flavor profiles for coffee consumers, it would be beneficial to gain an understanding of the contributions from each process owner such as breeders, agronomists, farmers, milling plants, roasters, and baristas.
Author Contributions
Conceptualization, E.C.IV; methodology, E.C.IV; software, E.C.IV; validation, E.C.IV; formal analysis, D.R.S.; investigation, D.R.S., and E.C.IV; resources, E.C.IV; data curation, D.R.S., and E.C.IV; writing—original draft preparation, D.R.S.; writing—review and editing, E.C.IV; visualization, D.R.S., and E.C.IV; supervision, E.C.IV; project administration, E.C.IV; funding acquisition, E.C.IV All authors have read and agree to the published version of the manuscript.
Funding
This research received no external funding.
Conflicts of Interest
The authors declare no conflict of interest.
References
- Topper, A. Coffee and Tea on Premise—US-July 2019. Available online: https://0-store-mintel-com.brum.beds.ac.uk/us-coffee-and-tea-on-premise-market-report (accessed on 1 July 2019).
- Farah, A. Coffee Constituents. Coffee Emerg. Heal. Eff. Dis. Prev. 2012, 21–58. [Google Scholar] [CrossRef]
- Sunarharum, W.B.; Williams, D.J.; Smyth, H.E. Complexity of coffee flavor: A compositional and sensory perspective. Food Res. Int. 2014, 62, 315–325. [Google Scholar] [CrossRef]
- Kumazawa, K.; Masuda, H. Investigation of the change in the flavor of a coffee drink during heat processing. J. Agric. Food Chem. 2003, 51, 2674–2678. [Google Scholar] [CrossRef]
- Murakami, K.; Akiyama, M.; Sumi, M.; Ikeda, M.; Iwatsuki, K.; Nishimura, O.; Kumazawa, K. Differences in flavor characteristics of coffee drinks originating from thermal sterilization process. Food Sci. Technol. Res. 2010, 16, 99–110. [Google Scholar] [CrossRef]
- Evangelista, S.R.; Da Cruz Pedrozo Miguel, M.G.; De Souza Cordeiro, C.; Silva, C.F.; Marques Pinheiro, A.C.; Schwan, R.F. Inoculation of starter cultures in a semi-dry coffee (Coffea arabica) fermentation process. Food Microbiol. 2014, 44, 87–95. [Google Scholar] [CrossRef] [PubMed]
- Bhumiratana, N.; Adhikari, K.; Chambers, E. Evolution of sensory aroma attributes from coffee beans to brewed coffee. LWT-Food Sci. Technol. 2011, 44, 2185–2192. [Google Scholar] [CrossRef] [Green Version]
- Akiyama, M.; Murakami, K.; Ikeda, M.; Iwatsuki, K.; Kokubo, S.; Wada, A.; Tokuno, K.; Onishi, M.; Iwabuchi, H.; Tanaka, K. Characterization of Flavor Compounds Released During Grinding of Roasted Robusta Coffee Beans. Food Sci. Technol. Res. 2005, 11, 298–307. [Google Scholar] [CrossRef] [Green Version]
- Kalschne, D.L.; Viegas, M.C.; De Conti, A.J.; Corso, M.P.; De Toledo Benassi, M. Steam pressure treatment of defective Coffea canephora beans improves the volatile profile and sensory acceptance of roasted coffee blends. Food Res. Int. 2018, 105, 393–402. [Google Scholar] [CrossRef]
- Joët, T.; Laffargue, A.; Descroix, F.; Doulbeau, S.; Bertrand, B.; De Kochko, A.; Dussert, S. Influence of environmental factors, wet processing and their interactions on the biochemical composition of green Arabica coffee beans. Food Chem. 2010, 118, 693–701. [Google Scholar] [CrossRef]
- Bhumiratana, N.; Wolf, M.; Chambers IV, E.; Adhikari, K. Coffee Drinking and Emotions: Are There Key Sensory Drivers for Emotions? Beverages 2019, 5, 27. [Google Scholar] [CrossRef] [Green Version]
- Phan, U.T.X.; Chambers, E. Motivations for choosing various food groups based on individual foods. Appetite 2016, 105, 204–211. [Google Scholar] [CrossRef]
- Garner, B. Interpersonal Coffee Drinking Communication Rituals. Int. J. Mark. Bus. Commun. 2015, 4. [Google Scholar] [CrossRef]
- Akiyama, M.; Tatsuzaki, M.; Michishita, T.; Ichiki, T.; Sumi, M.; Ikeda, M.; Araki, T.; Sagara, Y. Package Design of Ready-to-Drink Coffee Beverages Based on Food Kansei Model-Effects of Straw and Cognition Terms on Consumer’s Pleasantness. Food Bioprocess Technol. 2012, 5, 1924–1938. [Google Scholar] [CrossRef]
- Chambers, D.; Phan, U.; Chanadang, S.; Maughan, C.; Sanchez, K.; Di Donfrancesco, B.; Gomez, D.; Higa, F.; Li, H.; Chambers, E.; et al. Motivations for Food Consumption during Specific Eating Occasions in Turkey. Foods 2016, 5, 39. [Google Scholar] [CrossRef] [PubMed] [Green Version]
- Phan, U.T.X.; Chambers, E. Application of An Eating Motivation Survey to Study Eating Occasions. J. Sens. Stud. 2016, 31, 114–123. [Google Scholar] [CrossRef]
- Aguirre, J. Culture, health, gender and coffee drinking: A Costa Rican perspective. Br. Food J. 2016, 118, 150–163. [Google Scholar] [CrossRef]
- National Coffee Association. Coffee consumption holds steady, upticks at home (Coffee Drinking Trends report). Vend. Times 2009, 49, 39. [Google Scholar]
- Rogers, P.J. Coffee and tea drinking: Early experience and perceived benefits. Appetite 1995, 24, 197. [Google Scholar]
- Bhumiratana, N.; Adhikari, K.; Chambers, E. The development of an emotion lexicon for the coffee drinking experience. Food Res. Int. 2014, 61, 83–92. [Google Scholar] [CrossRef] [Green Version]
- Anonymous. Boost Your Buzz.(food nutrition). Women’s Health 2018, 15, 69. [Google Scholar]
- Acreman, S. The benefits and drawbacks of drinking coffee. Cancer Nurs. Pract. 2009, 8. [Google Scholar] [CrossRef]
- Moderate coffee drinking may have many benefits. J. Mich. Dent. Assoc. 2007, 89, 30.
- Mitchell, F. Diabetes: Drink coffee or tea to reduce risk of type 2 diabetes mellitus? Nat. Rev. Endocrinol. 2012, 9, 64. [Google Scholar] [CrossRef]
- Alpert, J.S. Hey, Doc, Is It OK for Me to Drink Coffee? Am. J. Med. 2009, 122, 597–598. [Google Scholar] [CrossRef]
- Taylor, S.R.; Demmig-Adams, B. To sip or not to sip: The potential health risks and benefits of coffee drinking. Nutr. Food Sci. 2007, 37, 406–418. [Google Scholar] [CrossRef]
- Chaubey, P.; Suvarna, V.; Sangave, P.C.; Singh, A.K. Nutritional Management of Diabetes—A Critical Review. In Bioactive Food as Dietary Interventions for Diabetes; Elsevier Inc.: London, UK, 2019; pp. 289–308. [Google Scholar] [CrossRef]
- Yan, M.; Li, Q. Consumer Behavior in Coffee Drinking: Comparison between Chinese and Swedish University Students 2016. Bachelor’s Thesis, University of Gävle, Gävle, Sweden, 2016. [Google Scholar]
- Naganuma, T.; Kuriyama, S.; Kakizaki, M.; Sone, T.; Nakaya, N.; Ohmori-Matsuda, K.; Nishino, Y.; Fukao, A.; Tsuji, I. Coffee consumption and the risk of oral, pharyngeal, and esophageal cancers in Japan: The Miyagi Cohort Study. Am. J. Epidemiol. 2008, 168, 1425–1432. [Google Scholar] [CrossRef] [Green Version]
- Garg, S.K. Chapter 47-Green Coffee Bean. In Nutraceuticals: Efficacy, safety and Toxicity; Elsevier Inc.: London, UK, 2016; Volume 653–667. [Google Scholar] [CrossRef]
- Casas-Grajales, S.; Muriel, P. The Liver, Oxidative Stress, and Antioxidants; Elsevier Inc.: London, UK, 2017. [Google Scholar]
- Arauz, J.; Ramos-Tovar, E.; Muriel, P. Chapter 4-Coffee and the Liver; Elsevier Inc.: London, UK, 2017. [Google Scholar]
- Gallaher, D.D.; Trudo, S.P. Chapter 3 -Nutrition and Colon Cancer, 3rd ed.; Elsevier Inc.: London, UK, 2013. [Google Scholar]
- Anese, M.; Nicoli, M.C. Antioxidant properties of ready-to-drink coffee brews. J. Agric. Food Chem. 2003, 51, 942–946. [Google Scholar] [CrossRef] [PubMed]
- Rainey, C. Drink Coffee If You Want to Work Out Better. Available online: https://www.grubstreet.com/ (accessed on 7 July 2020).
- Yu, X.; Bao, Z.; Zou, J.; Dong, J. Coffee consumption and risk of cancers: A meta-analysis of cohort studies. BMC Cancer 2011, 11, 96. [Google Scholar] [CrossRef] [PubMed] [Green Version]
- Gunter, M.J.; Schaub, J.A.; Xue, X.; Freedman, N.D.; Gaudet, M.M.; Rohan, T.E.; Hollenbeck, A.R.; Sinha, R. A prospective investigation of coffee drinking and endometrial cancer incidence. Int. J. Cancer 2012, 131, 530–536. [Google Scholar] [CrossRef] [Green Version]
- Freedman, N.D.; Park, Y.; Abnet, C.C.; Hollenbeck, A.R.; Sinha, R. Association of coffee drinking with total and cause-specific mortality.(Report). N. Engl. J. Med. 2012, 366, 1891. [Google Scholar] [CrossRef]
- Wang, E.S.T.; Yu, J.R. Effect of product attribute beliefs of ready-to-drink coffee beverages on consumer-perceived value and repurchase intention. Br. Food J. 2016, 118, 2963–2980. [Google Scholar] [CrossRef]
- Seo, H.S.; Lee, S.Y.; Hwang, I. Development of sensory attribute pool of brewed coffee. J. Sens. Stud. 2009, 24, 111–132. [Google Scholar] [CrossRef]
- Seninde, D.R.; Chambers, E.I.V.; Chambers, D. Determining the impact of roasting degree, coffee to water ratio and brewing method on the sensory characteristics of cold brew Ugandan Coffee. Food Res. Int. 2020, 138. In Press. [Google Scholar]
- Chambers, E.; Sanchez, K.; Phan, U.X.T.; Miller, R.; Civille, G.V.; Di Donfrancesco, B. Development of a “living” lexicon for descriptive sensory analysis of brewed coffee. J. Sens. Stud. 2016, 31, 465–480. [Google Scholar] [CrossRef]
- Sanchez, K.; Chambers, E. How Does Product Preparation Affect Sensory Properties? An Example with Coffee. J. Sens. Stud. 2015, 30, 499–511. [Google Scholar] [CrossRef]
- Hayakawa, F.; Kazami, Y.; Wakayama, H.; Oboshi, R.; Tanaka, H.; Maeda, G.; Hoshino, C.; Iwawaki, H.; Miyabayashi, T. Sensory lexicon of brewed coffee for Japanese consumers, untrained coffee professionals and trained coffee tasters. J. Sens. Stud. 2010, 25, 917–939. [Google Scholar] [CrossRef]
- Di Donfrancesco, B.; Gutierrez Guzman, N.; Chambers, E. Comparison of results from cupping and descriptive sensory analysis of colombian brewed coffee. J. Sens. Stud. 2014, 29, 301–311. [Google Scholar] [CrossRef] [Green Version]
- Adhikari Jayashan, C.E. Impact of consumption temperature and additions(milk and/ or sugar) on sensory properties of hot brewed coffee. Food Res. Int. 2019, 115, 95–104. [Google Scholar] [CrossRef] [PubMed]
- Masi, C.; Dinnella, C.; Barnabà, M.; Navarini, L.; Monteleone, E. Sensory properties of under-roasted coffee beverages. J. Food Sci. 2013, 78. [Google Scholar] [CrossRef]
- Clemente, J.M.; Martinez, H.E.P.; Alves, L.C.; Lara, M.C.R. Effect of N and K doses in nutritive solution on growth, production and coffee bean size. Rev. Ceres 2013, 60, 279–285. [Google Scholar] [CrossRef]
- Coffee Standards—Specialty Coffee Association. Available online: https://sca.coffee/research/coffee-standards (accessed on 1 November 2018).
- International Trade Centre. The Coffee Exporter’s Guide; International Trade Center: Geneva, Switzerland, 2011; Volume 1211, ISBN 978-92-9137-394-9. [Google Scholar]
- Elavarasan, K.; Kumar, A.; Manoharan, A.; Rajan, S.S. The basics of coffee cupping.(COFFEE CUPPING). Tea Coffee Trade J. 2016, 188, 30. [Google Scholar]
- Kim, S.J.; Lee, S.; Bang, E.; Lee, S.; Rhee, J.K.; Na, Y.C. Comparative evaluation of flavor compounds in fermented green and roasted coffee beans by solid phase microextraction-gas chromatography/mass spectrometry. Flavour Fragr. J. 2019, 34, 365–376. [Google Scholar] [CrossRef]
- Farah, A.; De Paulis, T.; Trugo, L.C.; Martin, P.R. Effect of roasting on the formation of chlorogenic acid lactones in coffee. J. Agric. Food Chem. 2005, 53, 1505–1513. [Google Scholar] [CrossRef]
- Trugo, L.C.; Macrae, R. A study of the effect of roasting on the chlorogenic acid composition of coffee using HPLC. Food Chem. 1984, 15, 219–227. [Google Scholar] [CrossRef]
- Bicho, N.C.; Leitão, A.E.; Ramalho, J.C.; De Alvarenga, N.B.; Lidon, F.C. Identification of chemical clusters discriminators of Arabica and Robusta green coffee. Int. J. Food Prop. 2013, 16, 895–904. [Google Scholar] [CrossRef] [Green Version]
- Jeszka-Skowron, M.; Sentkowska, A.; Pyrzyńska, K.; De Peña, M.P. Chlorogenic acids, caffeine content and antioxidant properties of green coffee extracts: Influence of green coffee bean preparation. Eur. Food Res. Technol. 2016, 242, 1403–1409. [Google Scholar] [CrossRef] [Green Version]
- Mills, C.E.; Oruna-Concha, M.J.; Mottram, D.S.; Gibson, G.R.; Spencer, J.P.E. The effect of processing on chlorogenic acid content of commercially available coffee. Food Chem. 2013, 141, 3335–3340. [Google Scholar] [CrossRef]
- Buffo, R.A.; Cardelli-Freire, C. Coffee flavour: An overview. Flavour Fragr. J. 2004, 19, 99–104. [Google Scholar] [CrossRef]
- Dharmawan, A.; Cahyo, F.; Widyotomo, S. Determining Optimum Point of Robusta Coffee Bean Roasting Process for Taste Consistency. Pelita Perkebunan 2018, 34, 59–65. [Google Scholar] [CrossRef]
- Casal, S.; Oliveira, M.B.P.P.; Alves, M.R.; Ferreira, M.A. Discriminate analysis of roasted coffee varieties for trigonelline, nicotinic acid, and caffeine content. J. Agric. Food Chem. 2000, 48, 3420–3424. [Google Scholar] [CrossRef]
- Kalaska, B.; Piotrowski, L.; Leszczynska, A.; Michalowski, B.; Kramkowski, K.; Kaminski, T.; Adamus, J.; Marcinek, A.; Gebicki, J.; Mogielnicki, A.; et al. Antithrombotic effects of pyridinium compounds formed from trigonelline upon coffee roasting. J. Agric. Food Chem. 2014, 62, 2853–2860. [Google Scholar] [CrossRef] [PubMed]
- Moores, R.G.; Greninger, D.M. Determination of Trigonelline in Coffee. Anal. Chem. 1951, 23, 327–331. [Google Scholar] [CrossRef]
- Caporaso, N.; Whitworth, M.B.; Cui, C.; Fisk, I.D. Variability of single bean coffee volatile compounds of Arabica and robusta roasted coffees analysed by SPME-GC-MS. Food Res. Int. 2018, 108, 628–640. [Google Scholar] [CrossRef]
- Akiyama, M.; Murakami, K.; Ikeda, M.; Iwatsuki, K.; Wada, A.; Tokuno, K.; Onishi, M.; Iwabuchi, H. Analysis of the headspace volatiles of freshly brewed arabica coffee using solid-phase microextraction. J. Food Sci. 2007, 72, C388–C396. [Google Scholar] [CrossRef]
- Barié, N.; Bücking, M.; Stahl, U.; Rapp, M. Detection of coffee flavour ageing by solid-phase microextraction/surface acoustic wave sensor array technique (SPME/SAW). Food Chem. 2015, 176, 212–218. [Google Scholar] [CrossRef]
- Haile, M.; Kang, W.H. The Role of Microbes in Coffee Fermentation and Their Impact on Coffee Quality. J. Food Qual. 2019, 2019. [Google Scholar] [CrossRef]
- Toci, A.T.; Farah, A. Volatile compounds as potential defective coffee beans’ markers. Food Chem. 2008, 108, 1133–1141. [Google Scholar] [CrossRef]
- Mancha Agresti, P.D.C.; Franca, A.S.; Oliveira, L.S.; Augusti, R. Discrimination between defective and non-defective Brazilian coffee beans by their volatile profile. Food Chem. 2008, 106, 787–796. [Google Scholar] [CrossRef]
- Moon, J.K.; Shibamoto, T. Role of roasting conditions in the profile of volatile flavor chemicals formed from coffee beans. J. Agric. Food Chem. 2009, 57, 5823–5831. [Google Scholar] [CrossRef]
- De Melo Pereira, G.V.; Neto, E.; Soccol, V.T.; Medeiros, A.B.P.; Woiciechowski, A.L.; Soccol, C.R. Conducting starter culture-controlled fermentations of coffee beans during on-farm wet processing: Growth, metabolic analyses and sensorial effects. Food Res. Int. 2015, 75, 348–356. [Google Scholar] [CrossRef]
- Bertrand, B.; Boulanger, R.; Dussert, S.; Ribeyre, F.; Berthiot, L.; Descroix, F.; Joët, T. Climatic factors directly impact the volatile organic compound fingerprint in green Arabica coffee bean as well as coffee beverage quality. Food Chem. 2012, 135, 2575–2583. [Google Scholar] [CrossRef] [PubMed]
- Piccone, P.; Lonzarich, V.; Navarini, L.; Fusella, G.; Pittia, P. Effect of sugars on liquid-vapour partition of volatile compounds in ready-to-drink coffee beverages. J. Mass Spectrom. 2012, 47, 1120–1131. [Google Scholar] [CrossRef] [PubMed]
- Lee, L.W.; Cheong, M.W.; Curran, P.; Yu, B.; Liu, S.Q. Coffee fermentation and flavor-An intricate and delicate relationship. Food Chem. 2015, 185, 182–191. [Google Scholar] [CrossRef] [PubMed]
- Nicoli, M.C.; Calligaris, S.; Manzocco, L. Shelf-Life Testing of Coffee and Related Products: Uncertainties, Pitfalls, and Perspectives. Food Eng. Rev. 2009, 1, 159–168. [Google Scholar] [CrossRef]
- Czerny, M.; Grosch, W. Potent Odorants of Raw Arabica Coffee. Their Changes during Roasting. J. Agric. Food Chem. 2000, 48, 868–872. [Google Scholar] [CrossRef] [PubMed]
- Yener, S.; Romano, A.; Cappellin, L.; Granitto, P.M.; Aprea, E.; Navarini, L.; Märk, T.D.; Gasperi, F.; Biasioli, F. Tracing coffee origin by direct injection headspace analysis with PTR/SRI-MS. Food Res. Int. 2015, 69, 235–243. [Google Scholar] [CrossRef]
- Nguyen, T.; Kuchera, M.; Smoot, K.; Diako, C.; Vixie, B.; Ross, C.F. Consumer Acceptance of a Polyphenolic Coffee Beverage. J. Food Sci. 2016, 81, S2817–S2823. [Google Scholar] [CrossRef] [PubMed]
- Semmelroch, P. Analysis of roasted coffee powders and brews by gas chromatography-olfactometry of headspace samples. Food Sci. Technol. Leb. Technol. Lwt. 1995, 28, 310–313. [Google Scholar] [CrossRef]
- McGorrin, R.J. The Significance of Volatile Sulfur Compounds in Food Flavors. In Volatile Sulfur Compounds in Food; ACS Symposium Series; ACS Publications: Washington, DC, USA, 2011; Volume 1068, pp. 1–3. ISBN 9780841226166. [Google Scholar]
- Mayer, F. Sensory study of the character impact aroma compounds of a coffee beverage. Eur. Food Res. Technol. 2000, 211, 272–276. [Google Scholar] [CrossRef]
- Dulsat-Serra, N.; Quintanilla-Casas, B.; Vichi, S. Volatile thiols in coffee: A review on their formation, degradation, assessment and influence on coffee sensory quality. Food Res. Int. 2016, 89, 982–988. [Google Scholar] [CrossRef]
- Vichi, S.; Jerí, Y.; Cortés-Francisco, N.; Palacios, O.; Caixach, J. Determination of volatile thiols in roasted coffee by derivatization and liquid chromatography–high resolution mass spectrometric analysis. Food Res. Int. 2014, 64, 610–617. [Google Scholar] [CrossRef] [PubMed]
- Hofmann, T.; Schieberle, P. Chemical interactions between odor-active thiols and melanoidins involved in the aroma staling of coffee beverages. J. Agric. Food Chem. 2002, 50, 319. [Google Scholar] [CrossRef]
- Charles-Bernard, M.; Roberts, D.D.; Kraehenbuehl, K. Interactions between volatile and nonvolatile coffee components. 2. Mechanistic study focused on volatile thiols. J. Agric. Food Chem. 2005, 53, 4426–4433. [Google Scholar] [CrossRef] [PubMed]
- De Melo Pereira, G.V.; De Carvalho Neto, D.P.; Magalhães Júnior, A.I.; Vásquez, Z.S.; Medeiros, A.B.P.; Vandenberghe, L.P.S.; Soccol, C.R. Exploring the impacts of postharvest processing on the aroma formation of coffee beans—A review. Food Chem. 2019, 272, 441–452. [Google Scholar] [CrossRef]
- Toledo, P.R.A.B.; Pezza, L.; Pezza, H.R.; Toci, A.T. Relationship Between the Different Aspects Related to Coffee Quality and Their Volatile Compounds. Compr. Rev. Food Sci. Food Saf. 2016, 15, 705–719. [Google Scholar] [CrossRef] [Green Version]
- Altaki, M.S.; Santos, F.J.; Galceran, M.T. Occurrence of furan in coffee from Spanish market: Contribution of brewing and roasting. Food Chem. 2011, 126, 1527–1532. [Google Scholar] [CrossRef] [PubMed]
- Ruiz-Matute, A.I.; Montilla, A.; Del Castillo, M.D.; Martínez-Castro, I.; Sanz, M.L. A GC method for simultaneous analysis of bornesitol, other polyalcohols and sugars in coffee and its substitutes. J. Sep. Sci. 2007, 30, 557–562. [Google Scholar] [CrossRef]
- Oestreich-Janzen, S. Chemistry of coffee. In Comprehensive Natural Products II: Chemistry and Biology; Elsevier: Amsterdam, The Netherlands, 2010; Volume 3, pp. 1085–1117. ISBN 9780080453828. [Google Scholar]
- Keidel, A.; Von Stetten, D.; Rodrigues, C.; Máguas, C.; Hildebrandt, P. Discrimination of green arabica and Robusta coffee beans by Raman spectroscopy. J. Agric. Food Chem. 2010, 58, 11187. [Google Scholar] [CrossRef]
- Mondello, L.; Costa, R.; Tranchida, P.Q.; Dugo, P.; Lo Presti, M.; Festa, S.; Fazio, A.; Dugo, G. Reliable characterization of coffee bean aroma profiles by automated headspace solid phase microextraction-gas chromatography-mass spectrometry with the support of a dual-filter mass spectra library. J. Sep. Sci. 2005, 28, 1101–1109. [Google Scholar] [CrossRef]
- Costa Freitas, A.M.; Parreira, C.; Vilas-Boas, L. The use of an electronic aroma-sensing device to assess coffee differentiation-Comparison with SPME gas chromatography-mass spectrometry aroma patterns. J. Food Compos. Anal. 2001, 14, 513–522. [Google Scholar] [CrossRef]
- Yusianto, Y.; Hulupi, R.; Sulistyowati, S.; Ismayadi, C. Physical, Chemicals and Flavors of Some Varieties of Arabica Coffee. Pelita Perkeb. 2014, 21. [Google Scholar] [CrossRef] [Green Version]
- Gamonal, L.E.; Vallejos-Torres, G.; López, L.A. Sensory analysis of four cultivars of coffee (Coffea arabica L.), grown at different altitudes in the San Martin region-Peru. Ciência Rural. 2017, 47. [Google Scholar] [CrossRef] [Green Version]
- Feria-Morales, A.M. Examining the case of green coffee to illustrate the limitations of grading systems/expert tasters in sensory evaluation for quality control. Food Qual. Prefer. 2002, 13, 355–367. [Google Scholar] [CrossRef]
- Luna González, A.; Macías Lopez, A.; Taboada Gaytán, O.R.; Morales Ramos, V. Cup quality attributes of Catimors as affected by size and shape of coffee bean (Coffea arabica L.). Int. J. Food Prop. 2019, 22, 758–767. [Google Scholar] [CrossRef] [Green Version]
- Dong, W.; Tan, L.; Zhao, J.; Hu, R.; Lu, M. Characterization of Fatty Acid, Amino Acid and Volatile Compound Compositions and Bioactive Components of Seven Coffee (Coffea robusta) Cultivars Grown in Hainan Province, China. Molecules 2015, 20, 16687–16708. [Google Scholar] [CrossRef] [PubMed]
- Barbosa, J.N.; Borem, F.M.; Cirillo, M.A.; Malta, M.R.; Alvarenga, A.A.; Alves, H.M.R. Coffee quality and its interactions with environmental factors in Minas Gerais, Brazil. J. Agric. Sci. 2012, 4, 181. [Google Scholar] [CrossRef]
- Rodrigues, C.I.; Maia, R.; Miranda, M.; Ribeirinho, M.; Nogueira, J.M.F.; Máguas, C. Stable isotope analysis for green coffee bean: A possible method for geographic origin discrimination. J. Food Compos. Anal. 2009, 22, 463–471. [Google Scholar] [CrossRef]
- Avelino, J.; Barboza, B.; Araya, J.C.; Fonseca, C.; Davrieux, F.; Guyot, B.; Cilas, C. Effects of slope exposure, altitude and yield on coffee quality in two altitude terroirs of Costa Rica, Orosi and Santa María de Dota. J. Sci. Food Agric. 2005, 85, 1869–1876. [Google Scholar] [CrossRef]
- Di Donfrancesco, B.; Gutierrez Guzman, N.; Chambers, E. Similarities and differences in sensory properties of high quality Arabica coffee in a small region of Colombia. Food Res. Int. 2019, 116, 645–651. [Google Scholar] [CrossRef] [PubMed]
- Klimas, C.A.; Webb, E. Comparing stated and realized preferences for shade-grown vs. conventionally grown coffee. Int. J. Consum. Stud. 2018, 42, 76–92. [Google Scholar] [CrossRef]
- Schouteten, J.J.; Gellynck, X.; Slabbinck, H. Influence of organic labels on consumer’s flavor perception and emotional profiling: Comparison between a central location test and home-use-test. Food Res. Int. 2019, 116, 1000–1009. [Google Scholar] [CrossRef] [PubMed]
- Dos Santos, C.; Leitão, A.; Pais, I.; Lidon, F.; Ramalho, J. Perspectives on the potential impacts of climate changes on coffee plant and bean quality. Emir. J. Food Agric. 2015, 27, 152–163. [Google Scholar] [CrossRef]
- Geromel, C.; Ferreira, L.P. Biochemical and genomic analysis of sucrose metabolism during coffee (Coffea arabica) fruit development. J. Exp. Bot. 2006, 57, 3243–3258. [Google Scholar] [CrossRef] [PubMed] [Green Version]
- Król, K.; Gantner, M.; Tatarak, A.; Hallmann, E. The content of polyphenols in coffee beans as roasting, origin and storage effect. Eur. Food Res. Technol. 2020, 246, 33–39. [Google Scholar] [CrossRef] [Green Version]
- Yener, S.; Romano, A.; Cappellin, L.; Märk, T.D.; Sánchez Del Pulgar, J.; Gasperi, F.; Navarini, L.; Biasioli, F. PTR-ToF-MS characterisation of roasted coffees (C. arabica ) from different geographic origins: Coffee origin discrimination by PTR-ToF-MS. J. Mass Spectrom. 2014, 49, 929–935. [Google Scholar] [CrossRef] [PubMed]
- Cheong, M.W.; Tong, K.H.; Ong, J.J.M.; Liu, S.Q.; Curran, P.; Yu, B. Volatile composition and antioxidant capacity of Arabica coffee. Food Res. Int. 2013, 51, 388–396. [Google Scholar] [CrossRef]
- Setoyama, D.; Iwasa, K.; Seta, H.; Shimizu, H.; Fujimura, Y.; Miura, D.; Wariishi, H.; Nagai, C.; Nakahara, K. High-Throughput Metabolic Profiling of Diverse Green Coffea arabica Beans Identified Tryptophan as a Universal Discrimination Factor for Immature Beans. PLoS ONE 2013, 8. [Google Scholar] [CrossRef]
- Montavon, P.; Duruz, E.; Rumo, G.; Pratz, G. Evolution of green coffee protein profiles with maturation and relationship to coffee cup quality. J. Agric. Food Chem. 2003, 51, 2328–2334. [Google Scholar] [CrossRef]
- Lyman, D.J.; Benck, R.M.; Merle, S.F. Difference Spectroscopy in the Analysis of the Effects of Coffee Cherry Processing Variables on the Flavor of Brewed Coffee. Int. J. Spectrosc. 2011, 2011, 1–5. [Google Scholar] [CrossRef] [Green Version]
- Selmar, D.; Bytof, G.; Knopp, S.E.; Breitenstein, B. Germination of coffee seeds and its significance for coffee quality. Plant Biol. 2006, 8, 260–264. [Google Scholar] [CrossRef]
- Rendón, M.Y.; De Jesus Garcia Salva, T.; Bragagnolo, N. Impact of chemical changes on the sensory characteristics of coffee beans during storage. Food Chem. 2014. [Google Scholar] [CrossRef] [PubMed]
- Manzocco, L.; Lagazio, C. Coffee brew shelf life modelling by integration of acceptability and quality data. Food Qual. Prefer. 2009, 20, 24–29. [Google Scholar] [CrossRef]
- Kreuml, M.T.L.; Majchrzak, D.; Ploederl, B.; Koenig, J. Changes in sensory quality characteristics of coffee during storage. Food Sci. Nutr. 2013, 1, 267–272. [Google Scholar] [CrossRef] [PubMed]
- Pereira, A. Impacto de uma década sobre níveis séricos de colesterol em crianças e adolescentes e suas correlações com perfil alimentar, estado nutricional e ingestão calórica. Abstr. Arq Bras Cardiol. 2014, 103, 60. [Google Scholar]
- Belay, A.; Bekele, Y.; Abraha, A.; Comen, D.; Kim, H.K.; Hwang, Y.H. Discrimination of defective (Full Black, Full Sour and Immature) and nondefective coffee beans by their physical properties. J. Food Process Eng. 2014, 37, 524–532. [Google Scholar] [CrossRef]
- Kalschne, D.L.; Biasuz, T.; De Conti, A.J.; Viegas, M.C.; Corso, M.P.; De Toledo Benassi, M. Sensory characterization and acceptance of coffee brews of C. arabica and C. canephora blended with steamed defective coffee. Food Res. Int. 2019, 124, 234–238. [Google Scholar] [CrossRef]
- Barone, J.J.J.; Roberts, H.R.R. Caffeine consumption. Food Chem. Toxicol. 1996, 34, 119–129. [Google Scholar] [CrossRef]
- Lane, S.; Palmer, J.; Christie, B.R.; Ehlting, J.; Le, C.H. Can Cold Brew Coffee be Convenient? A Pilot Study for Caffeine Content in Cold Brew Coffee Concentrate Using High Performance Liquid Chromatography. Arbutus Rev. 2017, 8, 15–23. [Google Scholar] [CrossRef]
- Frost, S.C.; Ristenpart, W.D.; Guinard, J.X. Effect of Basket Geometry on the Sensory Quality and Consumer Acceptance of Drip Brewed Coffee. J. Food Sci. 2019, 84, 2297–2312. [Google Scholar] [CrossRef] [PubMed]
- Angeloni, G.; Guerrini, L.; Masella, P.; Innocenti, M.; Bellumori, M.; Parenti, A. Characterization and comparison of cold brew and cold drip coffee extraction methods. J. Sci. Food Agric. 2019, 99, 391–399. [Google Scholar] [CrossRef] [PubMed]
- Albanese, D.; Di Matteo, M.; Poiana, M.; Spagnamusso, S. Espresso coffee (EC) by POD: Study of thermal profile during extraction process and influence of water temperature on chemical-physical and sensorial properties. Food Res. Int. 2009, 42, 727–732. [Google Scholar] [CrossRef]
- Salamanca, C.A.; Fiol, N.; González, C.; Saez, M.; Villaescusa, I. Extraction of espresso coffee by using gradient of temperature. Effect on physicochemical and sensorial characteristics of espresso. Food Chem. 2017, 214, 622–630. [Google Scholar] [CrossRef]
- Moon, J.K.; Hyui Yoo, S.U.N.; Shibamoto, T. Role of roasting conditions in the level of chlorogenic acid content in coffee beans: Correlation with coffee acidity. J. Agric. Food Chem. 2009, 57, 5365–5369. [Google Scholar] [CrossRef] [PubMed]
- Cordoba, N.; Pataquiva, L.; Osorio, C.; Moreno, F.L.M.; Ruiz, R.Y. Effect of grinding, extraction time and type of coffee on the physicochemical and flavour characteristics of cold brew coffee. Sci. Rep. 2019, 9, 1–12. [Google Scholar] [CrossRef] [PubMed] [Green Version]
- Fuller, M.; Rao, N.Z. The Effect of Time, Roasting Temperature, and Grind Size on Caffeine and Chlorogenic Acid Concentrations in Cold Brew Coffee. Sci. Rep. 2017, 7, 17979. [Google Scholar] [CrossRef] [Green Version]
- Lee, S.J.; Kim, M.K.; Lee, K.G. Effect of reversed coffee grinding and roasting process on physicochemical properties including volatile compound profiles. Innov. Food Sci. Emerg. Technol. 2017, 44, 97–102. [Google Scholar] [CrossRef]
- International Organization for Standardization Green coffee—Preparation of samples for use in sensory analysis (ISO 6668:2008); International Organization of Standardization: Vernier, Switzerland, 2008.
- Andueza, S.; Vila, M.A.; Paz de Peña, M.; Cid, C. Influence of coffee/water ratio on the final quality of espresso coffee. J. Sci. Food Agric. 2007, 87, 586–592. [Google Scholar] [CrossRef]
- Caprioli, G.; Cortese, M.; Cristalli, G.; Maggi, F.; Odello, L.; Ricciutelli, M.; Sagratini, G.; Sirocchi, V.; Tomassoni, G.; Vittori, S. Optimization of espresso machine parameters through the analysis of coffee odorants by HS-SPME-GC/MS. Food Chem. 2012, 135, 1127–1133. [Google Scholar] [CrossRef]
- Masella, P.; Guerrini, L.; Spinelli, S.; Calamai, L.; Spugnoli, P.; Illy, F.; Parenti, A. A new espresso brewing method. J. Food Eng. 2015, 146, 204–208. [Google Scholar] [CrossRef]
- Gloess, A.N.; Schönbächler, B.; Klopprogge, B.; D’Ambrosio, L.; Chatelain, K.; Bongartz, A.; Strittmatter, A.; Rast, M.; Yeretzian, C. Comparison of nine common coffee extraction methods: Instrumental and sensory analysis. Eur. Food Res. Technol. 2013, 236, 607–627. [Google Scholar] [CrossRef] [Green Version]
- Uman, E.; Colonna-Dashwood, M.; Colonna-Dashwood, L.; Perger, M.; Klatt, C.; Leighton, S.; Miller, B.; Butler, K.T.; Melot, B.C.; Speirs, R.W.; et al. The effect of bean origin and temperature on grinding roasted coffee. Sci. Rep. 2016, 6. [Google Scholar] [CrossRef] [PubMed]
- Anonymous. “Cold brew: The hottest coffee” cold brew the hottest coffee-university of california.pdf. Univ. Carlifornia Berkeley Wellness Lett. 2016, 32, 5. [Google Scholar]
- Aylward, L. Warming Up to Cold-Brew Coffee; Progressive Grocer’s Store Brands: Chicago, IL, USA, 2016. [Google Scholar]
- Anonymous. Starbucks Debuts Spiced Cold Brew & Customer-designed Holiday Cups; Tea & Coffee Trade Journal: Gravesend, UK, 2016. [Google Scholar]
- Lee, H.S.; O’Mahony, M. At what temperatures do consumers like to drink coffee?: Mixing methods. J. Food Sci. 2002, 67, 2774–2777. [Google Scholar] [CrossRef]
- Hu, X.; Lee, J. Emotions elicited while drinking coffee: A cross-cultural comparison between Korean and Chinese consumers. Food Qual. Prefer. 2019, 76, 160–168. [Google Scholar] [CrossRef]
- Kanjanakorn, A.; Lee, J. Examining emotions and comparing the EsSense Profile® and the Coffee Drinking Experience in coffee drinkers in the natural environment. Food Qual. Prefer. 2017, 56, 69–79. [Google Scholar] [CrossRef]
- Labbe, D.; Ferrage, A.; Rytz, A.; Pace, J.; Martin, N. Pleasantness, emotions and perceptions induced by coffee beverage experience depend on the consumption motivation (hedonic or utilitarian). Food Qual. Prefer. 2015, 44, 56–61. [Google Scholar] [CrossRef]
- Pramudya, R.C.; Seo, H.S. Influences of product temperature on emotional responses to, and sensory attributes of, coffee and green tea beverages. Front. Psychol. 2018, 8, 1–16. [Google Scholar] [CrossRef] [Green Version]
- Stokes, C.N.; O’Sullivan, M.G.; Kerry, J.P. Assessment of black coffee temperature profiles consumed from paper-based cups and effect on affective and descriptive product sensory attributes. Int. J. Food Sci. Technol. 2016, 51, 2041–2048. [Google Scholar] [CrossRef]
- Cusielo, K.V.C.; Da Silva, A.C.; Da Silva, A.C.D.M.L.; Tavares-Filho, E.R.; Bolini, H.M.A. Sensory Influence of Sweetener Addition on Traditional and Decaffeinated Espresso. J. Food Sci. 2019, 84, 2628–2637. [Google Scholar] [CrossRef]
- Corso, M.P.; Vignoli, J.A.; De Toledo Benassi, M. Development of an instant coffee enriched with chlorogenic acids. J. Food Sci. Technol. 2016, 53, 1380–1388. [Google Scholar] [CrossRef]
- Stokes, C.N.; O’Sullivan, M.G.; Kerry, J.P. Hedonic and descriptive sensory evaluation of instant and fresh coffee products. Eur. Food Res. Technol. 2017, 243, 331–340. [Google Scholar] [CrossRef]
- Kwak, H.S.; Jeong, Y.; Kim, M. Effect of Yeast Fermentation of Green Coffee Beans on Antioxidant Activity and Consumer Acceptability. J. Food Qual. 2018, 2018. [Google Scholar] [CrossRef] [Green Version]

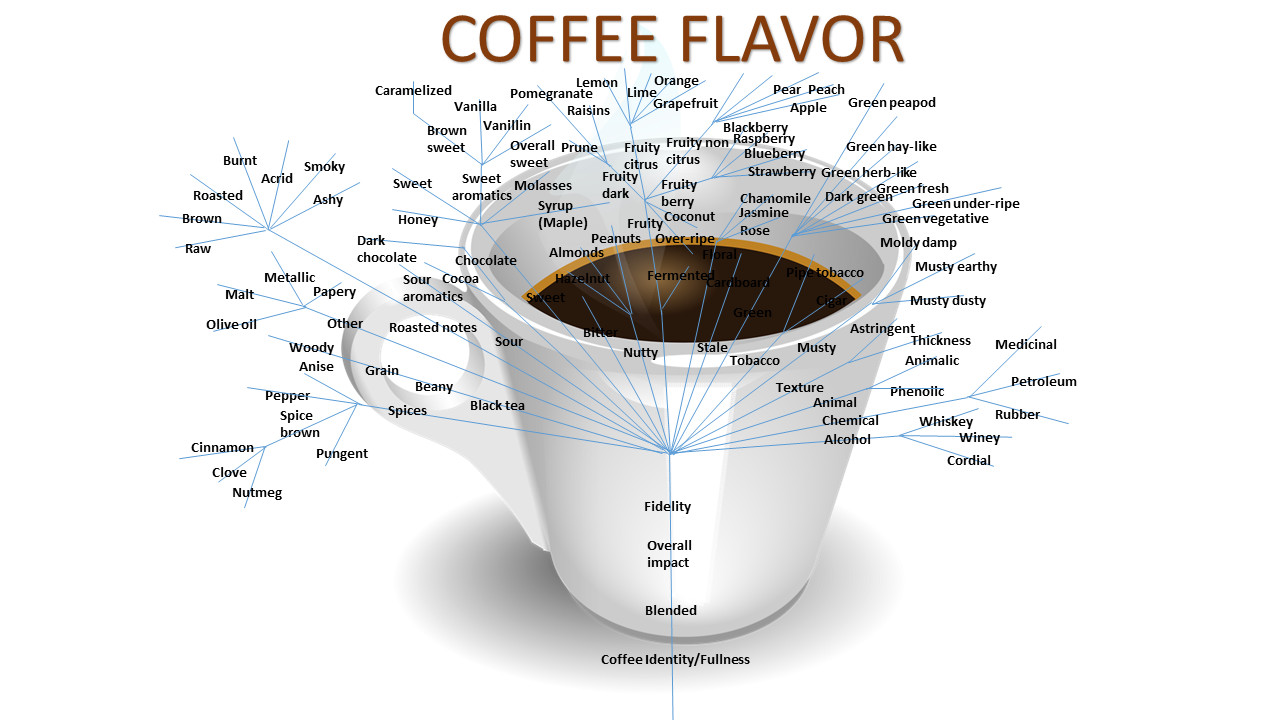
Table 1.
Descriptive sensory properties used in studies to differentiate brewed coffee samples 1.
| Descriptive Sensory Attributes | Definitions |
|---|---|
| Acidity (f) [11,40] | A sour, sharp, puckering sensation in the mouth caused by acids. |
| Acrid (a) [7,41,42,43] | The sharp pungent bitter acidic aromatics associated with products that are excessively roasted or browned. |
| Acrid (f) [41,42,43,44,45] | The sharp pungent bitter acidic aromatics associated with products that are excessively roasted or browned. |
| Ashy (a) [7,11,40,41,42,44] | Dry, dusty, dirty smoky aromatics associated with the residual of burnt products. |
| Ashy (f) [7,12,40,41,45,46] | Dry, dusty, dirty smoky aromatics associated with the residual of burnt products. |
| Balance/Blended [41,42,44] | The melding of individual sensory notes such that the products present a unified overall sensory experience as opposed to spikes or individual notes. |
| Beany (f) [7,42,46] | The brown, somewhat musty, earthy aromatics associated with cooked legumes such as pinto beans and lima beans. |
| Bitter aftertaste [11,41,42,43,44,45] | The fundamental taste factor associated with a caffeine solution. |
| Bitter taste [11,40,41,42,44,45,46] | The fundamental taste factor associated with a caffeine solution. |
| Body (Mouthfeel) [11,40,43,44] | The viscosity of the coffee, heaviness on the tongue—thin to thick. |
| Brown (f) [7,43,45] | Full, round, aromatic impression always characterized as some degree of darkness, generally associated with other attributes (i.e., tasted, nutty, sweet, etc.). |
| Burnt (a) [7,11,40,41,42,43,44,47] | The dark brown impression of an over-cooked or over-roasted product that can be sharp, bitter and sour. |
| Burnt (f) [40,41,42,45,47] | The dark brown impression of an over-cooked or over-roasted product that can be sharp, bitter, and sour. |
| Caramel (f) [40,42,44,45,47]. | Aromatics associated with caramel made from heated syrup. |
| Cardboard (a) [40,42,46] | The aromatic associated with cardboard or paper packaging. |
| Chemical (a) [40,42,44,45] | Aromatics associated with a broad range of chemicals such as rubber, petroleum, medicinal, skunky. |
| Chocolate/Dark Chocolate (a) [40,41,42,43,44,45] | A high-intensity blend of cocoa and cocoa butter that may include dark roast, spicy, burnt, must notes which includes increased astringency and bitterness. |
| Chocolate/Dark Chocolate (f) [40,41,42,43,45,46] | A high-intensity blend of cocoa and cocoa butter that may include dark roast, spicy, burnt, must notes which includes increased astringency and bitterness. |
| Citrus fruit (a) [7,41,42,44,45,46] | The citric, sour, astringent, slightly sweet, peely, and somewhat floral aromatics which may include lemons, limes, grapefruits, and oranges. |
| Citrus fruit (f) [41,42,45] | The citric, sour, astringent, slightly sweet, peely, and somewhat floral aromatics which may include lemons, limes, grapefruits, and oranges. |
| Cocoa (a) [7,41,42,43,44,45] | A brown, sweet, dusty, musty, often bitter aromatic associated with cocoa bean, powdered cocoa, and chocolate bars. |
| Cocoa (f) [7,11,41,42,45] | A brown, sweet, dusty, musty, often bitter aromatic associated with cocoa bean, powdered cocoa, and chocolate bars. |
| Coffee ID/Fullness [7,11,41,42,46,47] | The foundation of flavor notes that gives substance to the coffee brew. The perception of robust flavor that is rounded with the body; in this case a full, rounded coffee identity. |
| Earthy (f) [40,41,42] | Aromatics associated with damp, wet soil. |
| Fermented (a) [40,41,42,45] | Pungent, sweet, slightly sour, sometimes yeasty, alcohol like aromatics characteristics of fermented fruits or sugar or over-proofed dough. |
| Fermented (f) [40,41,42,45] | Pungent, sweet, slightly sour, sometimes yeasty, alcohol like aromatics characteristics of fermented fruits or sugar or over-proofed dough. |
| Fidelity [42,46] | The total sensory experiences of the trueness of the product in the stated context; in this case, its believability as coffee. Note: this does not imply any quality of the coffee. |
| Floral (a) [7,40,41,42,44,45] | Sweet, light, slightly fragrant aromatic associated with (fresh) flowers. |
| Floral (f) [7,41,42,45,46] | Sweet, light, slightly fragrant aromatic associated with (fresh) flowers. |
| Fruity (a) [7,40,41,42,44,45] | A sweet, floral aromatic blend of a variety of ripe fruits. |
| Fruity (f) [7,41,42,45,46] | A sweet, floral aromatic blend of a variety of ripe fruits. |
| Grain(a) [42,44,45,46,47] | The light dusty/musty aromatics associated with grains such as corn, wheat, bran, rice, and oats. |
| Green (a) [7,41,42,44] | Aromatic characteristic of fresh plant-based material. Attributes may include leafy, viney, unripe, grassy, peapod. |
| Green (f) [7,40,41,42,44,45] | Aromatic characteristic of fresh plant-based material. Attributes may include leafy, viney, unripe, grassy, peapod. |
| Longevity [41,42,46] | The time that the fully integrated sensory experience sustains itself in the mouth and after swallowing. |
| Malty (a) [42,44,45,47] | An aromatic described as brown sweet, musty and somewhat grainy. |
| Metallic (f) [42,44,45] | An aromatic and mouthfeel associated with tin cans or aluminum foil. |
| Mouth Drying [40,41,42,43,44,45] | A drying puckering or tingling sensation on the surface and/or edge of the tongue and mouth. |
| Musty/Earthy (a) [7,41,42,45] | The slightly musty aromatics associated with raw potatoes and damp humus, slightly musty notes. |
| Musty/Earthy (f) [41,42,45] | The slightly musty aromatics associated with raw potatoes and damp humus, slightly musty notes. |
| Nutty (a) [7,40,41,42,44,45] | A combination of slightly sweet, brown, woody, oily, musty, astringent, and bitter aromatics commonly associated with nuts, seeds, beans, and grains. |
| Nutty (f) [7,40,41,42,45,47] | A combination of slightly sweet, brown, woody, oily, musty, astringent, and bitter aromatics commonly associated with nuts, seeds, beans, and grains. |
| Oily [40,42,44] | The amount of fat/oily film left on surfaces of the mouth after swallowing or expectorating. |
| Overall impact [41,42,43] | The maximum overall sensory impression during the whole tasting time. |
| Pungent (a) [7,40,42,44,45] | A sharp physically penetrating sensation in the nasal cavity. |
| Rioy (a) [11] | Aroma associated with iodine in water, described as chlorine-like, brassy, metallic, and chemical. |
| Roasted (a) [7,11,41,42,43,44,45,47] | Brown impression characteristic of products cooked to a high temperature by dry heat. It does not include bitter or burnt notes. |
| Roasted (f) [7,11,41,42,43,45,47] | Brown impression characteristic of products cooked to a high temperature by dry heat. It does not include bitter or burnt notes. |
| Salty taste [40,42,44] | Fundamental taste factor of which sodium chloride is typical. |
| Smoky (a) [40,41,42,43,44,45] | An acute pungent aromatic that is a product of combustion of wood, leaves or non-natural product. |
| Smoky (f) [41,43,45,46] | An acute pungent aromatic that is a product of combustion of wood, leaves, or non-natural product. |
| Sour aromatics (f) [7,40,42,46,47] | An aromatic associated with the impression of a sour product. |
| Sour taste [41,42,43,45] | The fundamental taste factor associated with a citric acid solution. |
| Spice brown (a) [42,44] | Sweet, brown aromatics associated with spices such as cinnamon, clove, nutmeg, allspice. |
| Stale (a) [11,41,42] | The aromatics characterized by lack of freshness. |
| Stale (f) [11,41,42,45] | The aromatics characterized by lack of freshness. |
| Sweet Aromatics (a) [7,40,41,42,45] | An aromatic associated with the impression of a sweet substance. |
| Sweet Aromatics (f) [7,41,42,45,47] | An aromatic associated with the impression of a sweet substance. |
| Sweet taste [40,41,42,44,45] | A fundamental taste factor of which sucrose is typical. |
| Tobacco (f) [7,40,42] | Characteristic reminiscent of tobacco’s odor and taste, but should not be used for burnt tobacco. |
| Winey (a) [40,42,44] | Sharp, pungent, somewhat fruity alcohol-like aromatic associated with red wine. |
| Woody (a) [7,11,42,43,44,45,47] | The sweet, brown, musty, dark aromatics associated with a bark of a tree. |
| Woody (f) [40,41,42,45] | The sweet, brown, musty, dark aromatics associated with a bark of a tree. |
1 This list of terms does not include the complete lexicon published by Chambers et al. [41] based on work done for World Coffee Research. It only includes terms actually used to differentiate coffee samples in other research studies. (a) aroma, (f) flavor.
Table 2.
Volatile compounds identified in roasted coffee.
| Chemical Group | Compound | Aroma Descriptors | References |
|---|---|---|---|
| Acetate | 2-Furanmethanol acetate | Ethereal-floral, herbal-spicy, Green | [63,65] |
| Acid | 3-methylbutyric acid | Sweaty | [5,64] |
| Acetic acid | Pungent | [4,5,6,7,8,9,42,52,63,64,65,66,67,68,69,70,71] | |
| Benzeneacetic acid | [68] | ||
| hexanoic acid | Fatty rancid, acrid, sweat-like, | [6,67,71] | |
| Isovaleric acid | Rancid, Cheese, | [9,42] | |
| Propanoic acid | Pungent, acidic, cheesy, vinegar | [9,63,65] | |
| Alcohol | 2,3-butanediol | Fruity, Creamy, Buttery | [63,67] |
| 2-Furanmethanol | Caramellic, burnt, smoky | [63,64,65,71] | |
| furfuryl alcohol | Caramel, Sweet, Coffee | [4,6,63,69] | |
| Aldehyde | 3-Methylbutanal | Malty, Fruity | [5,9,63,64,65,67,72,73] |
| 5-Methylfurfural | Spice, caramel, maple | [5,6,9,63,69] | |
| Acetaldehyde | Fruity, Pungent | [5,6,9,63,70,73] | |
| Benzaldehyde | Fruity, Almond, Bitter | [9,52,67,68,70,71] | |
| Hexanal | Grassy, Green, fatty-green | [6,52,63,65,67,69,71,72,74] | |
| Ester | Ethyl-3-methylbutyrate | Fruity | [75] |
| Trigonelline methyl ester | [55,61,68,69] | ||
| Furan | 2-Acetylfuran | Sweet, balsam, almond, cocoa | [63,64,69,74] |
| 2-Methylfuran | Pungent, fruity | [63,64,71,74] | |
| 5-furfural | Sweet, woody, almond | [4,6,9,52,63,65,67,69,72] | |
| Ketone | 1-Hydroxy-2-butanone | Sweet, coffee | [63,69] |
| 2,3-butanedione | Buttery, oily, fruity, caramel-like | [5,6,9,63,64,70,72,73] | |
| 2,3-Pentanedione | Buttery, oily, caramel-like | [5,9,64,67,72,73] | |
| 3-Hydroxy-2-butanone | Sweet, buttery, creamy | [63,65] | |
| Furaneol | Caramel, sweet | [9,52,63] | |
| Lactone | Butyrolactone | Caramel, Fatty, creamy, oily | [52,63,67,69] |
| Monoterpene | Limonene | Citrus-like | [9,52,72] |
| N-heterocyclic | 2-acetylpyrrole | Nutty | [68,69] |
| 1H-pyrrole-2-carboxaldehyde | Musty, beefy, coffee | [63,69] | |
| 1-Methyl-1H-pyrrole | Smoky, woody, herbal | [63,68,69] | |
| 3-Ethylpyridine | Rotten fish, smoky, leather, Tobacco | [63] | |
| Phenols | 4-Ethylguaiacol | Spicy, phenolic, sweet | [9,63,67,73,75] |
| 4-Vinylguaiacol | Clove, Spicy | [9,63,75] | |
| Guaiacol | Phenolic, burnt, smoky | [6,9,63,66,72,73] | |
| Pyrazine | 2-Isoamyl-6-methylpyrazine | [68] | |
| 2,3,5,6-tetramethylpyrazine | Fermented soy | [9,67] | |
| 2,3-Dimethylpyrazine | Nutty, roasted, chocolate | [9,63,69,72] | |
| 2,5-Dimethylpyrazine | Nutty, roasted, grassy | [5,9,63,64,67,69,72,75] | |
| 2,6-Dimethylpyrazine | Chocolate, cocoa, toasted nuts, roasted meat | [5,9,63,69,72] | |
| 2-Ethyl-3-methylpyrazine | Nutty, peanut, roasted matter | [9,63] | |
| 2-Ethyl-5-methylpyrazine | Coffee-like | [63,68,69] | |
| 2-Ethyl-6-methylpyrazine | Flowery, fruity, hazelnut-like | [5,63,64,68,69,72] | |
| 2-methylpyrazine | [63,64,67,69] | ||
| 3-Ethyl-2,5-dimethylpyrazine | Earthy, moldy, roasted | [63] | |
| Sulfide | Dimethyldisulfide | Cabbage-like | [9,76] |
| Furfurylmethyl sulfide | Onion, garlic, sulfurous | [63] | |
| Isopropyl p-cresol sulfide | [67] | ||
| Methional | Boiled Potato-like | [4,5,9,73,75] | |
| Thiols | 2-furfurylthiol | Roast, coffee-like, caramel, burned matter, fresh coffee | [4,5,58,69,73,75,77,78,79] |
| 3-Methyl-2-butene-1-thiol | Skunky, Smoke-roast | [78,79,80,81,82,83] | |
| Methanethiol | Sulfurous, fresh coffee | [4,5,9,78,79] |
© 2020 by the authors. Licensee MDPI, Basel, Switzerland. This article is an open access article distributed under the terms and conditions of the Creative Commons Attribution (CC BY) license (http://creativecommons.org/licenses/by/4.0/).
Share and Cite
MDPI and ACS Style
Seninde, D.R.; Chambers, E., IV. Coffee Flavor: A Review. Beverages 2020, 6, 44. https://0-doi-org.brum.beds.ac.uk/10.3390/beverages6030044
AMA Style
Seninde DR, Chambers E IV. Coffee Flavor: A Review. Beverages. 2020; 6(3):44. https://0-doi-org.brum.beds.ac.uk/10.3390/beverages6030044
Chicago/Turabian StyleSeninde, Denis Richard, and Edgar Chambers, IV. 2020. "Coffee Flavor: A Review" Beverages 6, no. 3: 44. https://0-doi-org.brum.beds.ac.uk/10.3390/beverages6030044
Note that from the first issue of 2016, this journal uses article numbers instead of page numbers. See further details here.