1. Introduction
Cava is a highly popular sparkling wine with Protected Designation of Origin (PDO) produced in various Spanish regions following the traditional Champenoise method. White cavas are just elaborated from the pressed must of white grapes, rosé cavas are subjected to a must maceration with its own skins and peas for a given period of time, and “blanc de noirs” cavas are produced with musts coming from black skin grapes but with no maceration process. After that, enzymes and SO
2 are added to clarify and avoid some unwanted processes such as the oxidation of polyphenols. The alcoholic fermentation is carried out after the must clarification inside stainless steel tanks in which selected yeasts are added to transform the sugars into ethanol and CO
2. Once the alcoholic fermentation is completed, base wines can be subjected to the malolactic fermentation (MLF) to convert malic acid into lactic acid. MLF provides a notable change in acidity features, leading to a more pleasant and bulky mouthfeel [
1]. At the end of this step, base wines are ready to be mixed to create the desired coupages or blends. Wines are then stabilized, bottled with a small volume of the
tirage liquor (mixture of sugars, yeasts and wine) to perform the second fermentation inside the own bottle. Finally, cavas are aged in the cellar for a minimum of 9 months. A total of 200 million liters of cava are yearly commercialized, representing more than EUR 1100 M and being the most exported Spanish wine. Owing to the great social and economic impact around the cava trade, mechanisms of control to ensure the standards of quality and to prevent potential fraudulent practices are needed, especially those based on rapid, simple and inexpensive analytical methods suitable for large series of samples [
2,
3,
4].
The classification, authentication and traceability of wines and related products is a hot topic of agricultural and food science [
5,
6]. In many cases, chemometric methods for data analysis are required to help to extract the underlying information and provide feasible descriptive and classificatory models. In this regard, principal component analysis (PCA) is typically used for exploratory studies of wines to deduce trends related to oenological features. Further classification surveys can be based on linear discriminant analysis (LDA), partial least square-discriminant analysis (PLA-DA), cluster analysis (CA), soft independent modeling of class analogy (SIMCA) analysis, etc. For additional details, reference [
7] reviewed the possibilities of multivariate methods for the assessment of geographical origins of wines.
The number of publications on wine characterization has increased dramatically in the last years and some basic considerations on the analytical possibilities and working strategies have been established [
8]. Nowadays, near-infrared spectroscopy (NIR) is one of the most successful approaches to carry out authentication studies from a fingerprinting approach, taking advantage of features such as the simplicity and reduced instrumental cost [
9]. An interesting revision facing the possibilities of NIR was published by Wang et al. [
10], including representative examples of alcoholic beverages and other food products. In parallel, elemental and isotopic analysis has demonstrated its great performance, especially for dealing with geographical issues, as the elemental composition of grapes and wines is highly dependent on terroir factors [
11]. Other alternative instrumental techniques often applied to food authentication include NMR and MS, providing excellent discriminatory performance despite the higher degree of instrumental sophistication and cost [
12,
13]. UV-vis and fluorescence spectroscopies have also been used in the study of food features [
14]. The potentiality of joining data from different instrumental sources has been critically evaluated by Borrás et al. [
15] showing the advantages in the sample description from the richer data fusion systems.
Some recent wine characterization and authentication applications rely on a more specific phenolic profiling approach using separation techniques, mainly liquid chromatography (HPLC) with UV detection, for a feasible and accurate quantification of targeted compounds. For instance, red wines of Rias Baixas and Ribeira Sacra have been analyzed by HPLC-UV and the resulting compositional profiles have been used for their classification [
16]. Other authors have applied phenolic profiling by HPLC-UV to discriminate among Malbec wines produced in Mendoza (Argentina) and California (USA) regions [
17]. The authentication of Czech Republic wines from different terroirs has also accomplished by HPLC profiling based on hydroxycinnamic and flavonoid components [
18]. Another comprehensive survey for the characterization and classification of Spanish wines or cavas from Penedès, Rioja and Ribera designations of origin has also been based on HPLC with UV-vis multi-way and fluorescence detection to provide more sensitive and selective data [
19]. In order to go into detail in the characterization of potential markers of wines classes defined by origins, varieties, blends, vintages, etc., HPLC with mass spectrometry (MS) detection is able to generate a rich set of discriminant features that could further submitted to structural elucidation [
20,
21]. Apart from HPLC, other separation techniques have been used such as thin-layer chromatography [
22], GC-MS [
23] and capillary zone electrophoresis [
24,
25].
Alternative approaches to separation methods have also been proposed in the literature such as electroanalytical assays carbon nanotube-modified electrodes for the determination of the phenolic acid and flavonoid content of white wines [
26]. Electronic tongue devices based on enzymatic biosensors have also been applied to the quantification of this type of analytes towards a fast and simple characterization of wines [
27]. In some cases, phenolic data have been complemented with information from other families of compounds to increase the descriptive performance. For instance, phenolic indexes, phenolic acid and flavonoid contents have been combined with concentrations of organic acids, sugars and biogenic amine to try to recognize autochthonous Calabrian red wines from other similar [
28].
This work is focused on the study the possibilities of phenolic acid profiles and fingerprints obtained by HPLC with UV detection to discriminate and classify cavas made from different grape varieties and blends. The chromatographic method has been established previously and applied to the determination of the most important hydroxybenzoic and hydroxycinnamic acid, and flavonoids components in white wines and cava samples [
29,
30]. Cava samples belonging to various classes have been analyzed and the resulting data have been treated with chemometric methods to extract the relevant information. The study of the sample distribution by PCA has identified potential discriminating factors among cavas. Further studies by PLS-DA have accomplished the classification of samples according to their phenolic composition and new (unknown) samples have been successfully assigned to their corresponding classes.
2. Materials and Methods
2.1. Chemicals and Solutions
Gallic, homogentisic, protocatechuic, caftaric, gentisic, vanillic, caffeic, syringic, ferulic, and p-coumaric acids, and (+)-catechin, (−)-epicatechin, ethyl gallate, resveratrol, rutin, myricetin, quercetin, kaempferol and apigenin were purchased from Sigma-Aldrich (St. Louis, MO). Pure stock standard solutions of each phenolic acid were prepared at 5000 mg L−1 in methanol (UHPLC-Supergradient, Panreac ApplyChem, Castellar del Vallès) and stock standard solutions of resveratrol and flavonoids were prepared at 1000 mg L−1 in dimethyl sulfoxide (for analysis, 99.9%, Panreac ApplyChem). Formic acid (>96%, Merck KGaA, Darmstadt, Germany), methanol and water (Elix3, Millipore, Bedford, MA) were the components of the mobile phase used in the chromatographic method. Working standard solutions consisting of a mixture of analytes at concentrations ranging from 0.05 to 20 mg L−1 were prepared in methanol:water (1:1, v:v) as the solvent. These standard solutions were stored at 4 °C in the refrigerator for no more than 1 week.
2.2. Samples
Cava samples were kindly provided by Raventós Codorníu Group. The set of analyzed samples come from the harvest of 2016–2017 and consisted of white and rosé cavas produced in Penedès and Costers del Segre regions (both from Catalonia, Spain). Different white grape varieties—Chardonnay (Ch), Macabeu (Ma), Xarel·lo (Xa), Parellada (Pa)–, and the black ones—Blanc de Noirs (BN, from PN), Pinot Noir (PN), Monastrell (Mo), Garnacha negra (Ga) and Trepat (Tr)—have been studied. Base wines resulting from the first fermentation were conveniently blended to produce the following cava combinations according to their aging period as shown in
Table 1. The total of 75 samples under study consisted of 5 classes of monovarietal cavas (10 samples in each class) and 5 types of blended cavas (5 samples in each class). It should be pointed out that despite class C is not monovarietal, the combination of Macabeu, Xarel·lo and Parellada has been considered as a main class since it is the traditional coupage of Catalan Cavas. Samples were degasified and filtered through a nylon membrane (0.45 µm pore size) prior HPLC-UV analysis.
A quality control (QC) solution was prepared mixing 50 µL of each cava sample. The QC was used to evaluate the reproducibility of the chromatographic method and the significance of the PCA models. Cava samples were analyzed randomly, and the QC was repeatedly injected every 10 samples.
2.3. Chromatographic Method
The chromatographic system was composed of an Agilent Series 1100 HPLC Chromatograph (Agilent Technologies, Palo Alto, CA, USA) equipped with a quaternary pump (G1311A), a degasser (G1322A), an automatic injection system (G1392A) and a diode array detector (G1315B). An Agilent ChemStation for LC 3D (Rev. A. 10.02) software was used for instrument control and data processing. The chromatographic method was previously optimized and validated [
29,
30]. It was based on reversed-phase mode using core-shell column (Kinetex, 100 mm × 4.6 mm I.D., 2.6 μm particle size from Phenomenex, Torrance, CA, USA) and 0.1% formic acid aqueous solution and methanol as the components of the mobile phase. The elution gradient was as follows: 0 to 20 min, 15–60% methanol (lineal increase); 20 to 22 min, 60–90% methanol (lineal increase); 22 to 27 min, 90% methanol (cleaning step); 27 to 27.5 min, 90–15% methanol (lineal decrease); 27.5 to 30, 15% methanol (conditioning step). The flow rate was 1 mL min
−1 and the injection volume was 10 µL. Chromatograms were acquired at 280, 310 and 370 nm.
2.4. Data Analysis
Exploratory and classification studies were carried out using PLS-Toolbox (Eigenvector Research, Inc. Manson, WA, USA) working with MATLAB (MatWorks Natick, MA, USA). X-data matrices corresponding to either concentrations (profiling approach) or chromatographic fingerprints (fingerprinting approach) were preliminarily evaluated by principal component analysis (PCA) to try to find patterns for sample characterization. Further discriminatory studies to assign unknown cava samples to their corresponding classes relied on partial least square-discriminant analysis (PLS-DA). Apart from the profiling or fingerprinting X-matrices, the belonging of each sample to a predefined class was conveniently coded in the Y-matrix. The number of latent variables to build the classification models was established by cross validation under Venetian bind approach. Once the models were validated, they were used to predict the membership of the new unknown cava samples.
3. Results and Discussion
Cava samples were analyzed according to a HPLC-UV/vis method previously established for the determination of the most abundant phenolic acids and flavonoids in cava and white wines [
29,
30]. The optimized chromatographic method was able to separate successfully the target compounds in standard mixtures. In the case of cava samples, however, additional peaks of unknown species were found which may overlap with the analytes. Anyway, the occurrence of coeluting peaks was irrelevant in fingerprinting while, in profiling, data from partially resolved peaks may be more imprecise.
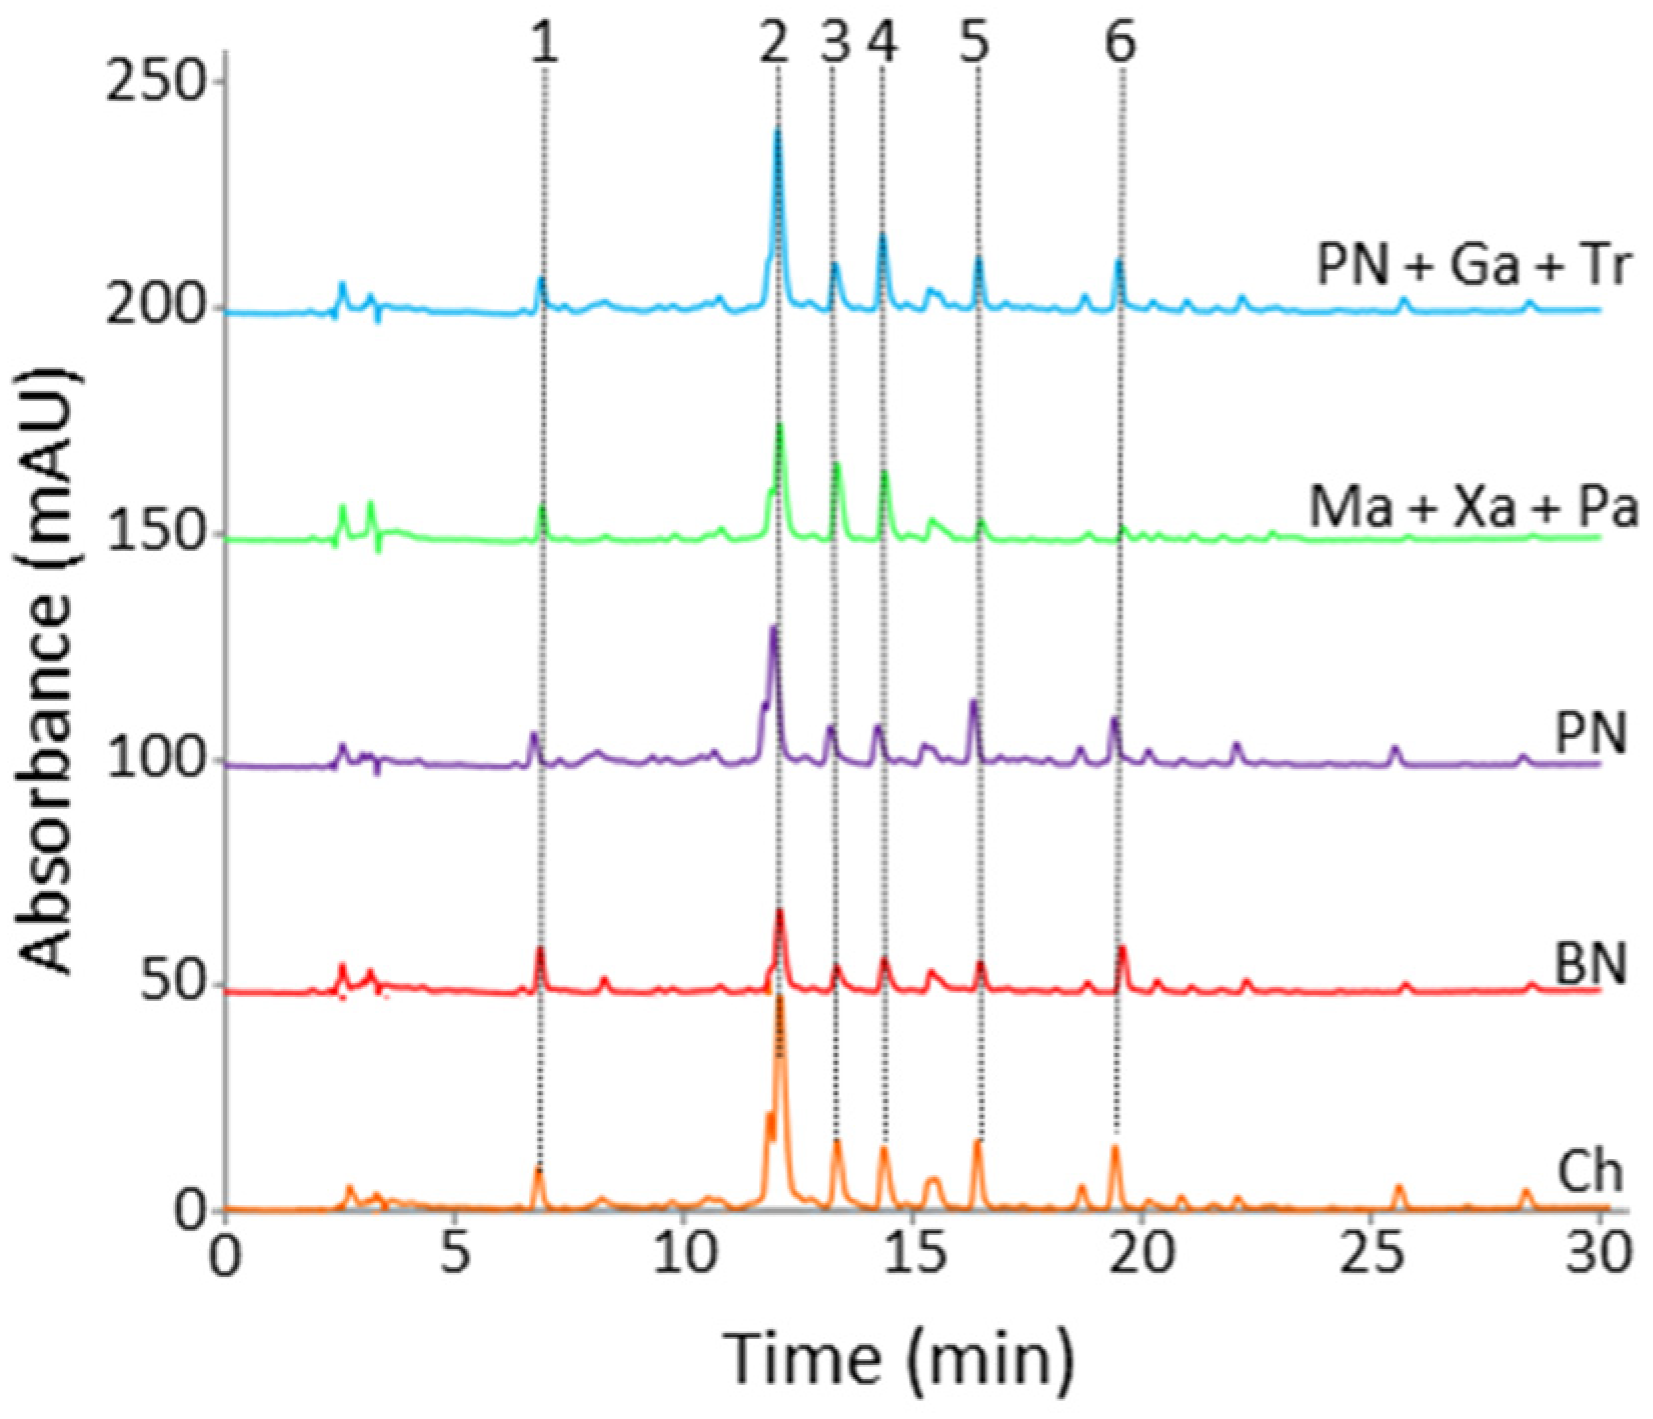
Although chromatograms were recorded at 3 different wavelengths (280, 310 and 370 nm), the richest fingerprints in terms of intensity of absorbing compounds were obtained at 280 nm which mainly corresponded to benzoic acids. Alternatively, detection at 310 nm provided clearer chromatograms with an easier identification of peaks of hydroxycinnamic acids and their esters with tartaric acid. In contrast, detection at 370 nm displayed poor information since flavonoid concentrations were low in this kind of samples. Detection at 310 nm was finally preferred as a compromise among sensitivity and selectivity.
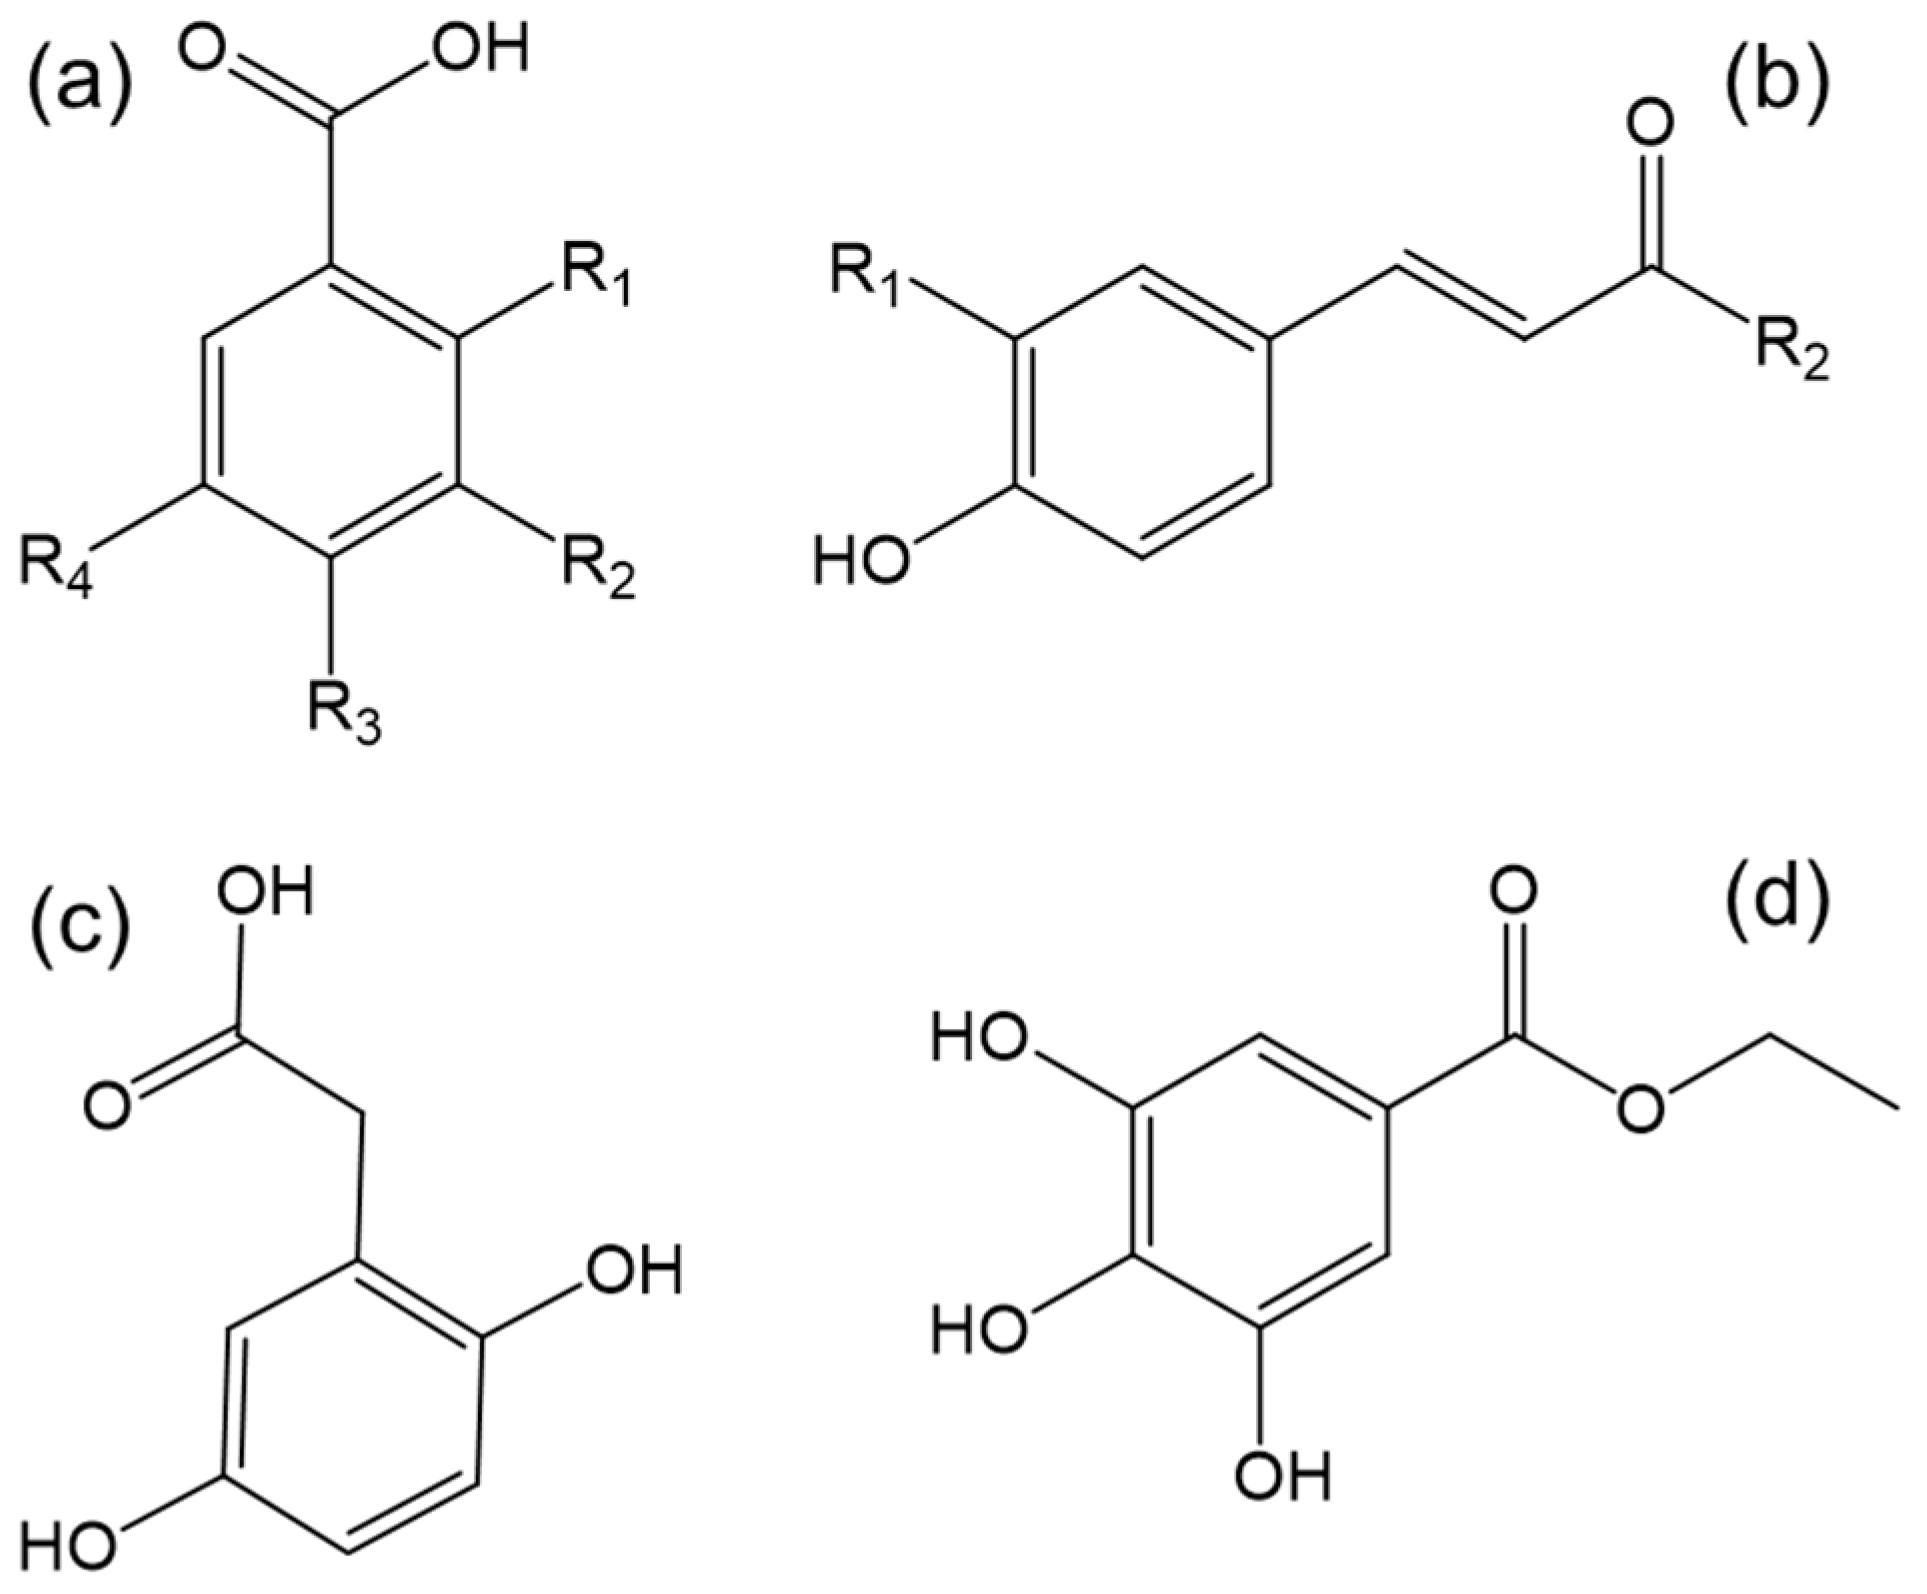
Figure 1 shows the structures of the most relevant phenolic acids considered in this paper as tentative wine descriptors.
When comparing some featured monovarietal and blend cavas, the visual inspection of chromatograms depicted in
Figure 2 showed differences regarding phenolic acid composition and levels. Some relevant peaks found in the chromatograms were identified from the comparison of spectral and chromatographic features with those of pure standards. In this way, compounds such as gallic, caftaric, gentisic, vanillic, caffeic or
p-coumaric acid were detected. Anyway, some unknown signals are still pending of assignation. The quantification of compounds was carried out using 10 different standard mixtures with concentrations ranging from 0.05 to 20 mg L
−1 for each analyte to establish the corresponding linear regression models.
Quantitative results indicated that monovarietal Ch samples displayed, in general, the highest concentrations for most of the analytes. Rosé cavas such as the monovarietal PN and the blend of Mo, Ga, and Tr were also rich in phenolic compounds. On the other hand, the classical blend of Ma, Xa and Pa showed lower concentrations, except for gentisic and caftaric acids. Finally, the BN class was the one exhibiting the lowest levels of phenolic compounds. As can be seen below, these general differences in composition were exploited in further discrimination and classification studies as a function of grape varieties, blends and winemaking processes.
3.1. Exploratory Studies by PCA
3.1.1. Study of Chromatographic Fingerprints
Chromatograms acquired by UV spectroscopy at several working wavelengths were used as the data to be treated by PCA for a preliminary characterization of cavas according to class varieties. As detailed in the experimental section, fingerprint datasets consisted of absorbance values taken over a selected time window from the set of samples under study. QCs were also included to assess the soundness of the model. The performance of the PCA models built with chromatograms at 280 and 310 nm was first compared. Although the results were quite similar in terms of sample description ability, conclusions extracted from the data set at 310 nm seemed to be more solid as the experimental variability and the compactness of the group of QCs were better. For this reason, we have restricted the description of the PCA results to the best model at 310 nm.
Data were taken within the time window 6.30–27.30 min containing most of the peak features while the initial chromatographic and column cleaning ranges were excluded. The resulting X–matrix was composed of 84 samples (75 cava wines and 9 QC replicates) and 2700 time variables. The PCA model captured more than 75% of data variance with 3 principal components (PCs) (52.6, 17.0 and 6.6% for PC1, PC2 and PC3, respectively). It was deduced that PC1 discriminated among rosé (right side) and white (left side) cavas based on differences in the distribution of the major phenolic signals (see
Figure 2). PC2 was mainly focused on the modeling the chromatographic variability associated to baseline drifts and peak shifting so that, in this case, it was less relevant from the point of view of the wine description. On the contrary, PC3 dealt with the overall phenolic content, with samples rich in phenolic compounds at the top and those with lower concentrations at the bottom.
QC samples clustered in a compact group in the central area of the scores plot, thus confirming the reproducibility of the chromatographic data and the robustness of the PCA model. Besides, samples belonging to each cava class were closely grouped (see
Figure 3) because of their analogous features and phenolic composition. In more detail, the four rosé cava types were on the right side, white wines including the classical blend and Ch were located at the top left part, and BN samples were at the bottom left part (divided in two groups, with and without MLF, respectively). As a result, the classical blend of Ma, Xa and Pa and the monovarietal PN, BN and Ch were quite separated from each other, in agreement with differences in composition. The evolution of class groups as a function of the Ch percentage was also evidenced from the scores plot. For instance, blends with increasing amounts of Ch (e.g., E, A and S classes) were found in intermediate positions between pure Ch (class G) and Ma, Xa and Pa (blend C).
3.1.2. Study of Compositional Profiles
Another PCA model was carried out using concentrations or peak areas of various relevant components, including well-known phenolic compounds, flavonoids and other related species. The study was initially conceived considering the list of 19 compounds given in the experimental section (see
Section 2.1), which were chosen as they could be present in white wines. From this list, phenolic acids such as gallic, gentisic, vanillic, caftaric, caffeic, coumaric acids (see structures in
Figure 1) as well as various unknown related species were detected at 310 nm. In contrast, flavonoids such as rutin, myricetin, quercetin, kaempferol and apigenin absorbing at 370 were not found; also, flavanols monitored at 280 nm, such as catechin and epicatechin, and components such as resveratrol were undetectable.
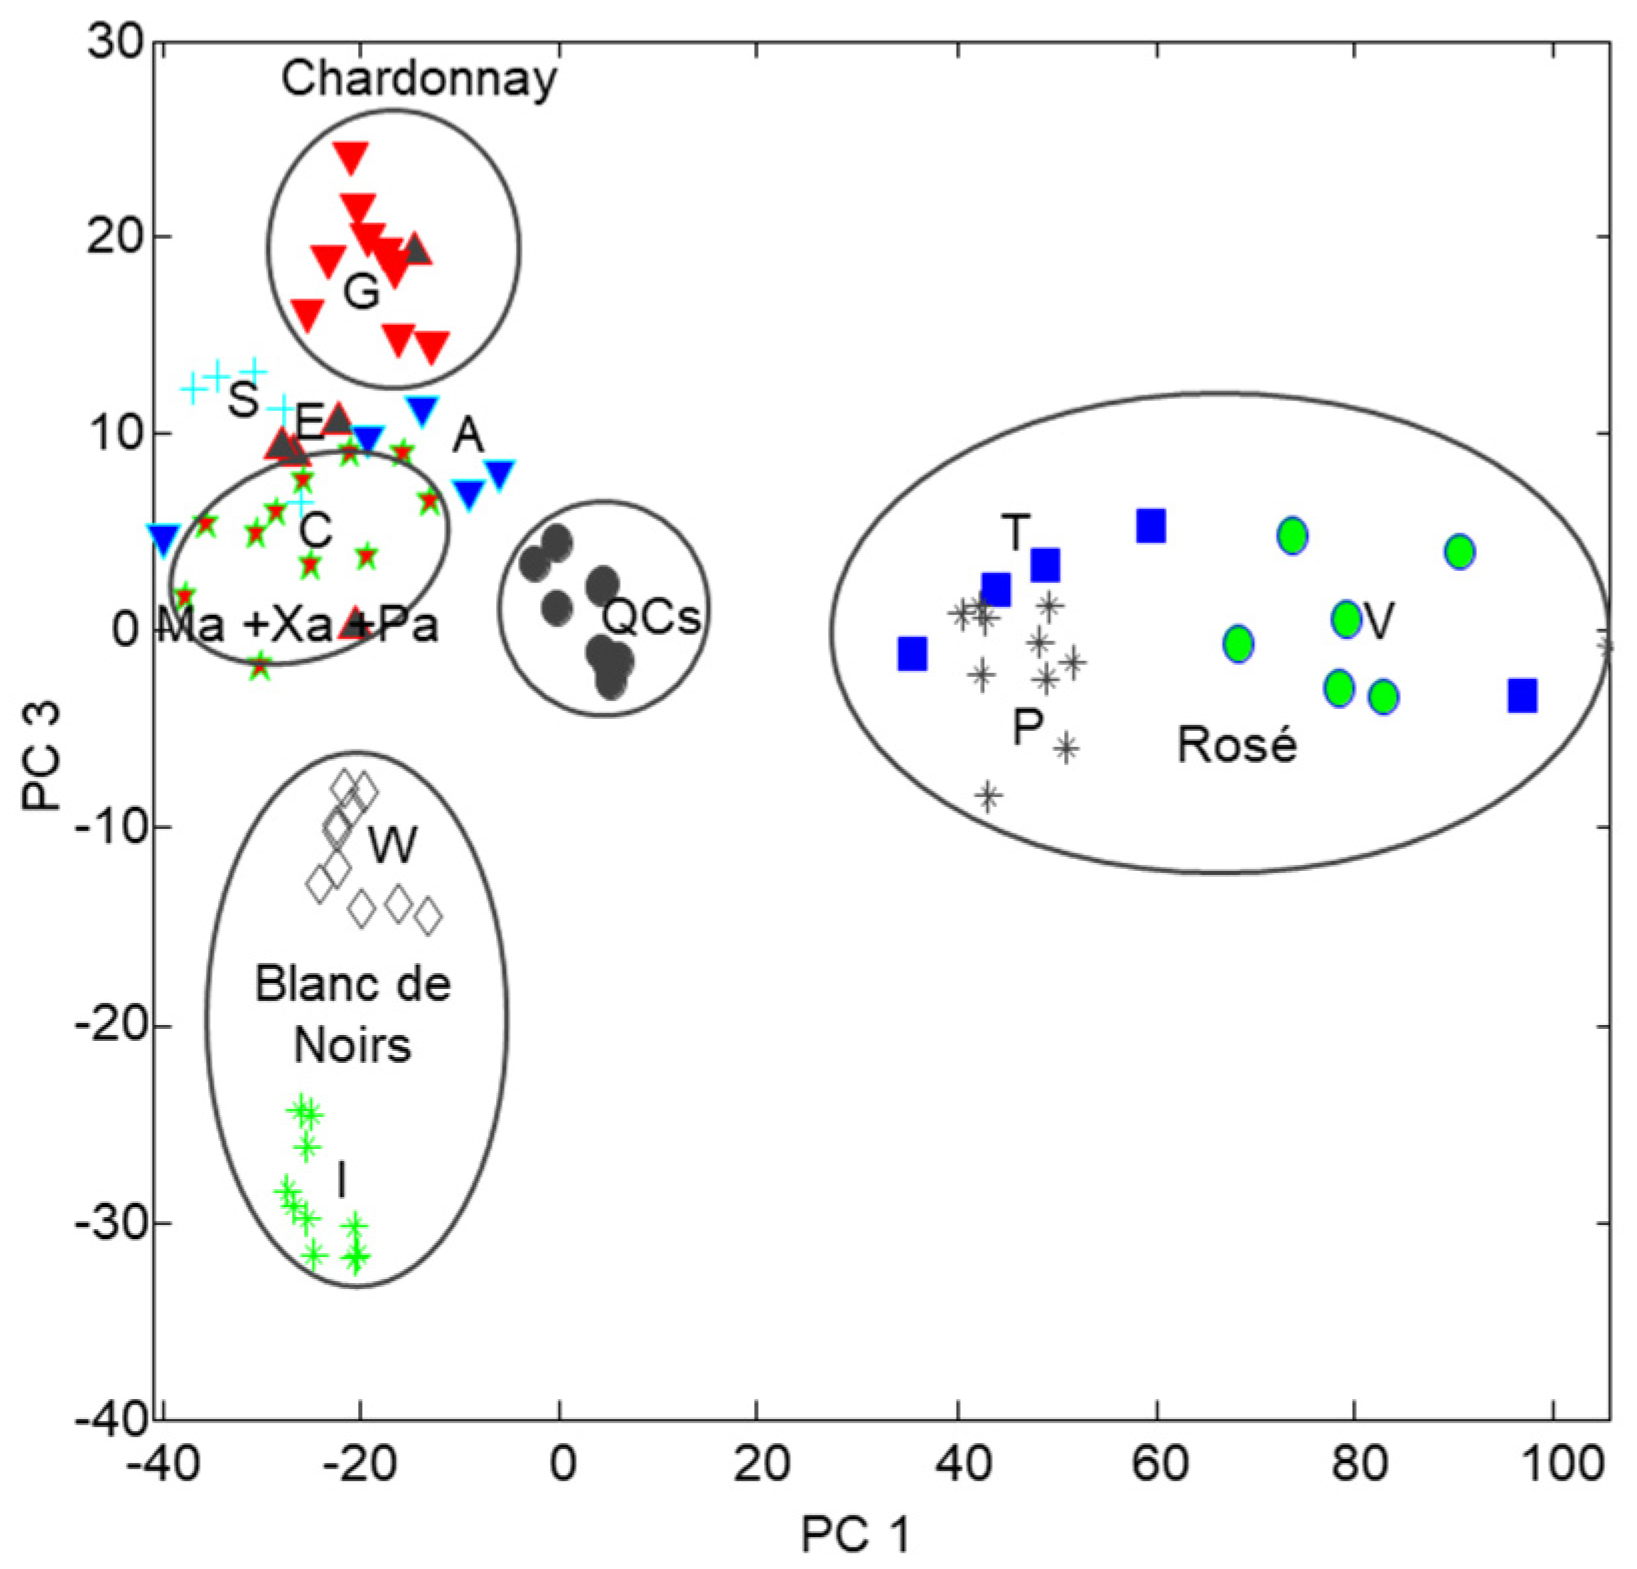
For this PCA study, data from those samples belonging to the same class were averaged to provide a simplified and more robust description of cava behavior. Hence, the X–matrix was composed of 10 sample classes and 10 compounds as the variables (see
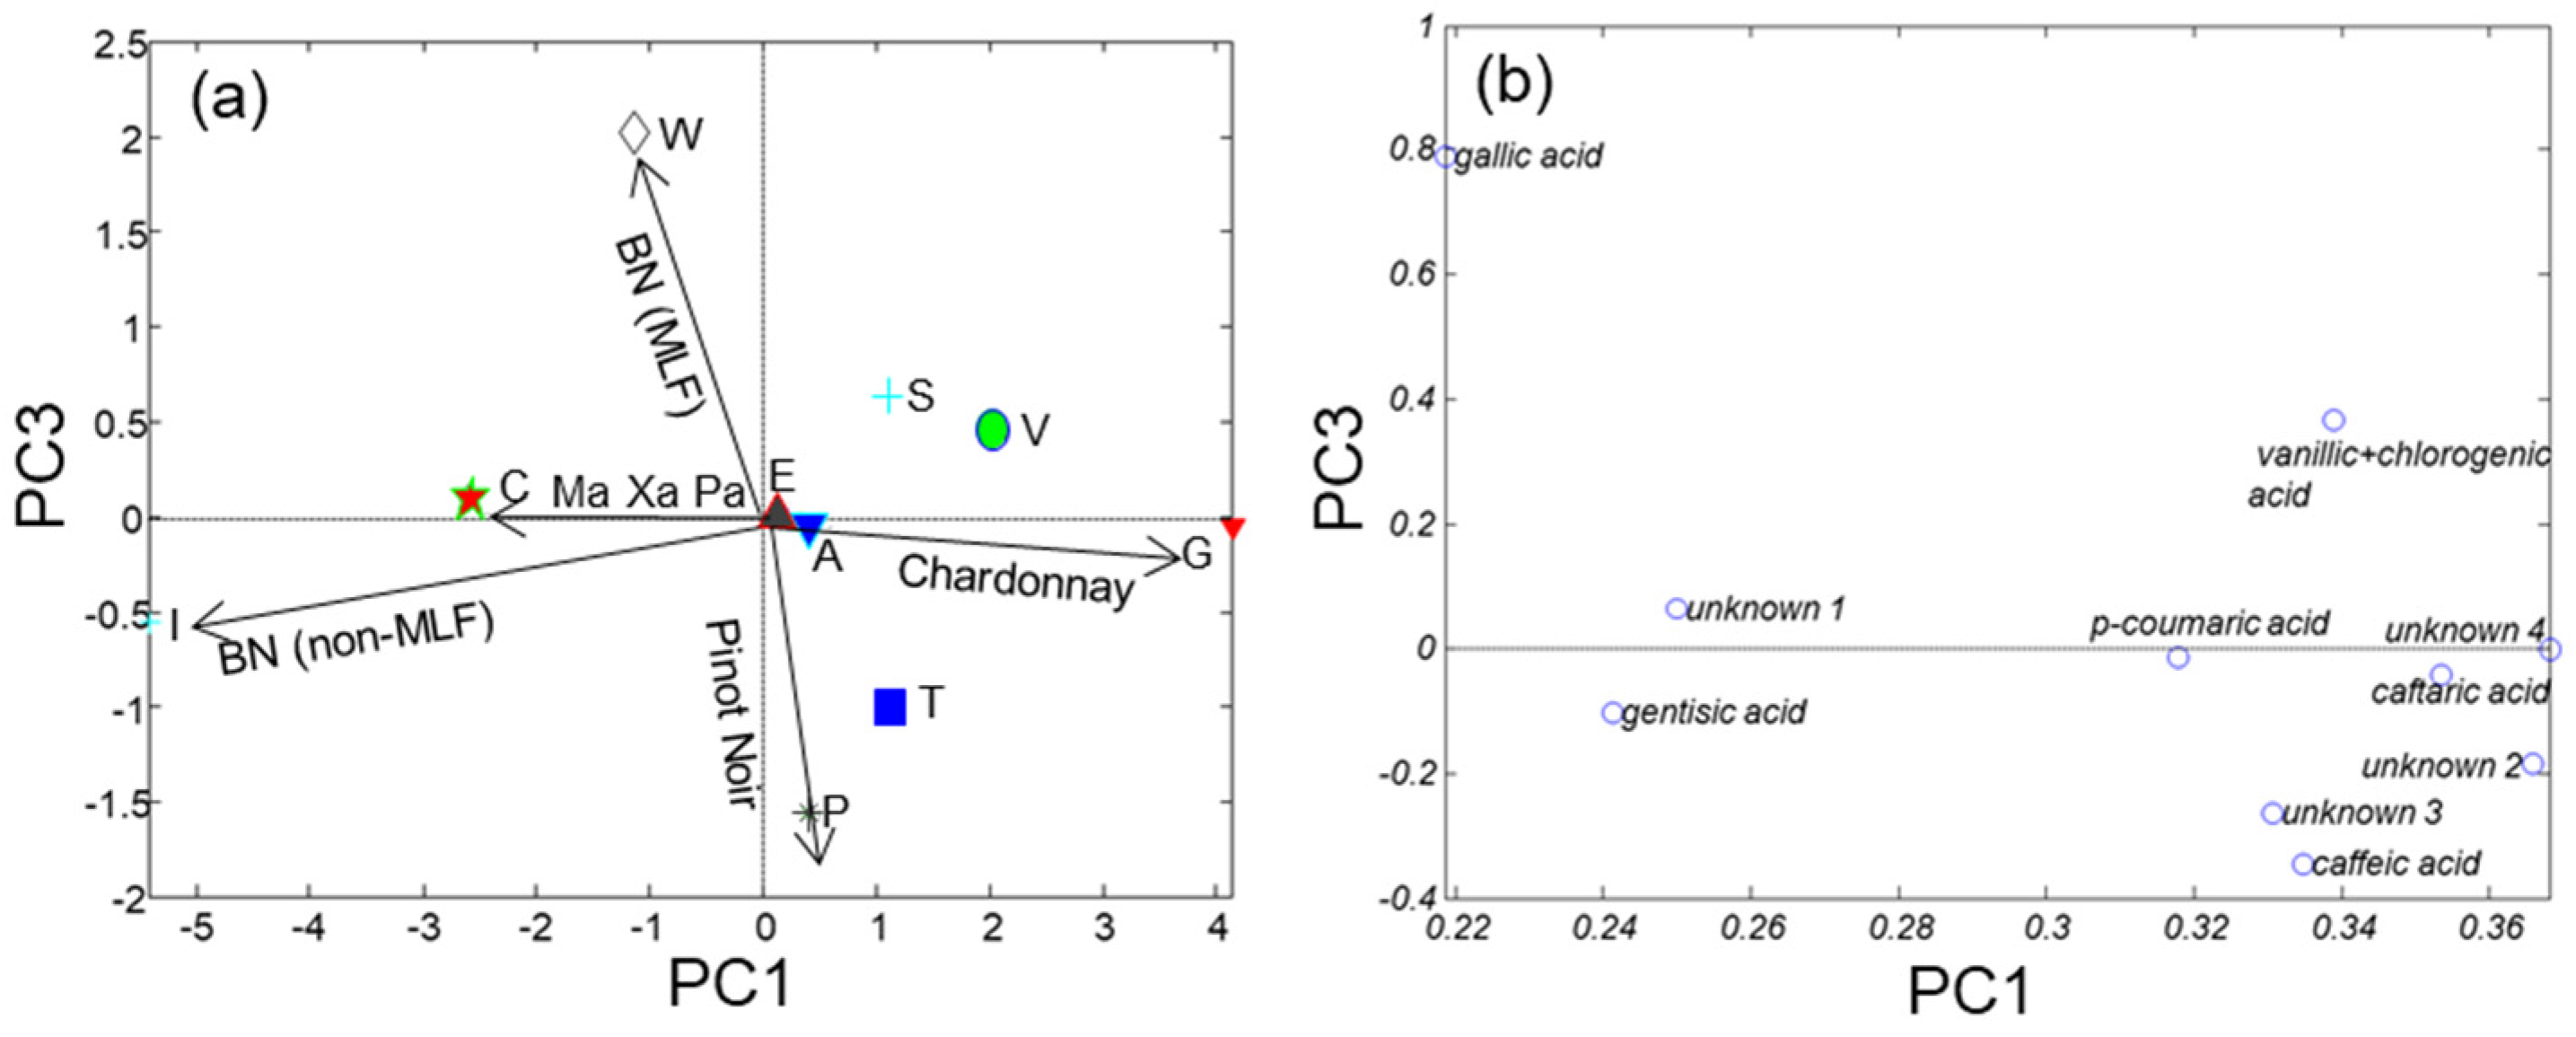
Table 2). The autoscaled PCA model retained 68.3%, 17.0%, 9.3% of data variance on PC1, PC2 and PC3, respectively. Plots of scores and loadings of PC1 vs. PC3 are depicted in
Figure 4. It was first concluded that PC1 explained the overall concentration of phenolic compounds which increased from left to right. PC3 described differences in the distribution of components. Ch, PN and BN with and without MLF were in extreme positions in the plot of scores (right, down, left and top, respectively); the classical blend of Ma, Xa and Pa was in the left part of the graph. The gradation in the Ch percentage was also observed in the classical and PN cases.
Variables nearby in the loadings plot were positively correlated such as, in the right side, caftaric and caffeic acids (r = 0.73), p-coumaric and caffeic acids (r = 0.90) or caftaric acid and unknown compound 2 (r = 0.87), possibly because they belong to the same family of hydroxycinnamic derivatives. On the left side, gentisic acid and unknown 1 were found pretty close (r = 0.84). In contrast, gallic and vanillic acids showed a quite independent behavior as they were uncorrelated with any other variable.
Despite the lack of specificity, the most characteristic markers of each cava type could be deduced from the simultaneous analysis of scores and loadings. In agreement with the previous model, it was concluded that Ch is rich in caftaric acid, p-coumaric acid, vanillic acid and caffeic acid, whereas, gentisic acid is more abundant in the classical blend. On the other hand, rosé samples have a different phenolic pattern. Finally, in the case of BN samples, increased levels of gentisic acid without MLF and gallic acid with MLF were encountered.
3.2. Classification Studies by PLS-DA
This section is focused on the assessment of classification models by PLS-DA as an initial survey towards cava authentication. As a proof of concept, various classification cases were designed to assign cava samples to pre-established classes. As a general strategy, the set of cava samples was divided into two subgroups for calibration and prediction which accounted ca. 70% and 30% of the samples (randomly selected), respectively. The calibration set contained well-known cava samples belonging to the different classes which were used to create a classification model using chromatographic fingerprints as the data. Samples included in the prediction set were considered as unknowns to be assigned. As detailed below, Blanc de Noirs vs. non-Blanc de Noirs and Chardonnay vs. non-Chardonnay cases were selected as model examples to evaluate the classification performance of PLS-DA based on phenolic information.
3.2.1. Blanc de Noirs Versus Other Cavas
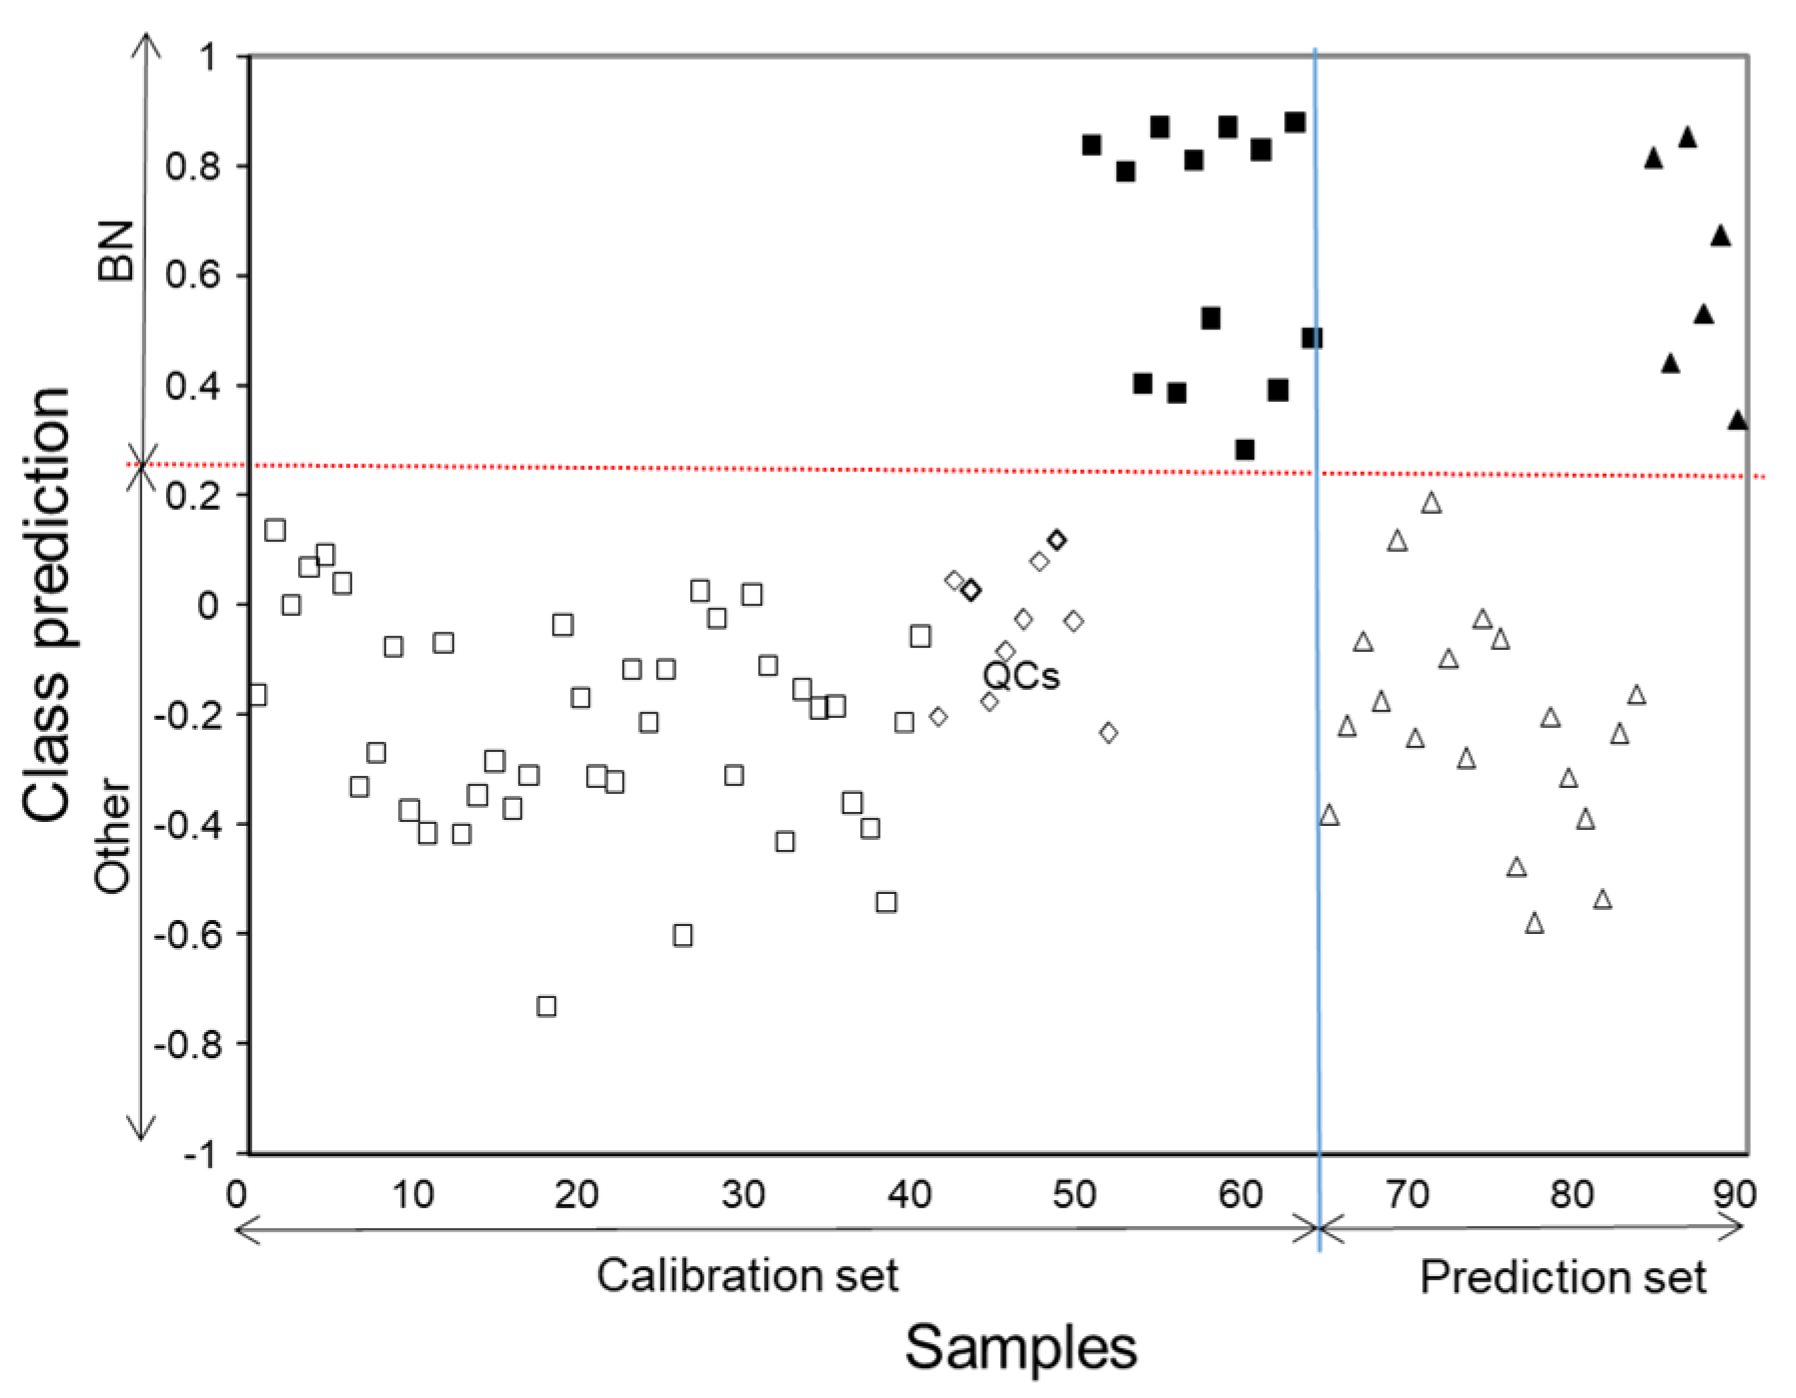
This model intended the recognition of monovarietal BN cava samples from the rest of blends including the other varieties, so, two classes were defined accordingly: (i) BN, both subjected or not to MLF and (ii) non-BN including the remainder of cava samples from the other blends. The calibration set was composed of 54 samples, including 9 QC replicates. X-data consisted of chromatograms taken at 310 nm within the working time window (6.3 to 27.3 min). Y-data described the belonging to BN and non-BN classes with the code 0 and 1, respectively. The prediction set consisted of 25 “unknown” samples to be identified as BN and non-BN members.
The estimation of the optimum number of latent variables by cross validation according to a Venetian blind approach indicated that the minimum of the root mean standard error in cross validation (RMSECV) was achieved at 4 LVs, so this number was used in both calibration and prediction steps by PLS-DA. The assignation plot in
Figure 5 showed that all the samples used for calibration were correctly located, down and up of the threshold line those belonging to the Blanc de Noirs class and non-Blanc de Noirs class, respectively. Analogously, “unknown” samples of the prediction set were also assigned correctly to BN and non-BN classes. It should be noted that this classification model grouped both BN samples with and without MLF. Differences in the phenolic composition due to MLF processes were less noticeable than those found with respect to the other classes.
3.2.2. Chardonnay Versus Other Cavas
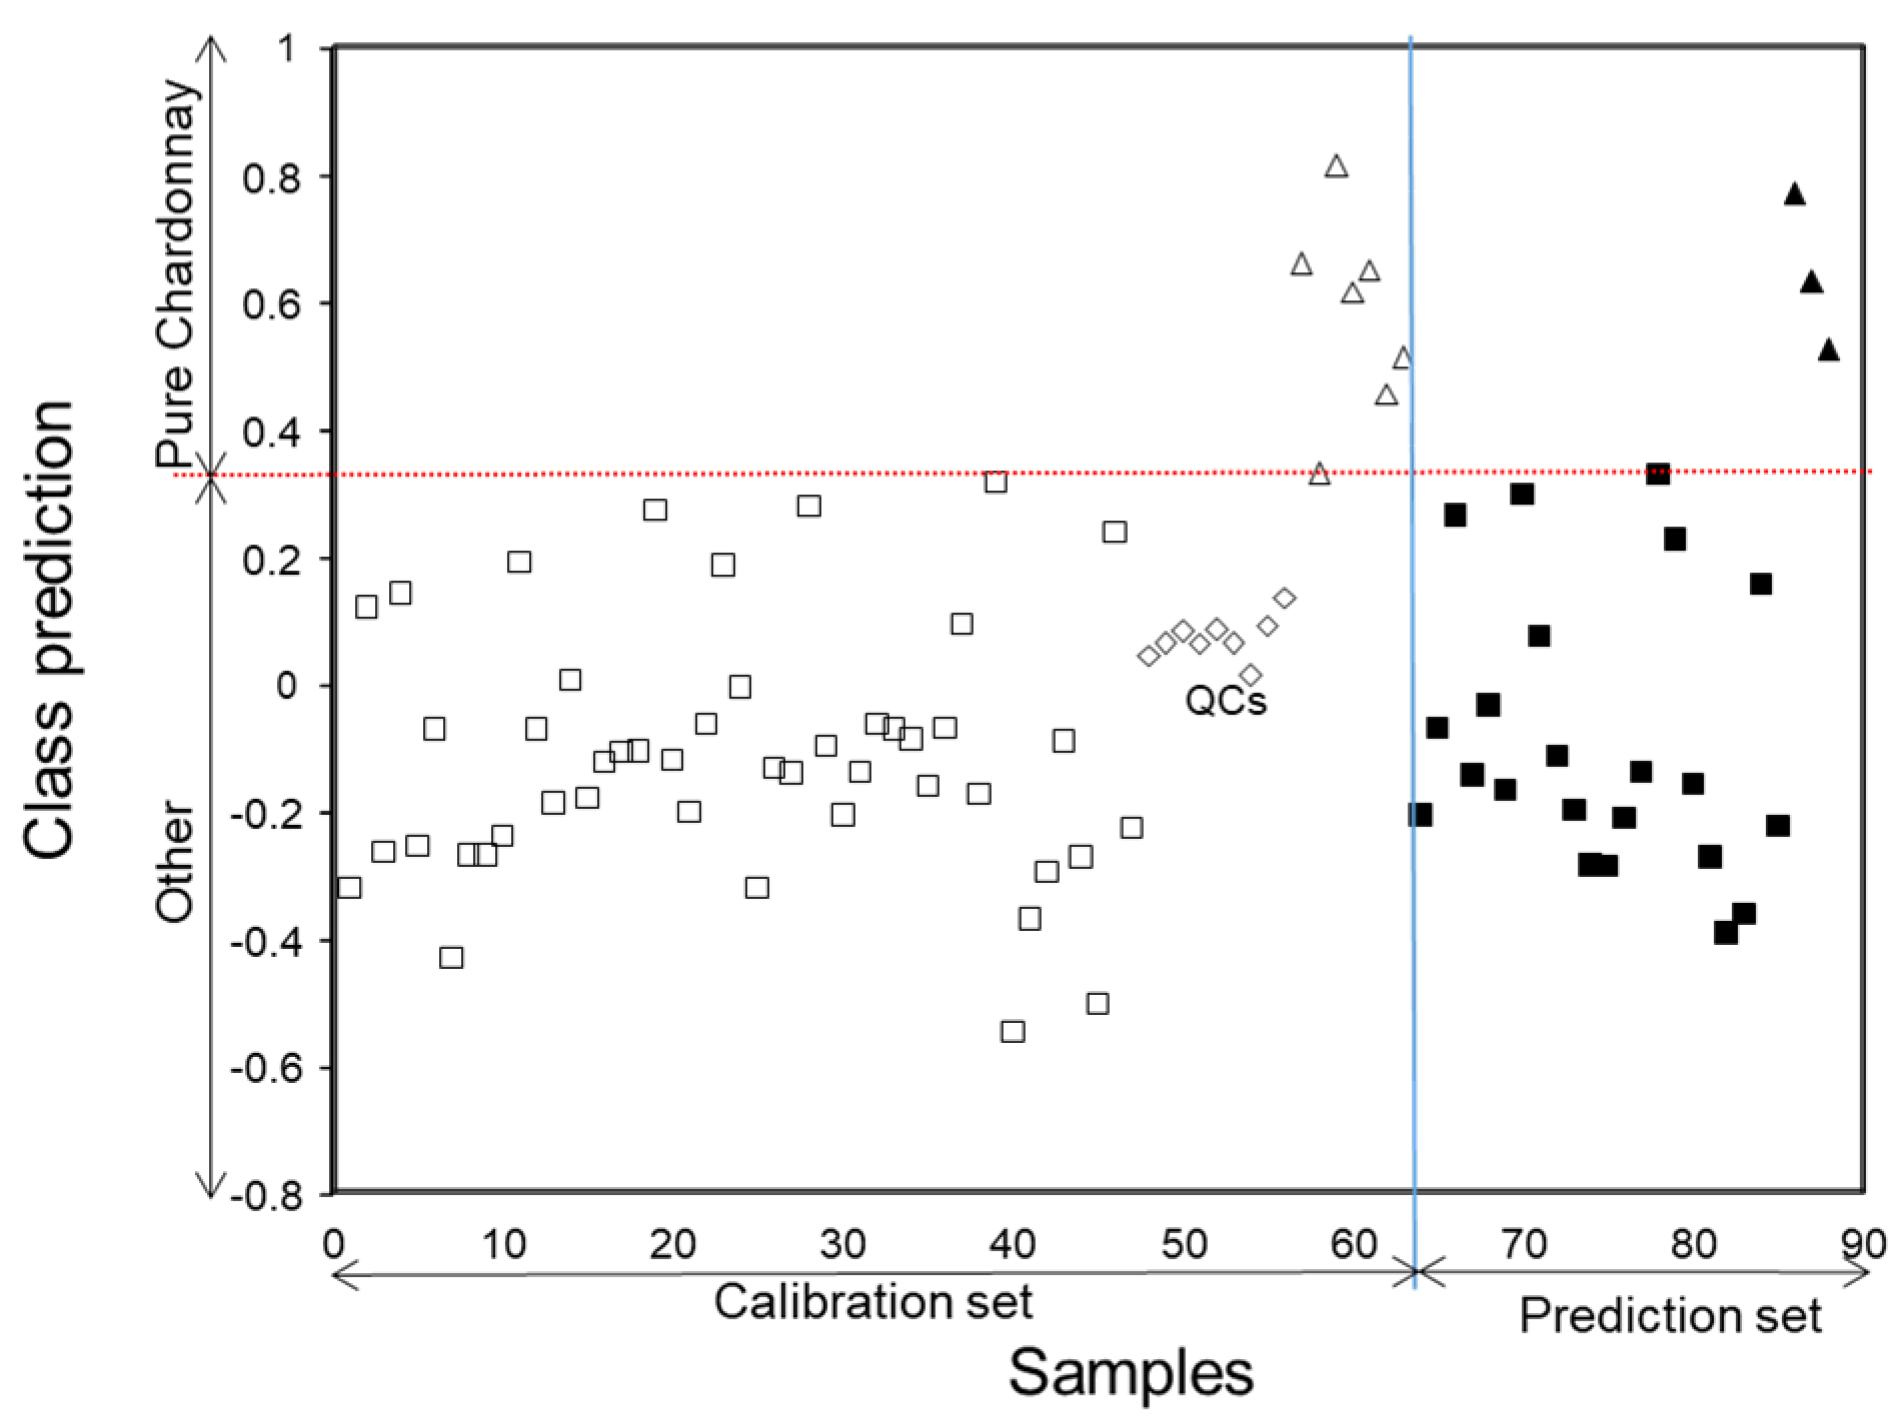
This example aims at identifying pure (monovarietal) Ch cavas from other classes, including those elaborated with other varieties and blends containing different proportions of Ch. This model presented high mathematical complexity, as cava with high percentages of Ch could be confounded with the pure ones and vice versa. Two classification classes were defined accordingly, referred to as Ch (pure Chardonnay) and non-Ch (other cava wines). In total, 64 samples belonging to the different blends (including 9 QC replicates) and 24 “unknown” samples were used in the calibration and prediction sets, respectively. As in the previous case, chromatographic data taken at 310 nm within the time window 6.30 to 27.30 min were used in the X-matrix. The Y-data matrix coded the belonging to Ch and non-Ch classes with 1 and 0, respectively.
The optimum number of LVs, corresponding to the minimum of RMSECV function, was 6. Results of both calibration and prediction steps are summarized in the assignation plot of
Figure 6. As it can be seen, all the samples used for calibration were correctly predicted (just one Ch cava was on the edge of the threshold line separating the two classes). In a similar way, “unknown” samples could also be identified successfully. Besides, it should be mentioned that non-Ch samples located next to the decision boundary line consisted of blends containing high percentages of Ch base wine in their composition. Since their chemical composition was quite similar to pure Ch, they appeared very close to the Ch samples.
4. Conclusions
This work proposed a new strategy to identify and assign cava samples to predefined classes using phenolic data as the source of information. It was found that the composition of hydroxybenzoic, hydroxycinnamic acid depended on the cava varieties and blends so such data can be exploited to extract relevant patterns about the behavior of samples with the assistance of chemometric methods. First, exploratory studies by PCA revealed that cavas could be distinguished as a function of blends and phenolic compounds were good descriptors in terms of MLF. Subsequently, the discrimination of cavas by PLS-DA was evaluated in two cases of different complexity. The first one dealt with the identification of monovarietal Blanc de Noirs samples, with respect to other classes that did not contain this variety. The second one dealt with the detection of monovarietal Chardonnay cavas in front of other ones. In any case, excellent results in terms of selectivity and sensitivity were achieved with classification rates of 100%.
To summarize, phenolic data combined with chemometric analysis resulted in an excellent approach to classify cava wines according to wine varieties and blends and winemaking process in terms of MLF. On the other hand, it should be emphasized that the method is not limited to the cases presented here but it can be adapted to more complex studies. In this regard, we believe that phenolic profiles will result to be a great source of information for sample authentication to detect adulterations and labeling frauds.


