A Comparison of Laboratory Analysis Methods for Total Phenolic Content of Cider
by
 , ,
, ,
Madeleine L. Way
1,* ,
,
Joanna E. Jones
1,
David S. Nichols
2,
Robert G. Dambergs
1,3 and
Nigel D. Swarts
1 1
Tasmanian Institute of Agriculture, University of Tasmania, Private Bag 98 Sandy Bay, Tasmania 7001, Australia
2
Central Science Laboratory, University of Tasmania, Private Bag 74 Sandy Bay, Tasmania 7001, Australia
3
National Wine and Grape Industry Centre, Charles Sturt University, Mambarra Drive, Wagga Wagga NSW 2650, Australia
*
Author to whom correspondence should be addressed.
Beverages 2020, 6(3), 55; https://0-doi-org.brum.beds.ac.uk/10.3390/beverages6030055
Submission received: 29 June 2020
/
Revised: 27 July 2020
/
Accepted: 1 September 2020
/
Published: 7 September 2020
(This article belongs to the Special Issue Analysis Technologies for Beverages Quality and Control)
Abstract
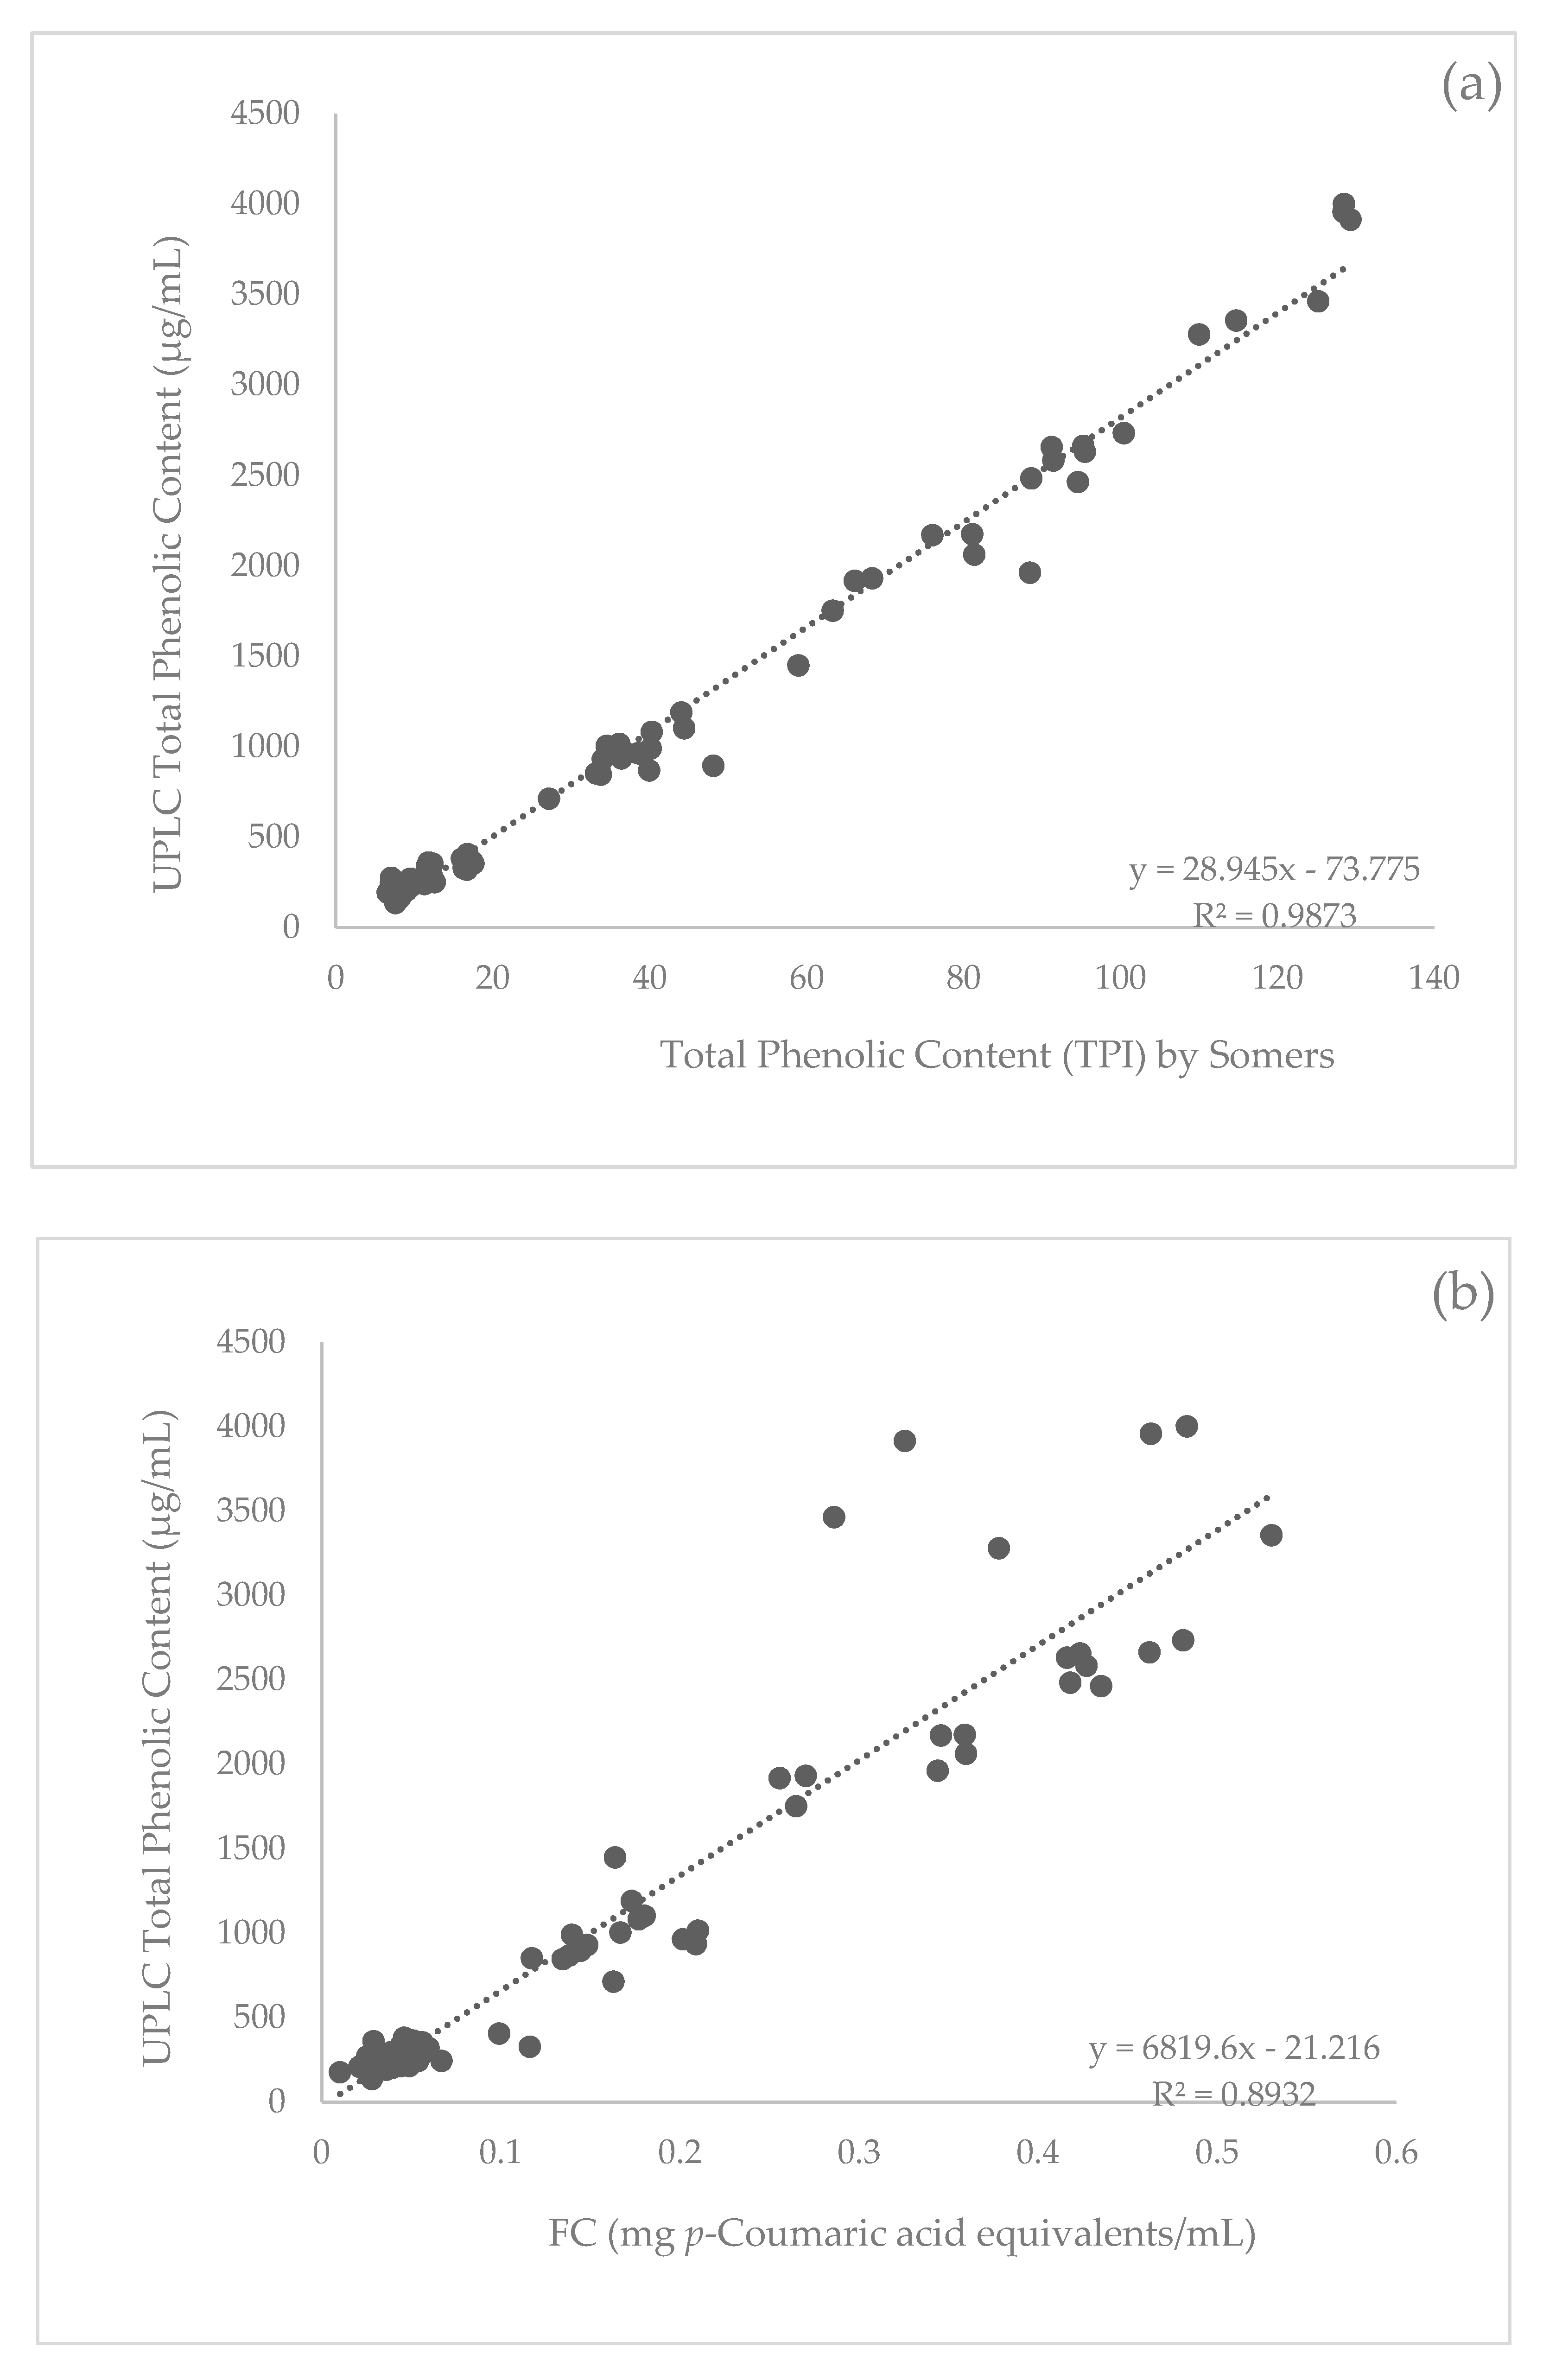
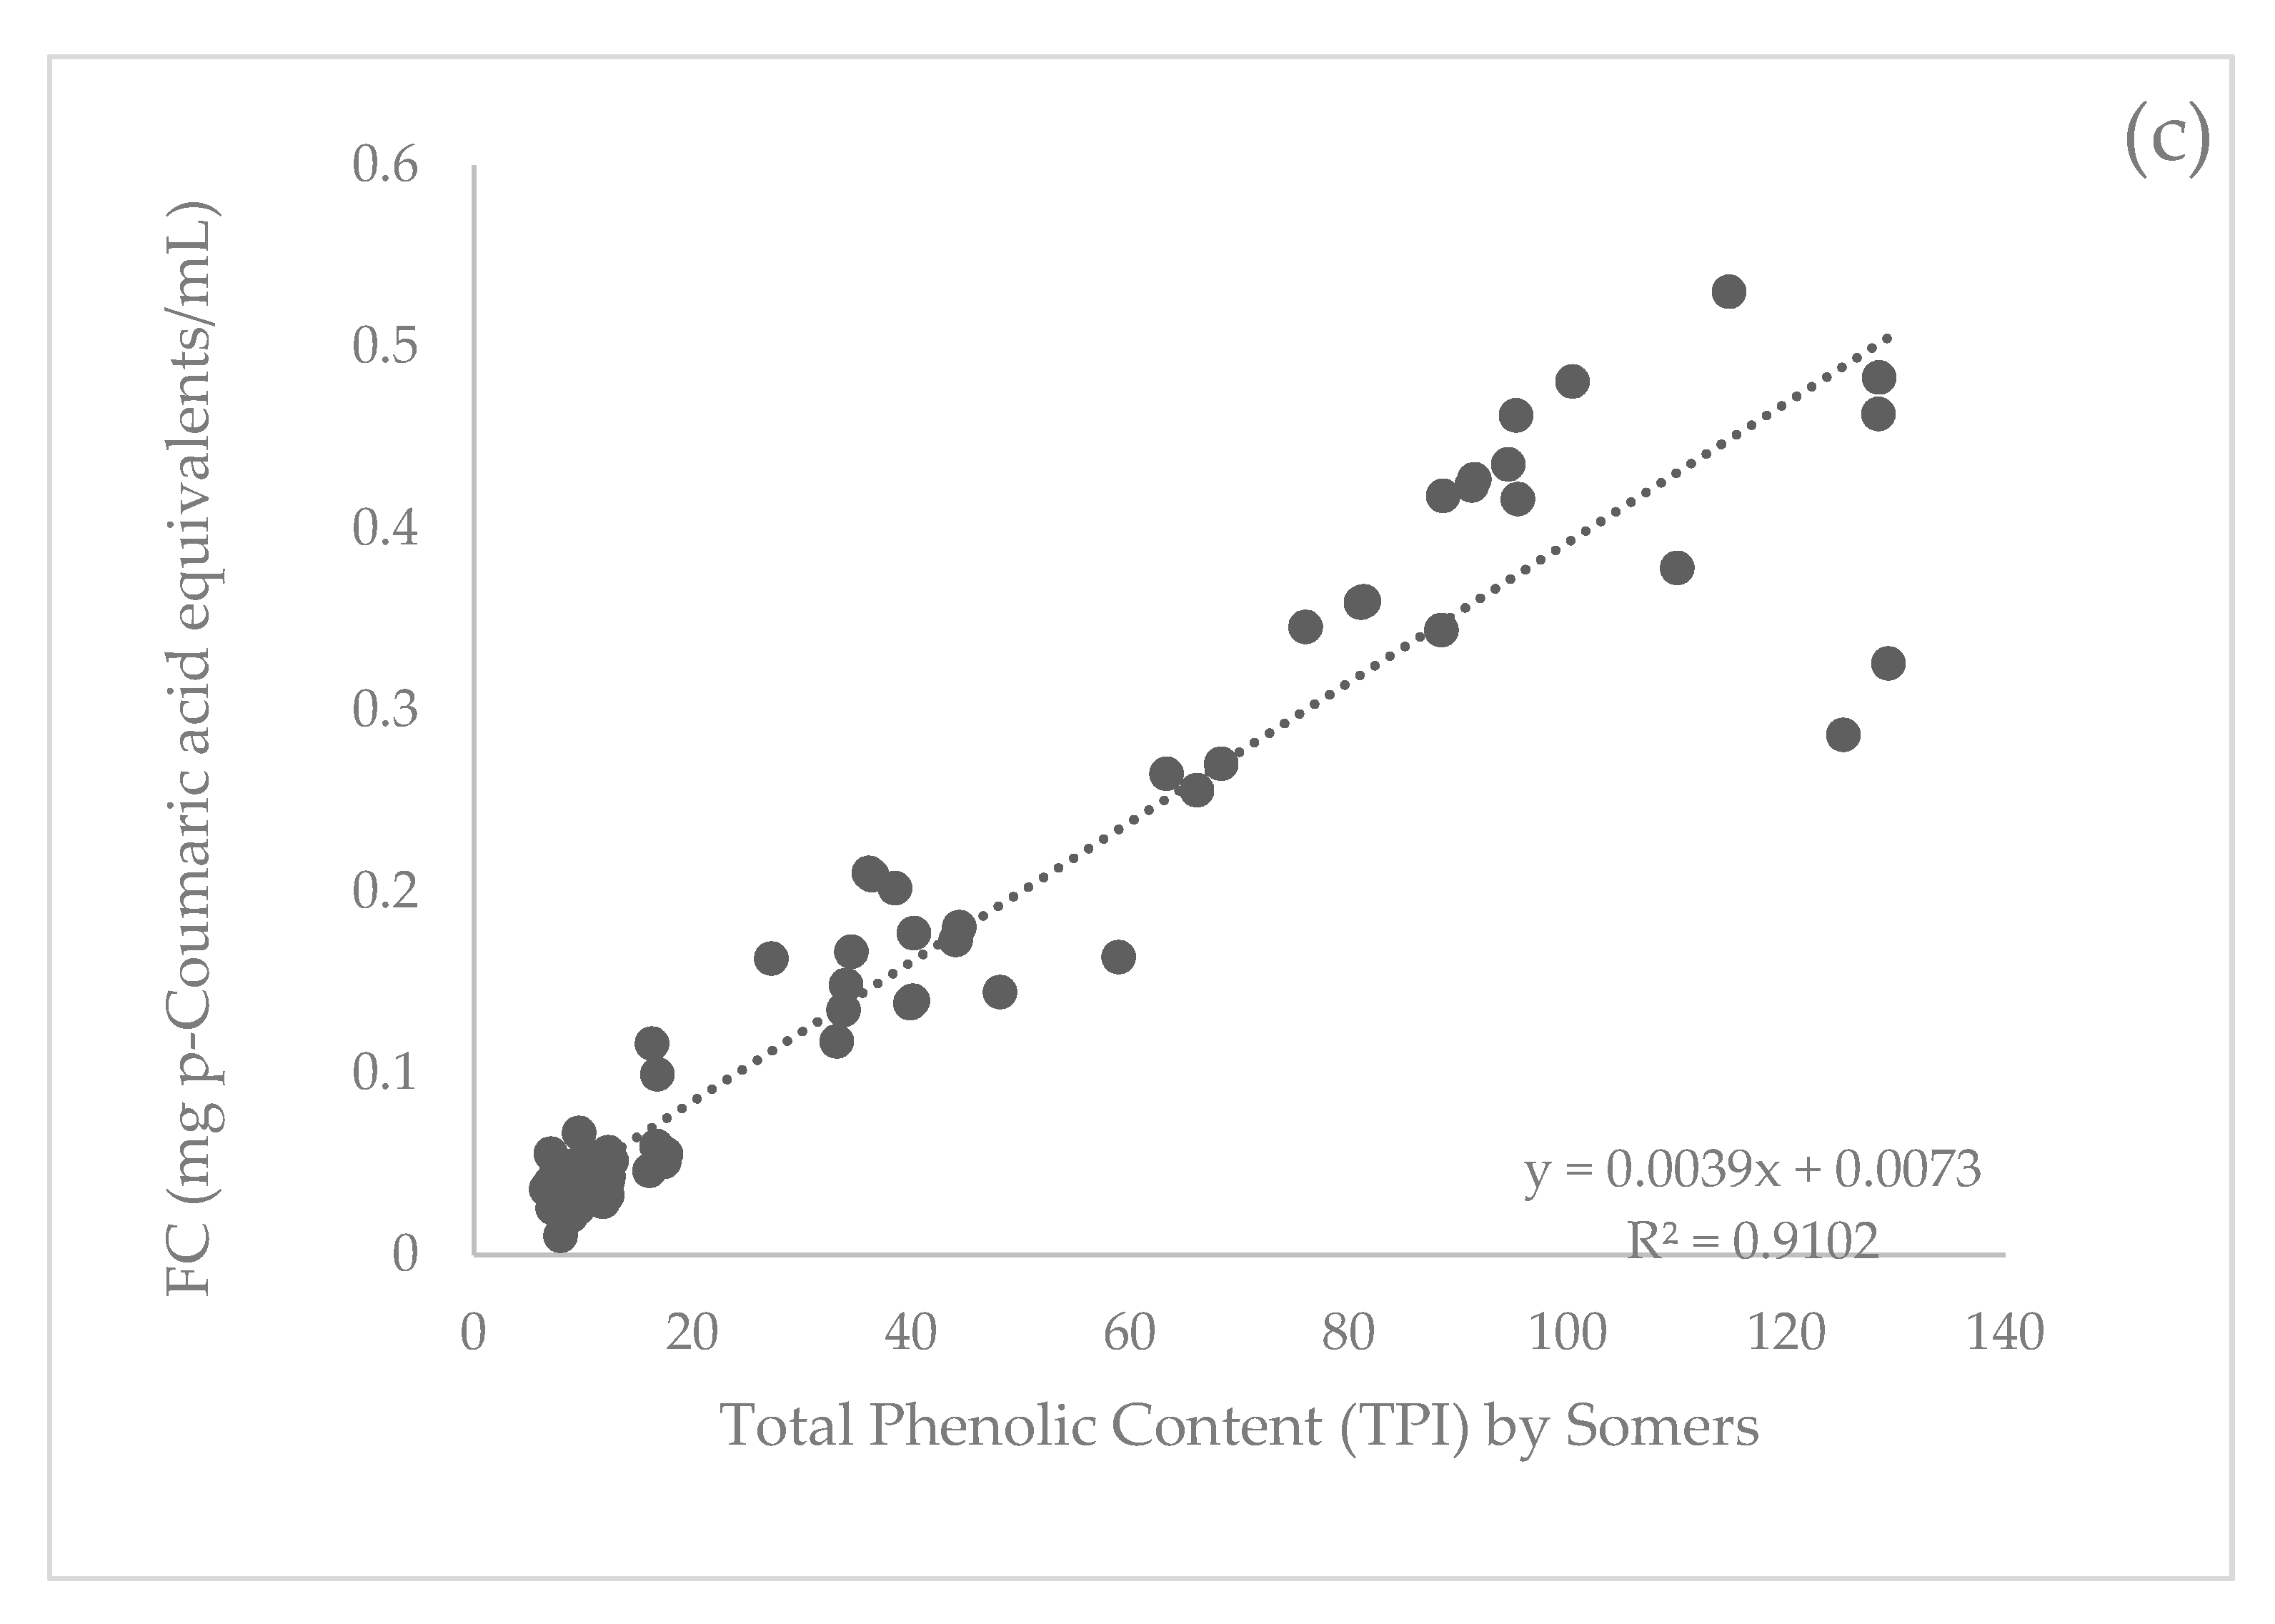
:Total phenolic content is widely accepted as a key measure of quality for cider. Apple juice and cider, made from six apple varieties including dessert and cider apples, were analysed for total phenolics using three different methods: (a) the Folin-Ciocalteu method, (b) the Somers method (a spectrophotometric method developed specifically for wine), and (c) ultra-performance liquid chromatography (UPLC) as a benchmark test. Of these approaches, the Somers method had the strongest correlation with UPLC with an R2 value of 0.99, whilst the Folin-Ciocalteu correlated with UPLC with an R2 value of 0.89. The Folin-Ciocalteu method also had a strong positive correlation with the Somers approach with an R2 value of 0.91. Correlations between methods were strongest for apple varieties that were naturally high in phenolic content. These results highlight the potential of the Somers method to rapidly, inexpensively, and accurately report the total phenolic content of apple juice and ciders made from dessert and cider apple varieties.
1. Introduction
Cider consumption continues to grow around the world. With a growth of 5.4% between 2014 and 2019 in Australia alone [1,2,3], improvements in cider quality and consistency are expected by the consumer. Research into cider production has shown that apple variety [4,5,6], yeast strain [7], fruit ripeness at harvest [8], pre-fermentation methods [9], and fermentation conditions, such as temperature [10], are all known to influence chemical composition and quality [11,12].
Two types of analyses are traditionally used either in combination or independently to measure aspects of cider quality. Sensory analysis using a panel of ‘consumers’ or trained judges, and laboratory-based analytical methods are the two forms of analysis. When analysed by a sensory panel, samples are judged on qualities, such as appearance, aroma, mouthfeel, and flavour [13,14,15]. While sensory analysis provides an indication of how the cider may be perceived by the consumer, it is exposed to individual subjectivity and preference. Sensory analysis is also time intensive, as it requires multiple training and tasting sessions, varies in methodology, and can be difficult to replicate with results being panel-dependent [16]. Differences in cider quality expectations also vary across the world, due to the preference for different styles, such as sweetness and carbonation [17,18]. For these reasons, sensory analysis will not be included in this study, as it focusses on comparing laboratory-based methods to analyse total phenolic content in apple cider.
Laboratory-based alternative methods have been developed to independently and objectively determine and compare the quality of beverages including cider. These methods typically test base cider measurements, such as titratable acidity (TA), total soluble solids (TSS), and pH as commonly used measures of beverage quality under a range of experimental treatments [8,9]. Analytical methods are also used to determine the phenolic composition and total phenolic content of ciders as an indicator of cider quality [4,19].
Phenolic compounds are responsible for organoleptic properties, such as flavour, colour, and mouthfeel in wine and cider [6,20,21,22]. Phenolic compounds are secondary plant metabolites found in most plants. Phenolic compounds contain one or several hydroxyl groups attached to at least one aromatic ring [22] and can be divided into two groups: flavonoids and non-flavonoids [22]. The structurally less complex non-flavonoids include phenolic acids, such as hydroxycinnamic and hydroxybenzoic acids, while flavonoids include anthocyanins and flavanols, such as tannins [22]. As phenolic compounds are responsible for the key contributors of quality in wine and cider, the management of phenolic content throughout the wine or cider making process has been a major research focus [22].
The Folin-Ciocalteu (FC) method has traditionally been used to measure total phenolic content in cider [6,23,24,25]. The FC method is a colorimetric method [21,26,27] that uses the reaction between hydroxyl groups with a phosphomolybdate reagent to estimate the content of total phenolics [21,28]. The reagents used in the FC method have been found to react with compounds other than phenols, such as sugars, proteins and sulphites [29], which can compromise the validity of the results. For this reason, it has been suggested the method should be used as an analysis of total antioxidant capacity rather than total phenolic content [29].
Aside from the FC method, other methods are used to measure the phenolic content in fresh fruit, vegetables, and wine, including UV-visible spectroscopy [22], liquid chromatography [30], and voltammetry assays [31]. UV-visible spectroscopy has been labelled as one of the most reliable and suitable methods to quantify phenolic compounds during winemaking [22]. This is because the molecular structure of phenolic compounds, with the phenolic ring, is able to absorb UV light, as well as some of the coloured compounds, such as anthocyanins, being detectable with visible light [22]. Absorbance at a wavelength of 280 nm using spectrophotometric analysis has been shown to indicate total phenolic content in base sparkling white wine [32]. Recently, the complete spectral fingerprint for phenolic content in wine including the total phenolic content at wavelength 280 nm was also validated [22,33] confirming the suitability of this method in wine. This method, widely known as Somers method, measures the absorbance reading using a spectrophotometer at 280 nm after the sample is diluted with HCl [34,35]. The Somers method is simple, rapid, and inexpensive as well as being unaffected by sulphites or oxidation. However, the Somers method for total phenolic content is yet to be validated for use with ciders.
Liquid chromatography methods are commonly used as a reference tool to validate analytical methods for measuring phenolic compounds for wine [32,35]. Ultra-performance liquid chromatography (UPLC) is a rapid separation method, which has been used to quantify, characterise, and analyse key compounds in wines and apple juice [36,37]. UPLC has a greater resolution, higher sensitivity, and shorter analysis times than high-performance liquid chromatography (HPLC) [37]. Unlike the spectrophotometer methods, UPLC accurately quantifies phenolic content, as it analyses individual compounds using standards, rather than estimating values based on reagent reactions. Although UPLC is the most accurate method, it is time consuming, expensive, and impractical for cider makers.
As FC is the commonly used method for measuring total phenolic content in cider by academic literature, FC was used to compare against the Somers method to validate its use in cider. UPLC was used as a benchmark measurement of total phenolics. This study aimed to validate the use of the Somers method developed for wine, in measuring total phenolic content in apple juice and base apple cider.
2. Materials and Methods
2.1. Experimental Design
The trial used six apple varieties including three traditional cider varieties: ‘Yarlington Mill’, ‘Kingston Black’, and ‘Frequin Rouge’; three dessert varieties: ‘Pink Lady’, ‘Royal Gala’, and ‘Fuji’. Traditional cider and desert varieties were used to maximise the range in phenolic content for the comparison. These varieties were also selected for their popularity for cider production in industry. Apples were sourced from two main apple growing regions in Tasmania (Australia); the Huon Valley (43.3498° S, 146.4551° E) and Spreyton (41.2167° S, 146.3500° E), representing the South and North of Tasmania, respectively. Apple harvest timing coincided with commercial harvest and apples were brought to the University of Tasmania’s Horticulture Research Centre for processing. Apples were stored at 4 °C prior to milling.
A centrifugal mill (voran Maschinen GmbH RM 2,2, Pichl bei Wels, Austria) was used to crush the apples and the must was collected in a 20 L food grade bucket lined with a muslin bag. The bag was then removed from the bucket and transferred into a horizontal flat-bed water-bag press (custom built by Solutions in Stainless, Launceston, Australia) where the bag was knotted before the pressing commenced. Juice was collected from the press in another 20 L bucket under pressure to a maximum of 200 kpa. Three 50 mL samples were taken and frozen for juice analysis before the remaining juice was divided into six 500 mL schott bottles fitted with airlocks for fermentation. Extracted juice pH was measured and adjusted with diluted (400 g/L) malic acid (Sigma-Aldrich, St. Louis, MO, USA) to pH 3.8. 0.01 mL Vinoclear (Winequip, Melbourne, VIC, Australia), and 31 g potassium metabisulphite (Chem-Supply, Gillman, SA, Australia) was added to each bottle to settle solids and prevent spoilage, respectively. The following day, EC1118 yeast (Lallemand, Edwardstown, SA, Australia) was rehydrated and added at 0.3 g/L as well as Fermaid (Lallemand, Edwardstown, SA, Australia) at 0.4 g/L before each vessel was weighed and stored at 14 °C. Each vessel was weighed daily to monitor fermentation. When weight loss ceased, sub-samples were taken from each of the three bottles for analysis, and the remaining cider was racked into 500 mL swing top amber bottles.
2.2. Juice and Base Cider Quality Analysis
Juice and base cider samples were tested for titratable acidity (TA), total soluble solids (TSS), pH, and total phenolics.
2.2.1. TA, TSS and pH
Both cider and juice were analysed for TA, TSS, and pH. Before analysis, samples were centrifuged at 4000 rpm for 10 min and brought to room temperature. TA was measured using an automatic titrator (Mettler Toledo g20 Compact Titrator, Greifensee, Switzerland) where results were measured in g/L of malic acid. TSS was measured using a hand-held digital refractometer (A. Kruss Optronic, Hamburg, Germany) with results measured in °Brix. pH was measured using a Handheld WP-81 pH-Cond-Salinity Meter (TPS, Brisbane, Australia). A total of 77 samples (n = 77, replicates = 4, varieties = 6) were prepared for analysis using FC, UPLC, and Somers.
2.2.2. Phenolic Content Analysis
UPLC
Each sample was filtered using a 0.45 μm syringe filter into a small glass vial. Total phenolic analysis was undertaken using a method, as described in Mumtaz et al. [38]. The technique of using two LC columns in series is referred to as “Dual-column LC” [39]. The use of two columns of different phase types in series is specifically referred to as “mixed-mode dual-column LC” [40]. The use of C18 and PFP column types in this case is to allow the efficient chromatography and resolution of mixed polarity analytes, such as free phenolic and carboxylic acids, within an appropriate analysis time.
The UPLC was coupled to a Waters Photodiode Array detector (Waters Corporation, Milford, MA, USA). Analyses were undertaken monitoring the wavelength range 210 to 500 nm at a resolution of 1.2 nm and specifically at 280 nm, also at a resolution of 1.2 nm. Quantitation was undertaken by five-point external calibration using a standard solution of 1:1 (w/w) caffeic acid: chlorogenic acid over a concentration range of 20–200 μg/mL. Semi-quantitation of total phenolic acids was undertaken as caffeic acid + chlorogenic acid equivalents (μg/mL). This was achieved by producing a stock standard containing both 1000 μg/mL caffeic acid (Sigma-Aldrich, St. Louis, MO, USA, 60018, >99%) and 1000 μg/mL chlorogenic acid (Sigma-Aldrich, St. Louis, MO, USA, 00500590, >99%) (i.e., caffeic acid + chlorogenic acid combined concentration of 2000 μg/mL). Subsequent dilutions were made to yield five external calibration standards with the following combined concentrations of caffeic acid + chlorogenic acid: 20, 50, 75, 100, and 200 μg/mL total. A mixture of caffeic and chlorogenic acids were employed as these are the common and major phenolic acid components of cider [41] and will therefore yield a more representative equivalent concentration than either compound alone. Sample concentrations were determined by total peak area at 280 nm within the retention time window of 5–8 min (Supplementary Figure S1).
FC
Through electron transfer, the Folin-Ciocalteu method uses reducing capacity, which is expressed as phenolic content [42]. The FC method [43] used 2 reagents: Reagent A was prepared by combining 75 mL of 2 M Folin-Ciocalteu reagent (Sigma-Aldrich, St. Louis, MO, USA) to 750 mL of distilled water. For reagent B, 57.5 g of 99.5% sodium carbonate (Sigma-Aldrich, St. Louis, MO, USA) was dissolved in distilled water in a 500 mL volumetric flask. For each sample, 0.1 mL of juice was added to 5 mL of reagent A in a test tube, mixed, and left for 5 min before adding 3.5 mL of reagent B and mixing. Then, the test tubes were incubated in a water bath for 1 hour at 40 °C. The content of the test tubes was transferred to quartz cuvettes (J-075-8 Brand-GMHB, Wetheim, Germany), and measured using a spectrophotometer (SPECTROstar Nano, BMG LABTECH, Windsor, NSW, Australia) at 765 nm. Using a standard calibration curve diluted at 0; 0.1; 0.2; 0.4; 0.6; 0.8, and 1.0 mg/mL with p-coumaric acid as the standard, the total phenolic content was calculated and expressed in mg/mL of p-coumaric acid equivalents [40].
Somers Method
Based on the Somers method originally developed for wine [34,35] samples were diluted 1:50 in 1M HCl with 9.8 mL 1 M HCl to 0.2 mL of sample in a 10 mL centrifuge tube. Samples were mixed well every 20 min over an hour while being stored in the dark at room temperature. After being transferred to 10 mm pathlength UV-grade disposable cuvettes each sample was scanned using wavelengths between 200 to 600 nm with a spectrophotometer (SPECTROstar Nano, BMG LABTECH, Windsor, NSW, Australia). The total phenolic content of each sample was represented by the absorbance, measured in absorbance units (AU), at 280 nm [32]. As the samples were diluted, the results of each sample in AU were then multiplied by the dilution factor, in this case 50, to create a Total Phenolic Index (TPI) [22]. This step allows phenolic content measured by A280 to be easily compared, especially when samples may differ and require a range of dilutions.
2.3. Statistical Analysis
Pearson’s correlations were completed between the spectrophotometric phenolic datasets obtained by the UPLC, FC, and the Somers methods. The significance of the relationship between each of the variables was determined in SPSS software (IBM SPSS Statistics Version 24, Armonk, NY, USA).
3. Results
When comparing all three methods to measure total phenolics, the Somers (A280) method had the strongest correlation with UPLC. The Pearson correlation indicated there was a significant (p < 0.001) positive association between total phenolics by A280 and UPLC data with an R2 value of 0.99 (Figure 1a). The FC method was also strongly correlated with UPLC data, which had a significant (p < 0.001) positive association with an R2 value of 0.89 (Figure 1b). The FC method had a significant (p < 0.001) positive correlation with the Somers method with an R2 value of 0.91 (Figure 1c).
For each of the three methods used, the total phenolics range followed the same trend for each apple variety type as seen in Table 1. Dessert varieties had the lowest total phenolic values for each method with the smallest range compared to the cider varieties, which had a greater range and much higher values. Table 1 also shows the variation between variety type and the correlation between methods. Cider apple varieties showed a stronger correlation across all method combinations compared to dessert varieties. The greater range of values and the higher sample number of the cider varieties contributed to the improved overall correlation.
For each variety, the mean total phenolic content is displayed for each method in Table 2. Table 2 illustrates the difference for each variety in phenolic content, the strong difference between cider and dessert varieties as well as how the different methods determine the same trends between each variety. For example, for dessert varieties, regardless of method, ‘Fuji’ provides the highest results compared to ‘Pink Lady’ and ‘Royal Gala’. A one-way Analysis of Variance in SPSS was used to determine significant differences between varieties for each of the analytical methods at p ≤ 0.05. A Tukey’s-B post hoc test was used to determine differences between groups of samples. Strong separation occurred between the phenolic properties of dessert and cider varieties, where in most cases the results magnify 10-fold when comparing variety classes. For ‘Royal Gala’, Somers results were an average of 9.01 TPI compared to ‘Frequin Rouge’ with an average of 91.58 TPI (Table 2).
Sugar content of the juice ranged from 9.2 °Brix for ‘Pink Lady’ to 17.7 °Brix for ‘Kingston Black’ (Supplementary Table S1). On average, sugar content was generally lower for the dessert varieties compared to the cider varieties. For juice, pH ranged from as low as 3.41 for a ‘Pink Lady’ sample to 4.25 for a ‘Yarlington Mill’ sample, similarly for sugar content, dessert varieties generally had a lower pH than cider varieties (Supplementary Table S1). Titratable acidity followed the opposite trend with a ‘Yarlington Mill’ sample at 1.76 g/L ranging to a ‘Pink Lady’ sample with 8.03 g/L (Supplementary Table S1).
4. Discussion
The results demonstrate a very strong positive correlation between total phenolics measured by the Somers and UPLC methods (Figure 1a). In comparison, the correlation between the FC method and UPLC was weaker yet still exhibited a strong positive correlation (Figure 1b). These results indicate the Somers method is a valid and preferred method to measure total phenolic content of apple cider. The Somers method only uses a simple dilution and equipment in comparison to UPLC. Therefore, this strong correlation between the two methods was not expected. With the expectation that the UPLC results would detect more and higher concentrations of compounds, it was not predicted that the Somers method would have a stronger correlation with UPLC than FC.
FC results are known to be influenced by non-phenolic compounds found in apple juice and cider such as sugars, aromatic amines, sulphur dioxide, ascorbic acid, and other organic acids [44]. These non-phenolic compounds, as well as a range of other organic and inorganic substances, react with the FC reagents and are detected by the spectrophotometer and, therefore, can inflate the reported phenolic concentration [41].
This over-prediction of phenolics is most likely the cause of increased variance in the correlation between UPLC and FC compared to UPLC and Somers results. Evidence of this same effect is unable to be found in the literature for UPLC or Somers methods. The FC method relies on electron transfer where a mixture of two acids, phosphotungstic acid and phosphomolybdic acid, reduces phenols and creates a colour change measured at 765 nm [22,44]. As antioxidants are the most abundant phenolic compound in most plants, it has been suggested that, while the FC method gives a good approximate estimation of the total phenolic content, it is better described as a measure of total antioxidant capacity [29,44].
Similar to the FC method, the Somers approach is also a spectrophotometric based method and results can simply be expressed as A280 (Absorbance Units) or converted to gallic acid equivalents (TPI) [22,34]. As all three methods were measuring total phenolic content in different units, correlations were used for comparison. The Somers method offers a more rapid and inexpensive way to measure total phenolic content and, thus, compare results between apple varieties and treatments. The Somers method requires only one reagent, hydrochloric acid, a readily available and considerably more affordable reagent then those used in the FC method. In addition, incubation times for the HCl and sample are one hour at room temperature, which is considerably quicker than the long incubation required for the reagents used in the FC method. In contrast, UPLC requires significantly more expensive equipment and takes more time than both spectrophotometer methods combined.
Whilst the Somers method is not new, this is the first time it has been compared and validated as a reliable method for total phenolic content estimation in cider. The ability to measure phenolics with a spectrophotometer is due to the compounds containing the phenolic ring in both wines and cider, which are able to absorb UV light [22]. UV absorbance can be represented as a spectrum with peaks and troughs [9]. The 280 nm peak dominates this absorbance spectrum and numerous phenolic compounds are detected, including proanthocyanidins, anthocyanins, hydroxycinnamic, and hydroxybenzoic acids [22]. These compounds are detected as they contain phenolic rings [22].
Given the simplicity of this method, its application could assist cider researchers to determine differences between treatments and cider makers in making choices around varietal blending. A 280 nm absorbance reading provides a value to compare total phenolic content and, therefore, a prediction of cider quality.
For each comparison of phenolic methods, when results were split into categories for dessert and cider varieties, there was always a stronger correlation for the three cider varieties (Table 1). The low phenolic content present in dessert varieties, resulting in a much lower absorbance reading across all three methods [9] is responsible for driving the weaker correlation. The cider varieties also have a far greater range between all three cider varieties, while the dessert varieties have very similar values, limiting the range of the data, which may affect the correlations (Table 1 and Table 2). In most cases, the cider variety had 10 times the phenolic content compared to a dessert variety (Table 2). The variation in range between cider varieties has previously been displayed using principle component analysis [9]. Despite the correlation between methods not being as strong for dessert varieties as they were for the cider varieties, the value of the Somers method to cider makers should not be underestimated. Cider makers expect dessert varieties to be lacking a phenolic “punch”, relying on dessert varieties instead for other attributes, such as “sweetness” or “acidity” to balance key cider varieties that may deliver the desired “bitterness” and “astringency”, which may make up a large proportion of the total phenolic value.
5. Conclusions
While the Somers method does not reveal concentrations of individual phenolic compounds in the sample as is possible with UPLC, it is a rapid and accurate comparative analytical method to quantify total phenolics. The Somers method offers the same principal results as the FC method, in an inexpensive, faster, more reliable way, which can lead to results that can be compared across samples, seasons, and treatments. Ultimately, it can be a valuable tool for both researchers and cider makers for decision making in the orchard or cidery. The total phenolic content represents a cider quality parameter known to influence other cider attributes, such as colour, aroma, flavour, and mouthfeel, despite not being used as an indicator of consumer preference independently. This research validates the use of the Somers method in measuring total phenolic content in apple juice and base apple cider.
Supplementary Materials
The following are available online at https://0-www-mdpi-com.brum.beds.ac.uk/2306-5710/6/3/55/s1, Figure S1: Chromatogram of one of the cider samples of “Yarlington Mill”. This figure represents a chromatogram of total phenolics, as determined at 280 nm, within the retention time window of 5–8 min; Table S1: Juice and base cider characteristics, Total Soluble Solids (TSS) (°Brix), pH and Titratable Acidity (TA) (g/L malic acid) for each variety. Results are displayed as the mean ± standard error of the mean (juice n = 2 for all varieties excluding Kingston black where n = 3, base cider n = 12 for all dessert varieties, n = 18, 11, 12 for cider varieties respectively). Different letters denote significant differences between means at p ≤ 0.05.
Author Contributions
Conceptualization and methodology of this research was done by M.L.W., J.E.J., N.D.S., and R.G.D.; formal analysis, investigation, and data curations by M.L.W and D.S.N. Writing—original draft preparation was completed by M.L.W.; writing—review and editing was a joint effort between M.L.W., J.E.J., N.D.S., and R.G.D. The research was supervised J.E.J., N.D.S., and R.G.D. All authors have read and agreed to the published version of the manuscript.
Funding
This research was funded by a Westpac Future Leaders Scholarship and the Tasmanian Institute of Agriculture at the University of Tasmania with in-kind support from Brady’s Lookout, Spreyton Cider, Willie Smith Cider, Hansen Orchards, and Lucaston Park Orchards.
Acknowledgments
The authors wish to acknowledge TIA’s Justin Direen, Caroline Claye and Phil Andrews for their technical support. The authors also wish to acknowledge Tim Jones from Willie Smith, Damien Viney from Spreyton Fresh, and Caroline Brown from Brady’s Lookout, whose input and support was greatly appreciated. The authors wish to acknowledge internal review by Rocco Longo.
Conflicts of Interest
The authors declare no conflict of interest. The funders had no role in the design of the study; in the collection, analyses, or interpretation of data; in the writing of the manuscript, or in the decision to publish the results.
References
- Becot, F.A.; Bradshaw, T.L.; Conner, D.S. Apple market expansion through value-added hard cider production: Current production and prospects in vermont. HortTechnology 2016, 26, 220–229. [Google Scholar] [CrossRef] [Green Version]
- Lobo, A.P.; Antón-Díaz, M.J.; Alonso, J.J.M.; Valles, B.S. Characterization of Spanish ciders by means of chemical and olfactometric profiles and chemometrics. Food Chem. 2016, 213, 505–513. [Google Scholar] [CrossRef] [PubMed]
- Omstedt, S. IBISWorld Industry Report C1214 Wine Production in Australia; IBIS World: Los Angeles, CA, USA, 2018. [Google Scholar]
- Thompson-Witrick, K.A.; Goodrich, K.M.; Neilson, A.P.; Hurley, E.K.; Peck, G.M.; Stewart, A.C. Characterization of the polyphenol composition of 20 cultivars of cider, processing, and dessert apples (Malus domestica Borkh.) grown in Virginia. J. Agric. Food Chem. 2014, 62, 10181–10191. [Google Scholar] [CrossRef] [PubMed]
- Valois, S.; Merwin, I.A.; Padilla-Zakour, O.I. Characterization of fermented cider apple varieties grown in upstate New York. J. Am. Pomol. Soc. 2006, 60, 113–128. [Google Scholar]
- Sanoner, P.; Guyot, S.; Marnet, N.; Molle, D.; Drilleau, J.-F. Polyphenol profiles of French cider apple varieties (Malus domestica sp.). J. Agric. Food Chem. 1999, 47, 4847–4853. [Google Scholar] [CrossRef] [PubMed]
- Dos Santos, E.; Mongruel, C.; Pietrowski, G.D.A.M.; Braga, C.M.; Rossi, M.J.; Ninow, J.; dos Santos, M.; Pires, T.; Wosiacki, G.; Jorge, R.M.M. Apple Aminoacid Profile and Yeast Strains in the Formation of Fusel Alcohols and Esters in Cider Production. J. Food Sci. 2015, 80, C1170–C1177. [Google Scholar] [CrossRef]
- Girschik, L.; Jones, J.E.; Kerslake, F.L.; Robertson, M.; Dambergs, R.G.; Swarts, N.D. Apple variety and maturity profiling of base ciders using UV spectroscopy. Food Chem. 2017, 228, 323–329. [Google Scholar] [CrossRef]
- Way, M.L.; Jones, J.E.; Swarts, N.D.; Dambergs, R.G. Phenolic content of apple juice for cider making as influenced by common pre-fermentation processes using two analytical methods. Beverages 2019, 5, 53. [Google Scholar] [CrossRef] [Green Version]
- Torija, M.J.; Rozes, N.; Poblet, M.; Guillamón, J.M.; Mas, A. Effects of fermentation temperature on the strain population of Saccharomyces cerevisiae. Int. J. Food Microbiol. 2003, 80, 47–53. [Google Scholar] [CrossRef]
- Laaksonen, O.; Kuldjärv, R.; Paalme, T.; Virkki, M.; Yang, B. Impact of apple cultivar, ripening stage, fermentation type and yeast strain on phenolic composition of apple ciders. Food Chem. 2017, 233, 29–37. [Google Scholar] [CrossRef]
- Riekstina-Dolge, R.; Kruma, Z.; Karklina, D.; Seglina, D. Composition of aroma compounds in fermented apple juice: Effect of apple variety, fermentation temperature and inoculated yeast concentration. Procedia Food Sci. 2011, 1, 1709–1716. [Google Scholar]
- Antón, M.J.; Suárez Valles, B.; García Hevia, A.; Picinelli Lobo, A. Aromatic Profile of Ciders by Chemical Quantitative, Gas Chromatography-Olfactometry, and Sensory Analysis. J. Food Sci. 2014, 79, S92–S99. [Google Scholar] [CrossRef] [PubMed]
- Symoneaux, R.; Guichard, H.; Le Quéré, J.-M.; Baron, A.; Chollet, S. Could cider aroma modify cider mouthfeel properties? Food Qual. Prefer. 2015, 45, 11–17. [Google Scholar] [CrossRef]
- Lachowicz, S.; Oszmiański, J.; Uździcka, M.; Chmielewska, J. The Influence of Yeast Strain, β-Cyclodextrin, and Storage Time on Concentrations of Phytochemical Components, Sensory Attributes, and Antioxidative Activity of Novel Red Apple Ciders. Molecules 2019, 24, 2477. [Google Scholar] [CrossRef] [Green Version]
- Symoneaux, R.; Chollet, S.; Patron, C.; Bauduin, R.; Le Quéré, J.-M.; Baron, A. Prediction of sensory characteristics of cider according to their biochemical composition: Use of a central composite design and external validation by cider professionals. LWT-Food Sci. Technol. 2015, 61, 63–69. [Google Scholar] [CrossRef]
- Mangas, J.J.; Rodríguez, R.; Suárez, B.; Picinelli, A.; Dapena, E. Study of the phenolic profile of cider apple cultivars at maturity by multivariate techniques. J. Agric. Food Chem. 1999, 47, 4046–4052. [Google Scholar] [CrossRef] [Green Version]
- Picinelli Lobo, A.; Fernández Tascón, N.; Rodríguez Madrera, R.; Suárez Valles, B. Sensory and foaming properties of sparkling cider. J. Agric. Food Chem. 2005, 53, 10051–10056. [Google Scholar] [CrossRef]
- Alberti, A.; dos Santos, T.P.M.; Zielinski, A.A.F.; dos Santos, C.M.E.; Braga, C.M.; Demiate, I.M.; Nogueira, A. Impact on chemical profile in apple juice and cider made from unripe, ripe and senescent dessert varieties. LWT-Food Sci. Technol. 2016, 65, 436–443. [Google Scholar] [CrossRef]
- Mercurio, M.D.; Dambergs, R.G.; Cozzolino, D.; Herderich, M.J.; Smith, P.A. Relationship between red wine grades and phenolics. 1. Tannin and total phenolics concentrations. J. Agric. Food Chem. 2010, 58, 12313–12319. [Google Scholar] [CrossRef]
- De Beer, D.; Harbertson, J.F.; Kilmartin, P.A.; Roginsky, V.; Barsukova, T.; Adams, D.O.; Waterhouse, A.L. Phenolics: A comparison of diverse analytical methods. Am. J. Enol. Viticult. 2004, 55, 389–400. [Google Scholar]
- Aleixandre-Tudo, J.L.; Du Toit, W. The Role of UV-Visible Spectroscopy for Phenolic Compounds Quantification in Winemaking. In Frontiers and New Trends in the Science of Fermented Food and Beverages; IntechOpen: Lodon, UK, 2018. [Google Scholar]
- Alberti, A.; Zielinski, A.A.F.; Zardo, D.M.; Demiate, I.M.; Nogueira, A.; Mafra, L.I. Optimisation of the extraction of phenolic compounds from apples using response surface methodology. Food Chem. 2014, 149, 151–158. [Google Scholar] [CrossRef] [Green Version]
- Alonso-Salces, R.M.; Barranco, A.; Abad, B.; Berrueta, L.A.; Gallo, B.; Vicente, F. Polyphenolic profiles of Basque cider apple cultivars and their technological properties. J. Agric. Food Chem. 2004, 52, 2938–2952. [Google Scholar] [CrossRef]
- Cliff, M.; Dever, M. Characterization of varietal apple juices. Can. Inst. Food Sci. Technol. J. 1990, 23, 217–222. [Google Scholar] [CrossRef]
- Waterhouse, A.L. Determination of total phenolics. Curr. Protoc. Food Anal. Chem. 2002, 6, I1.1.1–I1.1.8. [Google Scholar]
- Guyot, S.; Marnet, N.; Drilleau, J.-F. Thiolysis− HPLC characterization of apple procyanidins covering a large range of polymerization states. J. Agric. Food Chem. 2001, 49, 14–20. [Google Scholar] [CrossRef] [PubMed]
- Singleton, V.L.; Orthofer, R.; Lamuela-Raventós, R.M. Analysis of total phenols and other oxidation substrates and antioxidants by means of folin-ciocalteu reagent. In Methods in Enzymology; Elsevier: Amsterdam, The Netherlands, 1999; Volume 299, pp. 152–178. [Google Scholar]
- Everette, J.D.; Bryant, Q.M.; Green, A.M.; Abbey, Y.A.; Wangila, G.W.; Walker, R.B. Thorough study of reactivity of various compound classes toward the Folin−Ciocalteu reagent. J. Agric. Food Chem. 2010, 58, 8139–8144. [Google Scholar] [CrossRef] [Green Version]
- Tomás-Barberán, F.A.; Gil, M.I.; Cremin, P.; Waterhouse, A.L.; Hess-Pierce, B.; Kader, A.A. HPLC− DAD− ESIMS analysis of phenolic compounds in nectarines, peaches, and plums. J. Agric. Food Chem. 2001, 49, 4748–4760. [Google Scholar] [CrossRef]
- Rodríguez-Méndez, M.; Apetrei, C.; De Saja, J. Evaluation of the polyphenolic content of extra virgin olive oils using an array of voltammetric sensors. Electrochim. Acta 2008, 53, 5867–5872. [Google Scholar] [CrossRef]
- Kerslake, F.; Jones, J.E.; Close, D.C.; Dambergs, R. Bunch exposure effects on the quality of pinot noir and chardonnay fruit and base wines for cool climate sparkiling wine production. In Proceedings of the 18th Symposium of the Group of International Experts of Vitivinicultural Systems for Cooperation (GiESCO 2013), Porto, Portugal, 7–11 July 2013; pp. 471–477. [Google Scholar]
- Kerslake, F.; Longo, R.; Dambergs, R. Discrimination of juice press fractions for sparkling base wines by a UV-Vis spectral phenolic fingerprint and chemometrics. Beverages 2018, 4, 45. [Google Scholar] [CrossRef] [Green Version]
- Somers, C.T.; Evans, M.E. Spectral evaluation of young red wines: Anthocyanin equilibria, total phenolics, free and molecular SO2, “chemical age”. J. Sci. Food Agric. 1977, 28, 279–287. [Google Scholar] [CrossRef]
- Mercurio, M.D.; Dambergs, R.G.; Herderich, M.J.; Smith, P.A. High throughput analysis of red wine and grape phenolics adaptation and validation of methyl cellulose precipitable tannin assay and modified somers color assay to a rapid 96 well plate format. J. Agric. Food Chem. 2007, 55, 4651–4657. [Google Scholar] [CrossRef] [PubMed]
- Gruz, J.; Novák, O.; Strnad, M. Rapid analysis of phenolic acids in beverages by UPLC–MS/MS. Food Chem. 2008, 111, 789–794. [Google Scholar] [CrossRef]
- Raczkowska, J.; Mielcarz, G.; Howard, A.; Raczkowski, M. UPLC and spectrophotometric analysis of polyphenols in wines available in the Polish market. Int. J. Food Prop. 2011, 14, 514–522. [Google Scholar] [CrossRef]
- Mumtaz, M.Z.; Barry, K.M.; Baker, A.L.; Nichols, D.S.; Ahmad, M.; Zahir, Z.A.; Britz, M.L. Production of lactic and acetic acids by Bacillus sp. ZM20 and Bacillus cereus following exposure to zinc oxide: A possible mechanism for Zn solubilization. Rhizosphere 2019, 12, 100170. [Google Scholar] [CrossRef]
- Benjamin, E.; Firestone, B.; Schneider, J. A dual-column HPLC method for the simultaneous determination of dhpg (9-[(1, 3-dihydroxy-2-propoxy) methyl] guanine) and its mono and diesters in biological samples. J. Chromatogr. Sci. 1985, 23, 168–170. [Google Scholar] [CrossRef]
- Gao, Y.; Chen, Y.; Yue, X.; He, J.; Zhang, R.; Xu, J.; Zhou, Z.; Wang, Z.; Zhang, R.; Abliz, Z. Development of simultaneous targeted metabolite quantification and untargeted metabolomics strategy using dual-column liquid chromatography coupled with tandem mass spectrometry. Anal. Chim. Acta 2018, 1037, 369–379. [Google Scholar] [CrossRef]
- Cilliers, J.; Singleton, V.; Lamuela-Raventos, R. Total polyphenols in apples and ciders; correlation with chlorogenic acid. J. Food Sci. 1990, 55, 1458–1459. [Google Scholar] [CrossRef]
- Noreen, H.; Semmar, N.; Farman, M.; McCullagh, J.S. Measurement of total phenolic content and antioxidant activity of aerial parts of medicinal plant Coronopus didymus. Asian Pac. J. Trop. Med. 2017, 10, 792–801. [Google Scholar] [CrossRef]
- Poorter, H.; de Jong-Van Berkel, Y. Chemical Determination of Phenolic Compounds. Available online: http://prometheuswiki.org/tiki-pagehistory.php?page=Chemical%20determination%20of%20phenolic%20compounds&preview=9 (accessed on 2 March 2017).
- Prior, R.L.; Wu, X.; Schaich, K. Standardized methods for the determination of antioxidant capacity and phenolics in foods and dietary supplements. J. Agric. Food Chem. 2005, 53, 4290–4302. [Google Scholar] [CrossRef]
Figure 1.
Correlation (Pearson’s) between total phenolic measurement methods (a) Somers and ultra-performance liquid chromatography (UPLC), (b) Folin-Ciocalteu (FC) and UPLC, and (c) Somers and FC for all samples (n = 154).
Figure 1.
Correlation (Pearson’s) between total phenolic measurement methods (a) Somers and ultra-performance liquid chromatography (UPLC), (b) Folin-Ciocalteu (FC) and UPLC, and (c) Somers and FC for all samples (n = 154).


Table 1.
The range in total phenolics values and the correlation (R2) between methods for all varieties and both variety types (n = 77 all, 36 dessert, 41 cider). FC results are expressed as mg p-Coumaric acid equivalents/mL.
Table 1.
The range in total phenolics values and the correlation (R2) between methods for all varieties and both variety types (n = 77 all, 36 dessert, 41 cider). FC results are expressed as mg p-Coumaric acid equivalents/mL.
| Range | Correlation R2 | |||||
|---|---|---|---|---|---|---|
| Somers (TPI) | UPLC (μg/mL) | FC (mg/mL) | Somers: FC | Somers: UPLC | FC: UPLC | |
| All | 6.63–129.32 | 136.23–4000.7 | 0.01–0.53 | 0.91 | 0.99 | 0.89 |
| Dessert | 6.63–12.61 | 136.23–360.14 | 0.01–0.07 | 0.09 | 0.52 | 0.18 |
| Cider | 16.08–129.32 | 319.95–4000.7 | 0.05–0.53 | 0.82 | 0.98 | 0.80 |
Table 2.
Mean TPI ± standard error of the mean measured using the three methods for cider samples for each individual variety, separated by variety type. (n = 12 for all dessert varieties, n = 18, 11, 12 for cider varieties, respectively). Different letters denote significant differences between means at p ≤ 0.05.
| Dessert Variety | Cider Variety | |||||
|---|---|---|---|---|---|---|
| Pink Lady | Fuji | Royal Gala | Kingston Black | Yarlington Mill | Frequin Rouge | |
| Somers (TPI) | 7.57 ± 0.37 a | 11.65 ± 0.78 a | 9.01 ± 0.31 a | 29.95 ± 4.81 b | 88.25 ± 21.46 c | 91.58 ± 5.84 c |
| FC (mg/mL) | 0.03 ± 0.01 a | 0.04 ± 0.01 a | 0.03 ± 0.01 a | 0.13 ± 0.03 b | 0.29 ± 0.07 c | 0.42 ± 0.03 d |
| UPLC(μg/mL) | 204.01 ± 22.15 a | 286.71 ± 25.96 a | 219.93 ± 16.12 a | 752.18 ± 143.21 a | 2514.57 ± 732.66 b | 2494.95 ± 217.52 b |
© 2020 by the authors. Licensee MDPI, Basel, Switzerland. This article is an open access article distributed under the terms and conditions of the Creative Commons Attribution (CC BY) license (http://creativecommons.org/licenses/by/4.0/).
Share and Cite
MDPI and ACS Style
Way, M.L.; Jones, J.E.; Nichols, D.S.; Dambergs, R.G.; Swarts, N.D. A Comparison of Laboratory Analysis Methods for Total Phenolic Content of Cider. Beverages 2020, 6, 55. https://0-doi-org.brum.beds.ac.uk/10.3390/beverages6030055
AMA Style
Way ML, Jones JE, Nichols DS, Dambergs RG, Swarts ND. A Comparison of Laboratory Analysis Methods for Total Phenolic Content of Cider. Beverages. 2020; 6(3):55. https://0-doi-org.brum.beds.ac.uk/10.3390/beverages6030055
Chicago/Turabian StyleWay, Madeleine L., Joanna E. Jones, David S. Nichols, Robert G. Dambergs, and Nigel D. Swarts. 2020. "A Comparison of Laboratory Analysis Methods for Total Phenolic Content of Cider" Beverages 6, no. 3: 55. https://0-doi-org.brum.beds.ac.uk/10.3390/beverages6030055
Note that from the first issue of 2016, this journal uses article numbers instead of page numbers. See further details here.