A Multi-Parameter, Predictive Model of Starch Hydrolysis in Barley Beer Mashes

1
Department of Chemical Engineering, University of California, Davis, CA 95616, USA
2
Department of Viticulture and Enology, University of California, Davis, CA 95616, USA
*
Author to whom correspondence should be addressed.
Beverages 2020, 6(4), 60; https://0-doi-org.brum.beds.ac.uk/10.3390/beverages6040060
Submission received: 22 May 2020
/
Revised: 29 September 2020
/
Accepted: 1 October 2020
/
Published: 13 October 2020
(This article belongs to the Special Issue Beer Quality and Flavour)
Abstract
:A key first step in the production of beer is the mashing process, which enables the solubilization and subsequent enzymatic conversion of starch to fermentable sugars. Mashing performance depends primarily on temperature, but also on a variety of other process parameters, including pH and mash thickness (known as the “liquor-to-grist” ratio). This process has been studied for well over 100 years, and yet essentially all predictive modeling efforts are alike in that only the impact of temperature is considered, while the impacts of all other process parameters are largely ignored. A set of statistical and mathematical methods collectively known as Response Surface Methodology (RSM) is commonly applied to develop predictive models of complex processes such as mashing, where performance depends on multiple parameters. For this study, RSM was used to design and test a set of experimental mash conditions to quantify the impact of four process parameters—temperature (isothermal), pH, aeration, and the liquor-to-grist ratio—on extract yield (total and fermentable) and extract composition in order to create a robust, yet simple, predictive model. In contrast to previous models of starch hydrolysis in a mash, a unique aspect of the model developed here was the quantification of significant parameter interaction effects, the most notable of which was the interaction between temperature and mash thickness (i.e., the liquor-to-grist ratio). This interaction had a sizeable impact on important mash performance metrics, such as the total extract yield and the fermentability of the resultant wort. The development of this model is of great future utility to brewery processing, as it permits the multi-parameter optimization of the mashing process.
1. Introduction
The first step in beer production is the mashing of cereal grains, predominantly barley, into a fermentable liquid. Barley mashing is a transformative process characterized by solubilization and enzymatic conversion of various components of the solid grist (grain solids) to produce the constituents of the fermentable liquid known as “wort” [1,2,3,4,5]. The transformed, now-soluble fraction of the grist is referred to as “extract” and contains an immense variety of chemical species. Especially critical to healthy beer fermentations are amino acids and short peptides—collectively referred to as “free amino nitrogen” (FAN) [1,3,4,5]. Other constituents include vitamins, minerals, proteins, and nucleic acids. The majority of the soluble extract, however, comes from starch, which is hydrolyzed into fermentable sugars, principally maltose.
Starch represents approximately 65% of the dry weight of the malt and consists of small (1.7–2.5 μm) and large (22–48 μm) granules [1,2] composed of the glucose polymers amylose and amylopectin [5]. Amylose, which comprises 20–25% of the total starch, is a linear chain of glucose monomers connected α-1-4 and packed together in an ordered structure. Amylopectin is similar in that it also contains α-1-4 glucose chains, but these chains are, on average, substantially shorter (i.e., ~25 vs. ~1800 glucosyls) and periodically branch off with α-1-6 linkages leading to a much larger, three-dimensional structure [1,2,3,5,6]. As the temperature of the starch increases in an aqueous environment (i.e., in a mash), the granules begin to swell with water (gelatinization), which disrupts their structure and renders them vulnerable to attack by the barley’s amylolytic enzymes: α-amylase, β-amylase, and limit dextrinase [1,3,5]. Maximizing the gelatinization and subsequent hydrolysis of starch into fermentable sugars are the two critical goals of mashing, though both of these processes are complex and depend on a wide variety of mashing parameters.
Temperature is the most important mashing process parameter, and understanding its impact is vital for predicting the performance of a given mash [1,3,7]. Increasing the mash temperature can be beneficial as it boosts the rate of all enzymatic reactions, reduces viscosity (which enhances mixing and liquid/solid separation), gelatinizes starch, and accelerates both diffusion and dissolution [1]. This same increase in temperature, however, will also accelerate the denaturation of all enzymes, and the increased rate of dissolution may lead to extraction of undesirable compounds (e.g., tannins) from the malt. The temperature of a mash must therefore be high enough to achieve full gelatinization, but also low enough as to not degrade the various amylolytic enzymes too rapidly. Simultaneous achievement of the two aforementioned mashing goals typically translates to a temperature somewhere in the range of 64–70 °C [1,3].
Mash pH (typically understood as the initial mash pH, as pH is seldom, if ever, controlled throughout the mashing process), like temperature, is fundamental to mashing performance, but its effects are less clearly understood. This imperfect understanding is compounded by the fact that acid dissociation increases with temperature, which means the measured pH of a sample is dependent on the temperature of the sample during measurement [1,8]. At 65 °C, the measured pH of a given wort will be roughly 0.34 pH units lower than the pH of that same wort measured near room temperature (18 °C) [9]. Reporting the temperature at which pH measurements were made is therefore of critical importance, and yet many authors fail to disclose this information. In general, mash pH falls in the range of 4.6–5.8 [1,8]. In a 2001 review of pH in brewing, Bamforth summarized the impact of pH on mash outcomes: mashes operating at the higher end of this range (5.3–5.8) resulted in the highest extract yields, whereas mashes operating at the lower end (4.7–5.2) resulted in the highest yields of free amino nitrogen (FAN) [8].
The effect of oxygen exposure on mashing performance has been studied substantially less than factors such as temperature and pH. Due to this incomplete understanding, brewers often endeavor to avoid oxygen exposure for fear of oxidation reactions. A primary reason behind this avoidance concerns the production of “teig” (German for dough), which consists of a variety of different macromolecules, including lipids, protein aggregates, and small granules of starch [1]. Teig is formed more readily under oxidizing conditions and can slow, or even stall, the solid–liquid separation process (“lautering”) that follows mashing [1,10]. Oxygen exposure during mashing has also been shown to cause oxidative lipid degradation, which can lead to the production of undesirable flavor compounds like trans-2-nonenal, and to increase the formation of staling aldehydes (Strecker aldehydes; benzaldehyde, 2-methybutanal, 3-methylbutanal, methional, and phenylacetaldehyde) as compared to mashes conducted under nitrogen atmosphere [11,12]. Aeration has not, however, previously been shown to affect the starch hydrolysis process itself [13,14].
The grist ratio, or the volume of water per unit grain, is also a critical process parameter. A lower grist ratio (thicker mash) results in a more concentrated wort, while a higher grist ratio (thinner mash) results in a less concentrated wort. With lower grist ratios, the concentrations of enzymes and their respective substrates and products are increased, thereby enhancing product inhibition, while the relative amount of so-called “free water” (i.e., water available for processes like gelatinization or enzymatic hydrolysis) is decreased [1]. Lowering the grist ratio also increases mash viscosity, which reduces the overall rate of mass transfer. With particularly low grist ratios (≤2.0 L∙kg−1), these effects have been shown to noticeably slow the rate of starch conversion and reduce the final yield of extract [1]. However, the thermostability of the key amylolytic enzymes increases with mash thickness such that, for particularly high mash temperatures (i.e., 70–85 °C), thicker mashes yield more fermentable worts [7]. Conversely, at low mash temperatures (i.e., 60 °C), thinner mashes give more fermentable worts [1].
Predictive models of starch hydrolysis in barley mashes have been developed [15,16,17,18]. The earliest such model was published in 1983 by Marc et al. In 1995, Koljonen et al. published a model that was quite similar to the 1983 model of Marc et al., but with minor differences in overall structure, fewer total parameters, and perhaps a small increase in overall prediction accuracy [16]. Both were true kinetic models comprised of large sets of coupled differential equations describing the temperature–dependent Arrhenius kinetics of the starch hydrolysis process. Both models, however, include inaccurate enzyme activity assignments: α-amylase produce only maltotriose and dextrins (not limit dextrins), and β-amylase, known to produce solely the disaccharide maltose, produces several carbohydrate species in addition to maltose and is the sole producer of limit dextrins. Brandam et al. identified these erroneous enzyme activity assignments and corrected them. Like the models developed by Marc et al. and Koljonen et al., both sucrose and fructose were omitted from the Brandam et al. model.
All three of these models are rooted in sound, fundamental concepts, and offer robust predictive power given the knowledge of the values of a particular set of input parameters. There are limitations, however: the rate constants used in these models are defined exclusively in the form of the Arrhenius rate law, and, as such, only the impact of temperature can be quantified when the effects of other process parameters, such as pH, are non-negligible [1,2,3,8]. Research has also shown that the effect of temperature is modulated by the particular liquor-to-grist ratio used and this and all other, potentially relevant parameter interaction phenomena are wholly absent from these models [1,2,3,5]. A simpler type of model that is able to capture, quantitatively and in a more holistic way, the impact of multiple important process parameters and their interactions is presented in this paper. Here, we describe a model based on response surface fitting of experimental small-scale mashing data, which predicts multiple key performance outcomes (total extract yield, fermentability, etc.), addresses the limitations of previous models, and is more mathematically tractable.
2. Materials and Methods
The experimental design used in this research was guided by a set of mathematical and statistical methods known collectively as Response Surface Methodology (RSM). RSM is ideal for characterizing and optimizing processes that depend on multiple factors [19]. Within this framework, input parameters, or independent variables, are referred to as “factors”, and outputs, or dependent variables, as “responses”. The first phase of model development consisted of a fractional factorial screen, which was augmented to a full central composite design (CCD) in the second phase.
For four input factors (temperature, pH, aeration, and grist ratio), each tested at one of two levels (low and high), there are 24 = 16 possible combinations. The Sparsity of Effects principle is invoked to reduce the total number of experiments by identifying a particular subset of all possible combinations that is likely to yield comparatively more valuable information than the rest [19]. Specifically, this subset consists of 24−1 = 8, or half, of the total possible combinations and transforms the full factorial design into a fractional (half) factorial design. A center point condition (codified as 0) is then typically added, which, as the name implies, lies at the center of the design space, with the value of each factor set exactly between its high and low values.
The results of the initial fractional factorial screen indicated that aeration had no significant effect on any tested response and that statistically significant curvature was present in the design space. In response, aeration was removed as a factor, and three pairs of axial points (one for each remaining factor) were then added to augment to a central composite design (CCD) and account for curvature. To capture a larger span of input factor values, a spherical design was used with α equal to √3 ≈ 1.732. Using temperature as an example, the distance from the center point (65 °C) to the high value (70 °C) was 5 °C, and so the corresponding axial point +α equaled 65 °C + 1.732 (5 °C) ≅ 73.7 °C. All experimental conditions tested for this work are listed in Table 1.
A total of eleven responses, divided into two categories were calculated from the measured data (Table 2). Responses in the first category represented yields on a grist-weight basis (i.e., expressed as a percentage of the initial grist weight) of total, fermentable, and non-fermentable extract yields. The measured wort density and reported malt moisture content were used to calculate the total extract yield (YTE) on an “as-is” basis using the Malt-4 method from the American Society of Brewing Chemists (ASBC) [20]. For fermentable extract yield (YFE), the concentrations of four fermentable carbohydrate species—glucose (GLC), maltose (MAL), maltotriose (MLT), and fructose (FRC)—were first quantified. YFE was then calculated in a fashion analogous to that of YTE, but with a summed concentration of fermentable sugars used in place of the concentration of total extract. The non-fermentable fraction of the total extract consists partly of a set of soluble, but non-fermentable carbohydrate species with the degree of polymerization (DP) ≥4, which are referred to collectively by the abbreviation DP4+. The remainder of the non-fermentable extract is comprised of a milieu of other compounds, including nitrogen-containing species such as proteins, amino acids, and enzymes, and was referred to collectively as the “non-carbohydrate” (NC) fraction. Responses in the second category corresponded to the fractional composition of the total extract and were therefore expressed as a percentage of the total extract obtained. Response values in this category were calculated by dividing the concentration of each respective species by the concentration of total extract. In the case of the fermentable extract (FE), the sum of the measured concentrations of the four fermentable carbohydrates was used as the numerator (see Equation (1)); for non-fermentable extract (NFE), the sum of the measured concentration of DP4+ species and the calculated concentration of NC (calculated as the difference between the total extract concentration and the sum of the fermentable carbohydrate concentrations and the DP4+ concentration) was used.
Equation (1)–Calculation of Fermentable Extract (FE)
Because one of the factors to be investigated was grist ratio, normalized responses were chosen to eliminate the bias that would arise from concentration effects. If, for example, the concentration of total extract had been used rather than total extract yield, a low-grist-ratio mash would appear to outperform a high-grist-ratio mash, all other conditions being equal, and the potential impacts of the other factors would be obscured, with an unduly large impact attributed to the grist ratio simply because the ratio of water to grist was smaller.
Stat-Ease Design Expert® 11 was used to perform analysis of variance (ANOVA) and generate a model for each response. Determination of statistical significance was defined as a p-value threshold of p < 0.05. The final response models from the CCD were generated by fitting second-order (quadratic) polynomials to the data such that the sum of squared differences between the measured and predicted response values was minimized. Model reduction was performed via stepwise selection using an inclusion criterion of p < 0.1 with a requirement that model hierarchy be maintained (i.e., if a one-factor quadratic or two-factor interaction effect term was included, the corresponding one-factor linear effect term(s) was also included).
Isothermal mash experiments were performed using a set of four, six-liter, New Brunswick BioFlo 3000 bioreactors (Edison, NJ, USA) each equipped with on-board systems for temperature control, agitation, and gassing. Temperature was controlled by each bioreactor’s onboard control system. Three Rushton impellers, spaced evenly on each bioreactor’s agitator shaft, were used for mixing. The specific agitation rate for each mash was determined visually as the minimum required to create the appearance of thorough, homogeneous mixing. For grist ratios ≥3.25 kg·kg−1, 250–350 RPM (1.0–1.4 m·s−1 tip speed) was sufficient, whereas grist ratios ≤2.50 kg·kg−1 necessitated 400–500 RPM (1.6–2.0 m·s−1 tip speed). Gas was sparged via a stainless-steel sparge ring with four top-mounted holes. A gas flow rate of 1.5 L per minute was used for all gassed mashes.
Mash liquor for all mashes was prepared by adding calcium chloride dihydrate to deionized water such that the initial calcium concentration was 108.7 mg·L−1. A quantity of 88% lactic acid was then added to the mash liquor depending on the target mash pH.
Two lots of Rahr Malting two-row malted barley (lots 28146 and 28703) were used for all mash experiments. Grist was prepared using a Seeger ZSM O-G-4704-Gr.2 grist mill. The coarseness of the prepared grist was quantified by the standard method detailed in ASBC Malt-4 and found to be slightly coarser than the standard definition of “coarse grinding” (i.e., of a 50 g sample, 40.1 ± 0.8 g were retained on an 8” diameter, No. 30 sieve rather than the coarse grind standard of 37.5 ± 0.5 g) [20].
Samples were removed from each mash at seven different time points: 5, 15, 30, 45, 60, 75, and 90 min. Initial (i.e., elapsed time = 0 min) values of density and carbohydrate composition were not determined using samples taken from the hot mash. Instead, these quantities were measured from aliquots of chilled grist and chilled, deionized water (without any calcium) that were prepared, combined, and analyzed in triplicate for each grist ratio as to minimize the potential for starch conversion. Density and carbohydrate composition were measured at every sample time point and pH was measured at 15 and 90 minutes. Samples used for pH measurement were chilled immediately upon removal from the mash. These samples were then allowed to equilibrate to room temperature before measurement of pH with a benchtop pH meter with automatic temperature compensation (Accumet Model 25 pH/Ion Meter). Samples used for the measurement of density and carbohydrate composition were immediately incubated in a heating block (Labnet D1200 AccuBlock™ Digital Dry Bath Heating Block) maintained at 85 °C for a period of 10 min to eliminate further enzyme activity, then centrifuged (Eppendorf Centrifuge 5424) at 21,130 RCF for 3 min. Density was measured by injecting a 1 mL sample of clarified wort into a digital densitometer (Mettler/Paar DMA 46 Digital Density Meter).
The carbohydrate composition of the wort was determined by high-performance liquid chromatography paired with refractive index detection (HPLC-RID). HPLC-RID (Hewlett-Packard Series 1100 HPLC with Bio-Rad Model 1755 Refractive Index Detector) was conducted at 65 °C with a maximum pressure of 120 bar and a flow rate of 0.200 mL∙min−1 using two Aminex HPX-87H Ion Exclusion Columns (300 mm × 7.8 mm) in series; the solvent used was 5 mM sulfuric acid (prepared from Fisher Scientific 1N Sulfuric Acid Solution, SA212-1). The sample injection volume was 10.0 μL with a deionized-water needle wash between samples. Carbohydrate standards were prepared gravimetrically for fructose, glucose, maltose, and maltotriose, by dissolving pure, HPLC-grade carbohydrate (Sigma-Aldrich D-(+)-Glucose, BioUltra, anhydrous, ≥99.5% (HPLC), 49139; Sigma-Aldrich D-(+)-Maltose monohydrate, BioUltra, ≥99.0% (HPLC), 63418; Sigma-Aldrich Maltotriose, ≥95% (HPAE/PAD), M8378; Sigma-Aldrich D-(-)-Fructose, BioUltra, ≥99.0% (HPLC), 47739) in deionized water. For fructose, glucose, and maltotriose, standard concentrations were 5, 10, 20, and 40 g/L; for maltose, 20, 40, 80, and 160 g/L. Peak integration and determination of the area under the curve (AUC) was performed using the manufacturer-provided software package. Analysis of the standard solutions for glucose, fructose, maltose, and maltotriose yielded chromatograms with consistent retention times (RTs) and well-defined peaks. These data gave near-perfect linear correlations (i.e., R2 ≥ 0.999) between AUC and concentration, which were used to quantify respective response factors (RFs). The concentration of DP4+ (degree of polymerization ≥ 4) carbohydrates (e.g., maltotetraose, maltopentaose, etc.) was estimated by applying the maltotriose RF to the AUC of the peak with the shortest RT observed in each wort sample.
3. Results
After 90 min of mashing had elapsed, a sizeable spread in the values of the various responses was observed across the fifteen tested conditions (Table 3). The difference between the lowest and highest YTE values was 8.3%, from 77.2% (C09) to 85.5% (C13). A substantially larger span was observed for fermentable extract (FE), which varied by 34.2%, from 44.9% (C10) to 79.0% (C05). With regard to the relative composition of the FE, maltose (MAL) was the most abundant, followed by glucose (GLC), maltotriose (MLT), and finally fructose (FRC). The final response values achieved by each of the fifteen mash conditions are given in Table 3. Six replicates were evaluated for the center point (C00), with triplicates evaluated for all factorial conditions (C01–C08) with the exception of C02, for which one replicate was omitted (M02) due to pH deviation. The axial point conditions (C09–C14) were evaluated in singlet.
Common across all tested mash conditions, however, was the observation that starch conversion was rapid. Time-course kinetics of starch conversion for the six replicates of the center-point condition (C00) are shown in Figure 1. To effectively compare the rate of progress for mashes with varied operating conditions, two new, normalized, unitless analogs of the total extract yield (ŶTE) and fermentable extract yield (ŶFE) were calculated by dividing the measured values of YTE and YFE at each sample time point by their respective 90-min values. As such, the final, 90-min values of both ŶTE and ŶFE always equaled 100%. On average, across all mashes, ŶTE had reached 71.5% within the first 5 min of mashing. By 30 min, four conditions (C04, C06, C13, and C14) had reached a ŶTE of 95%, and, by 45 min, all conditions had done so. Average ŶFE values showed a similar trend but were slightly behind the values of ŶTE. Between 15 and 75 min, ŶTE and ŶFE were almost exactly 15 min out of phase with each other (e.g., 15-min ŶTE was 86.0%, 30-min ŶFE was 87.5%; 30-min ŶTE was 93.7%, 45-min ŶFE was 93.0%; 45-min ŶTE was 96.3%, 60-min ŶFE was 95.9%, and so on). Time-course data for the actual values of YTE and YFE for each of the fifteen experimental conditions are shown in Figure 2 and Figure 3, respectively.
ANOVA was performed on the collected data to assess the design space and, in particular, the significance of each effect. The results revealed significant (i.e., p < 0.05) curvature in the design space for eight of the eleven responses (all but YTE, GLC, and MLT), and, without a curvature term, these eight responses exhibited a statistically significant lack of fit (LOF). The addition of a curvature term eliminated LOF significance for all eight of these responses and improved R2 values by an average of 22.3%. With regard to specific effects, a statistically significant linear impact of temperature was observed for all eleven responses, pH for six (YFE, YNFE, FE, MAL, NFE, and NC), grist ratio for three (YTE, YNFE, and MAL), and aeration for zero responses. A significant interaction effect was identified for temperature–pH (aliased with aeration–grist ratio) for two responses (MAL and DP4+), temperature–grist ratio (aliased with pH–aeration) for nine (all but GLC and FRC), and temperature–aeration (aliased with pH–grist ratio) for zero. The linear aeration term satisfied the inclusion criterion of p < 0.1 for YFE and NC, but no aeration term satisfied the statistical significance threshold of p < 0.05 for any response.
These values were used to construct unique, second-order polynomials for predicting the behavior of each response. Response polynomials for YTE, YFE, and FE are given in Equations (2)–(4). Due to the term-inclusion criteria used (i.e., p < 0.1 and maintenance of model hierarchy), several response polynomials include terms for which p > 0.05. Model fit statistics for the various response polynomials are given in Table 4, additional details are available in the Supplementary Materials.
Equation (2)–YTE response polynomial
Equation (3)–YFE response polynomial
Equation (4)–FE response polynomial
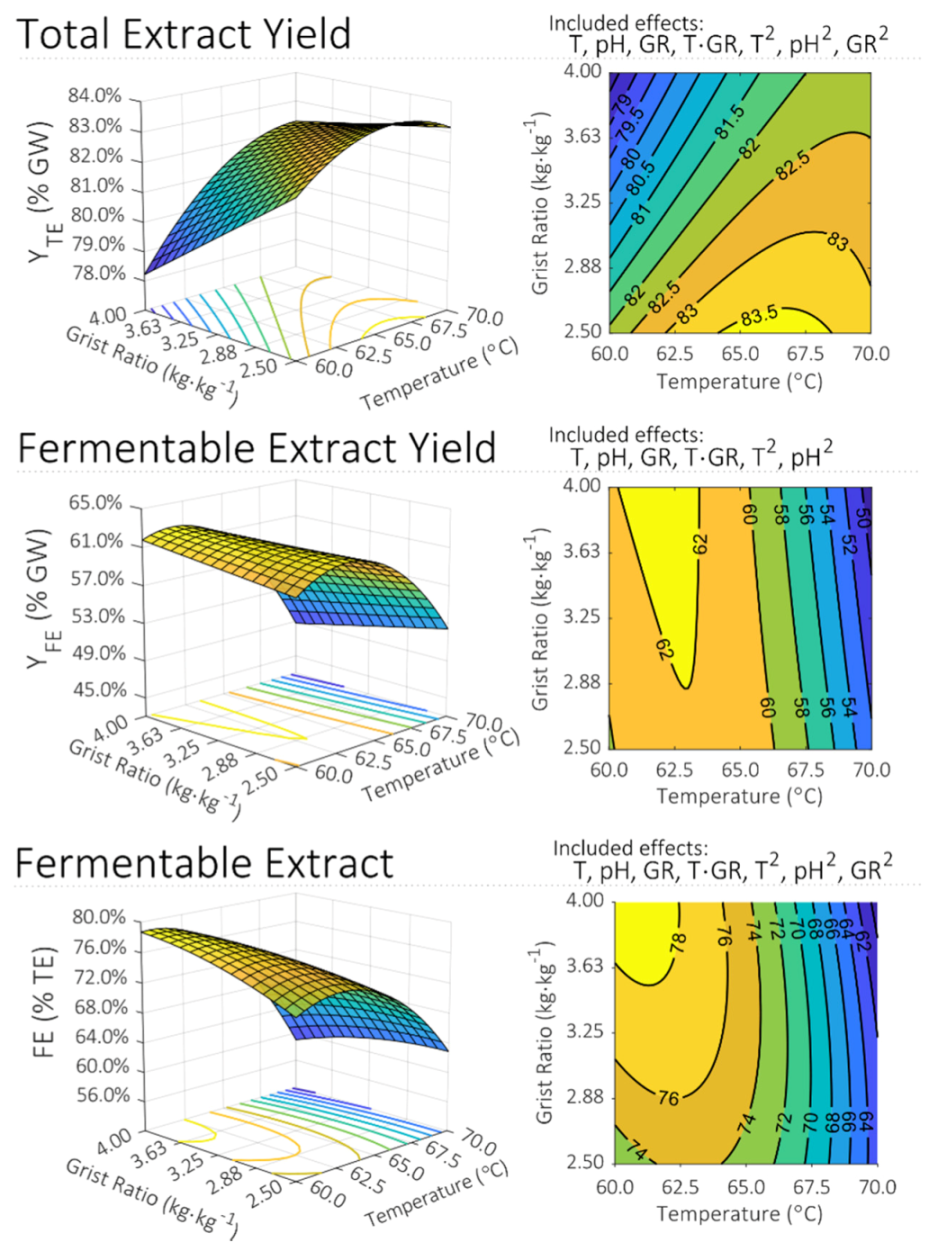
Of the significant interaction effects observed, the interaction between temperature and grist ratio was not only the most prevalent, but was greater in magnitude than the individual, linear effects of pH and of grist ratio for all but one response (YTE). Generally, across all tested conditions, the highest values of YTE were obtained with temperatures above 65 °C, pH values lower than 5.30, and grist ratios lower than 3.25 kg∙kg−1, whereas the opposite was true for YFE and FE. Determination of a specific temperature at which YTE was maximized, however, was complicated by the significant interaction between temperature and grist ratio. Indeed, maximization (or any form of optimization) of a response for which a significant factor interaction effect is present is not associated with a singular factor value, but instead varies depending on the value of the interacting factor. The model predicted a mash temperature of 70.0 °C for maximizing YTE and 60.5 °C for maximizing FE in a thin mash (i.e., GR = 4.00 kg∙kg−1). For thick mashes (i.e., grist ratio = 2.50 kg∙kg−1), the predicted maximization temperature fell by 3.7 °C to 66.3 °C for YTE and increased by 2.3 °C to 62.8 °C for FE. While this interaction effect had a substantial impact on YTE, the low grist ratio condition was predicted to give a comparatively higher YTE across the entire temperature range. In the case of FE, however, this interaction had a more dramatic impact: for temperatures below 66.1 °C, the high grist ratio was predicted to give comparatively higher FE, whereas for temperatures above 66.1 °C, the opposite was true.
The design space was visualized by plotting three-dimensional response surfaces and their corresponding two-dimensional projections, called contour plots, as a function of two factors. Response surfaces and contour plots for YTE, YFE, and FE are presented in Figure 4. In the case of these three responses, pH had a significant impact on its own, but it was not identified to interact significantly with either of the other two factors. Modulating the value of pH would therefore shift the predicted response surface up or down without changing its shape. For all responses shown in Figure 4, pH is held at its respective center-point value of 5.30.
4. Discussion
In comparison to previous modeling efforts, a unique aspect of the model developed for this work was the quantification of interactions between process parameters. The interaction between temperature and grist ratio, for example, has long been known to affect mash performance; specifically, that thick mashing conditions retard the thermal denaturation of the amylolytic enzyme. Indeed, any information regarding the relationship between mash temperature (or grist ratio) and measures of performance pertaining to extract and its fermentability should include information about the grist ratio (or temperature). Briggs et al. gives 65 °C as the temperature optima for obtaining the highest yield of fermentable extract, but soon after qualifies that this value and other listed temperature optima are not constants and are wholly dependent on mash thickness [1]. The model from this work captures this phenomenon quantitatively.
Given that the starch conversion process is known to be principally reliant on the activity of a particular set of amylolytic enzymes, and that each of these enzymes has a temperature at which it is most active, coupled with considerable, but varying, degrees of thermolability, it was unsurprising that the effect of temperature on mash performance was found to be significant for all responses. Of the two significant interaction effects identified, both involved temperature: temperature–pH and temperature–grist ratio. Quantitatively, the observed effects of temperature with respect to the various responses were largely in agreement with established knowledge. The range of temperatures predicted by the final model to maximize YTE, YFE, and FE were 66.3–70.0 °C, 61.9–63.3 °C, and 60.6–62.8 °C, respectively. For comparison, published temperatures for maximizing these same responses are 65–68 °C, 65 °C, and 63 °C [1,21,22].
Similarly, each of these amylolytic enzymes functions best in a particular pH range, and pH was also found to be broadly significant, with seven responses significantly affected. Compared to temperature, however, the impact of pH was of a lesser magnitude. Due to the lack of any significant interaction effect for YTE, YFE, and FE, pH optima for these responses were not dependent on the values of the other two factors. pH values predicted to maximize YTE, YFE, and FE were 5.19, 5.40, and 5.48, respectively. Precise values from the literature for maximizing these responses are not particularly well defined (typically only ranges are listed) partly due to the lack of information regarding the temperature at which pH was measured. In general, though, pH values for maximizing total extract yield (5.2–5.4 in Briggs et al. and 5.3–5.8 in Bamforth and Simpson) are lower than pH values for maximizing fermentable extract (5.3–5.4 in Briggs et al. and 5.4–5.8 in Bamforth and Simpson); the results obtained in this work are in agreement [1,23]. The interaction between temperature and pH was one of the two significant interaction effects identified, but was only significant for two responses, MAL and DP4+. Given that all mash pH values were measured at room temperature regardless of the corresponding mash temperatures, it was initially somewhat surprising that so few responses were associated with a significant temperature–pH interaction.
Similar to the results for temperature and pH, grist ratio was found to have a broad, significant impact. The observed relationship between YTE and grist ratio was definitive: thicker mashes gave a higher YTE. This finding was reversed with respect to the aggregated data presented in Briggs et al., but in near perfect alignment with the findings of Harris and MacWilliam and of Fox et al. [1,24,25]. The two leading hypotheses for explaining the observed reduction in extract yield for very thick mashes are a reduction in the availability of free water and an increase in overall mash viscosity. The concentration of water in a thick mash is always lower than in a thin mash, and without sufficient free water, both the initial gelatinization and solubilization of starch, and the subsequent enzymatic hydrolysis are hampered. A thick mash is also comparatively more viscous, which generally slows mass transfer, and therefore the distribution of the already limited amount of free water, further impeding starch conversion. Actively mixing the mash would increase the rate of mass transfer, but such mixing is generally quite gentle in comparison to avoid the detrimental effects on lautering efficiency caused by oxygen exposure [1,10]. Consequently, any enhancement in mass transfer rate is minimal. In contrast, the experimental mashes conducted for this study were both continuously and vigorously mixed, which may have alleviated some of the mass transfer limitations of the thick mashes. In 2016, Evans reported that using a grist ratio lower than 3 L∙kg−1 was undesirable, citing a tendency in thicker mashes for the grist to form ball-like structures where the innards remain dry and are not extracted [22]. The mixing used would have eliminated the detrimental impact of this phenomenon on extract yield as well.
Finally, aeration has been shown to affect various aspects of the mashing and subsequent lautering processes, but no published research has indicated a significant impact on any metrics related specifically to starch hydrolysis. The results of the mash experiments performed were in line with previous research: aeration was not found to have a significant impact on any aspect of starch hydrolysis. In the initial fractional factorial screen, it was the linear aeration term for NC that was closest to statistical significance (p = 0.0561) and aeration has been shown to affect the concentrations of non-carbohydrate species in a mash like polyphenols and thiol-containing species [10]. The magnitude of this effect was on the order of that of pH, but the sign of the term coefficient was positive, which was reversed relative to expectation based on the previous research (i.e., that increased exposure to oxygen would lead to precipitation of polyphenols and thiol-containing species, thereby lowering the relative proportion of NC) [10,13]. The lack of any significant interaction was definitive though, as the temperature–aeration interaction (aliased with the pH–grist ratio interaction) was insignificant for all responses in the fractional factorial screen and the pH–grist ratio term was similarly insignificant for all responses in the central composite design.
The overall predictive capabilities of the model detailed in this work appear to be quite robust, and the statistical results indicated that the model adequately accounted for a great deal of the variation observed in the conducted mash experiments across all measured responses. As discussed, operating conditions predicted by the model for maximizing key performance metrics like total extract yield and extract fermentability were well-aligned with established research, lending support to the model’s validity. The individual response models for YFE/YNFE, FE/NFE, MAL, and DP4+ fit the data particularly well, with R2 values of 0.954, 0.959, 0.979, and 0.931, respectively; the poorest fits observed were for GLC (R2 = 0.517) and FRC (R2 = 0.669). Given that the overall proportion of fermentable extract (FE) had an excellent model fit, the ability to predict or optimize the specific proportions of GLC and FRC is of comparatively minor importance as both are readily fermentable by yeast. MLT, on the other hand, is not ubiquitously fermentable and therefore the ability to determine conditions for minimizing its formation is comparatively more important. Fortunately, the MLT response model fit the data better, with an R2 value of 0.75.
5. Conclusions
This work detailed the development of a predictive model of the starch conversion process in a barley mash that accounted for both the individual effects of temperature, pH, and grist ratio, three highly relevant process parameters, and of the significant interaction effects between these parameters. As expected, temperature was the most significant driver of mash performance with significant, with comparatively lesser impacts from pH and grist ratio. Initial experiments included a fourth parameter, aeration, in order to investigate the effect of modulating the exposure of the mash to oxygen on starch hydrolysis, but the impact of aeration was determined to be statistically negligible and was therefore omitted as a factor of consideration. The particular modeling framework used for this research–Response Surface Methodology (RSM)–enabled direct comparison of the relative impacts of qualitatively different process parameters in addition to quantification of any significant interactions between those parameters. Long known to affect mash performance, the temperature–grist ratio interaction was found to significantly impact nearly every measured response. This and all other relevant effects were captured in the final model, which consisted of eleven independent, statistically significant response polynomials, each corresponding to a particular mash performance metric. Overall, model fit was quite good, and the operating conditions predicted by the model for maximizing key mash performance metrics, such as total extract yield and fermentable extract agreed with published literature. In the context of mashing, however, success criteria are generally defined in terms of more than one response (e.g., simultaneous maximization of both total extract yield and extract fermentability). The model detailed here can be leveraged in a straightforward way to perform precisely this sort of simultaneous response optimization. Future work should include the application of this model to brewing process optimization for simultaneous objective functions (e.g., density, total extract), which would be of direct application to the brewing industry. The success of this approach to modeling a complex bioprocess encourages further application of RSM to other aspects of brewing, helping us move toward a deeper understanding of one of the oldest bioprocesses in existence.
Supplementary Materials
The following are available online at https://0-www-mdpi-com.brum.beds.ac.uk/2306-5710/6/4/60/s1, Table S1: Statistical Significance of Model Parameters.
Author Contributions
Conceptualization: D.E.B. and A.S.; Methodology: A.S.; Investigation: D.E.B. and A.S., Software: A.S., Validation: A.S., K.V.M., D.E.B., Formal Analysis: A.S., K.V.M., D.E.B., Resources: D.E.B.; Writing—Original Draft Preparation: A.S. and K.V.M., Writing—Review and Editing: A.S., K.V.M., D.E.B., Visualization: A.S. and K.V.M., Supervision: D.E.B., Project Administration: D.E.B., Funding Acquisition: D.E.B. All authors have read and agreed to the published version of the manuscript.
Funding
The authors would like to acknowledge funding from the Ernest Gallo Endowed Chair in Viticulture and Enology.
Conflicts of Interest
The authors declare no conflict of interest.
References
- Briggs, D.E.; Boulton, C.A.; Brookes, P.A.; Stevens, R. Brewing: Science and Practice; Woodhead Publishing: Boca Raton, FL, USA, 2004; ISBN 0-8493-2547-1. [Google Scholar]
- Lewis, M.J.; Young, T.W. Brewing; Kluwer Academic/Plenum Publishers: New York, NY, USA, 2002. [Google Scholar]
- Fox, G. Starch in Brewing Applications. In Starch in Food; Sjoo, M., Nilsson, L., Eds.; Woodhead Publishing: Sawston, UK, 2017; pp. 633–659. [Google Scholar]
- Russell, I.; Stewart, G.G.; Anstruther, A. Handbook of Brewing, 3rd ed.; CRC Press: Boca Raton, FL, USA, 2018. [Google Scholar]
- Bamforth, C.W. Scientific Principles of Malting and Brewing; American Society of Brewing Chemists: Saint Paul, MN, USA, 2006. [Google Scholar]
- Shetty, K.; Paliyath, G.; Pometto, A.; Levin, R.E. (Eds.) Food Biotechnology, 2nd ed.; CRC Press: Boca Raton, FL, USA, 2005. [Google Scholar]
- Muller, R. The Effects of Mashing Temperature and Mash Thickness on Wort Carbohydrate Composition. J. Inst. Brew. 1991, 97, 85–92. [Google Scholar] [CrossRef]
- Bamforth, C.W. pH in Brewing: An Overview. MBAA Tech. Q. 2001, 38, 1–8. [Google Scholar]
- Hopkins, R.H.; Krause, B. Biochemistry Applied to Malting and Brewing; G. Allen & Unwin, Ltd.: Crows Nest, Australia, 1947. [Google Scholar]
- Stephenson, W.H.; Biawa, J.P.; Miracle, R.E.; Bamforth, C.W. Laboratory-Scale Studies of the Impact of Oxygen on Mashing. J. Inst. Brew. 2003, 109, 273–283. [Google Scholar] [CrossRef]
- Wietstock, P.C.; Kunz, T.; Methner, F.J. Relevance of Oxygen for the Formation of Strecker Aldehydes during Beer Production and Storage. J. Agric. Food Chem. 2016, 64, 8035–8044. [Google Scholar] [CrossRef] [PubMed]
- Arts, M.J.T.J.; Grun, C.; de Jong, R.L.; Voss, H.-P.; Bast, A.; Mueller, M.J.; Haenen, G.R.M.M. Oxidative degradation of lipids during mashing. J. Agric. Food Chem. 2007, 55, 7010–7014. [Google Scholar] [CrossRef] [PubMed]
- Bamforth, C.W. Ascorbic Acid Oxidase in Barley and Malt and Its Possible Role During Mashing. J. Am. Soc. Brew. Chem. 2014, 72, 30–35. [Google Scholar] [CrossRef] [Green Version]
- Clarkson, S.P.; Large, P.J.; Bamforth, C.W. Oxygen-Scavenging Enzymes in Barley and Malt and Their Effects during Mashing. J. Inst. Brew. 1992, 98, 111–115. [Google Scholar] [CrossRef]
- Marc, A.; Engasser, J.M.; Moll, M.; Flayeux, R. A kinetic model of starch hydrolysis by alpha- and beta-amylase during mashing. Biotechnol. Bioeng. 1983, 25, 481–496. [Google Scholar] [CrossRef] [PubMed]
- Koljonen, T.; Hämäläinen, J.J.; Sjöholm, K.; Pietilä, K. A Model for the Prediction of Fermentable Sugar Concentrations During Mashing. J. Food Eng. 1995, 26, 329–350. [Google Scholar] [CrossRef]
- Brandam, C.; Meyer, X.M.; Proth, J.; Strehaiano, P.; Pingaud, H. An original kinetic model for the enzymatic hydrolysis of starch during mashing. Biochem. Eng. J. 2003, 13, 43–52. [Google Scholar] [CrossRef]
- Muller, R. A mathematical model of the formation of fermentable sugars from starch hydrolysis during high-temperature mashing. Enzyme Microb. Technol. 2000, 27, 337–344. [Google Scholar] [CrossRef]
- Myers, R.H.; Montgomery, D.C.; Anderson-Cook, C.M. Response Surface Methodology; John Wiley & Sons Inc.: Hoboken, NJ, USA, 2016. [Google Scholar]
- ASBC Methods of Analysis. Method Malt–4. Extract. Available online: https://www.asbcnet.org/methods/pages/default.aspx (accessed on 11 October 2020).
- Evans, D.E.; Goldsmith, M.; Redd, K.S.; Nischwitz, R.; Lentini, A. Impact of Mashing Conditions on Extract, Its Fermentability, and the Levels of Wort Free Amino Nitrogen (FAN), β-Glucan, and Lipids. J. Am. Soc. Brew. Chem. 2012, 70, 39–49. [Google Scholar] [CrossRef]
- Evans, D.E. A Comprehensive Revaluation of Small-Scale Congress Mash Protocol Parameters for Determining Extract and Fermentability. J. Am. Soc. Brew. Chem. 2011, 69, 13–27. [Google Scholar] [CrossRef]
- Bamforth, C.W.; Simpson, W.J. Ionic equilibria in brewing. Brew. Guard. 1995, 124, 18–24. [Google Scholar]
- Harris, G.; MacWilliam, I.C. Yields and Properties of Worts Obtained by Mashing Under Various Conditions. J. Inst. Brew. 1961, 67, 144–151. [Google Scholar] [CrossRef]
- Fox, G.; Ki, L. Infrared spectral analysis of sugar profiles of worts from varying grist to liquor ratios using infusion and ramping mash styles. J. Inst. Brew. 2016, 122, 437–445. [Google Scholar] [CrossRef]
Figure 1.
Time-course kinetics of starch conversion for the center point condition (C00, n = 6). Left: Time-course concentration profiles of total extract (TE), glucose and fructose (DP1), maltose (DP2), maltotriose (DP3), and DP4+ carbohydrates. Right: Time-course profiles of total (YTE), fermentable (YFE), and nonfermentable (YFNE) extract yields as a % of grist weight. Errors bars represent one standard deviation.
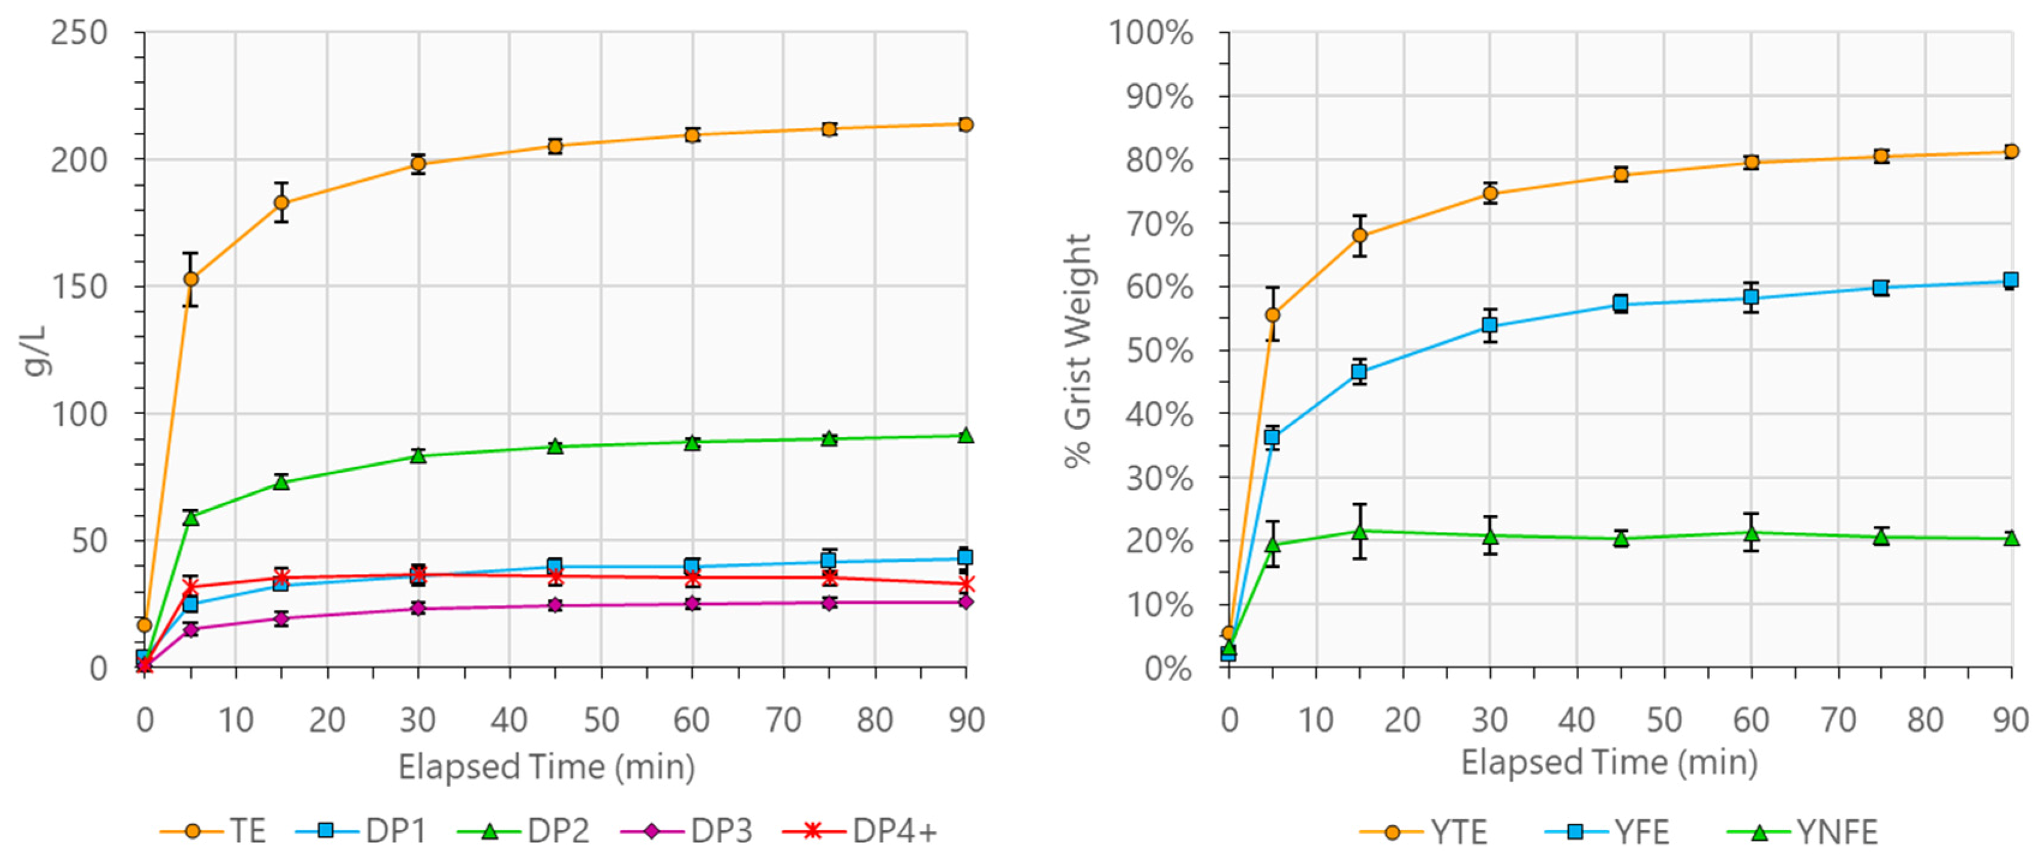
Figure 2.
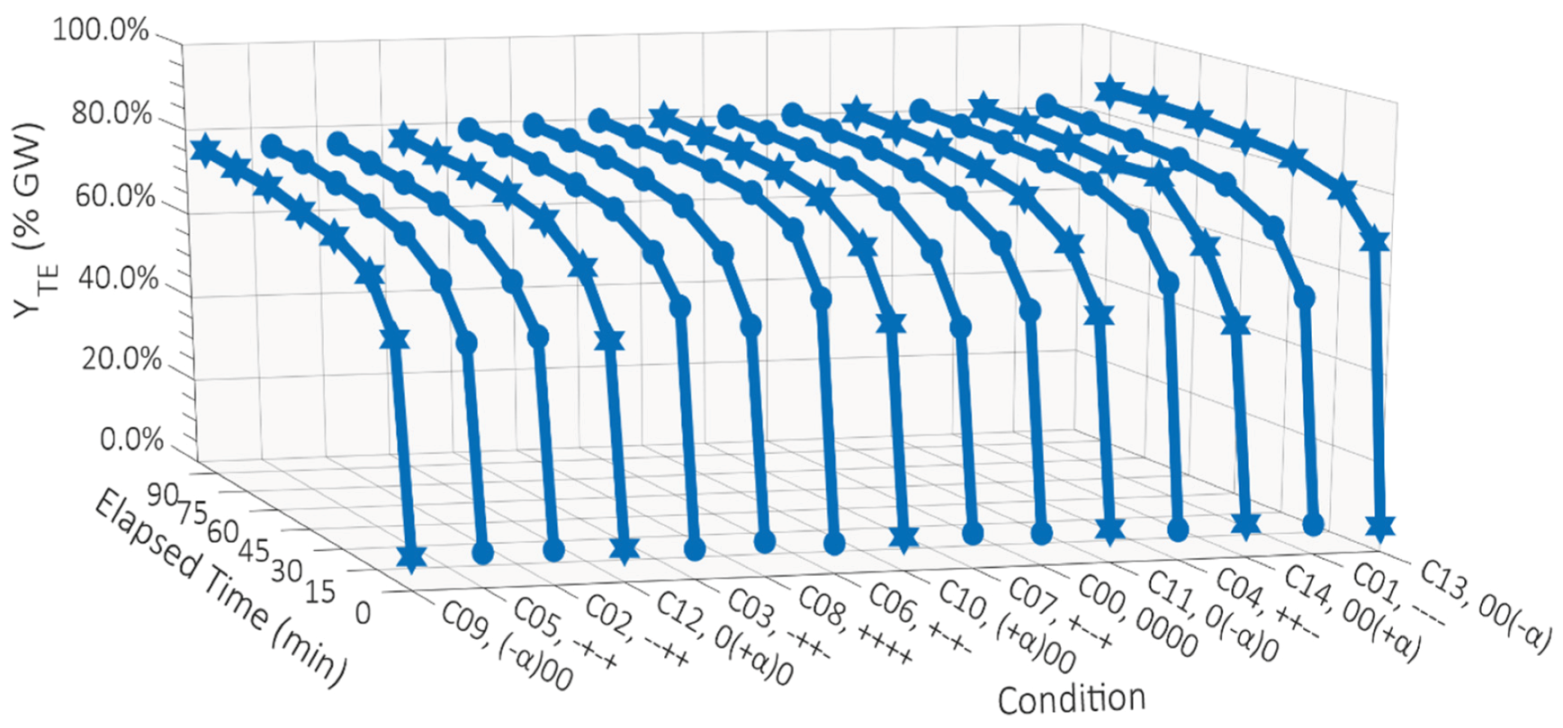
Time-course YTE data for all conditions. Regardless of mashing condition, a significant spread in YTE was observed (8.3%). Axial condition (axial point conditions are denoted with star-shaped markers) C13, which was the thickest mash tested with GR = 1.95 kg∙kg−1, achieved a particularly high value of YTE (85.5%; >2 standard deviations above the average).
Figure 2.
Time-course YTE data for all conditions. Regardless of mashing condition, a significant spread in YTE was observed (8.3%). Axial condition (axial point conditions are denoted with star-shaped markers) C13, which was the thickest mash tested with GR = 1.95 kg∙kg−1, achieved a particularly high value of YTE (85.5%; >2 standard deviations above the average).

Figure 3.
Time-course YFE data for all conditions. Compared to the data for YTE presented above in Figure 2, YFE was impacted substantially more by the particular set of conditions used for mashing with a substantially larger spread of 24.7%. Axial point conditions are denoted with star-shaped markers.
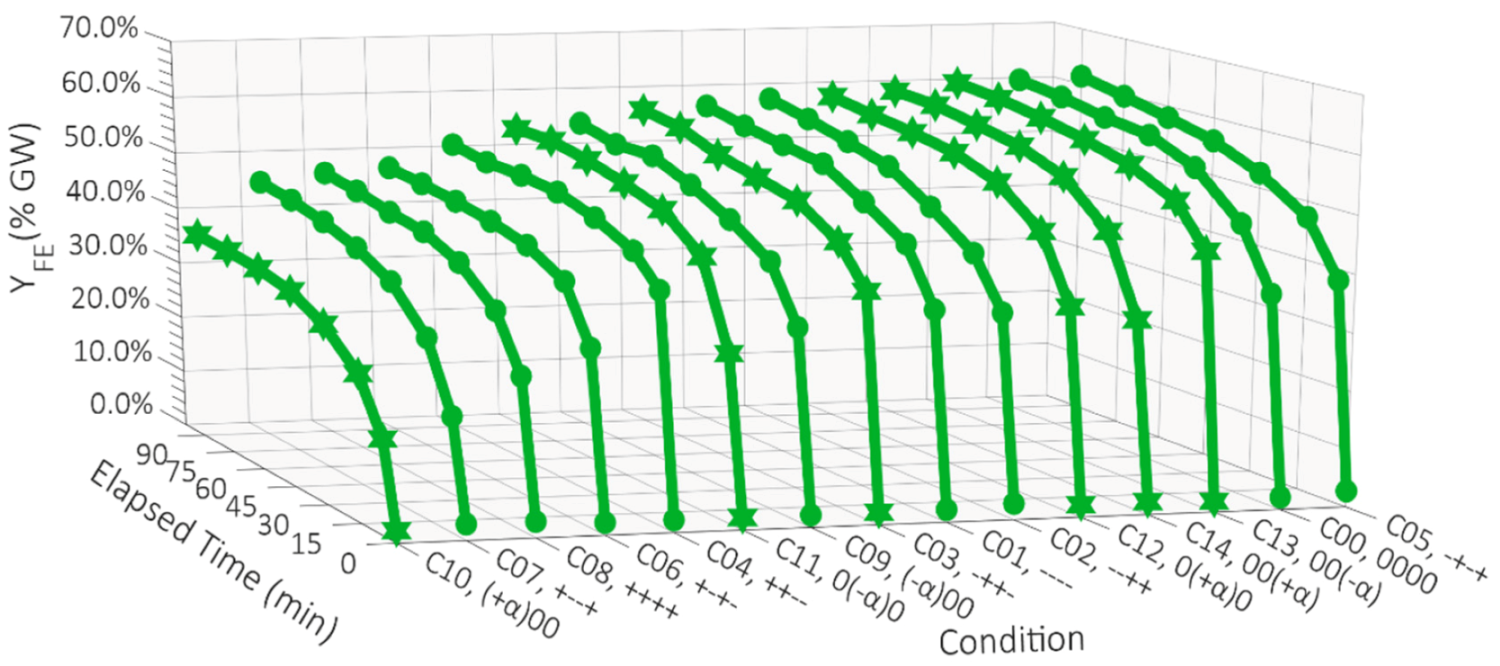
Figure 4.
Response surfaces and contour plots for YTE, YFE, and fermentable extract (FE). For the response surfaces and contour plots above, pH is held at its center-point value of 5.30.
Figure 4.
Response surfaces and contour plots for YTE, YFE, and fermentable extract (FE). For the response surfaces and contour plots above, pH is held at its center-point value of 5.30.

Table 1.
Fifteen experimental mash conditions.
| Condition | Temperature (°C) | pH 1 | Aeration 2 | Grist Ratio (kg∙kg−1) |
|---|---|---|---|---|
| C00 | 65.0 | 5.30 | 50% Air/50% N2 | 3.25 |
| C01 | 60.0 | 5.00 | 100% N2 | 2.50 |
| C02 | 60.0 | 5.00 | 100% Air | 4.00 |
| C03 | 60.0 | 5.60 | 100% Air | 2.50 |
| C04 | 70.0 | 5.60 | 100% N2 | 2.50 |
| C05 | 60.0 | 5.60 | 100% N2 | 4.00 |
| C06 | 70.0 | 5.00 | 100% Air | 2.50 |
| C07 | 70.0 | 5.00 | 100% N2 | 4.00 |
| C08 | 70.0 | 5.60 | 100% Air | 4.00 |
| C09 | 56.3 | 5.30 | N/A | 3.25 |
| C10 | 73.7 | 5.30 | N/A | 3.25 |
| C11 | 65.0 | 4.78 | N/A | 3.25 |
| C12 | 65.0 | 5.82 | N/A | 3.25 |
| C13 | 65.0 | 5.30 | N/A | 1.99 |
| C14 | 65.0 | 5.30 | N/A | 4.51 |
1 Mash pH was measured at room temperature using the methods described below. 2 The results of the fractional factorial screen indicated no significant effect for aeration; as such, aeration was omitted for C09–C14.
Table 2.
Set of eleven calculated responses.
| Extract Yields (% of Grist Weight) | Abbreviation | |
|---|---|---|
| 1 | Total Extract Yield 1 | YTE |
| 2 | Fermentable Extract Yield | YFE |
| 3 | Non-Fermentable Extract Yield | YNFE |
| Extract Composition (% of Total Extract) | Abbreviation | |
| 4 | Fermentable Extract | FE |
| 5 | Glucose | GLC |
| 6 | Maltose | MAL |
| 7 | Maltotriose | MLT |
| 8 | Fructose | FRC |
| 9 | Non-Fermentable Extract | NFE |
| 10 | DP4+ | DP4+ |
| 11 | Non-Carbohydrate | NC |
1 Total Extract Yield (YTE) was calculated on an “as-is” basis (see American Society of Brewing Chemists (ASBC) Method Malt-4) [20].
Table 3.
Final (90-min) response values for each condition.
| Response | Center- (n = 6) and Factorial-Point (n = 3) Conditions | Axial-Point Conditions (n = 1) | |||||||||||||
|---|---|---|---|---|---|---|---|---|---|---|---|---|---|---|---|
| C00 | C01 | C02 | C03 | C04 | C05 | C06 | C07 | C08 | C09 | C10 | C11 | C12 | C13 | C14 | |
| YTE (% GW) | 82.0 | 82.5 | 77.9 | 80.4 | 82.1 | 77.7 | 82.9 | 81.9 | 81.1 | 77.2 | 81.9 | 82.0 | 78.7 | 85.5 | 82.2 |
| YFE | 61.0 | 57.6 | 58.6 | 57.2 | 51.8 | 61.4 | 48.7 | 45.9 | 47.3 | 55.1 | 36.7 | 54.3 | 58.8 | 60.7 | 59.5 |
| YNFE | 20.9 | 24.9 | 19.3 | 23.3 | 30.3 | 16.3 | 34.2 | 36.0 | 33.8 | 22.1 | 45.1 | 27.6 | 20.0 | 24.8 | 22.7 |
| FE (% TE) | 74.4 | 69.8 | 75.2 | 71.1 | 63.1 | 79.0 | 58.8 | 56.1 | 58.3 | 71.3 | 44.9 | 66.3 | 74.7 | 71.0 | 72.4 |
| GLC | 13.0 | 12.9 | 12.6 | 12.9 | 11.5 | 13.3 | 11.8 | 11.9 | 10.7 | 13.6 | 11.0 | 11.4 | 12.1 | 12.6 | 11.5 |
| MAL | 42.5 | 39.0 | 43.9 | 40.2 | 34.7 | 46.2 | 30.8 | 28.2 | 32.0 | 39.1 | 20.7 | 37.7 | 44.2 | 40.7 | 43.0 |
| MLT | 12.0 | 12.3 | 12.6 | 12.1 | 11.5 | 12.3 | 11.1 | 10.6 | 10.8 | 12.6 | 9.1 | 11.7 | 12.0 | 11.8 | 11.9 |
| FRC | 7.0 | 5.6 | 6.1 | 5.8 | 5.4 | 7.2 | 5.0 | 5.3 | 4.8 | 6.0 | 4.0 | 5.5 | 6.4 | 5.8 | 6.0 |
| NFE (% TE) | 25.6 | 30.2 | 24.8 | 28.9 | 36.9 | 21.0 | 41.2 | 43.9 | 41.7 | 28.7 | 55.1 | 33.7 | 25.3 | 29.0 | 27.6 |
| DP4+ | 15.5 | 16.8 | 12.8 | 16.3 | 22.4 | 14.5 | 23.8 | 25.6 | 22.9 | 14.3 | 30.3 | 19.0 | 16.1 | 14.8 | 16.8 |
| NC | 10.0 | 13.3 | 11.9 | 12.6 | 14.5 | 6.5 | 17.4 | 18.4 | 18.8 | 14.3 | 24.9 | 14.7 | 9.2 | 14.2 | 10.8 |
Six replicates were evaluated for the center point (C00), with triplicates evaluated for all factorial-point conditions (C01–C08) with the exception of C02, for which one replicate was omitted (M02) due to pH deviation. The axial-point conditions (C09–C14) were evaluated in singlet.
Table 4.
Compiled response model fit statistics.
| Response | Model Fit | LOF | Mean | StDev | CV | R2 | Adj. R2 | Pred. R2 | Adeq. Prec. |
|---|---|---|---|---|---|---|---|---|---|
| YTE (% GW) | p < 0.0001 | p = 0.4443 | 81.11% | 1.30% | 1.60% | 0.728 | 0.670 | 0.587 | 12.861 |
| YFE | p < 0.0001 | p = 0.0907 | 54.69% | 1.52% | 2.77% | 0.954 | 0.944 | 0.926 | 37.131 |
| YNFE | p < 0.0001 | p = 0.8920 | 26.41% | 1.73% | 6.54% | 0.954 | 0.943 | 0.928 | 34.386 |
| FE (% TE) | p < 0.0001 | p = 0.6965 | 67.53% | 1.92% | 2.84% | 0.959 | 0.949 | 0.936 | 36.574 |
| GLC | p = 0.0002 | p = 0.7222 | 12.28% | 0.78% | 6.34% | 0.517 | 0.452 | 0.366 | 8.886 |
| MAL | p < 0.0001 | p = 0.3874 | 37.73% | 1.04% | 2.77% | 0.979 | 0.973 | 0.960 | 53.156 |
| MLT | p < 0.0001 | p = 0.8313 | 11.65% | 0.44% | 3.80% | 0.750 | 0.717 | 0.650 | 16.196 |
| FRC | p < 0.0001 | p = 0.6234 | 5.86% | 0.64% | 10.98% | 0.669 | 0.584 | 0.501 | 9.467 |
| NFE (% TE) | p < 0.0001 | p = 0.6965 | 32.47% | 1.92% | 5.91% | 0.959 | 0.949 | 0.936 | 36.574 |
| DP4+ | p < 0.0001 | p = 0.3097 | 18.77% | 1.37% | 7.30% | 0.931 | 0.913 | 0.887 | 26.208 |
| NC | p < 0.0001 | p = 0.4959 | 13.70% | 2.51% | 18.29% | 0.743 | 0.698 | 0.631 | 16.876 |
© 2020 by the authors. Licensee MDPI, Basel, Switzerland. This article is an open access article distributed under the terms and conditions of the Creative Commons Attribution (CC BY) license (http://creativecommons.org/licenses/by/4.0/).
Share and Cite
MDPI and ACS Style
Saarni, A.; Miller, K.V.; Block, D.E. A Multi-Parameter, Predictive Model of Starch Hydrolysis in Barley Beer Mashes. Beverages 2020, 6, 60. https://0-doi-org.brum.beds.ac.uk/10.3390/beverages6040060
AMA Style
Saarni A, Miller KV, Block DE. A Multi-Parameter, Predictive Model of Starch Hydrolysis in Barley Beer Mashes. Beverages. 2020; 6(4):60. https://0-doi-org.brum.beds.ac.uk/10.3390/beverages6040060
Chicago/Turabian StyleSaarni, Andrew, Konrad V. Miller, and David E. Block. 2020. "A Multi-Parameter, Predictive Model of Starch Hydrolysis in Barley Beer Mashes" Beverages 6, no. 4: 60. https://0-doi-org.brum.beds.ac.uk/10.3390/beverages6040060
Note that from the first issue of 2016, this journal uses article numbers instead of page numbers. See further details here.