Article

The Influence of Bottle Design on Perceived Quality of Beer: A Conjoint Analytic Study

SDU Innovation and Design Engineering, Department of Technology and Innovation, University of Southern Denmark, Campusvej 55, 5230 Odense, Denmark
*
Author to whom correspondence should be addressed.
Submission received: 22 September 2020 / Revised: 27 October 2020 / Accepted: 3 November 2020 / Published: 10 November 2020
(This article belongs to the Special Issue Beer Quality and Flavour)

Abstract

:
Research on the influence of packaging on consumer perception of beer and other alcoholic beverages suggest an important role in capturing consumers’ attention and generating expectations on perceived product quality, and in particular that color, bottle shape, and label design are key aspects. There is, however, a paucity of research looking at interactions between different aspects of packaging design. This is a topical issue given an increasingly saturated market where especially craft breweries strive for differentiation and brand recognition. Situated within this context, the present research used a conjoint analytic approach to investigate the effect of packaging design on consumer perceived quality and liking for beers. Beer images were designed to systematically vary in four design factors—label color, label shape, label complexity, and bottle shape—and evaluated in an online survey with a representative sample of Danish beer drinkers. Two of the design factors—label color and bottle type—significantly affected consumers’ product evaluations, whereas the other two factors did not. Post-hoc analyses of the main effects indicated that the combination of a “Bomber” bottle shape and a warm color scheme in the label as the optimal combination of design factors to maximize consumer preferences. Preference for the Bomber bottle was linked to a perceived premiumness associated with a preference for curvatures (as opposed to angularity), whereas the preference for warm colors was tentatively explained as due to crossmodal correspondences generating favorable sensory expectations for this color scheme.

1. Introduction

Beer is the most consumed alcoholic beverage worldwide [1]. In Denmark, as in most European countries, the beer market has profoundly changed in the last 10–15 years [2,3]. A striking resurgence of craft breweries has marked a breakaway from product uniformity to an unprecedented availability of beers with unique flavor profiles [2]. According to the Danish Brewer’s Association, the number of breweries in the country has grown from 19 in to 120 in the last decade, while the market share of craft and micro brewed beers has grown from 0.5% to 4.5% in the same period [4]. These craft breweries or microbreweries have strongly differentiated themselves from large breweries by having a strong product focus where flavor intensity, experimentation, and local identity are key characteristics [5,6,7,8,9,10].
Although craft beer is often assumed to be of higher quality than conventional beer, and would therefore be expected to command a higher price, it is not safe to assume that all consumers perceive this to be the case. In other common beverages such as coffee and wine, for example, a mismatch between experts’ opinions of what constitutes quality is often reported (e.g., [11,12]). Moreover, consumers and experts probably do not attend to the same aspects in a beer [13,14,15,16], and would likely be more driven by emotional associations with the packaging than by a deep processing of all its elements.
Research on the role of packaging appearance on consumer perception of food and beverages indicates that packaging features play an important role in capturing attention and generating expectations on perceived quality (e.g., [17]). The packaging as a factor in consumer decision-making for beer specifically is a relatively unexplored topic, although there is evidence of a relation between the beer color and sensory expectations and perceived price [18] and on the sensory perception of the bottles [6]. There also appears to be a relationship between the appearance of beer bottles and the perceived contents, which can create expectations of the flavor, taste, kinetic sense and sound, as well as playing a role in brand differentiation and recognition [8]. In actual taste tests, the labeling on beers has also been shown to influence perceived taste, flavor, quality, and purchase intent [19]. The type of packaging for beers, such as the difference between aluminum cans, glass bottles, and plastic bottles has also been shown to have an effect on the preference from customers, with one study showing that it may be more important than product information such as price, flavor, claims, and color [20].
Research within other beverages categories can provide insights into the possible packaging design factors which could be expected to affect consumer perception of quality and liking for beers. For instance, research on wine has shown that both the type/shape of the bottle along with color of the bottle itself affect expected quality, liking, and willingness to pay [21]. In addition, for wine, differences in label shapes have been reported to affect consumer preferences, such as in a study conducted in Spain reporting significant differences in preference of bottles containing specific shapes on the labels, and especially for selected color-shape label combinations in wine bottles [22]. For ciders, the color of the label has been found to influence expected flavor liking, suggesting that label color can have a high influence on the perceived contents for alcoholic beverages [23].
To summarize, the available literature indicates that various factors in packaging and label design can be expected to have an effect for alcoholic beverages, and in particular that color, bottle shape, and label design are key aspects to consider. As a whole, however, research on the relation between perceived quality and consumer perception of beer specifically is scant. There is especially a paucity of research looking at interactions between such factors in determining consumer preferences with an aim to identify optimal combinations of design aspects to maximize consumer preferences. Situated within this context, the aim of the present paper is to present results of a conjoint analytic study [24] addressing main and interaction effects of specific packaging design factors on consumer perceived quality and liking for beers.

2. Materials and Methods

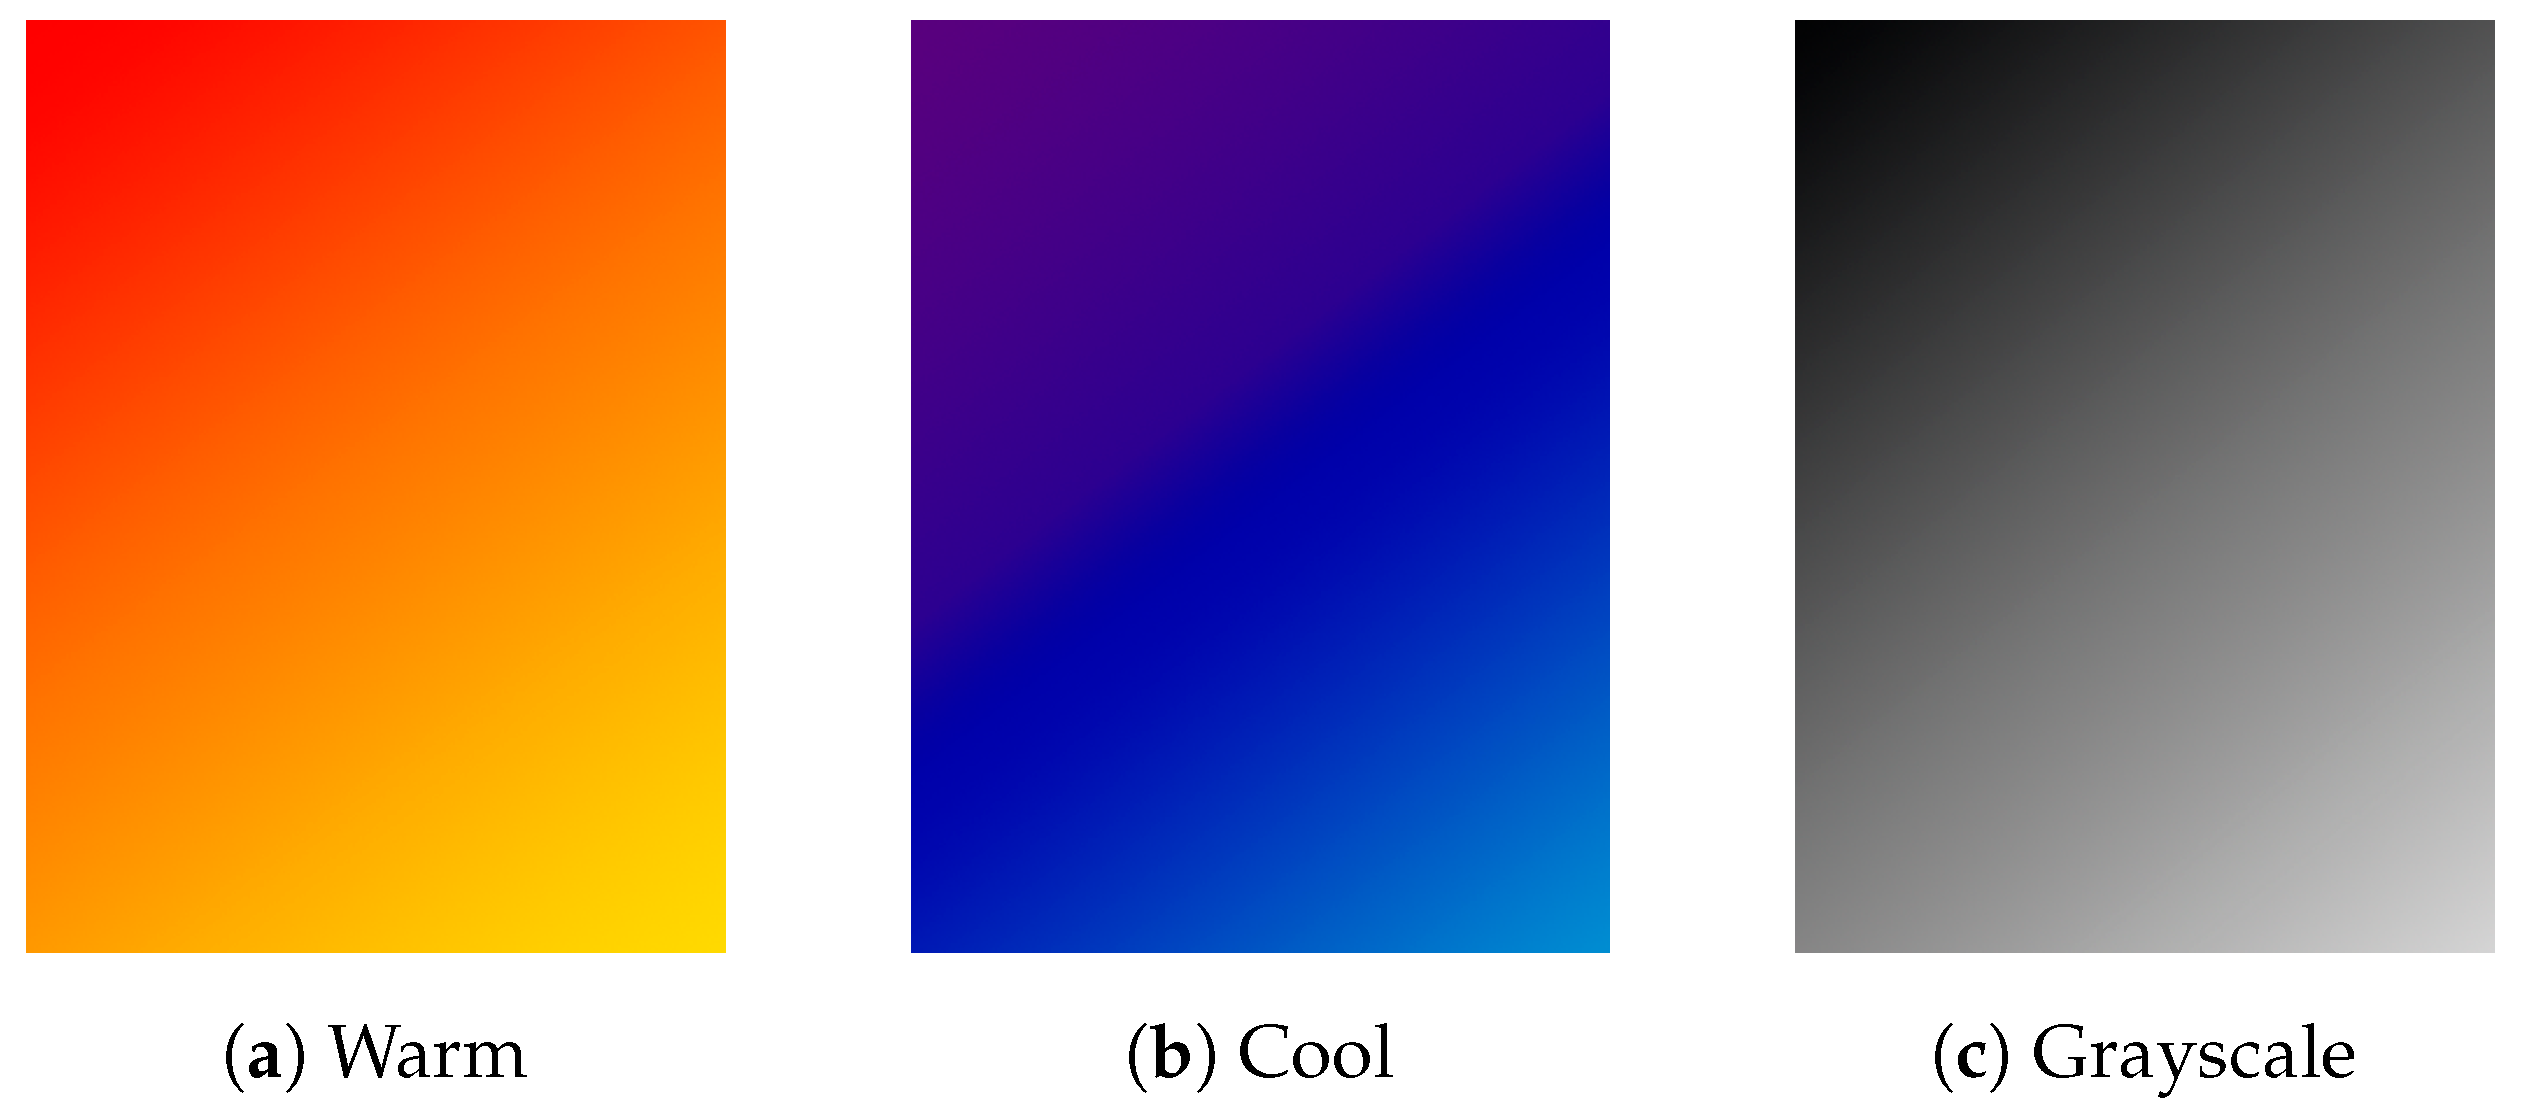
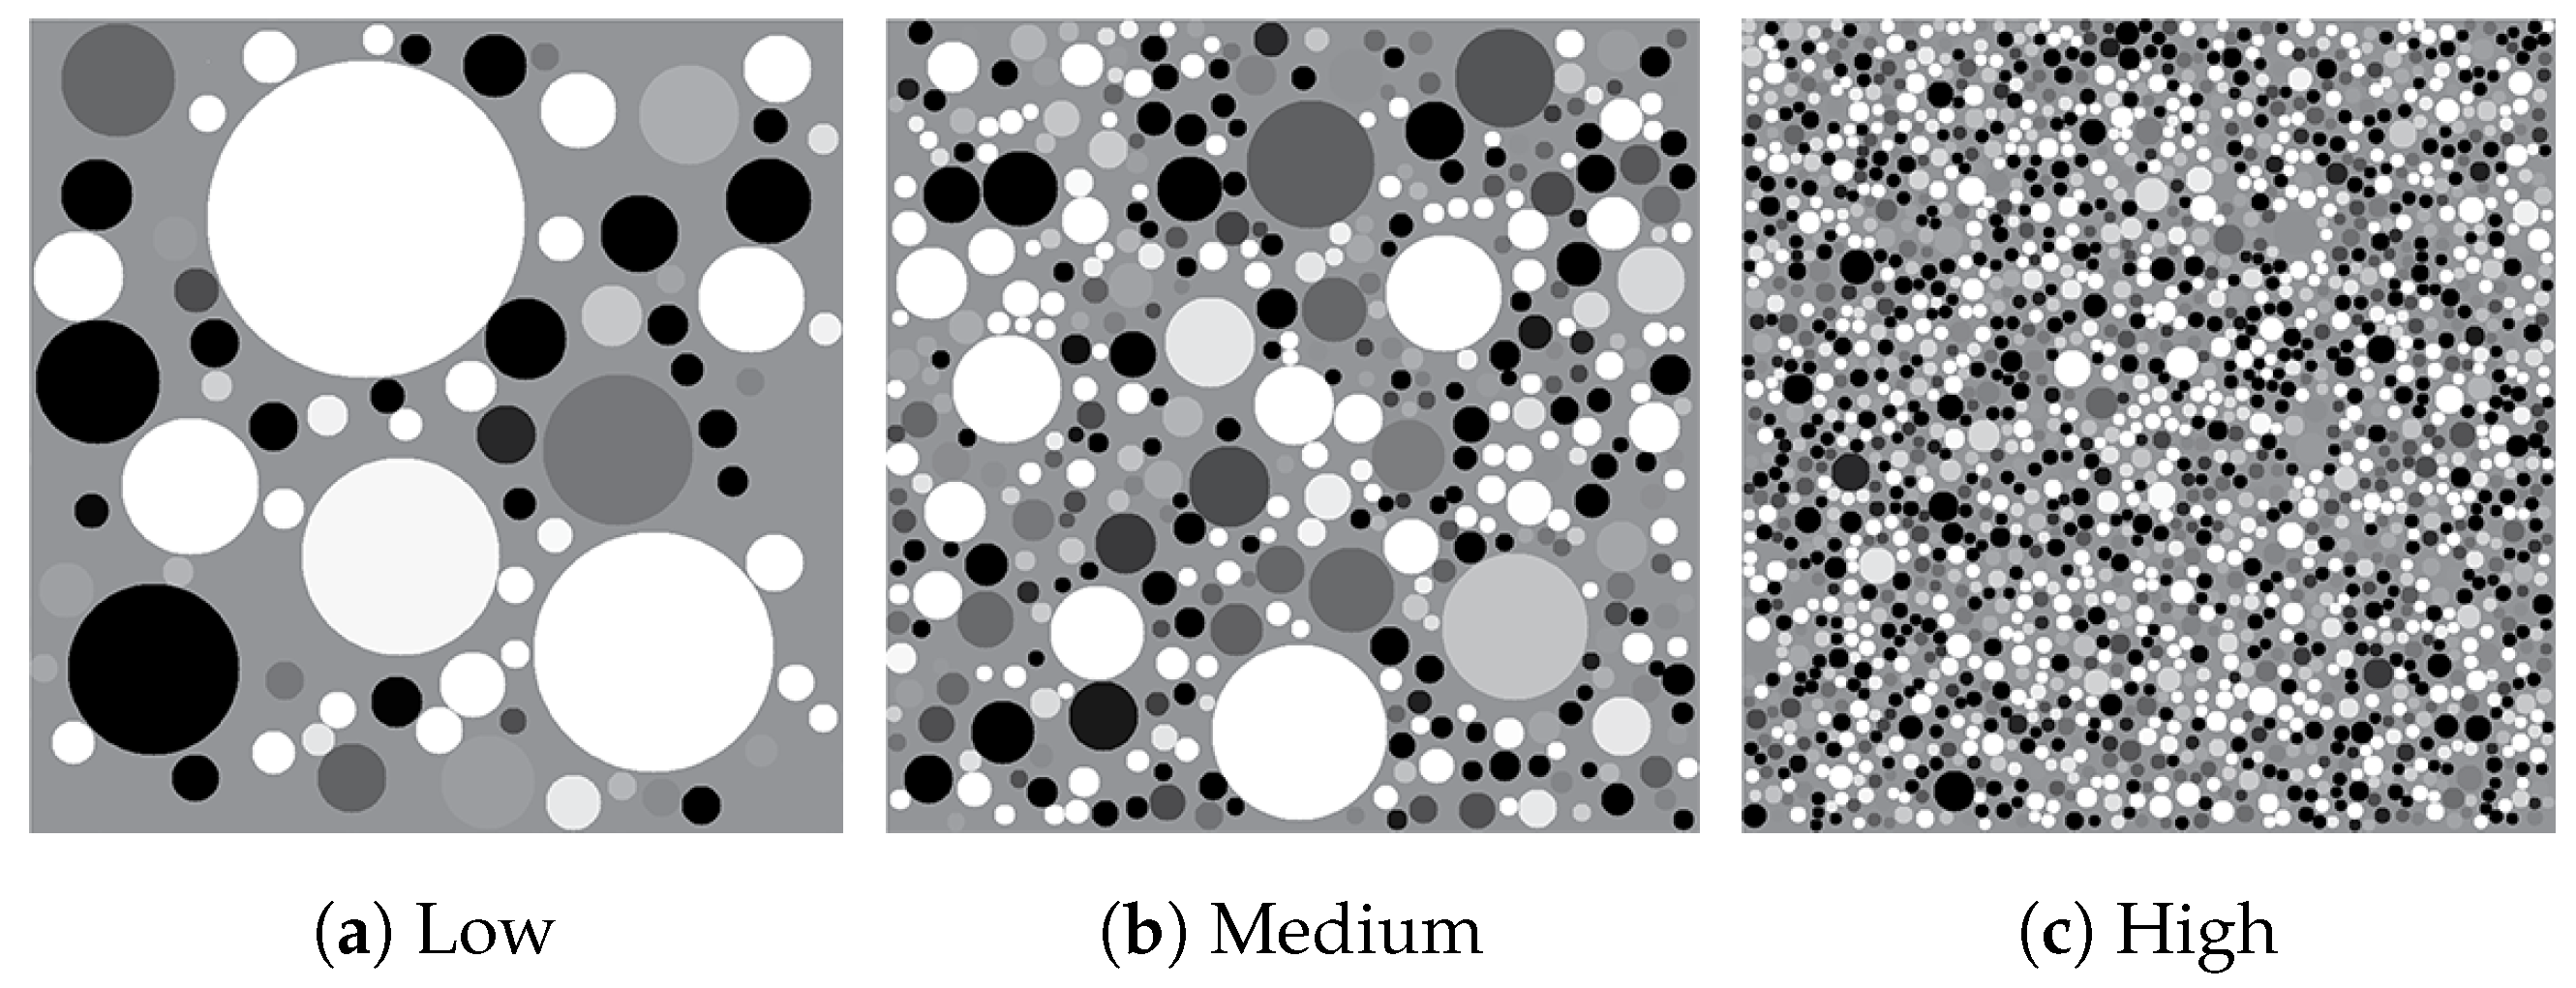
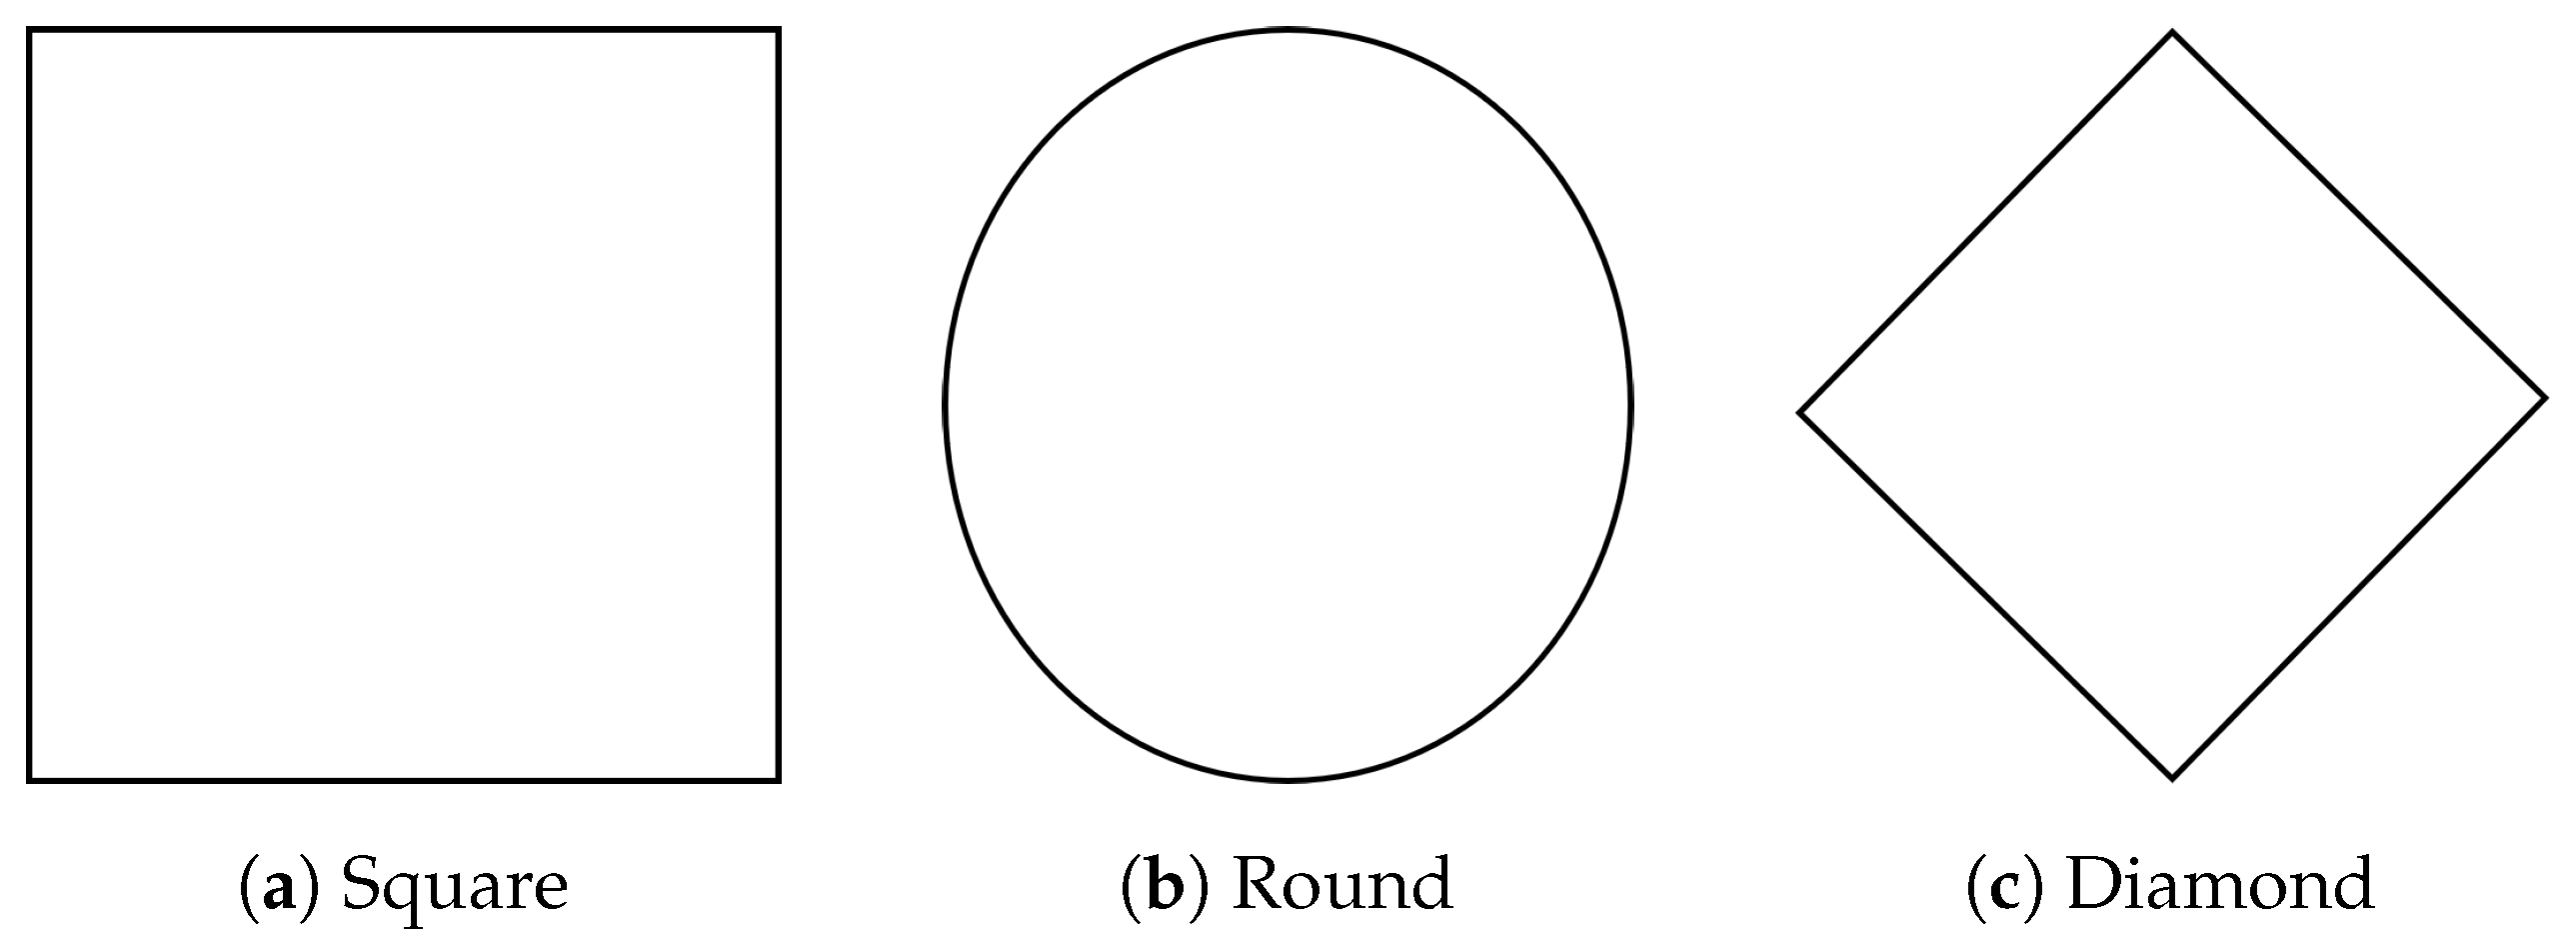
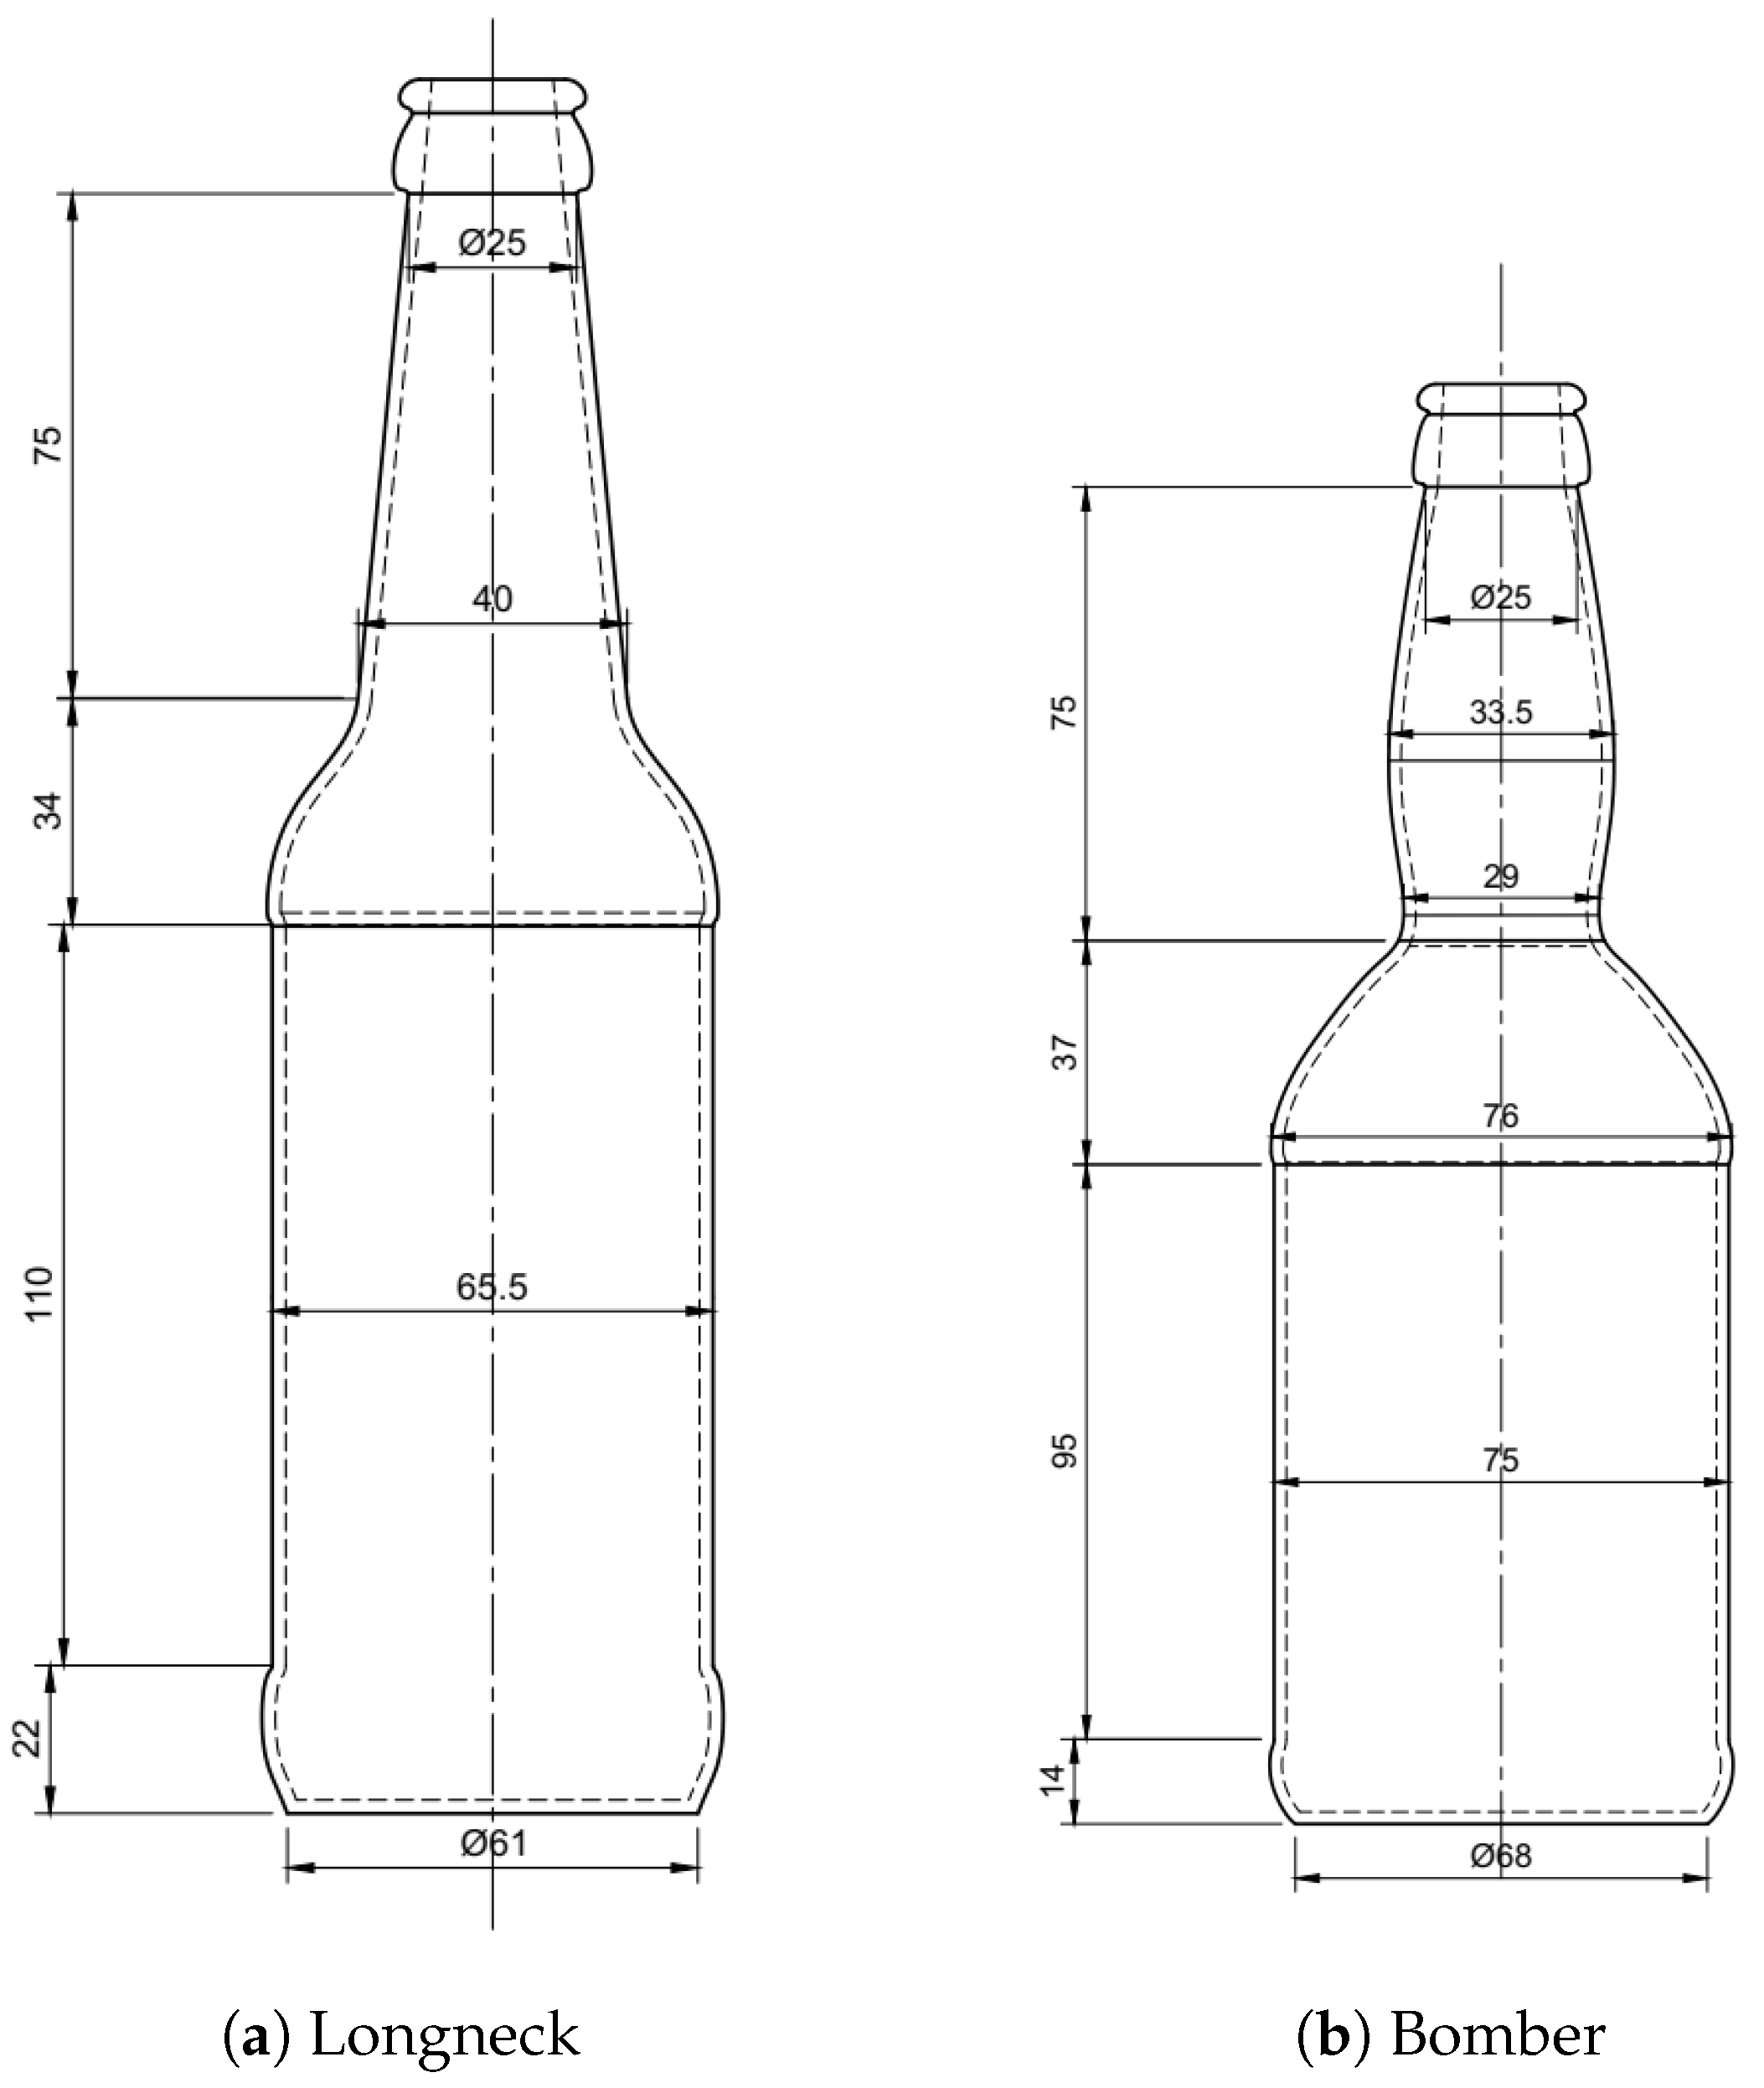
2.1. Experimental Design

To address the research aims, 54 beer images were created in Adobe Photoshop, following a 3 × 3 × 3 × 2 full factorial design, to systematically vary in color (3 levels: Warm, Cool, Greyscale), complexity (3 levels: Low, Medium, High), label shape (3 levels: Square, Round, Diamond), and bottle shape (2 levels: Longneck, Bomber).
The four factors were identified based on the literature reviewed in the previous section, and because they were deemed to represent the most salient aspects from a consumer’s point of view. The choice of specific levels within the factors was driven by a mix of theoretical and practical considerations related to the total number of combinations to develop. Color levels (Figure 1) were chosen to represent a broad spectrum of colors following similarly motivated research in packaging design [25]. Complexity was included as it has been linked to consumer preference for beers in taste tests [26] and is generally known to affect preference for visual objects [27]. Moreover, it was deemed interesting to include complexity since visual identity of specialty beer is a key aspect of current product differentiation in the beer market (e.g., through pictures, shapes and various designs printed onto the label without any direct semantic value). The three levels for this factor (Figure 2) were selected based on a recent neuroscience study on the appeal of abstract shapes, which showed a difference in liking based on complexity as operationalized through the use of various fractal patterns [28]. The three levels for labels shape (Figure 3) and the two levels for bottle shape (Figure 4) were chosen as the most typical for the Danish beer market (based on the authors’ observations). The two bottle shapes are colloquially referred to as “Longneck” and “Bomber”, throughout the paper, although it should be noted that these are not standard definitions. To avoid ambiguity, direct measurements from actual bottles were made with a calipers and recreated within Fusion 360 (Autodesk, San Rafael, CA, USA, v. 2.0.8624) by the authors (Figure 4).
An example of a beer image developed based on the experimental design, as evaluated by the participants of the study, is given in Figure 5. The full list of images is available as Supplementary Materials to this paper.

2.2. Participants

Participants for the study were recruited by snowball sampling via the authors’ network and social media. The only inclusion criterion included being of legal drinking age (18 in Denmark), and the only reason for exclusion was if participants declared that they never drink beer. Some background information pertaining to their demographics and beer consumption habits were collected during the study and are given in Table 1. The total number of participants was 310 (after exclusion of non-drinkers and incomplete responses). The sample had a very good balance in terms of gender, and a relative majority of young individuals (18–25). Most participants stated that they drink less than 10 different beer products per months, with grocery stores and bars being the most popular options for purchasing beers (Table 1).

2.3. Procedures

The study was conducted as an online survey using the platform SurveyXact (Ramboll, Århus, Denmark). In order to minimize burden for the participants, each participant evaluated a subset of 12 images, which was deemed reasonable based on pilot testing. More specifically, Federov’s exchange algorithm [29] was employed to reduce the full set of 54 images to multiple sets of 12 images, to which each participants were randomly assigned upon clicking on the survey link. The survey was anonymous and consumers took part on a voluntary basis.
The survey began by explaining information about the general aim of the research, the requirements for participation (i.e., that they should be of legal age), and an explanation of the survey setup. Consumers were informed that their participation was voluntary that they could withdraw at any time, and that the data collected were solely used for the purpose of this research. They then proceed to complete a few questions about their basic demographic and beer consumption habits (Table 1).
This was followed by the actual conjoint analysis part, which required consumers to evaluate 12 images of beer bottles (50 cl), presented monadically. For each image, participants were asked three questions: (1) “How much do you like the appearance of this bottle?”, (2) “How good do you expect the quality of the beer inside the bottle to be?”, and (3) “How expensive do you expect this bottle to be in a grocery store? (in DKK)”. The first two questions were rated on a 10-point rating scale, anchored at “0 = Very low” and “10 = Very high”. The third question required participants to manually enter the expected price in a numerical entry box.
After evaluating all images, participants were thanked for their time and were given the option of adding their email for a chance to win a movie ticket as a thank you for their participation.

2.4. Data Analysis

The snowball sampling technique adopted resulted in 513 participants, 310 (60%) of which fully completed the survey in all its part and were therefore retained for data analysis.
The data analytical strategy was directly informed by the main research objective of addressing the effect of the four design factors (in isolation as well as in combination) on consumer perception of the beers. To this end, Analysis of Variance (ANOVA) was used to estimate main and interaction (2- and 3-way) effects of each design factor on the three dependent variables. Where significant effects were found, pairwise comparisons using Tukey’s Honestly Significant Difference (HSD) test were conducted to ascertain which design levels or level combinations differed from each other. Furthermore, the (Pearson) correlation coefficient between liking, expected quality and expected price, were computed to evaluate the degree to which the three dependent variable underlined the same perceptual dimension. Additional analyses included assessing the effect of consumer background on the three dependent variables.
All analyses were conducted in R [30] and considered an α = 5 % significance level.

3. Results

ANOVA results (main effects and interactions) for the three dependent variables—liking, expected quality, and expected price—are given in Table 2.
A significant main effect of bottle shape on both quality and price was found, as well as a significant effect of color on all three dependent variable. By contrast, the effects of visual complexity and label shape were not significant. All 2- and 3-way interactions were not significant either (Table 2). The directions of these effects are visible in Table 3, which reports means and standard deviations for individual levels of each design factor, as well as which means are significantly different after pairwise comparisons.
Table 2 shows that the magnitude of the differences was generally small (≤0.4 pt on a 10 pt scale for liking, ≤0.3 pt on a 10 pt scale for quality, and ≤2 DKK for price). The main effect of bottle shape was due to the "Bomber" shape being perceived as significantly of higher quality, and expected to be more expensive, than the Bottleneck type (see Figure 4 for the corresponding bottle shapes). Regarding the main effect of color, warm color received significantly higher ratings in liking, quality, and price (Table 3), although for the latter the difference with the other two levels was only marginally significant after adjusting for multiple comparisons (Tukey p = 0.08 in both cases). Level means for the other two design aspects (complexity and label shape) were very close or identical consistent with the fact that these two main effects were not significant.
The results for color and bottle type suggest that when a level was evaluated as more liked, it was also perceived to be of higher quality and more expensive. Accordingly, visual attractiveness (liking for the bottle) and expected quality were highly correlated ( r ( 3706 ) = 0.82 ; p < 0.001 ). Somewhat surprisingly, however, expected price was only moderately correlated with quality ( r ( 3706 ) = 0.38 ; p < 0.001 ) and liking ( r ( 3706 ) = 0.30 ; p < 0.001 ).
With respect to consumer segmentation, a significant gender difference was observed with respect to perceived liking and quality, with men giving higher ratings, on average, in both cases ( L i k i n g F = 4.4 < L i k i n g M = 4.7 , F ( 1 , 3706 ) = 26.6 , p < 0.001 ; Q u a l i t y F = 4.5 < Q u a l i t y M = 4.8 , F ( 1 , 3706 ) = 20.5 , p < 0.001 ); by contrast, no significant differences with respect to price estimates were observed. These results suggest a higher interest towards beer by men, compared to women, and, accordingly, men also reported drinking on average more beers per month ( 18.4 vs. 7.2 for women, F ( 1 , 3706 ) = 641 , p < 0.001 ) and were more interested in trying new beers ( 4.2 vs. 3.8 on a 5-pt scale, F ( 1 , 3706 ) = 145 , p < 0.001 ) compared to women.
By contrast, differences due to all other background variables (e.g., age, income, etc.—see Table 1) were very small and transient, and were generally not significant.

4. Discussion

The primary goal of this research was to investigate the effect of design aspects of beer bottles on consumers’ liking and expectations regarding product quality, using a conjoint analytic approach.
The results showed that two of the experimental design factors—label color and bottle type—significantly affected consumer responses, whereas the other two—label shape and complexity—did not. More specifically, the conjoint analysis indicated that the combination of the “Bomber” bottle shape and a warm color scheme in the label would the optimal combination of design factors that would maximize consumer utility, whereas label shape and complexity did not affect consumer preferences significantly (at least within the conditions tested in this study). Since craft breweries currently strive for differentiation and brand recognition in an increasingly saturated market [2,3], such knowledge can be of practical business significance, either for redesigning existing product lines or (more likely) for the design of new ones.
The finding that bottle type had a significant influence is consistent with previous studies showing its importance for consumer perception of both beer and wine [8,21,22]. While causal inferences about the findings do not necessarily follow from the data, the finding that the Bomber type was preferred may possibly be ascribed to it having a more pronounced curvatures and an overall higher feature count than the longneck design. This would be consistent with work in visual perception showing a preference for curved objects more than angular ones, as well as preference for objects with more sides [31]. It is also possible to speculate that this result underlines a perceived “premiumness” associated with this bottle type. For example, in a study with New Zealand consumers, Giacalone and collaborators [5] showed that beers with this bottle type shape tended to be regarded as more appropriate for drinking at dining events and special occasions, relative to other types of beer bottles. With such a high importance placed on the bottle type, further exploration into differing bottle types and consumer perception in relation to the craft beer industry may be of interest.
In addition, the effect of color is consistent with earlier reports in the literature, where it is often claimed that color is possibly the packaging feature of beverages that triggers the fastest consumer response [32,33]. None of the three design levels for this factor (warm, cool, dark/grey) is dominant in the market, so it is unlikely that the results are due to a preference for the familiar. Another possibility is that the observed preference for warm colors in beer labels could be due to sensory expectations, such as associations between this color scheme and fruity flavors, which has been observed in previous studies on consumer packaging of various foods and beverages [6,8,19,23,25]. Extant research on crossmodal correspondence between color and flavor also supports an association between warm colors and fruity flavors (e.g., [34,35]), which could be exploited by breweries as these flavors are often associated with hops notes typically prominent in craft beers. It should be noted, however, that this interpretation does not follow directly from the data and that sensory testing would be required to support causal inferences regarding the effect of label color on beer flavor. A deeper understanding of this mechanism could provide valuable information for breweries as the costs of changing product labels to influence product experiences are typically lower than the costs of reformulating the product.
The lack of effect of label shape, by contrast, was more unexpected in relation to the existing literature, as this factor has been shown to influence consumer perception of wine [21,22]. It is possible that the design levels for this factor were too similar, and that a significant effect would have been observed by introducing a larger degree of variation, for example, by using label shapes not commonly associated with beers.
Likewise, complexity was not found to affect consumer perception in this study, whereas an effect could have been expected based on evidence from experimental psychology [27] and neuroscience [19], as well as the fact that perceived complexity has also found to affect consumer perception of tasted beers [26]. The choice of focusing on neuroscientifically defined visual complexity patterns (Figure 2) was motivated by the need to have a relatively objective basis for this design factor. However, given that visual complexity perception is highly context-dependent [36], it is likely that abstract patterns on a familiar object such as beer bottle are perceived as less complex than they would be in isolation. That said, an effect might still be uncovered by, for instance, the use of different artwork designs, which may be typically observed on craft beer labels. The research of labels artwork for beers is still a relatively unexplored field, but it is of increasing interest for beverage packaging research, as recently emphasized in the literature [37].
While not the primary goal of this study, the data also showed some notable differences between consumer segments defined in terms of demographics and behavior. Specifically, men were found to have a higher interest and a much higher overall consumption for beer, compared to women. This is well in line with the literature indicating a higher intake of beer, and of alcohol generally, in men, both in Denmark as well as elsewhere [38,39].
In closing, we note some limitations of this study which could productively be addressed in future research. First, the study was limited to visual examination of the product designs. It would be interesting in future studies to study the combination packaging elements and actual product tasting to see how much expectations generated by the beer bottles affect the actual product experience, as exemplified in e.g., [32,35]. Secondly, design aspects were broadly defined in this research but due to practical limitations, only two to three design levels for each factor could be tested. In an industrial context, proper design optimization would require testing of additional levels within each of the design factors. An important example is the color of the bottle itself: in this research, only brown glass bottles were considered as this is by far the most common glass color for craft beer products in Denmark (this is mostly because, compared to green and clear bottle, they offer better protection against light and thus prevents photoisomerization of iso-alpha bitter acids preset in beer and the formation of ’skunky’ flavor [40]), so whether these results also extend to clear and green glass bottles is a question of commercial importance. Thirdly, this research has not considered the effect of additional product aspects such as brand and price points; since these are often used by consumers as quality cues, it would be important to study how they interact with the design factors studied in this research. Fourthly, further exploration of individual differences would be advised to more completely characterize beer consumers. Based on the results of this research, as well as the available literature [5,26], it is suggested that segmentation based on behavioral habits such as beer knowledge and involvement would be promising candidates for consumer segmentation. Finally, the study was conducted with a sample of Danish consumers and, therefore, results may not readily generalize to consumers in other countries, given the known influence of culture on associations between packaging elements and quality attributes (e.g., with regard to the influence of color [37,41]).

5. Conclusions

The present research focused on the effect of packaging design on consumers’ perceived quality and liking for beers. Using a conjoint analytic approach, beer images were designed to systematically vary in four design factors—label color, label shape, label complexity, and bottle shape—and evaluated by consumers in an online survey with a representative sample of Danish beer drinkers. The results showed that two of the packaging design factors—label color and bottle type—had a main effect on consumer product evaluations, whereas the other two factors did not, and no significant interactions were found. Post-hoc analyses of the main effects indicated that the combination of a “Bomber” bottle shape and a warm color scheme in the label as the optimal combination of design factors that would maximize consumer preferences. Preference for the Bomber bottle was linked to a perceived premiumness associated with a preference for curvatures (as opposed to angularity), whereas the preference for warm colors was tentatively explained as due to crossmodal correspondences generating favorable sensory expectations for this color scheme. Since craft breweries currently strive for differentiation and brand recognition in an increasingly saturated market, the results presented can be of practical business significance, either for redesigning existing product lines or for the design of new ones.

Supplementary Materials

High quality images of all 54 designs used for the conjoint analysis are available online at https://0-www-mdpi-com.brum.beds.ac.uk/2306-5710/6/4/64/s1.

Author Contributions

Conceptualization, S.G. and D.G.; methodology, All; software, S.G. and D.G.; formal analysis, All; investigation, All; data curation, S.G. and D.G.; writing—original draft preparation, S.G. and D.G.; writing—review and editing, D.G.; visualization, S.G. and D.G.; supervision, D.G. All authors have read and agreed to the published version of the manuscript.

Funding

This research received no external funding.

Conflicts of Interest

The authors declare no conflict of interest.

References

  1. Meyerding, S.G.; Bauchrowitz, A.; Lehberger, M. Consumer preferences for beer attributes in Germany: A conjoint and latent class approach. J. Retail. Consum. Serv. 2019, 47, 229–240. [Google Scholar] [CrossRef]
  2. Giacalone, D. Consumers’ Perception of Novel Beers: Sensory, Affective, and Cognitive-Contextual Aspects; Department of Food Science, University of Copenhagen: Copenhagen, Denmark, 2013. [Google Scholar]
  3. Mejlholm, O.; Martens, M. Beer identity in Denmark. Food Qual. Prefer. 2006, 17, 108–115. [Google Scholar] [CrossRef]
  4. Bryggeriforeningen. Tal om øl. Available online: https://bryggeriforeningen.dk/tal/oel/ (accessed on 6 June 2020).
  5. Giacalone, D.; Frøst, M.B.; Bredie, W.L.; Pineau, B.; Hunter, D.C.; Paisley, A.G.; Beresford, M.K.; Jaeger, S.R. Situational appropriateness of beer is influenced by product familiarity. Food Qual. Prefer. 2015, 39, 16–27. [Google Scholar] [CrossRef]
  6. Sester, C.; Dacremont, C.; Deroy, O.; Valentin, D. Investigating consumers’ representations of beers through a free association task: A comparison between packaging and blind conditions. Food Qual. Prefer. 2013, 28, 475–483. [Google Scholar] [CrossRef]
  7. Donadini, G.; Porretta, S. Uncovering patterns of consumers’ interest for beer: A case study with craft beers. Food Res. Int. 2017, 91, 183–198. [Google Scholar] [CrossRef] [PubMed]
  8. Fenko, A.; Heiltjes, S.; van den Berg-Weitzel, L. Towards a sensory congruent beer bottle: Consumer associations between beer brands, flavors, and bottle designs. In Proceedings of DRS2016: Design+ Research+ Society-Future-Focused Thinking; Design Research Society: Brighton, UK, 2016. [Google Scholar]
  9. Muggah, E.M.; McSweeney, M.B. Females’ attitude and preference for beer: A conjoint analysis study. Int. J. Food Sci. Technol. 2017, 52, 808–816. [Google Scholar] [CrossRef]
  10. Wheeler, B.; Braun, M.J. Package ‘AlgDesign’. Available online: https://cran.r-project.org/web/packages/AlgDesign/ (accessed on 9 November 2020).
  11. Giacalone, D.; Fosgaard, T.R.; Steen, I.; Münchow, M. Quality does not sell itself: Divergence between ‘objective’product quality and preference for coffee in naïve consumers. Br. Food J. 2016, 118, 2462–2474. [Google Scholar] [CrossRef]
  12. Schiefer, J.; Fischer, C. The gap between wine expert ratings and consumer preferences. Int. J. Wine Bus. Res. 2008, 20, 335–351. [Google Scholar] [CrossRef]
  13. Giacalone, D.; Ribeiro, L.M.; Frøst, M.B. Consumer-based product profiling: Application of partial napping® for sensory characterization of specialty beers by novices and experts. J. Food Prod. Mark. 2013, 19, 201–218. [Google Scholar] [CrossRef]
  14. Giacalone, D.; Ribeiro, L.M.; Frøst, M.B. Perception and description of premium beers by panels with different degrees of product expertise. Beverages 2016, 2, 5. [Google Scholar] [CrossRef] [Green Version]
  15. Guinard, J.X.; Uotani, B.; Mazzucchelli, R.; Taguchi, A.; Masuoka, S.; Fujino, S. Consumer testing of commercial lager beers in blind versus informed conditions: Relation with descriptive analysis and expert quality ratings. J. Inst. Brew. 2000, 106, 11–20. [Google Scholar] [CrossRef]
  16. Aquilani, B.; Laureti, T.; Poponi, S.; Secondi, L. Beer choice and consumption determinants when craft beers are tasted: An exploratory study of consumer preferences. Food Qual. Prefer. 2015, 41, 214–224. [Google Scholar] [CrossRef]
  17. Nørgaard Olesen, S.; Giacalone, D. The influence of packaging on consumers’ quality perception of carrots. J. Sens. Stud. 2018, 33, e12310. [Google Scholar] [CrossRef]
  18. Carvalho, F.R.; Moors, P.; Wagemans, J.; Spence, C. The influence of color on the consumer’s experience of beer. Front. Psychol. 2017, 8, 2205. [Google Scholar] [CrossRef] [PubMed]
  19. Barnett, A.; Spence, C. Assessing the effect of changing a bottled beer label on taste ratings. Nutr. Food Technol. Open Access 2016, 2, 4. [Google Scholar]
  20. Porretta, S.; Donadini, G. A preference study for no alcohol beer in Italy using quantitative concept analysis. J. Inst. Brew. 2008, 114, 315–321. [Google Scholar] [CrossRef]
  21. Puyares, V.; Ares, G.; Carrau, F. Searching a specific bottle for Tannat wine using a check-all-that apply question and conjoint analysis. Food Qual. Prefer. 2010, 21, 684–691. [Google Scholar] [CrossRef]
  22. De Mello, L.; Pires, R. Message on the Bottle: Colours and Shapes of Wine Labels; Working Paper 53885; American Association of Wine Economists: New York, NY, USA, 2009. [Google Scholar]
  23. Sugrue, M.; Dando, R. Cross-modal influence of colour from product and packaging alters perceived flavor of cider. J. Inst. Brew. 2018, 124, 254–260. [Google Scholar] [CrossRef] [Green Version]
  24. Moskowitz, H.R.; Silcher, M. The applications of conjoint analysis and their possible uses in Sensometrics. Food Qual. Prefer. 2006, 17, 145–165. [Google Scholar] [CrossRef]
  25. Rebollar, R.; Lidón, I.; Serrano, A.; Martín, J.; Fernández, M.J. Influence of chewing gum packaging design on consumer expectation and willingness to buy. An analysis of functional, sensory and experience attributes. Food Qual. Prefer. 2012, 24, 162–170. [Google Scholar] [CrossRef]
  26. Giacalone, D.; Duerlund, M.; Bøegh-Petersen, J.; Bredie, W.L.; Frøst, M.B. Stimulus collative properties and consumers’ flavor preferences. Appetite 2014, 77, 20–30. [Google Scholar] [CrossRef] [PubMed]
  27. Berlyne, D.E. Novelty, complexity, and hedonic value. Percept. Psychophys. 1970, 8, 279–286. [Google Scholar] [CrossRef]
  28. Güçlütürk, Y.; Jacobs, R.H.; Lier, R. Liking versus complexity: Decomposing the inverted U-curve. Front. Hum. Neurosci. 2016, 10, 112. [Google Scholar] [CrossRef] [PubMed]
  29. Atkinson, A.; Donev, A. Optimum Experimental Designs; Clarendon Press: Oxford, UK, 1992. [Google Scholar]
  30. R Core Team. R: A Language and Environment for Statistical Computing; R Foundation for Statistical Computing: Vienna, Austria, 2013. [Google Scholar]
  31. Cotter, K.N.; Silvia, P.J.; Bertamini, M.; Palumbo, L.; Vartanian, O. Curve appeal: Exploring individual differences in preference for curved versus angular objects. i-Perception 2017, 8, 1–17. [Google Scholar] [CrossRef] [PubMed] [Green Version]
  32. Piqueras-Fiszman, B.; Spence, C. Crossmodal correspondences in product packaging. Assessing color–flavor correspondences for potato chips (crisps). Appetite 2011, 57, 753–757. [Google Scholar] [CrossRef] [PubMed]
  33. Swientek, B. Uncanny Developments. Beverage Ind. 2001, 92, 38–39. [Google Scholar]
  34. Schifferstein, H.N. The drinking experience: Cup or content? Food Qual. Prefer. 2009, 20, 268–276. [Google Scholar] [CrossRef]
  35. Piqueras-Fiszman, B.; Spence, C. The influence of the color of the cup on consumers’ perception of a hot beverage. J. Sens. Stud. 2012, 27, 324–331. [Google Scholar] [CrossRef]
  36. Orth, U.R.; Crouch, R.C. Is beauty in the aisles of the retailer? Package processing in visually complex contexts. J. Retail. 2014, 90, 524–537. [Google Scholar] [CrossRef]
  37. Velasco, C.; Spence, C. Multisensory premiumness. In Multisensory Packaging; Springer: Berlin/Heidelberg, Germany, 2019; pp. 257–286. [Google Scholar]
  38. Dawson, D.A.; Archer, L. Gender differences in alcohol consumption: Effects of measurement. Br. J. Addict. 1992, 87, 119–123. [Google Scholar] [CrossRef]
  39. Bratberg, G.H.; Wilsnack, S.C.; Wilsnack, R.; Haugland, S.H.; Krokstad, S.; Sund, E.R.; Bjørngaard, J.H. Gender differences and gender convergence in alcohol use over the past three decades (1984–2008), The HUNT Study, Norway. BMC Public Health 2016, 16, 723. [Google Scholar] [CrossRef] [PubMed] [Green Version]
  40. De Keukeleire, D.; Heyerick, A.; Huvaere, K.; Skibsted, L.H.; Andersen, M.L. Beer lightstruck flavor: The full story. Cerevisia 2008, 33, 133–144. [Google Scholar]
  41. Spence, C.; Velasco, C. On the multiple effects of packaging colour on consumer behavior and product experience in the food and beverage and home and personal care products. Food Qual. Prefer. 2018, 68, 226–237. [Google Scholar] [CrossRef]
Figure 1. Levels for design factor “Color”.
Beverages 06 00064 g001
Figure 2. Levels for design factor “Complexity”.
Beverages 06 00064 g002
Figure 3. Levels for design factor “Label shape”.
Beverages 06 00064 g003
Figure 4. Levels for design factor “Bottle Shape”. Technical drawings based on actual bottles, in units of millimeters.
Beverages 06 00064 g004
Figure 5. Example of a complete stimulus presented to the participants during the conjoint survey. Images for all possible combinations of factors and levels are given in the appendix to this paper.
Beverages 06 00064 g005
Table 1. Background information on the participants.
VariableN%
Gender
Male16151.9
Female14948.1
Age
18–2518559.7
26–356621.3
36–554313.9
56+165.2
Yearly income · 10 3 (in DKK)
<10014546.8
100–3008427.1
300–5004915.8
>500185.8
Did not wish to disclose144.5
Beers per month
<1019061.3
11–206721.6
21–30309.7
>30237.4
Beer shopping spots (last 3 months)
Groceries store26685.8
Bar22271.6
Specialty store5718.4
Tastings and beer-related event4915.8
Online82.6
1 DKK ≈ 0.15 USD. Multiple response question, percentages do not add to 100.
Table 2. ANOVA tables reporting test statistics and p-values associated with all main effects and interactions on the three dependent variable Liking, Expected quality, Expected price.
Factor (↓), Variable (→)LikingQualityPrice
FpFpFp
Bottle type1.70.19510.30.00130.1<0.001
Color12.4<0.0016.80.0013.10.044
Complexity1.40.2350.30.7640.20.837
Label shape1.60.2020.40.6390.00.979
Bottle shape × Color1.80.1672.00.1360.60.530
Bottle shape × Complexity1.90.1451.30.2700.20.796
Color × Complexity0.20.9520.50.7351.00.393
Bottle shape × Label shape0.30.7050.90.4192.90.054
Color × Label shape0.90.4710.50.7370.30.853
Complexity × Label shape0.20.9580.50.7581.40.240
Bottle shape × Color × Complexity1.60.1890.50.6901.10.335
Bottle shape × Color × Label Shape0.10.9360.00.9910.50.674
Bottle shape × Complexity × Label Shape0.80.4682.60.0720.70.519
Table 3. Means and standard deviations for individual levels of each design factor. Different superscript letters indicate significant differences between means following pairwise comparisons (Tukey p < 0.05 ).
LikingQualityPrice
Bottle Shape
Bomber 4.6 ± 2.1 4.8 a ± 2.0 20 a ± 11
Longneck 4.5 ± 2.2 4.6 b ± 2.0 18 b ± 10
Color
Cool4.5 b ± 2.2 4.6 b ± 2.0 19 ± 10
Grayscale4.4 b ± 2.2 4.6 b ± 2.0 19 ± 10
Warm4.8 a ± 2.2 4.9 a ± 2.0 20 ± 11
Complexity
Low 4.5 ± 2.2 4.7 ± 2.0 19 ± 11
Medium 4.7 ± 2.2 4.7 ± 2.0 19 ± 11
High 4.5 ± 2.2 4.7 ± 2.0 19 ± 10
Label shape
Round 4.6 ± 2.2 4.7 ± 2.0 19 ± 10
Diamond 4.5 ± 2.2 4.7 ± 2.1 19 ± 11
Rectangular 4.6 ± 2.2 4.7 ± 2.0 19 ± 11
Publisher’s Note: MDPI stays neutral with regard to jurisdictional claims in published maps and institutional affiliations.

