Article

The Effect of Roast Development Time Modulations on the Sensory Profile and Chemical Composition of the Coffee Brew as Measured by NMR and DHS-GC–MS

by
Jesper Alstrup
1,*,
Mikael Agerlin Petersen
2,
Flemming Hofmann Larsen
2 and
Morten Münchow
1
1
CoffeeMind, Hansstedvej 35, 2500 Valby, Denmark
2
Department of Food Science, Faculty of Science, University of Copenhagen, Rolighedsvej 26, 1958 Frederiksberg C, Denmark
*
Author to whom correspondence should be addressed.
Submission received: 19 October 2020 / Revised: 23 November 2020 / Accepted: 1 December 2020 / Published: 3 December 2020
(This article belongs to the Special Issue Coffee and Related Chemical Analysis)

Abstract

:
The specialty coffee industry is growing and, as a result, there is an accelerated interest in modulating roast profiles to present customers with new and diverse sensory experiences. The present study investigates the chemical and sensory effects of subtle variations in the ‘development time’ phase of the coffee roasting process. Four roast profiles were studied through sensory descriptive analysis (DA), gas chromatography–mass spectrometry (GC–MS), and nuclear magnetic resonance (NMR). Multivariate analysis showed clear separation of DA, GC–MS, and NMR data. A prolonged development time facilitated a statistically significant shift in the chemical and sensory profile of the coffee. The findings suggest that a short development time increases the fruity, sweet and acidic characteristics of the coffee, whereas a longer development time shifts the balance towards a more roasty, nutty, and bitter profile. The results provide evidence that supports the effect of subtle roast profile modulations. This lays a strong foundation for the inclusion of development time as a critical control parameter in the certification system of the Specialty Coffee Association, quality control, and product development strategies.

1. Introduction

The interest in specialty coffee has been growing steadily over the past few years and several smaller cafés and coffee roasteries are making their entrance into the market [1]. The increased popularity has led to a focus on optimising quality in every step of the production chain, including the roasting process. Roasting of the coffee bean is essential to impart the most important flavour characteristics and is the result of complex chemical reactions and changes to the bean’s physical structure [2]. Attention to detail in roast profile design is necessary to develop diverse and unique sensory experiences, which are highly desired in the speciality coffee market [3].
Endless possibilities exist within roast profile development and various time–temperature relationships of the roast may induce significant variations in the final flavour profile of the coffee brew. The current trend in the industry revolves around roasting coffee very lightly to highlight the sensory characteristics inherent to the coffee, e.g., terroir. This naturally decreases the attention towards roast degree and shifts the focus to other variables, such as timing the process optimally at different stages. One of the most fundamental concepts in roast profile design is ‘development time’, the importance of which has been shown in the previous work of the authors [4]. This stage is defined as the time span from the popping sound of steam pressure release from the beans at ‘1st crack’ until the point of roast termination. The coffee bean material is particularly susceptible to heat at this stage of the roasting process, due to the release of steam. This dries out the bean material, allowing browning reactions to occur much more rapidly, moving from the surface to the centre of the bean material [5]. Controlling this phase of the roasting process thus becomes a critical part of developing great tasting products; however, this concept is still overlooked in academic literature.
Several theories on flavour impact of various timing adjustments are taught by self-proclaimed roasting experts and are commonly accepted by the community. A sufficient base of evidence is still to be established to provide support for the professionals and educational systems within the industry.
A basic rule of chemical reaction kinetics is that a higher temperature increases the rate of the reactions [6], which is the principle used by roasters to control the roasting process. Reaching a similar roast degree is possible through varied time–temperature relationships, yet, to the best of the knowledge of the authors, no study has previously isolated the effect of specific phase modulations, such as development time. Typical roasting studies have investigated the effects of applying different set time–temperature relationships in the roasting process to alter the chemistry and potential flavours in the cup [7,8,9,10,11]. The approach of isothermal conditions specified with y temperature for x time allows for a clear and systematic approach to sample development, but may risk an oversimplification of the roasting process which is far removed from the practical work of the specialty coffee roaster. Typically, the roast master starts the roast with close to maximum power output from the burner (heat source), and later performs stepwise reductions in the power output to slow down the speed of browning reactions as the roast progresses. The large divide between methods in research and the practical work of the roaster may reduce the relevance of scientific research in terms of applicability to the work of a specialty coffee roaster. Therefore, this study is focused specifically on development time modulations, which appear to have a higher impact on flavour development when compared to overall roast timings [4].
The present study aims to approach the speciality coffee industry and their practices by investigating how modulating roast ‘development time’ influences the sensory profile and chemical composition of the coffee brew, as measured by nuclear magnetic resonance (NMR) and dynamic headspace sampling coupled to gas chromatography–mass spectrometry (DHS-GC–MS). Knowledge on the effects of subtle modulations, in terms of formation of chemical compounds and changes to the perceived flavour of the beverage, is of major interest to the speciality coffee industry. Evidence from this study is required to give roasters the necessary confidence in their craft and to provide a solid base of research for product development, quality control procedures, and educational systems in the specialty coffee industry.

2. Materials and Methods

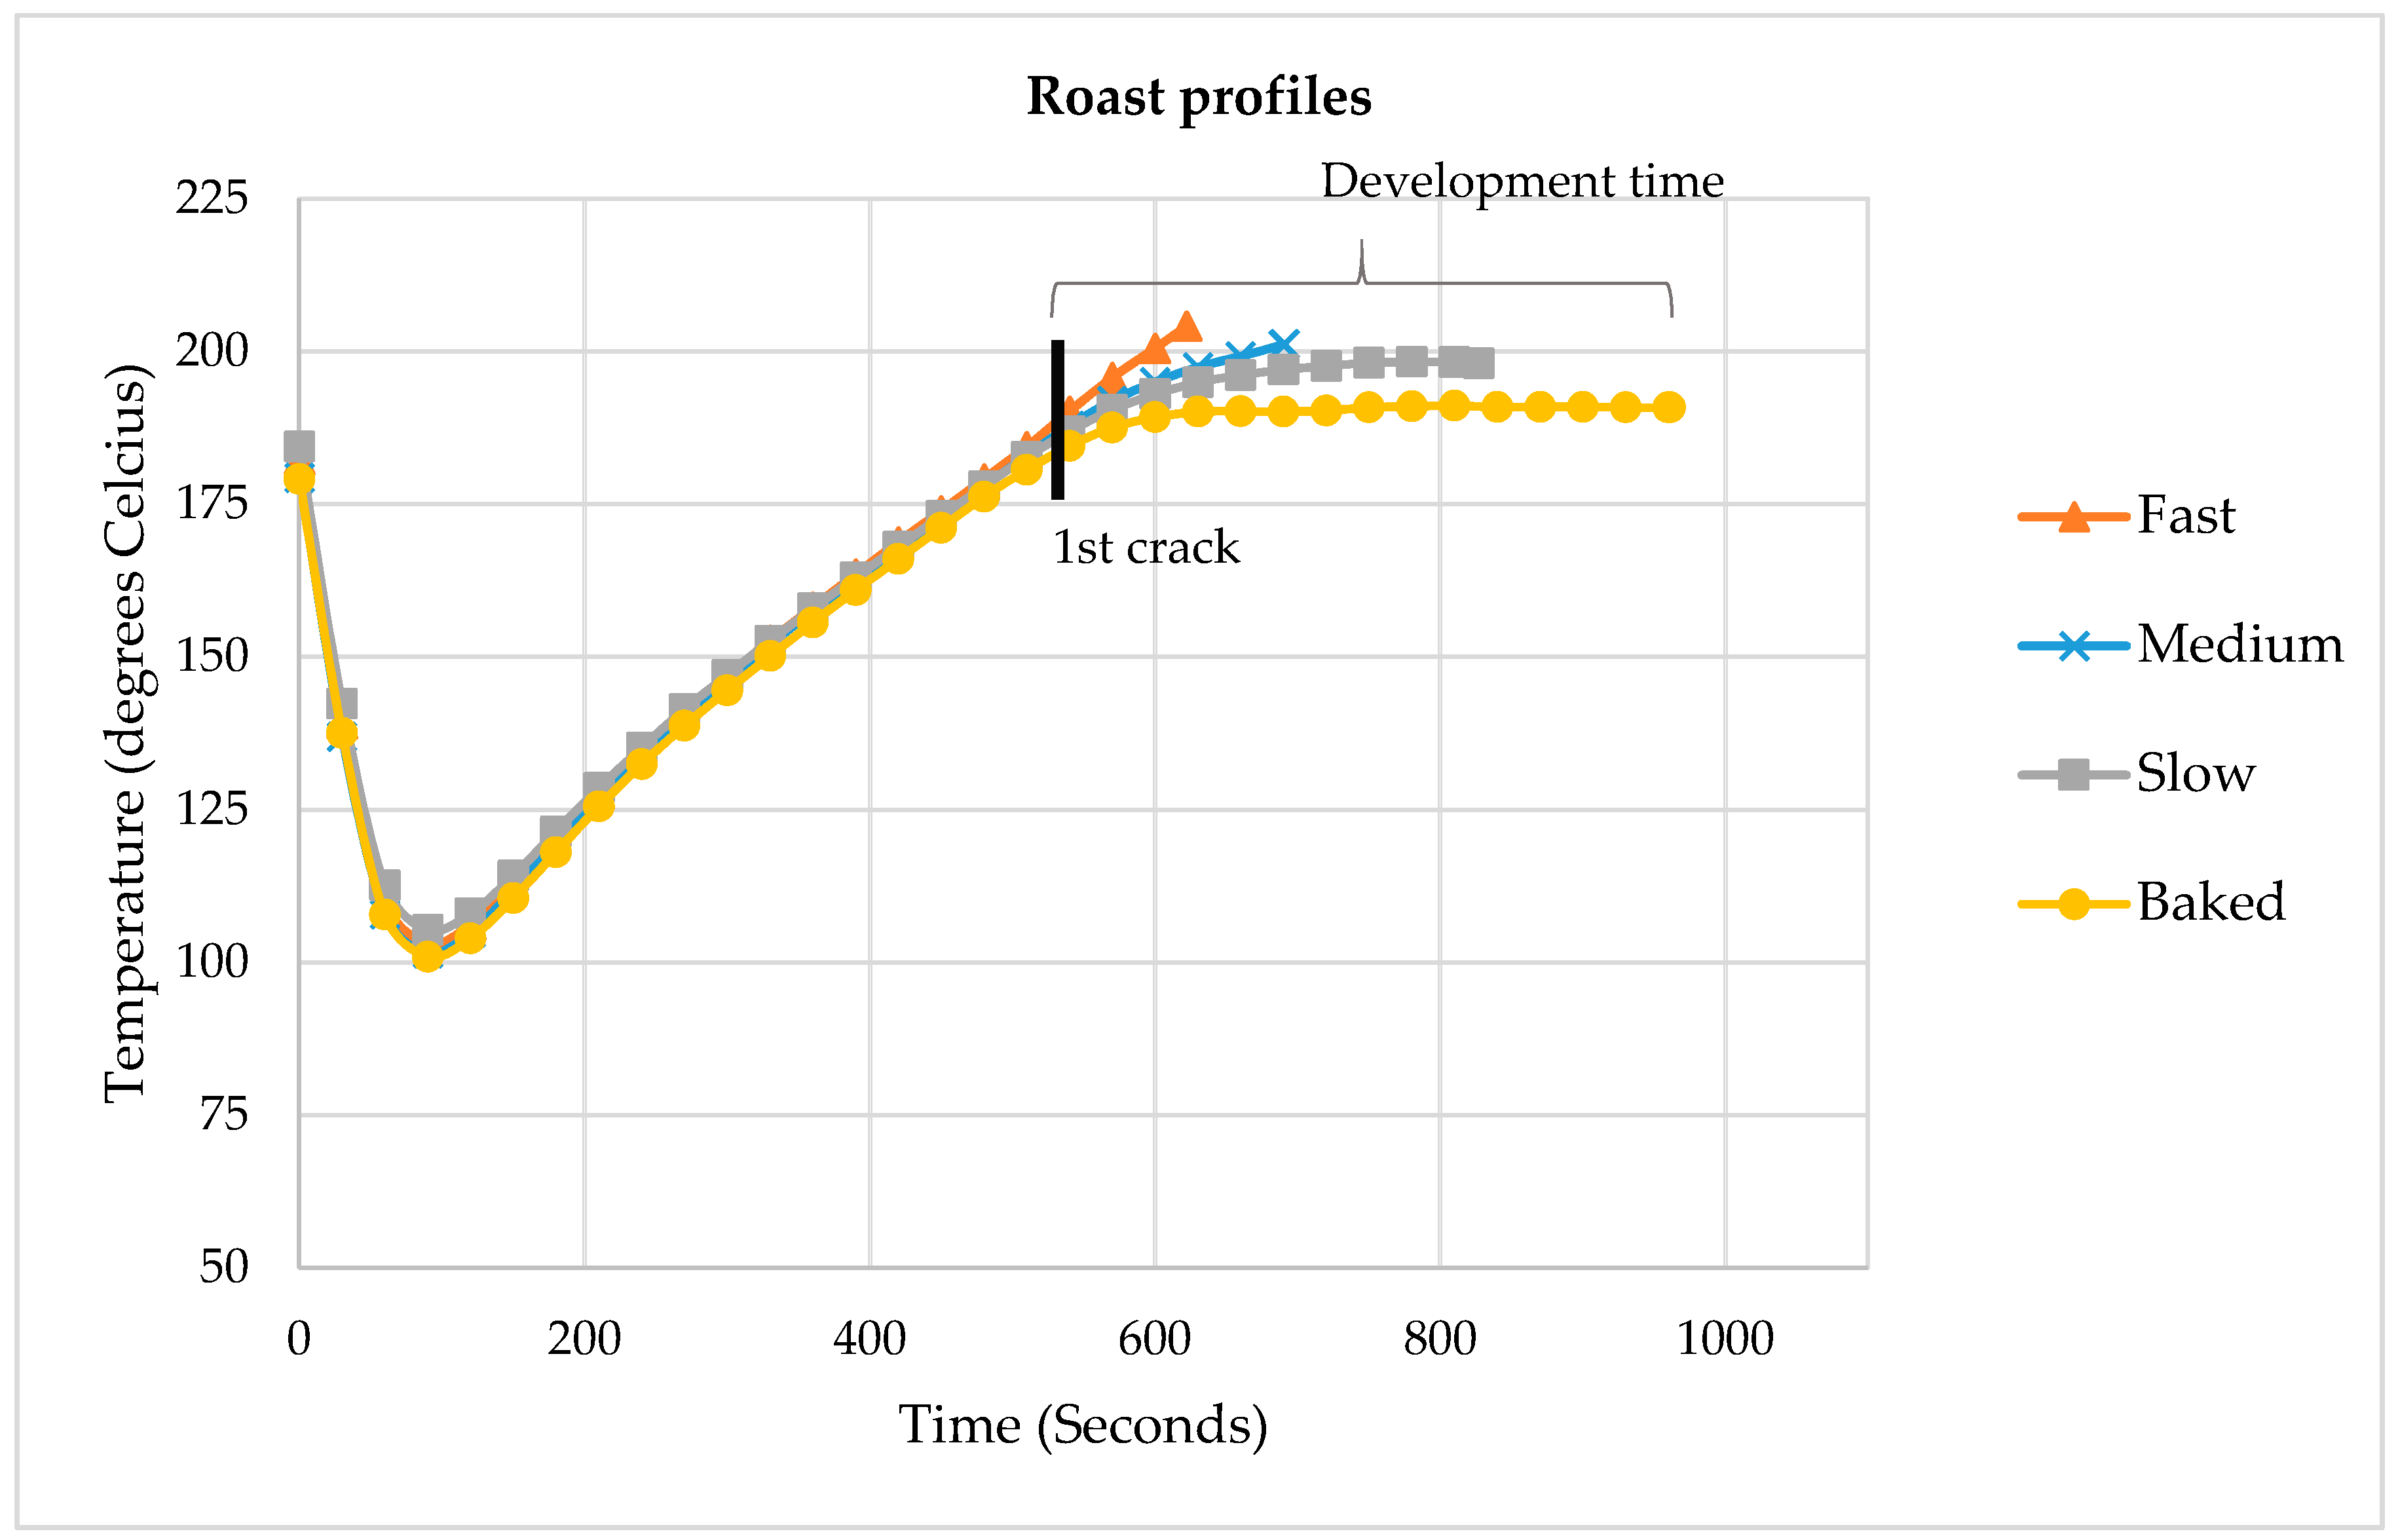
2.1. Coffee Sample Preparation

Green (unroasted) coffee samples were supplied by CoffeeMind Aps through Kontra Coffee A/S. The beans were of Colombian origin (Juan Guillermo Henao, Marsella), 100% arabica and processed by the ‘washed’ method. The growing altitude was 1200–1800 m above sea level and the beans had a moisture content of 10%, density of 880 g/L (SINAR 6070 Grainpro) and the beans were of screen size 17. Sample roasting was performed on a Probat Probatino (Probat-Werke, Emmerich am Rhein, Germany) 1 kg drum roaster. Roast profile data was logged simultaneously using Cropster© roasting software(Cropster®, Sacramento, CA, USA). Final roast colour was measured in Agtron, using Javalytics ® Model JAV-RDA-D (Madison Instruments, Inc., Middleton, WI, USA) on three replicates of finely ground coffee.
The roast profiles focused specifically on ‘development time’ modulations, i.e., different speeds of roasting from ‘First crack’ to roast termination. The initial stage of the roast leading up to first crack and the roast degree of all samples was similar between all roasts, thereby isolating ‘development time’ as the sole difference between profiles.
Figure 1 illustrates the time–temperature relationships of the four roast profiles. First crack occurs approximately at 570 s into the roast. The slope of the curve past this point is the focus of the present study and roast profile development. Therefore, the modulations are indeed subtle and the roasted beans appear visually identical despite large differences in roast time after first crack. The four profiles represent the spectrum of potential development time modulations from fastest to slowest possible at the given roast degree.
Roast degree can be defined in various ways, including bean weight loss, colour, or selected chemical indicators [12,13,14,15]. This study measures degree of roast as indicated by final bean colour to account for the various time–temperature relationships. A ‘medium’ roast degree of Agtron 76 ± 1 was chosen for the study. Colour deviation between roasts was minimised since roast colour has previously been shown to have a significant influence on flavour [16]. A deviation of ±1 was achieved which corresponds to the inherent variation of the Javalytics® colour analyser. The end temperature of each roast was adjusted to maintain an identical degree of roasting despite large differences in roast duration. The detailed kinetics of roast colour development have previously been described by other authors [17]. For this study, the Fast roast was ended at 204.1 °C, Medium at 201.2 °C, Slow at 198.4 °C and Baked at 191.1 °C.
The roasted coffee samples were produced one week prior to sensory evaluation. The samples were named Fast, Medium, Slow, and Baked, referring to the development time of the specific sample. ‘Baked’ refers to a common roasting defect in coffee, where time after first crack is extended drastically with little to no increase in temperature [16]. Development time ranged from 90 in the Fast profile to 390 s in the Baked profile. Development times for Medium and Slow roasts were 143 and 266 s, respectively.

2.2. Sensory Evaluation

2.2.1. Brewing

The four coffee samples were brewed simultaneously, ensuring similarity of beverage temperature. The brewing procedure followed the Speciality Coffee Association of America (SCAA) standards of 5.5 g coffee to 100 mL water at 95 °C [18]. The coffee was brewed in 1.5 litre insulated Bodum® Steel French Presses (Bodum®, Triengen, Switzerland) and divided in serving cups to ensure sample similarity between the three replicates in the sensory evaluation. All required coffee was ground simultaneously and mixed to prevent any influence on potential defect beans on individual serving profiles. In total, 75 g (±0.5 g) ground coffee was added to the French presses, with 1350 g (±5 g) 95 °C water. The brew was steeped for 3:30 min, after which it was stirred 10 times, skimmed and, finally, the plunger was pressed at 4:00 min. The brew was afterwards transferred to a thermos and poured into the three-digit coded cups on the evaluation tables. The evaluation was initiated when the coffee had cooled to 55 °C, despite consumer preferences favouring higher consumption temperatures of more than 60 °C [19,20]. Starting at a lower temperature reduces the risk of scalding and has furthermore been shown to provide better balance between subtle flavour notes and the highly impactful roasted notes found at higher temperatures [21].

2.2.2. Panel Evaluation

Forty-six experienced coffee tasters were recruited as participants at the 2017 Nordic Roaster Forum in Oslo. A descriptive sensory analysis following good sensory practice [22] was conducted to rate the intensity of predefined descriptors. These were selected based on unpublished results by CoffeeMind Aps and general, familiar concepts known by coffee professionals. The evaluation ballot included Sweetness, Acidity, Bitterness, Body, Astringency, Roasted, Nutty+Chocolate, Fruit+Berry, and Clean Cup. A brief calibration session was conducted to align concepts of basic tastes, mouthfeel and aromas. Definitions of each descriptor and reference material was presented to the participants to facilitate a common vocabulary and understanding of descriptors between assessors. Details are found in Appendix A. Although participants had previous experience with evaluation forms, a short introduction to the use of 15-point scales was given. The participants were blinded, and only given the necessary information on how to perform the evaluations.
The evaluation was performed in the traditional ‘cupping’ format, where assessors place a small amount of the given sample on a cupping spoon, slurp the coffee rapidly to aerate the coffee, and finally note perceived flavours on the evaluation form. The assessors were divided into six groups and cupping tables for each group were set up with all 3-digit coded samples in three replicates. The test site was isolated to prevent interference from the preparation area and to ensure the blinding of participants. Palate cleansers in the form of peeled cucumber, white toast bread, and room-temperature water were available. The evaluation form was created digitally to allow assessors to perform the evaluation from their smartphone. Instructions included following an individually randomised serving order, not interacting with other panellists, using palate cleansers, and only tasting each cup once with 2–3 sips from a cupping spoon.
Statistical analysis of sensory data was conducted in RStudio V1.1.463 and PanelCheck V1.4.2. An Analysis of Variance (ANOVA) was done to investigate significant differences for sensory attributes between samples. Tukey’s post-hoc test was performed to investigate which of the samples were significantly different from one another.

2.3. NMR Methodology

Samples for NMR analysis were prepared in 5 mm (o.d.) NMR tubes by mixing 250 µL of coffee brew with 250 µL of phosphate buffer (ionic strength 200 mM; pH 3.55) and 55 µL of D2O containing 5.8 mM TSP-d4. The coffee brew was prepared according to the protocol described in Section 2.2.1.
NMR analysis was performed using a Bruker Avance DRX 500 (11.7 T) spectrometer (Rheinstetten, Germany) operating at a Larmor frequency of 500.13 MHz for 1H, employing a double tuned inverse detection BBI probe. One-dimensional 1H NMR experiments were conducted at 298 K using the zgcppr pulse sequence [23]. For each sample, a single measurement consisting of 128 scans was recorded using a recycle delay of 5 s, a spectral width of 10,000 Hz and an acquisition time of 1.63 s. All spectra were referenced to TSP-d4 at 0.0 ppm for 1H.
All 1D NMR spectra were processed in Topspin 4.0. Determination of the concentration of various analytes was performed using an in-house Matlab (version 8.3.0.532, MathWorks®, Natick, MA, USA) program as well as assignments found in previous studies of coffee [24,25].

2.4. Dynamic Headspace Sampling and GC–MS Methodology

Coffee was prepared as per the method described in Section 2.2.1 and dynamic headspace sampling (DHS) was performed on the brew. The sampling of aromas from brewed coffee rather than dry grounds was done to increase the validity of comparisons of results from DHS-GC–MS and Sensory evaluation. Three replicates of DHS were carried out. Twenty mL of prepared coffee was transferred to a 100 mL gas washing flask and then 1 mL of a 5 ppm solution of 4-methyl-1-pentanol in water was added as an internal standard. The flasks were placed in a circulating water bath at 37 °C and purged with nitrogen (100 mL min−1) for 20 min with magnetic stirring (200 rpm). Volatiles were collected on traps containing 200 mg of Tenax-TA (mesh size 60/80, Markes International, Llantrisant, UK). After purging, water was removed from the traps with a flow of dry nitrogen (100 mL min−1 for 10 min).
The trapped volatiles were desorbed using an automatic thermal desorption unit (TurboMatrix 350, Perkin Elmer, Shelton, CT, USA). Primary desorption was carried out by heating the trap to 250 °C with a flow (50 mL min−1) of carrier gas for 15.0 min. The stripped volatiles were trapped in a Tenax TA cold trap (30 mg held at 5 °C), which was subsequently heated at 300 °C for 4 min (secondary desorption, outlet split 1:10). This allowed for the rapid transfer of volatiles to a GC–MS (7890A GC interfaced with a 5975C VL MSD with Triple-Axis detector from Agilent Technologies, Palo Alto, Santa Clara, CA, USA) through a heated (225 °C) transfer line.
Separation of volatiles was carried out on a ZB-Wax capillary column (30 m long × 0.25 mm internal diameter, 0.50 µm film thickness). The column pressure was held constant at 2.3 psi, resulting in an initial flow rate of 1.4 mL min−1, using hydrogen as carrier gas. The column temperature programme was: 10 min at 30 °C, from 30 °C to 240 °C at 8 °C min−1, and, finally, 5 min at 240 °C. The mass spectrometer was operated in electron ionisation mode at 70 eV. Mass-to-charge ratios between 15 and 300 were scanned. Peak areas and mass spectra were extracted from the chromatograms using the PARAFAC2-based software PARADISe (University of Copenhagen, Copenhagen, Denmark) and mass spectra were identified using the NIST05 database. Peak areas divided by the area of the internal standard were used as relative measures of concentration. Volatile compound identification was confirmed by comparison with retention indices (RI) of authentic reference compounds or retention indices reported in the literature.
Statistical analysis of DHS-GC–MS data was performed in JMP 14.0.0 (SAS Institute Inc., Cary, NC, USA). One-way ANOVA was conducted on the identified peaks to investigate whether compounds vary significantly between samples. Tukey’s post-hoc test was performed to investigate which of the samples were significantly different from one another.

3. Results

3.1. Sensory Evaluation

A total of 46 fully completed responses was achieved. Mean intensity ratings for each descriptor, ANOVA p-value and Tukey’s test results are presented in Table 1. The evaluation revealed statistically significant (p < 0.001) effects of development time on every descriptor, except Body.
The ‘Fast’ sample scored statistically significantly higher for the attributes Acidity, Fruit+Berry and Clean Cup. Longer development times of ‘Slow’ and ‘Baked’ lead to statistically significantly stronger perceptions of Astringency, Bitterness, Nutty+Chocolate, and Roasted notes. Sweetness was found to be highest in samples with a short development time. Considering the subtle modulations and identical roast degree, the differences were substantial.
A high degree of co-variance was observed between several descriptors, indicating a one-dimensional effect on flavour by modulating development time in the roasting process. It should be questioned whether the panel is able to differentiate between certain descriptors that appear to be highly correlated, i.e., logical error [26], or whether the attributes truly do modulate in the same manner. However, these effects were to some extent expected, since development time modulation of the roast profiles is naturally a one-dimensional parameter.
Body does not appear to vary depending on development time, as commonly believed in the specialty coffee industry. Body is one of the core concepts used when professionals describe the sensory impression of coffee, especially in regard to roast profiles. The present study defined the concept of Body and provided references (Appendix A) to promote vocabulary development and calibration of the participants, yet no difference was found in the evaluation. It has long been speculated how Body modulates through roast profiles [27], yet the current findings suggest that development time has no impact on modulating the sensory attribute. The elusiveness of the descriptor is highly likely to contribute to the difficulty of finding a significant difference despite the efforts made towards vocabulary development on the panel. Individual understandings of Body are prevalent in the industry, as indicated by internal studies in CoffeeMind, which lead to complications in sensory evaluations. The lack of alignment is expected to be reflected as an incoherence in the data, which has also been found for other descriptors [28].
The current trend in specialty coffee emphasises the development of high levels of acidity and fruitiness in the coffee, which was favoured by the ‘Fast’ roast. This is interesting, as extremely fast roasts are traditionally considered roasting defects, due to a theoretically more pronounced gradient of roast degree from the surface to the centre of the coffee bean. In contrast, the baked roast appeared to gain characteristics akin to darker roasts. These typically favour increased bitterness, along with roasty or even burnt notes [7].

3.2. NMR

The NMR investigations revealed substantial changes in the chemical composition of the coffee brew as an effect of roast development time modulations. Twelve different compounds were identified across the four samples. The identified compounds were present in all four samples, however, with notable differences in concentration. Table 2 presents the identified compounds and their variation between the four coffee samples. Generally, the total concentration of analytes was higher in the ‘Fast’ roast and lowest in ‘Baked’. The identified acids showed a general decline in concentration with a prolonged development time.
No carbohydrates were identified in the NMR spectra due to a range of very intense peaks in the spectral region 3–6 ppm originating from other compounds. Inspection of the un-assigned peaks in the spectral range 4.3–5.5 ppm (region for peaks from anomeric protons in carbohydrates) leads to the conclusion that the concentration of any carbohydrate was lower than 0.5 mM.

3.3. DHS-GC–MS

The effect of development time modulations on aroma compounds was measured by dynamic headspace sampling coupled with gas chromatography–mass spectrometry (DHS-GC–MS). From the chromatograms, mass spectra and the areas of 146 peaks could be extracted. An initial analysis of variance (ANOVA) showed that 49 of the peaks had significantly different levels in the coffee samples and, of these, the identity could be confirmed by a retention index for 39. These compounds are summarised in Table 3. Additional key odourants of coffee were identified, but not included in the table due to insignificant differences between the samples. The table therefore only includes the aromas of interest in regard to specific development time modulations. The ‘Fast’ and ‘Baked’ samples show the greatest difference in chemical composition, whereas limited differences were found between ‘Medium’ and ‘Slow’. In general, the amount of volatiles in the headspace of faster roasts reaching higher temperatures was greater, consistent with authors subjecting coffee beans to isothermal conditions [17]. The differences are described in more depth in the following section.

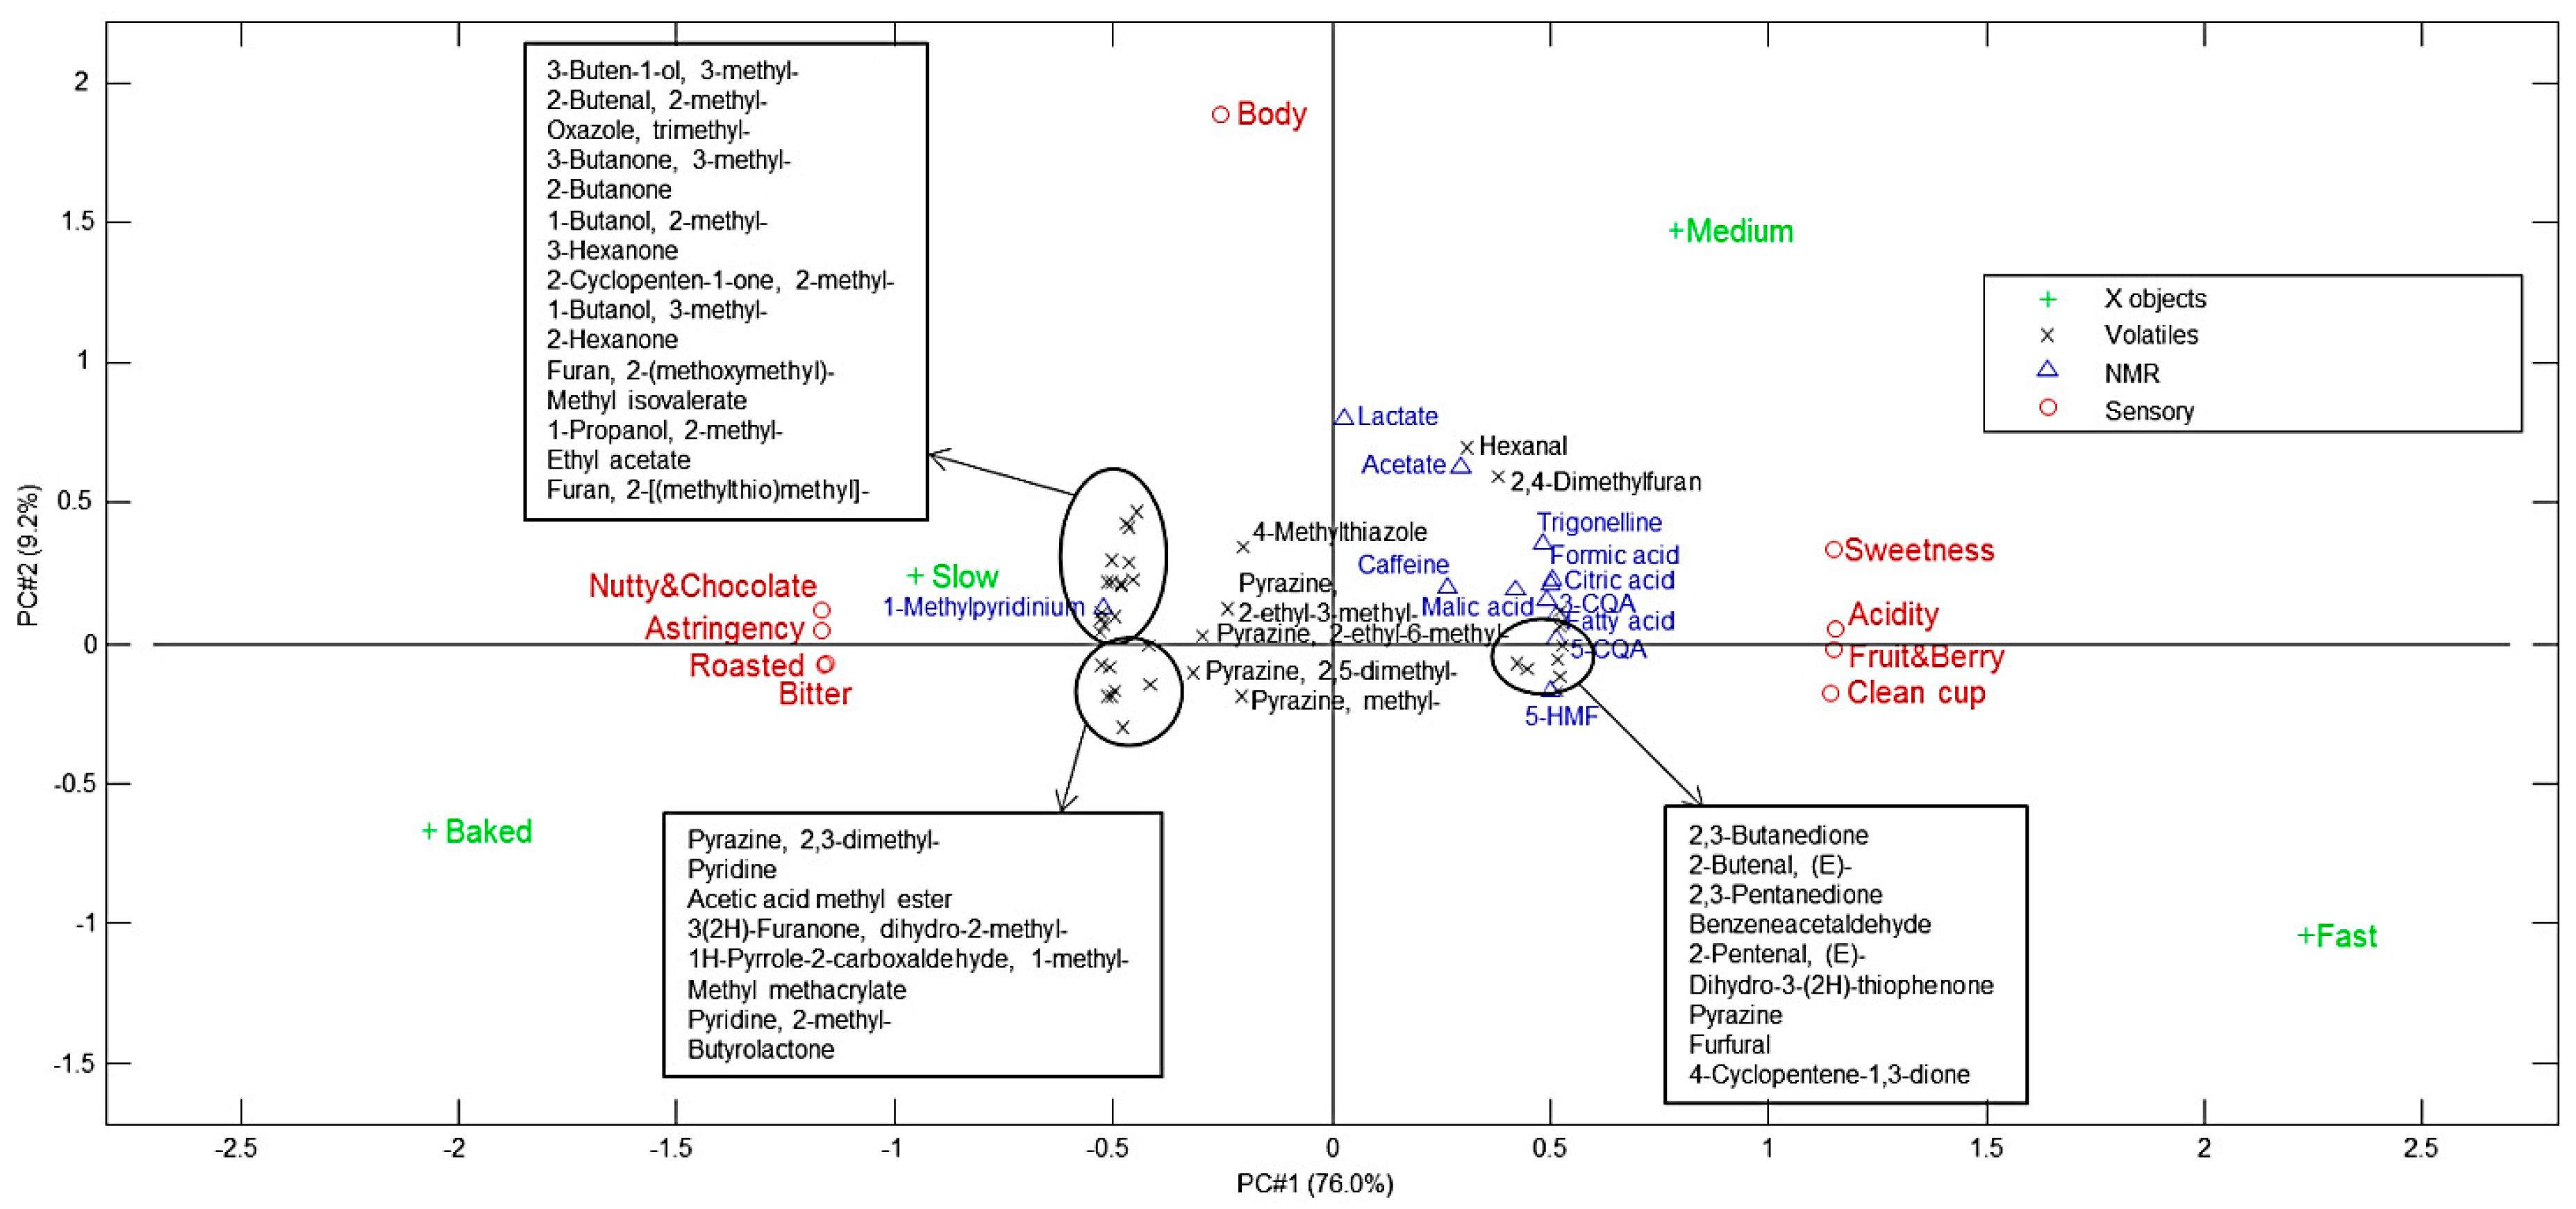
3.4. Correlation between Sensory and Instrumental Variables

Multivariate analysis was performed using the analytical software LatentiX, version 2.12 (LatentiX, Frederiksberg, Denmark). A Partial Least Squares (PLS) model on NMR and GC–MS-data (X, autoscaled) and sensory data (Y) was created using full cross-validation to investigate correlations between sensory attributes and chemical compounds. The first two components were sufficient to explain 85% of the variance. Most of the variation was explained by Component 1 (76%), which created a clear separation along the x-axis, as shown in the Bi Plot in Figure 2. The most extreme samples on this dimension were ‘Baked’ and ‘Fast’, corresponding to the extremes of the roast profiles. ‘Slow’ shared the characteristics of the ‘Baked’ sample, whereas ‘Medium’ and ‘Fast’ had slight differences, yet high correlation.
The PLS model created a clear separation of the NMR- and GC–MS-data, predicting the sensory attributes that characterise the ‘Fast’ and ‘Baked’ roasts, respectively. Thus, two main groups of compounds were found for the corresponding two groups of sensory attributes. These are presented in Table 4.
A faster development time promoted more hexanal, (E)-2-pentenal, and benzeneacetaldehyde, which exhibit green, apple-like, fruity, and floral aroma notes (thegoodscentscompany.com). The effect of an increased concentration of aldehydes such as hexanal in fast roasts is supported by Baggenstoss, J. et al. (2008), whose research indicates that hexanal formation depends on high temperatures in the roasting process. The NMR analysis revealed a higher presence of various acids, i.e., malic, citric, and formic acid in the ‘Fast’ roast. In combination, these compounds are likely to contribute to the sensory perception of Acidity in the ‘Fast’ sample. Both 2,3-butanedione and 2,3-pentanedione were present to a greater extent in ‘Fast’ and are generally agreed to have a butter-like aroma quality.
Chlorogenic acids are a major constituent of green coffee [29] and were found to a higher extent in the ‘Fast’ roast. These are important precursors for the bitter-tasting compounds of quinic acid and quinide, and are degraded with an increased roast degree [25]. The present study showed continuous degradation of the chlorogenic acids 5-CQA and 3-CQA with increased development time and this is likely to increase the perceived Bitterness of the ‘Baked’ roast.
A longer development time favoured a slightly higher presence of Maillard-derived pyrazines with roasty or nutty aroma qualities. This may correlate to the sensory descriptors Nutty+Chocolate and Roasted, which were perceived as more intense in the ‘Slow’ and ‘Baked’ samples by the panel. An example is 2.5-dimethylpyrazine, which is typically characterised by a roasty or hazelnut-like aroma. This compound has been reported in other studies as an important contributor to the characteristic aroma of coffee, and is furthermore found in higher concentrations in slow-roasted coffee [30]. Trigonelline in ‘Fast’ roasts may also act as a precursor for the pyridine found in ‘Baked’ roasts, supported by previous studies of pyridine’s continuous increase with roast duration [12]. Pyridine has previously been proposed as a marker of the baked roasting defect [31], consistent with the present study. Pyridines and alcohols like 2-methyl-1-propanol, 3-methyl-1-butanol, and 2-methyl-1-butanol were more dominant in the ‘Baked’ profile and can further contribute to a fusel or roasty aroma character. Certain volatiles in the ‘Baked’ profile such as 3-methyl-3-buten-1-ol and 3-hexanone may still contribute to a slight fruitiness; however, from sensory analysis, the subtle fruity notes seem obscured in the presence of intense roasty Maillard derivatives. Other studies, not specific to development time, have shown that low-temperature roasting with a longer duration produces a coffee with less headspace intensity and acidity when compared to its more quickly roasted counterpart [11]. It is important to acknowledge that most volatile compounds exist in all samples, whereas the proportion of each compound varies to a large extent, leading to a shift in the perceived flavour profile of the coffee. The importance of each compound may shift due to the formation dynamics in the roasting process, consistent with other studies [32].
The degradation of acids with longer development times was correlated with a reduced perception of Acidity in the Baked coffee. It is notable that all acids appear to be degraded to the same extent, meaning the ratio of particular acids does not change as an effect of development time. A popular theory in the coffee roasting community is that certain roast profiles may favour a particular composition of acids, allowing the roaster to highlight a specific acid. The findings of this study indicate that development time does not allow for such alterations. This is consistent with other authors suggesting a decrease in acids with prolonged overall roast times without changes to the relative composition of the acids [11].
Contrary to popular belief in the specialty coffee industry, a sweet perception in the brew is very unlikely to be due to the presence of sugars. A significant difference in the sensory perception of Sweetness was found between the coffee samples, yet no identifiable simple sugars were found from the NMR spectra. A concentration of 1 mmol/L of sugar, e.g., glucose or fructose, could be identified if present. Taste recognition thresholds of sugars are generally higher than 20 mmol/L [29]. Furthermore, roasting has previously been shown to drastically degrade sucrose by up to 99% depending on the roast profile [25,29,33]. Reducing sugars are formed from the hydrolysis of long-chain carbohydrates during the roasting process, but may rapidly enter as reactants in the Maillard reaction [33]. It is thus unlikely for the carbohydrates to have a significant role in the sweet perception of the brew, considering the low concentration and the complexity of coffee substances inducing other sensations that may suppress a sweet taste.
The sweet perception in coffee could hypothetically be induced by aromas that exhibit characteristics of sweet foods and drinks, rather than an actual sweet taste from sugars. The ketones 2,3-butanedione (diacetyl) and 2,3-pentanedione are both described as exhibiting pleasant, buttery, caramel-like or butterscotch sensations [32,34,35] and are both found in high concentrations in samples with shorter development times. In particular, diacetyl is a widely used compound in the food flavouring of sweet items [35] and may partially explain the higher perceived sweetness found by the sensory panel in Fast and Medium. Schenker et al. (2002) and Baggenstoss et al. (2008) found 2,3-butanedione and pentanedione concentrations of fast roasts to be higher when compared to slower roasts, although these studies focused on overall roast time and not development time specifically. The compounds were found to originate from different sugar fragments, and both showed drastic degradation with longer roast duration [12]. Furthermore, 2,3-butanedione has been shown to be stable even at high temperatures in the roasting process [32]; hence, degradation in the present study is likely due to excessively extended roast development times. Other unknown compounds exhibiting a sweet taste may also play a role; however, they are yet to be identified in coffee.

3.5. Overall

Roast development time modulations facilitate a rather large alteration in the overall flavour profile, considering the uniformity of roast degree between the samples. Generalisation of the data is naturally limited due to the sample size and the vast diversity of coffee species. However, the present study sets a solid foundation for further research in coffee roasting with practically applicable results to aid the industry in their craft. Coffee roasters may benefit greatly from including development time as a process parameter in quality control programmes and product development processes, as the results illustrate that roast colour alone is not a sufficient indicator of the chemical and sensory properties of the coffee. Thus, an improved quality control process should include both colour readings and development time data when evaluating coffee roasting consistency. In addition, the results support the relevance of training the skill of modulating development time in certification programmes of the specialty coffee industry.
Whether development time changes are positive or negative is a question of consumer research that should be addressed by the specific segment targeted by the coffee roaster. Furthermore, the present study does not provide any information with regard to the ability of consumers in detecting flavour differences between development time modulations in coffee.
The study was limited to investigating the effects of roast development time at the specific roast degree of Agtron 76 ± 1. Whether these effects persist at different roast degrees is an interesting area for further research. The current roast degree was chosen as it is deemed relevant as a ‘Light roast’ in commodity roasting and a ‘Dark roast’ in speciality roasting.

4. Conclusions

The present study provides a new base of evidence for the development time-specific modulations of roast profiles. Modulating the development time in the roast profile of Colombian coffee beans had a significant influence on the chemical composition and the sensory perception of the brew. Fast roasting favoured a chemical composition that offers a higher sensory perception of Fruitiness, Sweetness and Acidity in the cup. Longer development times led to a change in the chemical profile, providing a more Roasted, Nutty+Chocolate, and Bitter sensory perception. The findings of the study support methods of developing diverse flavour profiles of coffee in the specialty coffee industry and the importance of including development time as a parameter in quality control and product development.

Author Contributions

Conceptualisation, M.M. and J.A.; data curation, F.H.L., M.A.P. and J.A.; formal analysis, M.A.P. and J.A.; funding acquisition, M.M., CoffeeMind; investigation, F.H.L., M.A.P. and J.A.; methodology, F.H.L., M.A.P., M.M. and J.A.; project administration, M.M.; resources, M.M., F.H.L. and M.A.; supervision, M.M.; validation, F.H.L., M.A.P. and J.A.; visualisation, M.A. and J.A.; writing—original draft, J.A.; writing—review and editing, J.A. All authors have read and agreed to the published version of the manuscript.

Funding

This research received no external funding.

Acknowledgments

We thank Kontra Coffee for supplying the necessary coffee and roasting equipment for the sample development. The organisers of the Nordic Roaster Forum 2017, Tim Wendelboe and Jens Dyre Nørgaard, are gratefully acknowledged for making the sensory data collection possible.

Conflicts of Interest

The authors declare no conflict of interest. This research did not receive any external grant from funding agencies in the public, commercial, or not-for-profit sectors.

Appendix A

Details of descriptors used in the sensory evaluation.
Table A1. Overview of Descriptors, Definitions and References Used in the Sensory Evaluation of the Roasted Coffee.
CategoryDescriptorDefinitionReference
Basic tastesSweetnessThe sweet sensation associated with sucrose solutionSucrose solution of 24 g/L
AcidityThe sour sensation associated with citric acid solutionCitric acid solution of 1.2 g/L
BitternessThe bitter sensation associated with caffeine solutionBitter solution of 0.54 g/L caffeine.
MouthfeelBodyThe sensation of thickness, viscosity, and heaviness of the beverage.Pure water
Solution of 0.05% xanthan gum in water.
Solution of 0.1% xanthan gum in water.
AstringencyThe dry sensation on the tongue associated with over extracted earl grey tea. -
AromaRoasted The aroma associated with dark roasted coffee and rye bread crust. Mix of dark roasted whole coffee beans and rye bread crust.
Nutty+ChocolateThe aroma associated with a mix of nuts and dark chocolate. Mix of nuts (almonds, hazelnuts, walnuts) and 80% dark chocolate
Fruit+BerryThe aroma associated with citrus fruits and dark berries.-
QualityClean cupThe absence of negative off-flavours from initial tasting of the beverage to swallowing (Speciality Coffee Association, 2019).

References

  1. CBI. What is the Demand for Coffee in the European Market? Available online: https://www.cbi.eu/market-information/coffee/trade-statistics/ (accessed on 9 December 2019).
  2. Eggers, R.; Pietsch, A. Technology I: Roasting. In Coffee: Recent Developments; Clarke, R.J., Vitzthum, O.G., Eds.; Blackwell Sciences Ltd.: London, UK, 2001; pp. 90–107. [Google Scholar]
  3. van der Merwe, K.; Maree, T. The Behavioural Intentions of Specialty Coffee Consumers in South Africa. Int. J. Consum. Stud. 2016, 40, 501–508. [Google Scholar] [CrossRef]
  4. Münchow, M.; Alstrup, J.; Steen, I.; Giacalone, D. Roasting Conditions and Coffee Flavor: A Multi-Study Empirical Investigation. Beverages 2020, 6, 29. [Google Scholar] [CrossRef]
  5. Bonnländer, B.; Eggers, R.; Engelhardt, U.H.; Maier, H.G. Roasting. In Espresso Coffee: The Science of Quality; Illy, A., Viani, R., Eds.; Elsevier Academic Press: Amsterdam, The Netherlands, 2005. [Google Scholar]
  6. Ahmed, J.; Dolan, K.; Mishra, D. Chemical Reaction Kinetics Pertaining to Foods. In Handbook of Food Process Design; Ahmed, J., Shafiur Rahman, M., Eds.; Wiley-Blackwell: Oxford, UK, 2012. [Google Scholar]
  7. Bicho, N.C.; Leitão, A.E.; Ramalho, J.C.; Bartolomeu de Alvarenga, N.; Lidon, F.C. Impact of Roasting Time on the Sensory Profile of Arabica and Robusta Coffee. Ecol. Food Nutr. 2013, 52, 163–177. [Google Scholar] [CrossRef] [PubMed]
  8. Wang, N.; Lim, L.T. Fourier Transform Infrared and Physicochemical Analyses of Roasted Coffee. J. Agric. Food Chem. 2012, 60, 5446–5453. [Google Scholar] [CrossRef]
  9. Blumberg, S.; Frank, O.; Hofmann, T. Quantitative Studies on the Influence of the Bean Roasting Parameters and Hot Water Percolation on the Concentrations of Bitter Compounds in Coffee Brew. J. Agric. Food Chem. 2010. [Google Scholar] [CrossRef]
  10. Lyman, D.J.; Benck, R.; Dell, S.; Merle, S.; Murray-Wijelath, J. FTIR-ATR Analysis of Brewed Coffee: Effect of Roasting Conditions. J. Agric. Food Chem. 2003, 51, 3268–3272. [Google Scholar] [CrossRef]
  11. Gloess, A.N.; Vietri, A.; Wieland, F.; Smrke, S.; Schönbächler, B.; López, J.A.S.; Petrozzi, S.; Bongers, S.; Koziorowski, T.; Yeretzian, C. Evidence of Different Flavour Formation Dynamics by Roasting Coffee from Different Origins: On-Line Analysis with PTR-ToF-MS. Int. J. Mass Spectrom. 2014, 365–366, 324–337. [Google Scholar] [CrossRef] [Green Version]
  12. Baggenstoss, J.; Poisson, L.; Kaegi, R.; Perren, R.; Escher, F. Coffee Roasting and Aroma Formation: Application of Different Time-Temperature Conditions. J. Agric. Food Chem. 2008, 56, 5836–5846. [Google Scholar] [CrossRef]
  13. Schenker, S. Investigations on the Hot Air Roasting of Coffee Beans; Dissertation No. 13620; Eidgenoessische Technische Hochschule Zuerich (ETH): Zürich, Switzerland, 2000. [Google Scholar]
  14. Ruosi, M.R.; Cordero, C.; Cagliero, C.; Rubiolo, P.; Bicchi, C.; Sgorbini, B.; Liberto, E. A Further Tool to Monitor the Coffee Roasting Process: Aroma Composition and Chemical Indices. J. Agric. Food Chem. 2012, 60, 11283–11291. [Google Scholar] [CrossRef]
  15. Liberto, E.; Ruosi, M.R.; Cordero, C.; Rubiolo, P.; Bicchi, C.; Sgorbini, B. Non-Separative Headspace Solid Phase Microextraction-Mass Spectrometry Profile as a Marker to Monitor Coffee Roasting Degree. J. Agric. Food Chem. 2013, 61, 1652–1660. [Google Scholar] [CrossRef]
  16. Giacalone, D.; Kreuzfeldt, T.; Yang, N.; Liu, C.; Fisk, I.; Münchow, M. Common Roasting Defects in Co Ff Ee: Aroma Composition, Sensory Characterization and Consumer Perception. Food Qual. Prefer. 2018, 71, 463–474. [Google Scholar] [CrossRef] [Green Version]
  17. Wang, X.; Lim, L.T. A Kinetics and Modeling Study of Coffee Roasting Under Isothermal Conditions. Food Bioprocess Technol. 2014, 7, 621–632. [Google Scholar] [CrossRef]
  18. SCAA. Protocols & Best Practices. Available online: https://sca.coffee/research/protocols-best-practices/ (accessed on 4 December 2019).
  19. Stokes, C.N.; O’Sullivan, M.G.; Kerry, J.P. Assessment of Black Coffee Temperature Profiles Consumed from Paper-Based Cups and Effect on Affective and Descriptive Product Sensory Attributes. Int. J. Food Sci. Technol. 2016, 51, 2041–2048. [Google Scholar] [CrossRef]
  20. Borchgrevink, C.P.; Susskind, A.M.; Tarras, J.M. Consumer Preferred Hot Beverage Temperatures. Food Qual. Prefer. 1999, 10, 117–121. [Google Scholar] [CrossRef] [Green Version]
  21. Steen, I.; Waehrens, S.S.; Petersen, M.A.; Münchow, M.; Bredie, W.L.P. Influence of Serving Temperature on Flavour Perception and Release of Bourbon Caturra Coffee. Food Chem. 2017, 219, 61–68. [Google Scholar] [CrossRef]
  22. Lawless, H.T.; Heymann, H. Sensory Evaluation of Food—Principles and Practices, 2nd ed.; Heldman, D.R., Ed.; Springer Science+Business Media LLC.: New York, NY, USA, 2010. [Google Scholar]
  23. Bax, A. A Spatially Selective Composite 90 Radiofrequency Pulse. J. Magn. Reson. 1985, 65, 142–145. [Google Scholar] [CrossRef]
  24. Campo, G.; Caracena, R.; Zuriarrain, J. Talanta Quantitative Determination of Caffeine, Formic Acid, Trigonelline and 5- (Hydroxymethyl) Furfural in Soluble Coffees by 1 H NMR Spectrometry. Talanta 2010, 81, 367–371. [Google Scholar] [CrossRef]
  25. Wei, F.; Furihata, K.; Koda, M.; Hu, F.; Miyakawa, T.; Tanokura, M. Roasting Process of Coffee Beans as Studied by Nuclear Magnetic Resonance: Time Course of Changes in Composition. J. Agric. Food Chem. 2012, 60, 1005–1012. [Google Scholar] [CrossRef]
  26. Meilgaard, M.; Civille, G.V.; Carr, B.T. Sensory Evaluation Techniques, 4th ed.; Taylor and Francis Group, LLC.: Boca Raton, FL, USA, 2007. [Google Scholar]
  27. Folmer, B. The Craft and Science of Coffee; Elsevier Science & Technology: San Diego, CA, USA, 2017. [Google Scholar]
  28. Giacalone, D.; Steen, I.; Alstrup, J.; Münchow, M. Inter-Rater Reliability of “Clean Cup” Scores by Coffee Experts. J. Sens. Stud. 2020. [Google Scholar] [CrossRef]
  29. Belitz, H.D.; Grosch, W.; Schieberle, P. Food Chemistry; 4th revise; Springer: Berlin/Heidelberg, Germany, 2009. [Google Scholar] [CrossRef]
  30. Toci, A.T.; Azevedo, D.A.; Farah, A. Effect of Roasting Speed on the Volatile Composition of Coffees with Different Cup Quality. Food Res. Int. 2020, 137. [Google Scholar] [CrossRef]
  31. Yang, N.; Liu, C.; Liu, X.; Degn, T.K.; Munchow, M.; Fisk, I. Determination of Volatile Marker Compounds of Common Coffee Roast Defects. Food Chem. 2016, 211, 206–214. [Google Scholar] [CrossRef] [PubMed]
  32. Schenker, S.; Heinemann, C.; Huber, M.; Pompizzi, R.; Perren, R.; Escher, F. Impact of Roasting Conditions on the Formation of Aroma Compounds in Coffee Beans. J. Food Sci. 2002, 67, 60–66. [Google Scholar] [CrossRef]
  33. Bradbury, A.G.W. Chemistry. In Coffee: Recent Developments; Clarke, R., Vitzthum, O.G., Eds.; Blackwell Sciences Ltd.: Boston, MA, USA, 2001. [Google Scholar]
  34. Clark, S.; Winter, C.K. Diacetyl in Foods: A Review of Safety and Sensory Characteristics. Compr. Rev. Food Sci. Food Saf. 2015, 14, 634–643. [Google Scholar] [CrossRef]
  35. Martyny, J.W.; Van Dyke, M.V.; Arbuckle, S.; Towle, M.; Rose, C.S. Diacetyl Exposures in the Flavor Manufacturing Industry. J. Occup. Environ. Hyg. 2008, 5, 679–688. [Google Scholar] [CrossRef]
Figure 1. Roast profiles included in the study. The figure illustrates the time–temperature conditions for Fast, Medium, Slow, and Baked. First crack is highlighted at approximately 570 s into the roast.
Beverages 06 00070 g001
Figure 2. PLS-model Bi Plot with NMR and GC–MS data(x) and sensory data(y).
Beverages 06 00070 g002
Table 1. Overview of mean sensory evaluation score for each descriptor and sample. ANOVA p-values are reported in the right column. The result of Tukey’s post-hoc analysis is indicated by letters. Different letters indicate significant differences between samples.
SampleFastMediumSlowBakedp-Values
Sweetness8.7 C8.3 C7.2 B6.3 A<0.001
Acidity8.5 C7.6 B5.8 A5.4 A<0.001
Bitter5.7 A6.5 A8.0 B8.6 B<0.001
Body6.9 A7.4 A7.2 A7.1 A0.37
Astringency5.4 A6.0 AB6.7 BC7.1 C<0.001
Roasted5.4 A6.3 B8.3 C8.8 C<0.001
Nutty+Chocolate6.0 A6.9 B7.9 C8.4 C<0.001
Fruit+Berry7.3 C6.4 B4.6 A4.4 A<0.001
Clean cup7.5 C6.7 B5.5 A5.5 A<0.001
Table 2. Concentration (mM, uncertainty +/− 0.02 mM) of analytes observed in the 1H NMR spectra of coffee samples prepared by different roasting profiles.
CompoundFastMediumSlowBaked
Acetate9.269.679.398.63
Formic acid5.535.404.754.16
Trigonelline4.454.534.053.78
Citric acid4.334.264.013.73
Caffeine3.353.403.223.34
5-CQA *3.523.242.332.44
Fatty acid2.001.831.581.29
Malic acid1.221.171.160.95
3-CQA1.241.230.961.00
Lactate0.890.950.940.88
1-methylpyridinium0.320.370.430.43
5-HMF0.100.080.050.06
* CQA: caffeoylquinic acid.
Table 3. A selection of compounds identified in dynamic headspace sampling (DHS)-GC–MS analysis. Only compounds with significant variation in mean relative peak area between samples are included in the table. The result of Tukey’s post-hoc analysis is indicated by letters. Different letters indicate significant differences between samples.
Retention Index (RI)Mean Relative Peak Area (n = 3)
ExpAuthLit (1)FastMediumSlowBakedANOVA, p
-Alcohols
1-Propanol, 2-methyl-11141110 16 A20 AB21 AB24 B0.019
1-Butanol, 2-methyl-1228 120715 A18 B17 B19 C0.000
1-Butanol, 3-methyl-12291224 80 A88 AB88 AB94 B0.025
3-Buten-1-ol, 3-methyl-1272 1249102 A115 B115 B117 B0.003
-Aldehydes
2-Butenal, (E)-1036 104055 B49 B35 A30 A0.000
Hexanal10851087 149 B192 C136 AB125 A0.000
2-Butenal, 2-methyl-, (E)-10921092 112 A129 B133 B133 B0.001
2-Pentenal, (E)-1134 112929 B25 AB23 B20 B0.006
1H-Pyrrole-2-carboxaldehyde, 1-methyl-1625 1628181 A193 A214 AB249 B0.008
Benzeneacetaldehyde16561659 48 B41 AB32 AB28 A0.017
-Esters
Acetic acid, methyl ester828826 516 A587 AB670 AB789 B0.027
Ethyl Acetate894 88726 A37 B44 BC52 C0.000
Methyl methacrylate1008 100621 A22 AB26 BC29 C0.001
Methyl isovalerate1020 101919 A23 AB26 B28 B0.008
-Furans
2,4-Dimethylfuran963 94916 AB17 A15 AB14 B0.025
Furan, 2-(methoxymethyl)-1253 1243203 A260 B306 C330 D0.000
3(2H)-Furanone, dihydro-2-methyl-1279 12671487 A1521 A1518 A1629 B0.000
Furfural14771476 2701 C2487 B2246 A2222 A0.000
Furan, 2-[(methylthio)methyl]-1499 1491129 A170 AB222 BC241 C0.001
-Ketones
2-Butanone905906 995 A1154 AB1146 AB1239 B0.017
2-Butanone, 3-methyl-927 9435 A6 AB7 AB7 B0.034
2,3-Butanedione984985 1213 B1146 B892 A838 A0.000
3-Hexanone1051 105592 A102 AB112 B110 B0.026
2,3-Pentanedione10711073 xx2434 B2020 A1991 A0.000
2-Hexanone1085 108628 A30 AB33 A32 AB0.028
2-Cyclopenten-1-one, 2-methyl-1381 136933 A36 B38 B39 B0.001
Dihydro-3-(2H)-thiophenone1577 15603 B3 AB2 AB2 A0.019
4-Cyclopentene-1,3-dione1598 156748 B41 AB33 A33 A0.028
-Pyrazines
Pyrazine1220 121493 C90 BC80 A86 AB0.002
Pyrazine, methyl-1283 12671302 A1317 AB1272 A1380 B0.004
Pyrazine, 2,5-dimethyl-13471340 225 A235 AB224 A259 B0.027
Pyrazine, 2,3-dimethyl-1363 134346 A49 AB48 A55 B0.010
Pyrazine, 2-ethyl-6-methyl-1399 1385160 A170 AB160 A182 B0.018
Pyrazine, 2-ethyl-3-methyl-1419 140471 AB77 AB70 A81 B0.029
-Pyridines
Pyridine1190 11882011 A2177 B2505 C2689 D0.000
Pyridine, 2-methyl-1232 12226 A6 A9 B10 B0.004
-Lactones
Butyrolactone16451652 30 A28 A43 A43 A0.035
-Other
Oxazole, trimethyl-1209 119922 A25 B25 B26 B0.000
4-Methylthiazole1299 128347 A50 B47 A50 B0.002
(1) Library values were obtained from PubChem, National Institutes of Health, Bethesda, 2019.
Table 4. Influence of development time modulations on the sensory profile and chemical characteristics of coffee samples. Compounds presented are dominant for the given sample and may also be found in lower quantity in other samples.
Characteristics of the ‘Baked’ Roast
Sensory AttributeNMRTaste QualitiesGC–MSOdour Qualities
Nutty+Chocolate
Astringency
Roasted
Bitter
Methylpyridinium Furan, 2-[(methylthio)methyl]-
Methyl isovalerate
Furan, 2-(methoxymethyl)-
Pyridine
Ethyl Acetate
2-Cyclopenten-1-one, 2-methyl-
Pyridine, 2-methyl-
Acetic acid, methyl ester
Methyl methacrylate
3-Hexanone
2-Butanone, 3-methyl-
1-Propanol, 2-methyl-
1H-Pyrrole-2-carboxaldehyde, 1-methyl-
2-Hexanone
1-Butanol, 3-methyl-
Butyrolactone
2-Butenal, 2-methyl-, (E)-
2-Butanone
Oxazole, trimethyl-
1-Butanol, 2-methyl-
3-Buten-1-ol, 3-methyl-
Pyrazine, 2,3-dimethyl-
3(2H)-Furanone, dihydro-2-methyl-
Pyrazine, 2,5-dimethyl-
Pyrazine, 2-ethyl-6-methyl-
Pyrazine, 2-ethyl-3-methyl-
Pyrazine, methyl-
4-Methylthiazole
onion, garlic
fruity
coffee, roasted
fishy, coffee
ethereal, fruity
-
nutty
ethereal, fruity
plastic
fruity, waxy
camphor
fusel
roasted
acetone
fusel
creamy, caramel
nutty
acetone
nut, roasted
roasted, fusel
sweet, fruity
nutty, coffee
brown, nutty
nutty, cocoa
roasted, hazelnut
nutty, peanut
nutty, cocoa
nutty, green
Characteristics of the ‘Fast’ roast
Sensory attributeNMRTaste qualitiesGC–MSOdour qualities
Sweetness
Acidity
Fruit+Berry
Clean cup
Acetate
Malic Acid
Trigonelline#1
Trigonelline
3-CQA
5-HMF
Citric acid
Formic acid
5-CQA
Fatty acid
Sour
Bitter
Hexanal
2,4-Dimethylfuran
Dihydro-3-(2H)-thiophenone
Pyrazine
2-Pentenal, (E)-
4-Cyclopentene-1,3-dione
2,3-Pentanedione
2,3-Butanedione
Furfural
2-Butenal, (E)-
Benzeneacetaldehyde
Grass, apple
garlic, meaty, green
roasted, nut
green, fruitysweet, creamy
butter, caramel
sweet, woody
flower
honey, rose
No systematic effect
SensoryNMR GC–MS
BodyLactate
Caffeine
Publisher’s Note: MDPI stays neutral with regard to jurisdictional claims in published maps and institutional affiliations.

