Article

Investigation of Alcohol Factor Influence in Quantitative Descriptive Analysis and in the Time-Intensity Profile of Alcoholic and Non-Alcoholic Commercial Pilsen Beers Samples

by
Juliana A. Paixão
*,
Elson Tavares Filho
and
Helena Maria André Bolini
Department of Food and Nutrition, Faculty of Food Engineering (FEA), University of Campinas (UNICAMP), Campinas, São Paulo 13083-862, Brazil
*
Author to whom correspondence should be addressed.
Submission received: 10 June 2019 / Revised: 1 July 2019 / Accepted: 26 August 2019 / Published: 21 December 2020
(This article belongs to the Special Issue Beer Quality and Flavour)

Abstract

:
In recent years, non-alcoholic beers have presented a growth considered satisfactory and exciting for the brewing industry. Such growth is allied to a change in the consumer profile, in addition to changes in traffic laws. However, the consumer seeks a product considered healthier, but as tasty as the original. Thus, this study aimed to identify the influence of the alcoholic factor in sensory profile, through quantitative descriptive analysis and time intensity analysis of Pilsen beer samples. An acceptance test with 120 consumers of beer was performed. A quantitative descriptive analysis was carried out by 11 trained assessors to determine the sensory profile of beers. For identification of influences of alcohol factor in the dynamic profile of alcoholic flavor and bitter taste the time-intensity analysis were realized. The results demonstrate that alcohol factor influences both the quantitative descriptive profile and dynamic profile, in addition the correlations between the quantitative descriptive analysis (QDA®) and hedonic data show that the alcoholic flavor and the alcoholic aroma are attributes that contribute positively to acceptance of samples. In view of the results, studies such as the present are of great importance for the improvement of product quality, directly reflecting a greater acceptance of beer consumers.

1. Introduction

The brewing sector is considered one of the most important in the Brazil economy. Beer is a widely consumed drink in the country, Brazil is the third largest global consumer. However, the consumer market is constantly evolving, thus, to keep up with changing demands, the brewing market constantly invests in the development of new products and the improvement of existing ones [1].
Non-alcoholic beers are relatively new beverages, much less consumed than the alcohol-containing beers; however, non-alcoholic beverages have shown considerable global growth in recent years, this is related to the use of increasingly sophisticated production methods, in order to meet the expectations of the consumer [1,2]. But it is known that the alcohol flavor is a fundamental characteristic for beer and its absence can bring changes in the set of sensory attributes and contribute to rejection of the product [3].
Quality is a fundamental tool to obtain advantages in the market, once it influences the consumer’s behavior and choices, thus knowledge about the product is required to satisfy consumer needs [4]. In this context, the sensory techniques for characterization and optimization of product become of extreme importance, since the sensory evaluation is a science that measures, analyzes, and interprets the reaction of people in relation to products through the sense organs [5].
In sensory evaluation descriptive techniques are often used in development of products, once it provides a complete profile of product, pointing out all its characteristics, being able to be used in the most varied types of matrices [5,6,7,8]. Numerous applications include concurrent product monitoring, product storage testing, new product development, quality control of industrialized products, and the relationship between sensory and instrumental testing [8].
The quantitative descriptive analysis (QDA®) methodology is considered a static analysis, what through, as sensory perception is considered a dynamic phenomenon that changes during the food consumption process, often fails to garner all relative information. Consequently, the time-intensity (TI) method is often utilized as a complement analysis for the dynamic perception of flavors and textures over time [9]. Thus, the identification of the most relevant sensory mechanisms, in addition to the physical and chemical properties of beers, allied to hedonic test can generate a more complete profile of product, aiding in improvement of existing products and in the development of new products [10].
In this context, the objective of this study was to investigate the influence of the alcohol factor in the sensory profile of alcoholic and non-alcoholic Pilsen beers, through quantitative descriptive analysis (QDA®). Besides, determining the dynamic profile of bitter and alcoholic flavor stimuli, through time-intensity analysis, determined on whether or not the alcohol ingredient can affect these samples. In addition, partial least squares (PLS) regression analysis was performed to assess the correlation of consumer acceptability data with results obtained by using QDA®. As a complement, physicochemical characterization was performed.

2. Material and Methods

2.1. Samples

Six samples of Pilsen beers were evaluated, being 3 alcoholic (Alc 1, Alc 2, Alc 3) and 3 non-alcoholic, corresponding from the same brands of alcoholics (Non Alc1, Non Alc2, Non Alc3). Samples in bottles (long necks) with a maximum variation of two days between them, in the date of fabrication, were obtained in local markets in Barão Geraldo, Campinas/SP. To control the temperature and carbonation, the tasters were divided into groups of 5 per session. Any remaining samples at the end of each testing session were discarded.

2.2. Quantitative Descriptive Analysis

2.2.1. Recruitment and Pre-Selection of the Assessors

Subjects (older than 18 years) were recruited among students and staff at the Faculty of Food Engineering (Campinas/SP/Brazil) through verbal invitation. To integrate the team, 26 subjects were submitted to Wald’s sequential analysis (Amerine, Pangborn, and Roessler, 1965), using triangular difference tests with two alcoholic beer samples, with a significant difference at 0.1% between them. The parameters used in the sequential analysis were: p0 = 0.45 (maximum unacceptable ability), p1 = 0.75 (minimum acceptable ability), a = 0.10 (likelihood of accepting a candidate without sensory acuity), and b = 0.10 (likelihood of rejecting a candidate with sensory acuity) (Moraes and Bolini, 2010). In this way twenty subjects, 13 women and 7 men, were selected as potential panelists.

2.2.2. Development of Descriptive Terminology

The samples were presented to the assessors in individual air-conditioned booths in pairs, in transparent 3-digit coded glass cups, and the assessors listed the similarities and differences between samples in relation to appearance, aroma, flavor, and texture [11]. Then, a meeting was performed to select the descriptors, removing the terms that did not present a consensus and redundant terms.
A total of 20 descriptors were selected, and the evaluation sheet consisted of an unstructured 9 cm linear hedonic scale, anchored at the extreme left by “weak” or “none” and at the extreme right by “strong” [8]. After 9 training sessions three hours each, with an interval of 1–2 days, the tests were carried out to select the team of assessors for quantitative descriptive analysis (QDA®).

2.2.3. Training Sessions

Nine training sessions, 3 h each and with an interval of 1–2 days, were carried out with the maximum and minimum references determined in consensus, in order to form sensory memory and equalization among panelists. The concept, determined by a consensus of all subjects of each reference, is described in Table 1.

2.2.4. Selection of Subjects to Perform the Quantitative Descriptive Analysis (QDA®)

The candidates were selected based on the discrimination power between samples, repeatability, and agreement among them [12], which was determined by the two-factor analysis of variance (sample and repetition) for each subject, in relation to each attribute [8]. The selected team of 11 subjects presented significant Fsample for p ≤ 0.50 and non-significant Frepetition for p ≥ 0.05. Based on the selection criteria eleven panelists (7 women and 4 men) were selected for further evaluation of the sensory descriptive profile of Pilsen beer.

2.2.5. Quantitative Descriptive Analysis (QDA®)

Eleven selected assessors evaluated six samples of Pilsen beer for all attributes. Panelists received 30 mL of beer samples and were asked to rate the intensity of each attribute using a 9 cm unstructured linear scale with anchor “weak” or “none” on the left, and “strong” on the right. The samples were coded with three-digit numbers and presented in a monadic way, at 2 °C, using a balanced block design [13]. Each subject evaluated six Pilsen beer samples in three repetitions, in individual air-conditioned booths at the Laboratory of Sensory Science and Consumer Studies of the Department of Food and Nutrition—FEA/UNICAMP.

2.3. Consumer Test

Overall liking was determined by 120 consumers (78 males and 42 females, age between 18 and 35) recruited on the campus of the State University of Campinas (UNICAMP) through a verbal invitation, using a 9 cm unstructured hedonic scale [8], with anchors of “like extremely” on the right and “dislike extremely” on the left [8,9,10,11,12,13,14]. All samples were presented monadically using a balanced complete block design, all samples were coded with three-digit numbers, and served in individual air-conditioned booths at the Laboratory of Sensory Science and Consumer Studies of the Department of Food and Nutrition—FEA/UNICAMP [13]. All consumers analyzed the six beer samples.

2.4. Time-Intensity Analysis

As performed for the QDA®, a pre-selection of assessors was conducted using the Wald’s sequential analysis [14,15]. Triangular tests were carried out with 25 assessors for the stimulus bitter taste, and 30 assessors for the stimulus alcoholic flavor. Only 11 assessors were selected for both stimuli.

2.4.1. Consumer Test

Overall liking was determined by 120 consumers (78 males and 42 females, aged between 18 and 35) recruited on the campus of the State University of Campinas (UNICAMP) through a verbal invitation, using a 9 cm unstructured hedonic scale [8], with anchors of “like extremely” on the right and “dislike extremely” on the left [8,9,10,11,12,13,14]. All samples were presented monadically using a balanced complete block design, all samples were coded with three-digit numbers, and served in individual air- conditioned booths at the Laboratory of Sensory Science and Consumer Studies of the Department of Food and Nutrition - FEA/UNICAMP.All consumers analyzed the six beer samples.

2.4.2. Time-Intensity Training Sessions

The time-intensity analysis was applied to stimuli bitter taste and alcoholic flavor, which are considered attributes of great influence for acceptance of product [16]. The assessors in consensus determined the maximum and minimum references, and the three training sessions for familiarization and formation of sensory memory were performed, using the same references of quantitative descriptive analysis (QDA®).
The time-intensity data were collected by software TIAFT [17] (Time-Intensity Analysis of Flavors and Tastes, developed in University of Campinas)-version 2017, which was developed in the Laboratory of Sensory Science and Consumer Studies of the Faculty of Food Engineering (FEA/UNICAMP/BRAZIL). During each session, the following parameters were collected: Imax (maximum intensity recorded); Timax (time at which the maximum intensity was recorded); Area (area of the time-intensity curve); and Ttot (total duration time of the stimulus) [18].

2.4.3. Selection of Assessors and Evaluation of Attributes for Time-Intensity Analysis

The assessors were selected in relation to their discrimination power, repeatability, and agreement with the team [12]. The assessors with significant F sample (p < 0.30), non-significant F repetition (p > 0.05), and non-significant F sample X assessor (p > 0.05) were selected [8].
For that, 20 mL of sample was presented to the assessors in transparent glass cups, coded with three random digits at a temperature of 2 ± 2 °C.
For this study, 10 s was considered as the initial waiting time, 10 s as the retention time before ingestion, and 60 and 45 s as the time of analysis after ingestion for bitter taste and alcoholic content, respectively. A structured nine-point scale was used, in which 0 = none/weak, 4.5 = moderate, and 9 = strong.
First, the program informed the assessor to enter some data, and then the session started. At the first sounding signal issued by the program, the assessor should put the whole sample in the mouth and hold it until the second sounding warning, when the assessor should swallow the sample and, after the estimated time, a third and final warning informed the end of test [19,20].

2.5. Physicochemical Characterization

2.5.1. Color Measurements

The color parameters L*, a*, and b*, where L* represents the luminosity of the sample; the coordinate a * is associated with the green–red dimension, and positive a* values indicate the sample in the green region, while the coordinate b* represents the blue–yellow dimension, and positive b* indicates the sample in the yellow region. Color measurements were performed using the Hunter Lab colorimeter, Color Quest II [21]. All analyses were performed in triplicate.

2.5.2. Alcohol Content

The alcohol content was analyzed through the densimetric method, as described by MAPA [22], using distillation as a means of separating the alcohol and its subsequent quantification through the relative density of the distillate at 20 °C.

2.6. Statistical Analysis

All statistical analyses were carried out using XLSTAT software version 2017 (Addinsoft SARL, Paris, France). The data of Quantitative Descriptive Analysis, Time Intensity methods, consumer test and chemical compositional were analyzed by ANOVA, using two factors (panelist and sample) and Tukey’s test averages (p > 0.05). Correlation between the QDA® and overall liking data was determined by PLS regression analysis [23], being that overall impression was the dependent variable (Y-matrix), and the QDA® attributes were the independent variables (X-matrix) [24].
The generation of external preference mapping was conducted by first using principal components analysis (PCA), with quantitative descriptive analysis data, and then by finding the relationship of each consumer to the PCA space by regression analysis [7].

3. Results and Discussion

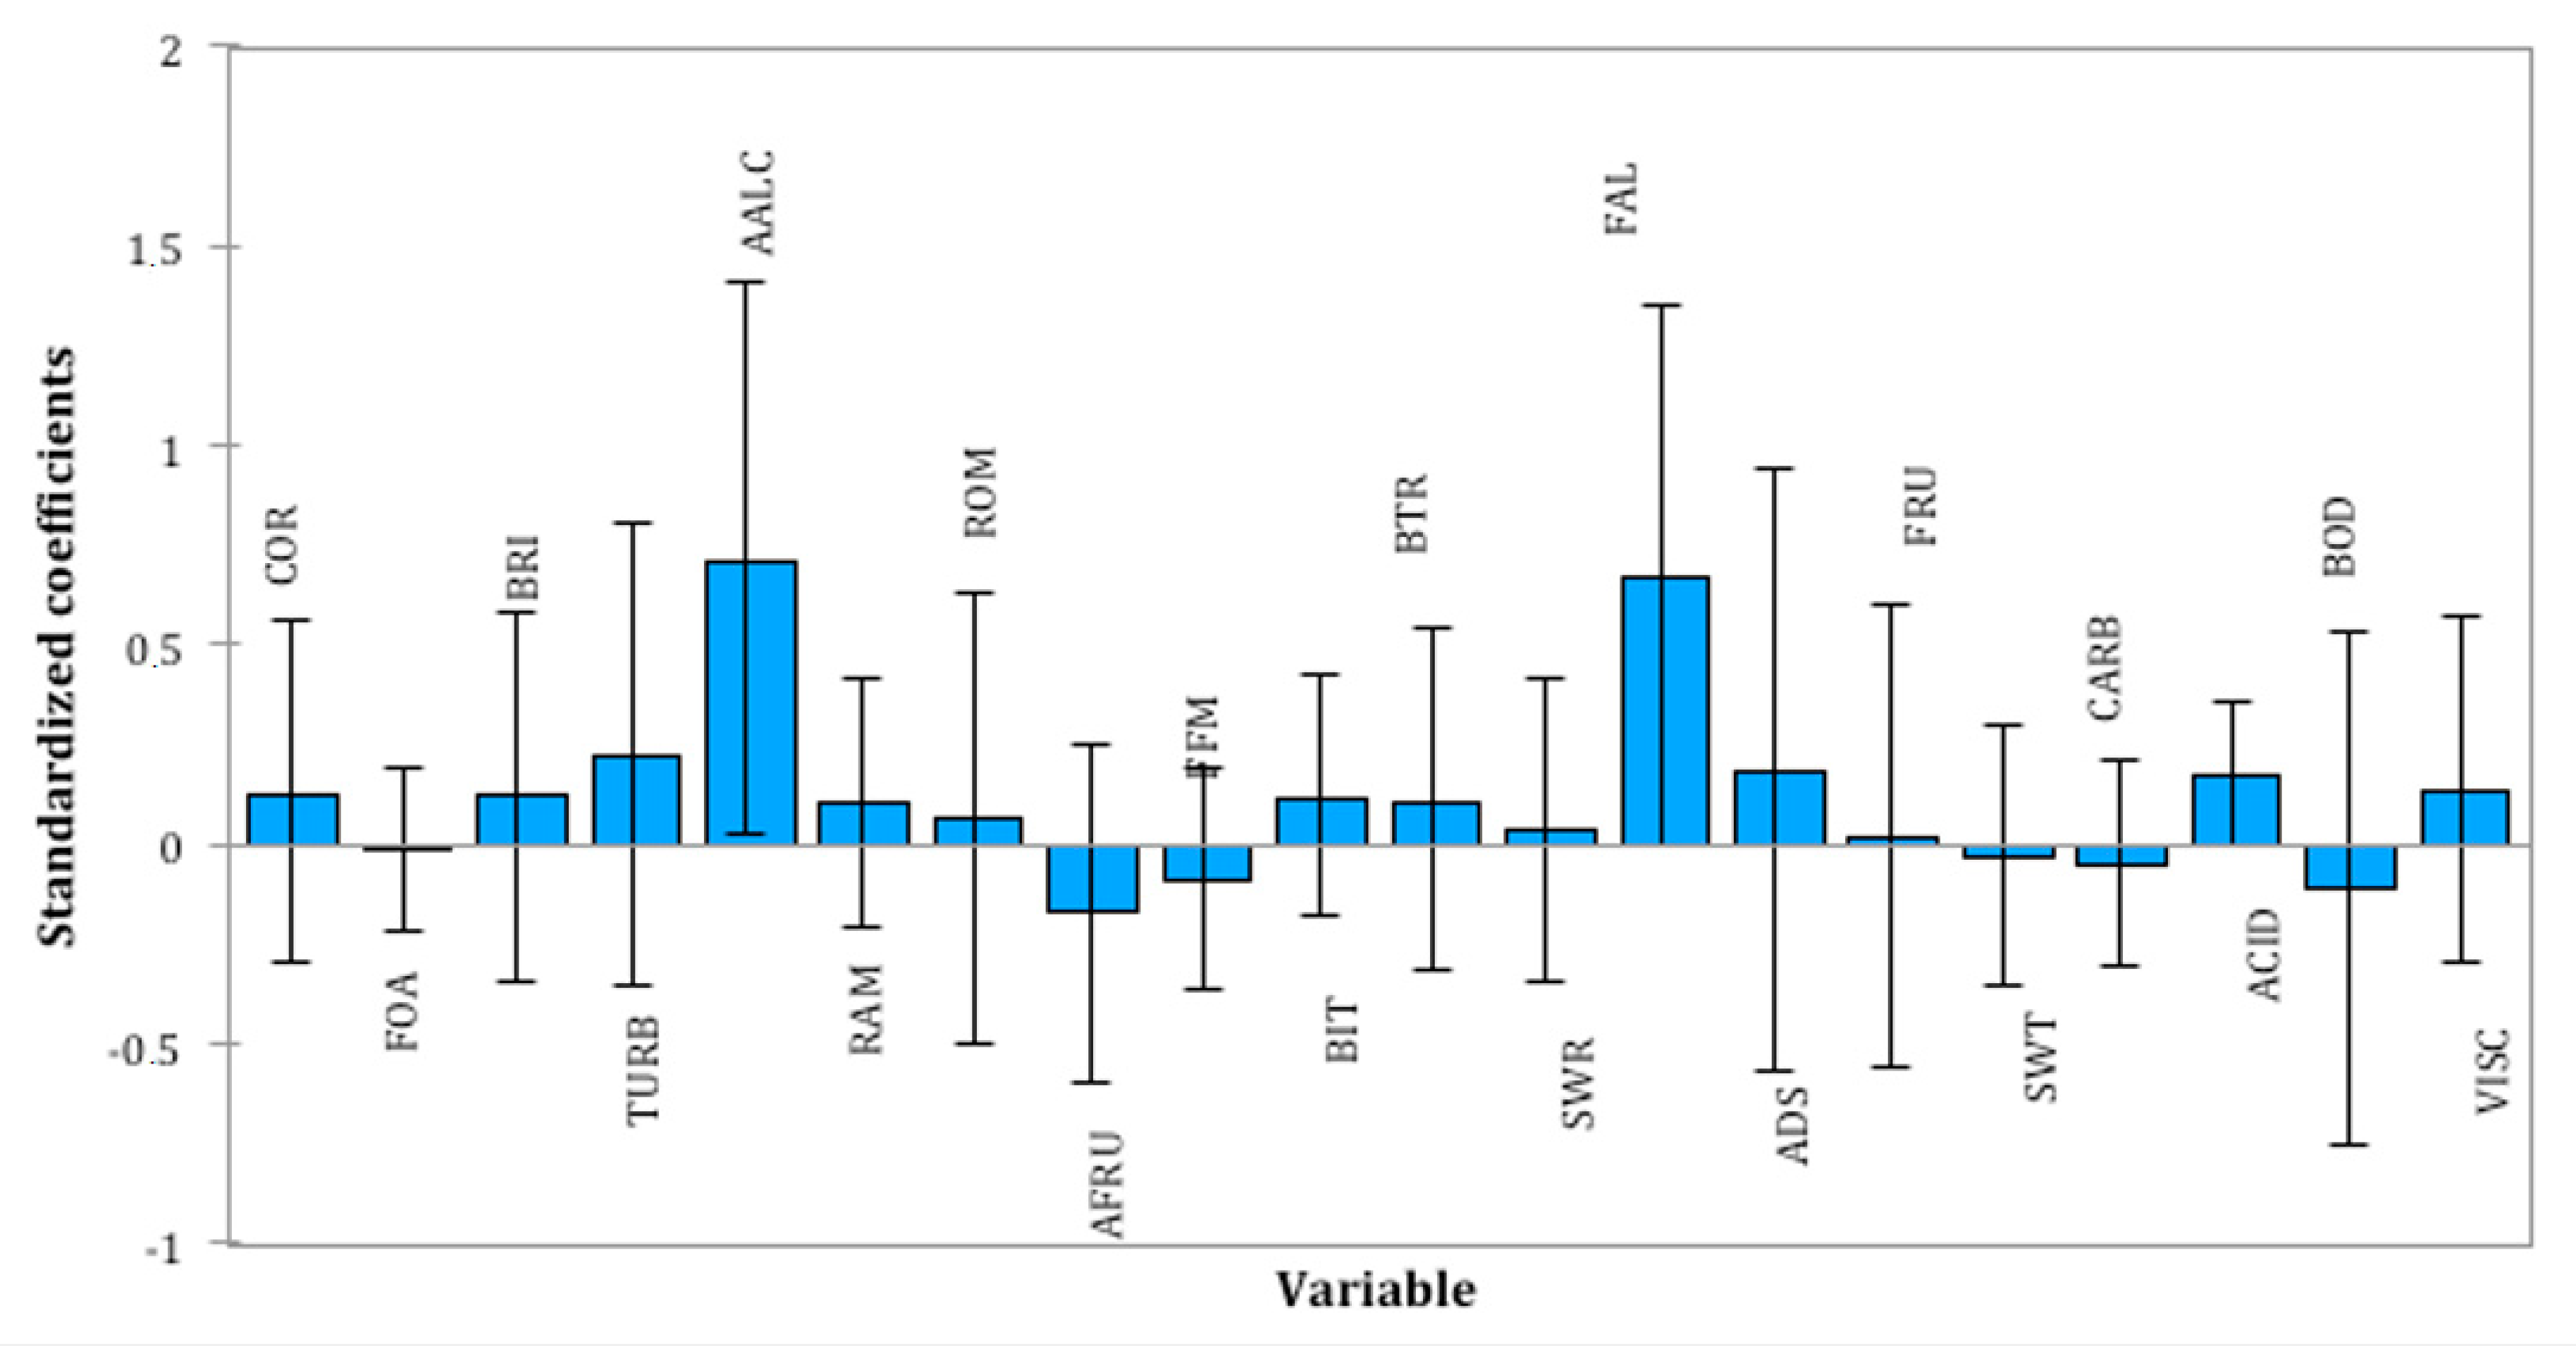
3.1. Quantitative Descriptive Analysis (QDA®)

Table 2 shows the means obtained in the quantitative descriptive analysis (QDA®). No significant differences (p ≤ 0.05) were observed for the attributes brightness, bitter taste, and astringency, suggesting that alcohol does not exert influence in the perception on the samples for these attributes.
As observed in other studies using the same methodology [6,7,8,9,10,11,12,13,14,15,16,17,18,19,20,21,22,23,24], some factors influence the formation of the sensory profile of the samples, such as the presence or absence of the ingredient alcohol in the product.
The samples Alc 3 and Non Alc 3 presented higher scores for the attributes yellow color, malt flavor, and roasted malt aroma, which can be explained due to possible differences in ingredients and in the processing used by the manufacturer during malting in the drying/roasting process, which is directly related to the color and aroma in beers in addition to the different ingredients used by manufacturers [2]. As for the presence of foam, the sample Alc 2 and the sample Alc 3 presented the highest scores, probably due to alcohol and hops, which may interfere with the formation of foam in the product, and based on the fact that each producer uses different ingredients [25,26]. For the attribute body (BOD), the sample Non Alc 3 presented the highest score when compared with the others.
In relation to the alcohol flavor (FAL), alcohol aroma (AALC), raw malt aroma (RAM), and turbidity (TURB), significant differences were found (p ≤ 0.05) between the alcoholic and non-alcoholic samples. The alcohol-containing samples presented higher scores for the descriptors alcohol aroma (AALC) and alcohol flavor (FAL), which was expected, but not favorable for the production of similar products from the sensory point of view once alcohol is considered an essential factor for the choice of product, reinforcing that its presence can affect the sample profile [16].

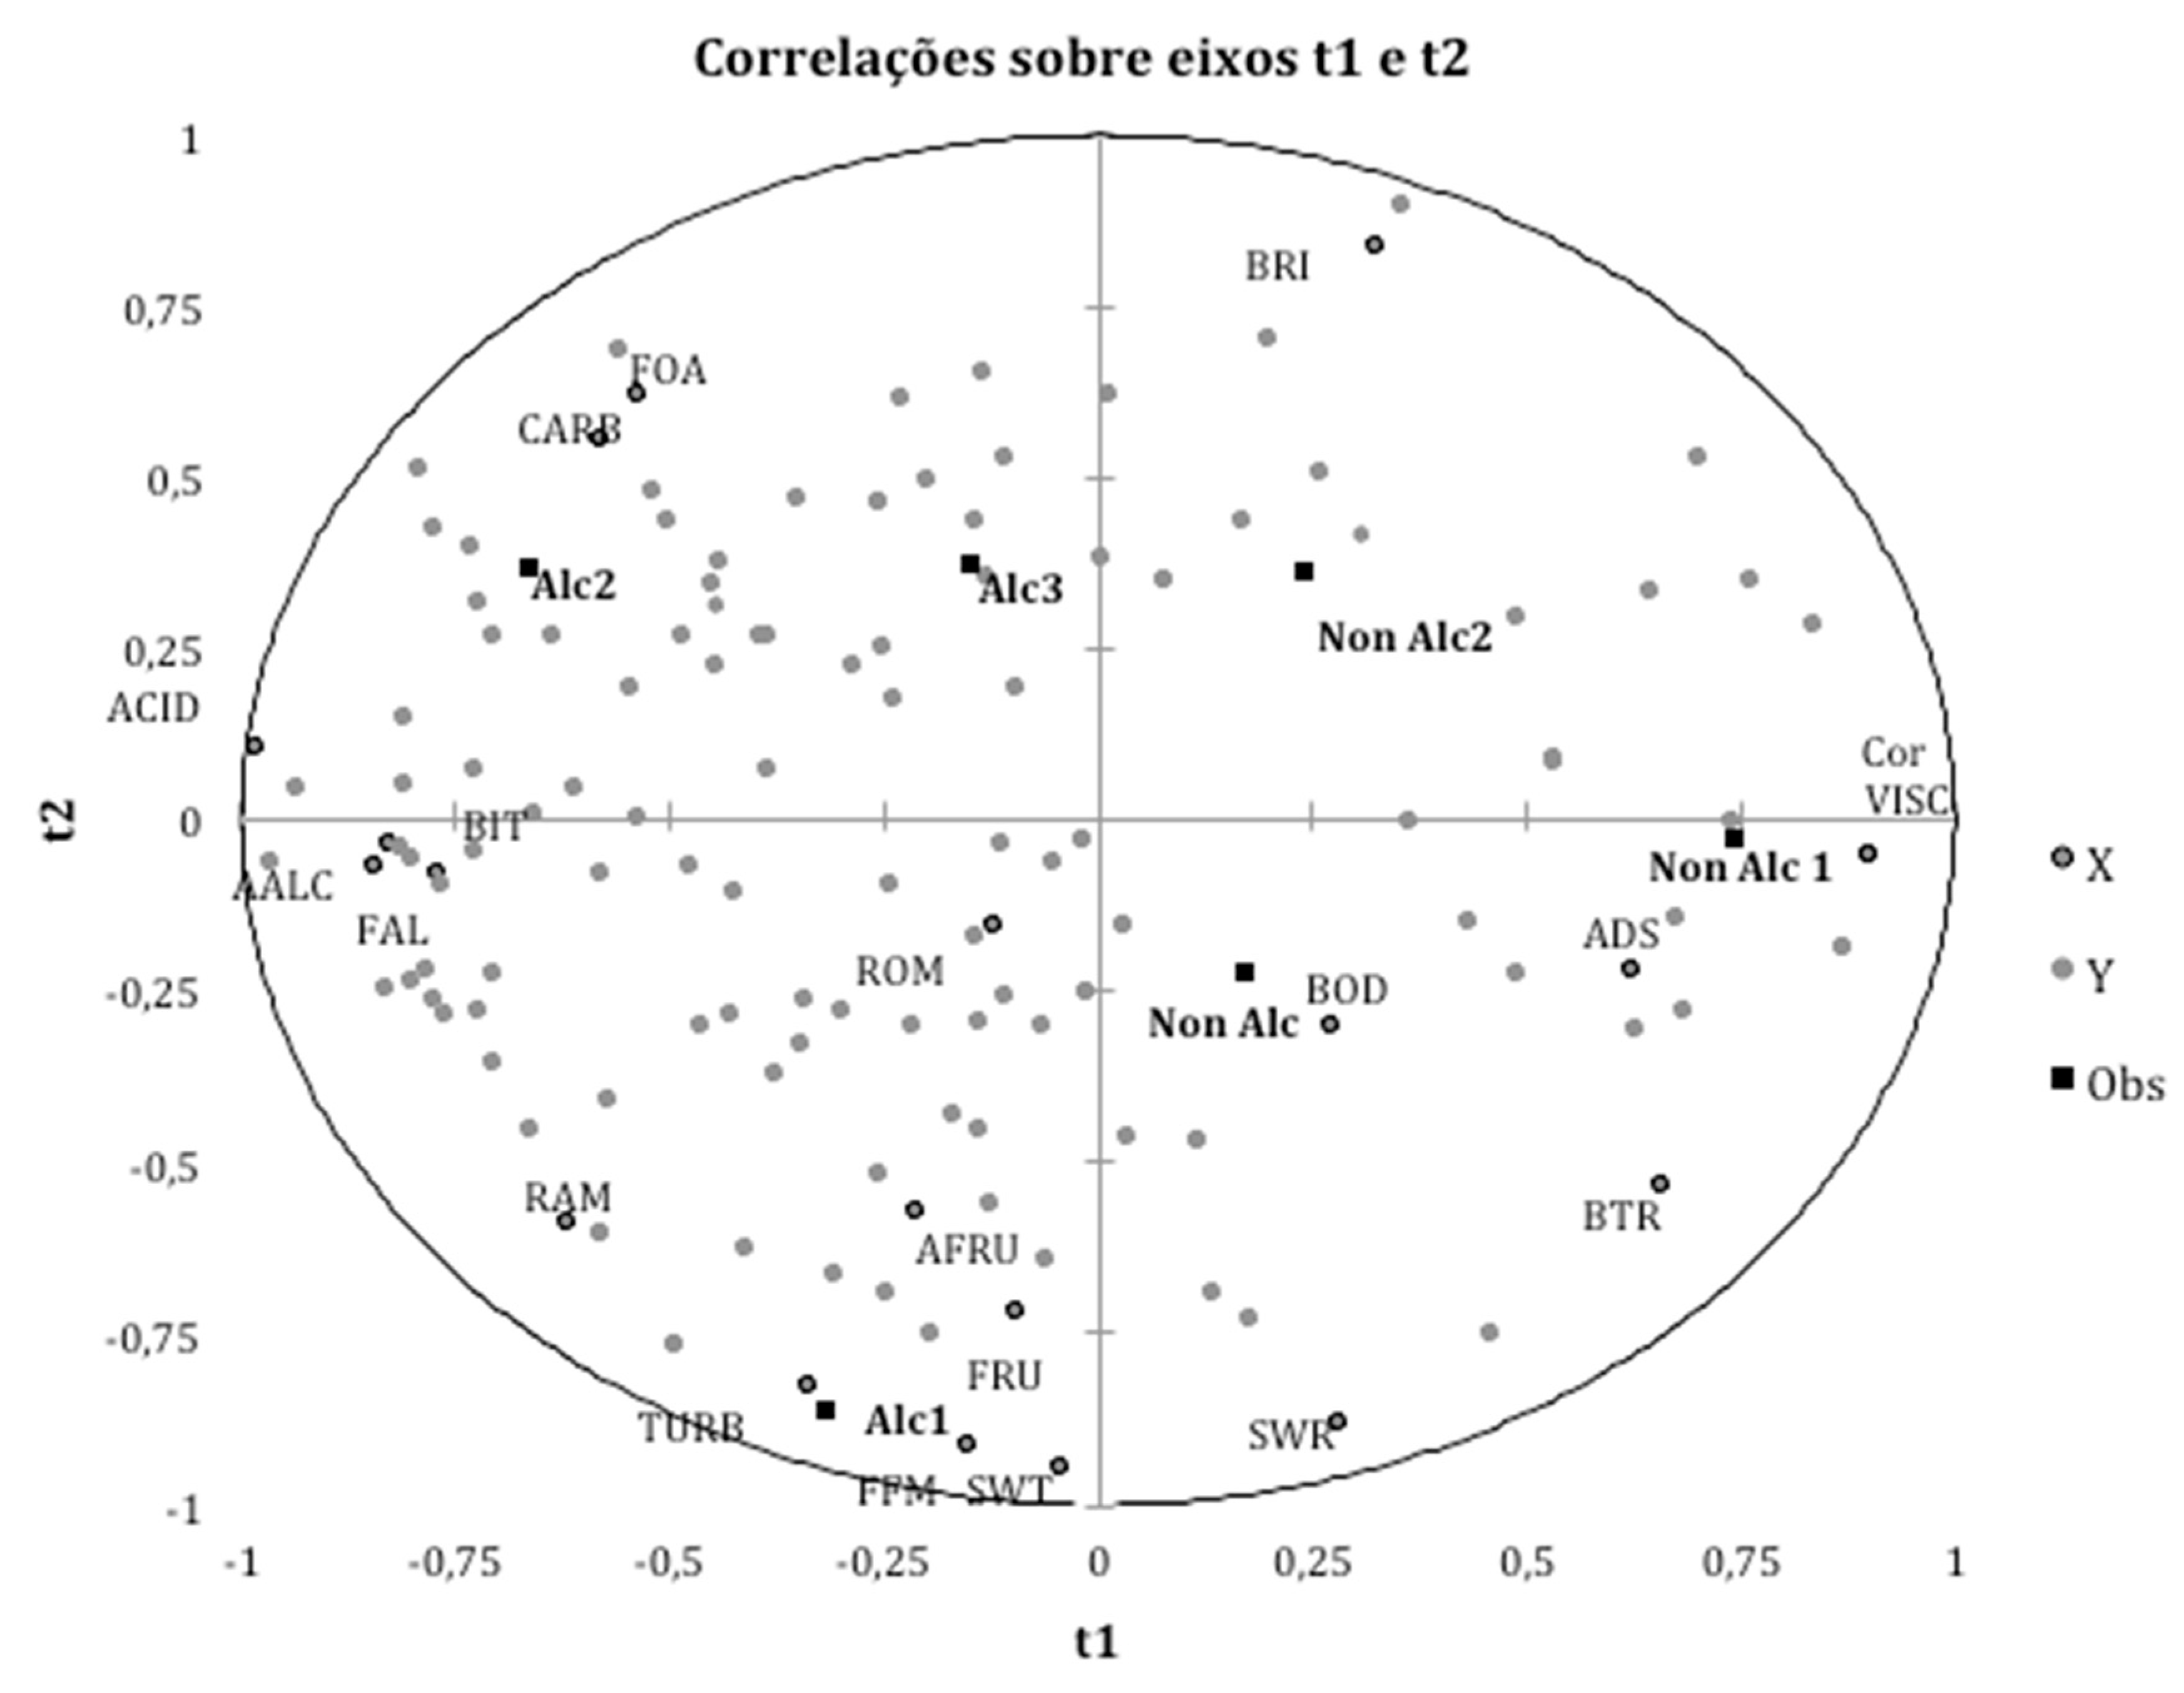
3.2. Relationship between the Descriptive Attributes and Acceptance Test

For global impression, the alcohol samples (Alc1, Alc2 and Alc3) were the most accepted and the sample Non Alc 3 presented the lower mean. With the purpose of evaluating the descriptor terms that contribute positively or negatively to acceptance of alcoholic and non-alcoholic beers, PLS regression analysis was applied to the relationship between the data obtained and QDA® and in the overall liking test. The obtained results can be observed in Figure 1.
Thus, when the standard deviation of a given descriptor term does not overpass the X-axis to the opposite signal (positive crossing over the negative or negative crossing over the positive of standardized coefficients), it can be considered a descriptor term that contributes positively or negatively, according to the variable’s direction, at 95% confidence level [23]. Thus, only the descriptor terms alcoholic aroma (AALC) and alcoholic flavor (FAL) did not cross the X-axis (variable), remaining positive, suggesting that this attributes contributed positively to the consumer´s acceptance of beer samples (p < 0.05).
In addition, the extension of the columns indicates the importance of each attribute for the consumer [27], demonstrating that in this case the alcoholic aroma (AALC) is the attribute that most positively contributes to the acceptance of consumers.
Figure 2 shows the relationship between the data for global impression (overall liking) and the QDA® data using PLS regression. This multivariate analysis can be a useful tool to guide the selection of a subset of relevant attributes from the complete set of descriptor terms. In this figure, the consumers are represented by blue circles located near the preferred samples (squares green). In this way, the samples are located near the descriptor terms that characterized them.
According to the results presented, it is possible to see that the alcoholic samples were the most preferred by consumers, especially the Alc 2 sample, confirming greater consumer rejection in relation to non-alcoholic samples, as suggested by Silva et al. [16]. In addition, it is possible to observe a greater amount of consumers close to the FAL and AALC attributes, suggesting such attributes as the highest preferred drivers of the product.
Different results to the present were found by Araujo et al. [4] in their study with beers, probably because in this study we worked with alcoholic and non-alcoholic beers, and the alcoholic factor possibly provides these differences. In addition, as mentioned by several authors [2,16,17,18,19,20,21,22,23,24,25,26,27,28,29] the different steps used in the processing of non-alcoholic beers may lead to sensory influences in the product, which are identified by the tasters and reflected in the formation of the sensory profile.

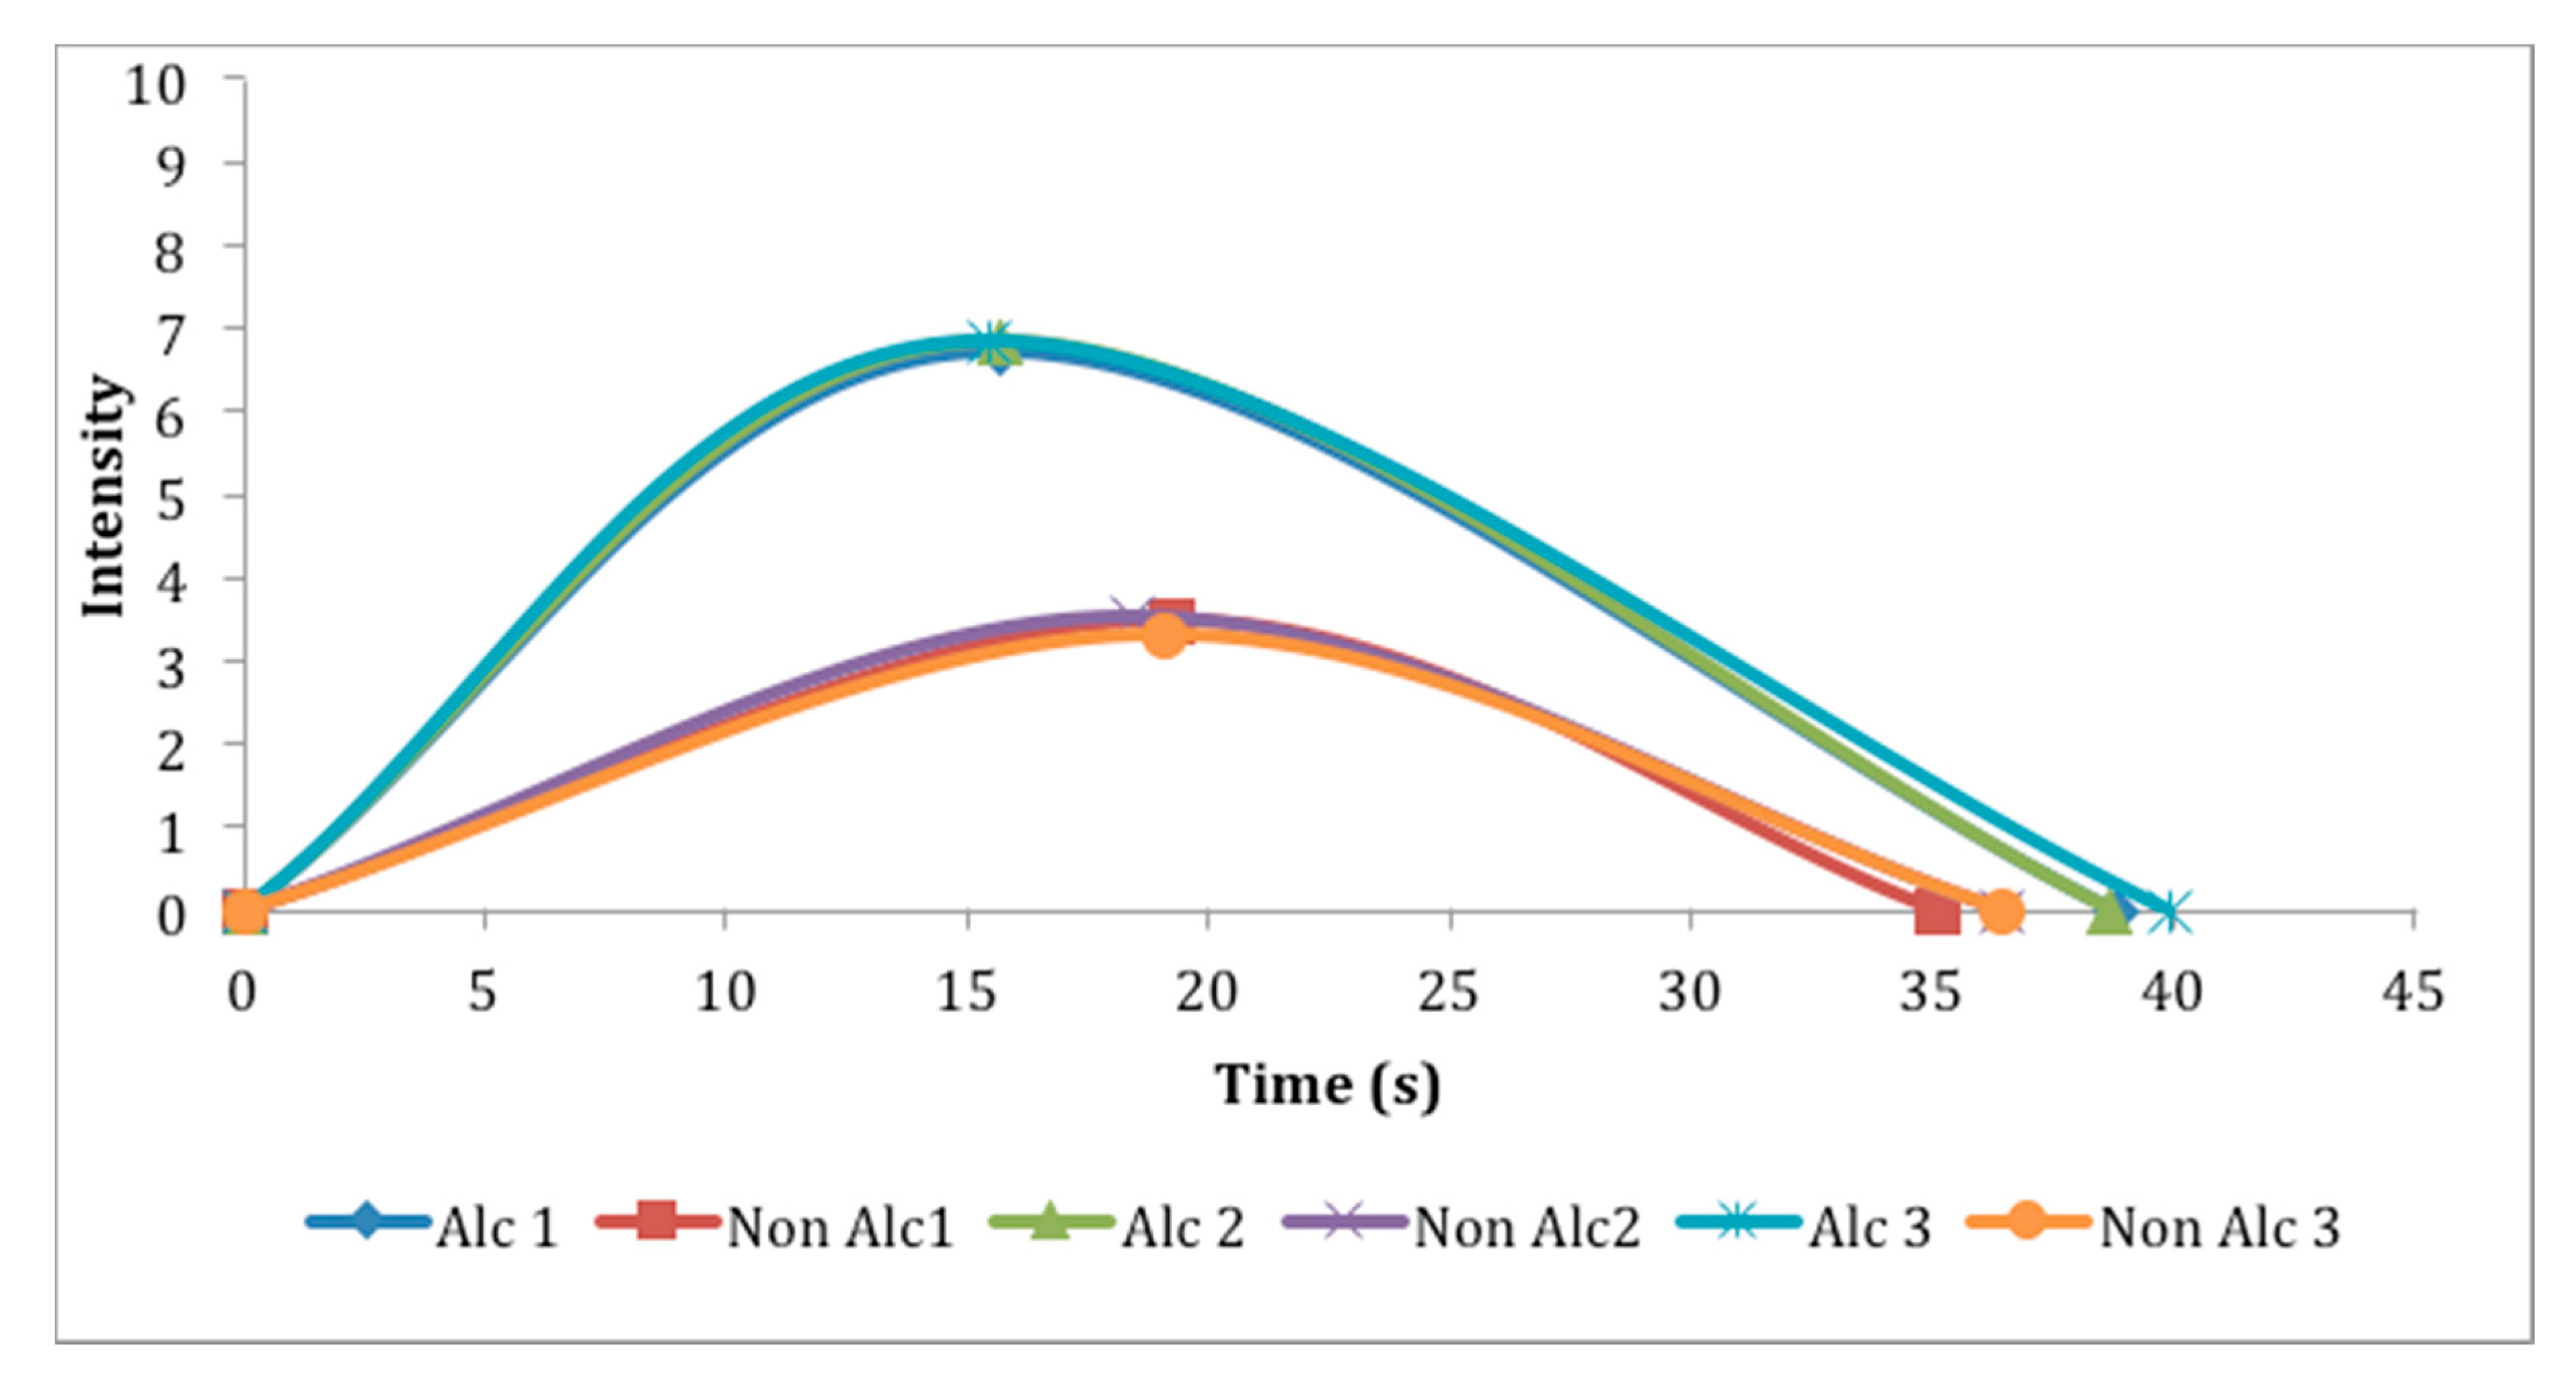
3.3. Time-Intensity Analysis

3.3.1. Time-Intensity Analysis of the Bitter Stimulus

Table 3 shows the results of analysis of variance (ANOVA) and Tukey’s test, in relation to the bitter stimulus reported by the 11 trained assessors; an attribute that is considered of extreme importance for beers [26].
Regarding the maximum time (Timax) and maximum intensity (Imax), the alcohol- containing samples differed significantly from the alcohol-free samples. The traditional samples had higher maximum intensities for the stimulus, while the alcohol-free samples had higher scores for the time of maximum intensity, suggesting an influence of alcohol for these parameters. In relation to area under the curve (Area), the sample Alc 3 remained bitter for a longer period of time, possibly due to the processing and ingredients used by the company in its traditional Pilsen beers [30].
Figure 3 shows the time-intensity curves of traditional Pilsen beer and alcohol-free beer. Table shows that the samples Non Alc1, Non Alc 2, and Non Alc 3 (alcohol-free samples) overlapped in relation to the intensity of the stimulus, as observed too for the samples Alc 1, Alc 2, and Alc 3 (traditional).
The alcoholic samples exhibited a longer duration of the bitter stimulus, suggesting ethanol content affects the perception of bitterness [30]. Moreover, bitterness may be different for each beverage for the same concentration of iso-alpha-acids, depending on the concentration of cis and trans isomers, which can contribute to different bitterness ratios [7].
The results found in relation to the bitter stimulus showed that the traditional samples, exhibited similar dynamic profiles for the total time, as observed for alcohol-free samples, evidencing that the differences in processing and in the ingredients used can cause changes in the consumer’s perception.

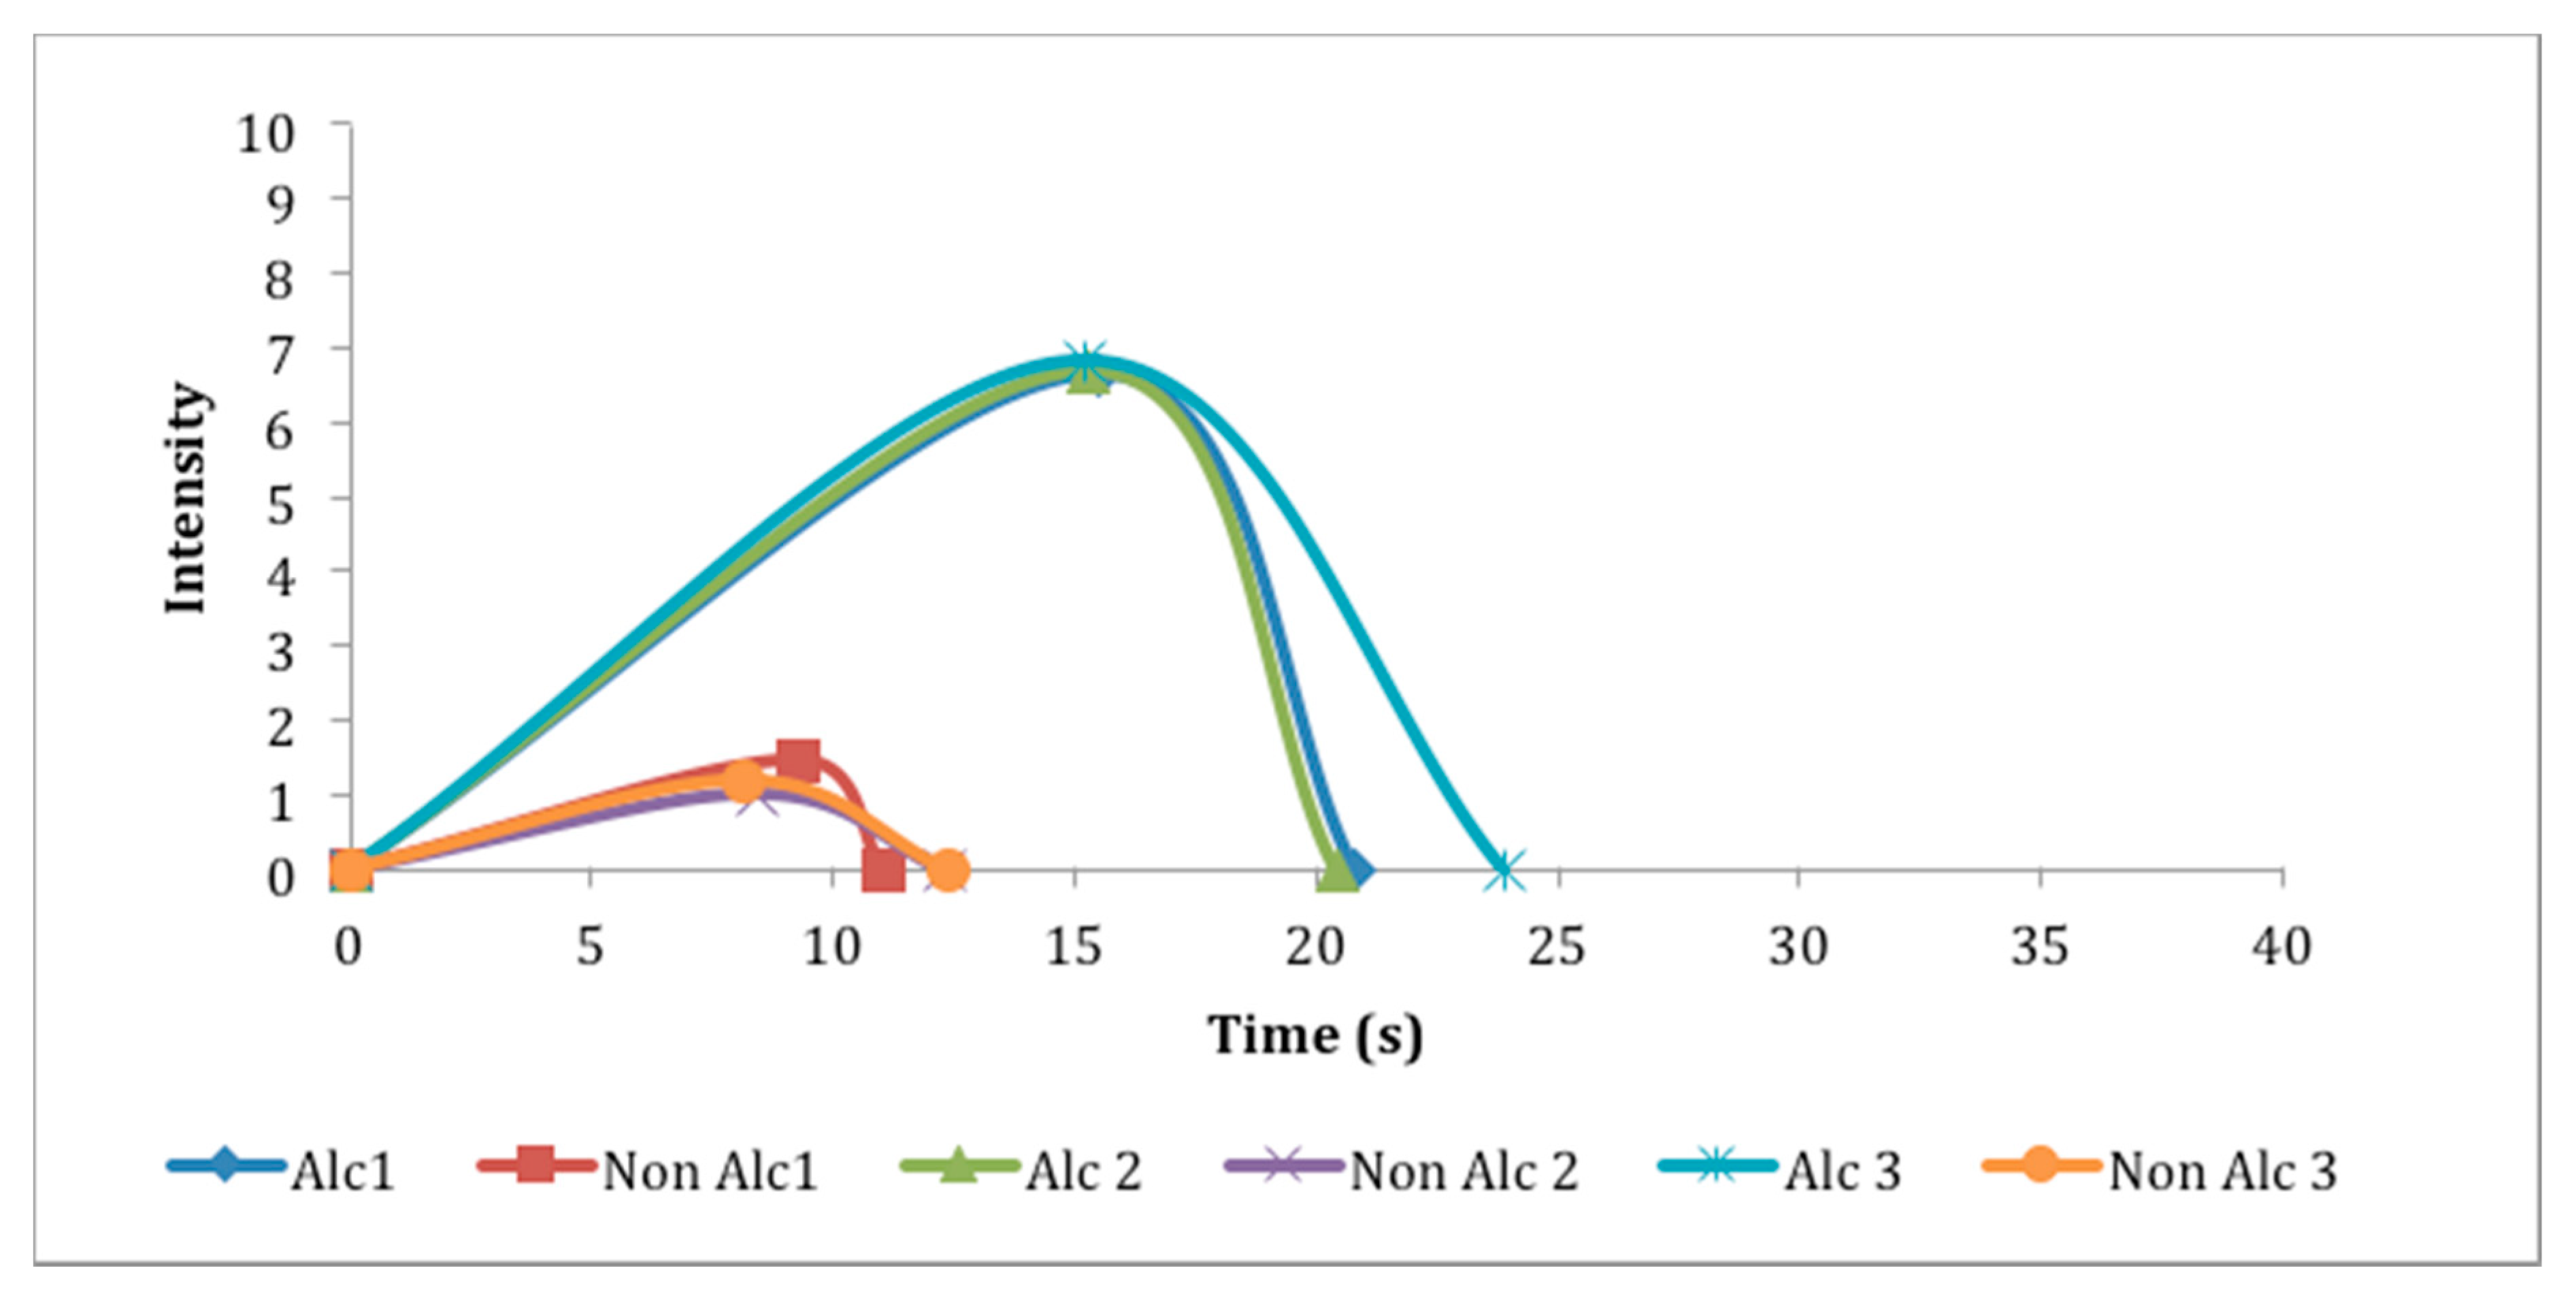
3.3.2. Time Analysis of the Alcoholic Stimulus

Table 4 show the results of the analysis of variance (ANOVA) and Tukey’s test of the 11 assessors for the stimulus alcoholic flavor. For all parameters, the traditional samples presented higher scores, confirming the expected, since they contain alcohol in its formulation.
The alcoholic samples presented the highest scores for maximum intensity (Imax), suggesting a higher alcoholic intensity. In relation to parameters area under the curve (Area) and total time (Ttot), the Alc3 sample presented the highest scores, suggesting that it remained alcoholic for a longer time. Although the information provided by the manufacturer suggested that this sample was the second most alcoholic among those studied, the different forms of processing and ingredients may cause inferences in the perception of this stimulus.
As shown in Figure 4, in which the means of the parameters are used to construct the curves, the samples Alc 1, Alc 2, and Alc 3 (traditional) overlapped in relation to the maximum intensity of the stimulus, despite differing in relation to total time (Ttot).
The non-alcoholic samples 1, 2, and 3 present similar curves to each other; however, the trained panel identified the alcoholic stimulus in the samples of non-alcoholic beers, even this perception being considered low in relation to alcoholic beers, possibly due to the fact that, depending on the manufacturing process, non-alcoholic beers present a very low amount of alcohol, almost imperceptible, but in this case we are dealing with trained assessors, which are more critical and sensitive to perceptions [31,32].
As expected, the duration of the stimulus was higher for the alcohol-containing samples, as can be seen in Table 4, probably due to the presence of alcohol, which activates the receptors that promote the effect of “burning” in the language that is related to the alcoholic perception [33,34].

3.4. Physicochemical Characterization

The alcoholic samples showed (Table 5) higher means for the alcohol content when compared to the non-alcoholic samples, and sample Alc 1 stood out, confirming the information presented on the label.
For the color measurements, significant differences were found (p ≤ 0.05) for the parameter L*, which is associated with brightness, and the Non Alc3 sample (alcohol-free) presented the lowest mean; therefore, the lowest luminosity. The coordinate a* presented positive values, which indicate a sample in the green region, with the highest mean for the Non Alc3 (alcohol-free). The coordinate b* also presented positive results, indicating a sample in the yellow region, with significant differences for all the samples [35,36].

4. Conclusions

In relation to QDA, significant differences, mainly in relation to the attributes alcoholic aroma and alcoholic flavor, were found between the alcoholic and non-alcoholic samples. The correlation between the quantitative descriptive analysis and acceptance tests shown that the alcoholic aroma and the alcoholic flavor contributed as a positive preference driver for the acceptance of the product. In addition, the external preference map demonstrated that the samples most preferred by consumers are those containing the alcohol in its formulation, again demonstrating the influence of the alcohol factor in beer.
The time-intensity analysis, as it is a dynamic methodology, provides a more complete profile of the studied attribute, in this way, it was possible to observe that the alcohol ingredient did not exert a great influence on the perception of the bitter taste, but, for the alcoholic stimulus, as expected, the alcoholic samples showed the higher averages. However, the similarity of processing may have affected the results, since confusion in the evaluation of the assessors was observed for this parameter. In this context, the results presented in this study can be used by the brewing industry to improve the product, besides assisting in the development of new products, since non-alcoholic beers are considered a trend in the market.

Author Contributions

J.A.P., writing of the project and article, practical and theoretical delineation, and data analysis. E.T.F., helped in the interpretation of the data and the practical realization of the tests. H.M.A.B., helped in project design (guiding) and data interpretation. All authors have read and agreed to the published version of the manuscript.

Funding

This research was funded by CAPES, grant number 1415370.

Acknowledgments

The authors thank CAPES for granting the doctoral scholarship and CNPQ to financial support.

Conflicts of Interest

The authors declare no conflict of interest.

References

  1. SINDCERV- Sindicato Nacional da Indústria da Cerveja. Available online: http://www.sindicerv.com.br (accessed on 20 March 2018).
  2. Sohrabvandi, S.; Mousavi, S.M.; Razavi, S.H.; Mortazavian, A.; Rezaei, K. Alcohol- free beer: Methods of production, sensorial defects, and healthful effects. Food Rev. Int. 2010, 26, 335–352. [Google Scholar] [CrossRef]
  3. CervBrasil—Associação Brasileira da Indústria da Cerveja. Disponível em. Available online: http://www.cervbrasil.org.br (accessed on 8 March 2018).
  4. Araujo, F.B.; Silva, P.H.A.; Minim, V.P.R. Perfil sensorial e composição físico—Química de cervejas provenientes de dois segmentos do mercado brasileiro. Ciênc. Tecnol. Aliment. 2003, 23, 121–128. [Google Scholar] [CrossRef] [Green Version]
  5. Stone, H.R.N. Example food: What are its sensory properties and why is that important? Npj Sci. Food 2018, 2, 11. [Google Scholar] [CrossRef] [PubMed] [Green Version]
  6. Morais, E.C.; Morais, A.R.; Cruz, A.G.; Bolini, H.M.A. Development of chocolate dairy dessert with addition of prebiotics and replacement of sucrose with different high-intensity sweeteners. J. Dairy Sci. 2014, 97, 2600–2609. [Google Scholar] [CrossRef] [PubMed]
  7. Cadena, R.S.; Cruz, A.G.; Netto, R.R.; Castro, L.W.; Faria, J.A.F.; Bolini, H.M.A. Sensory profile and physicochemical characteristics of mango nectar sweetened with high intensity sweeteners throughout storage time. Food Res. Int. 2013, 54, 1670–1679. [Google Scholar] [CrossRef] [Green Version]
  8. Stone, H.; Bleibaum, R.N.; Thomas, H.A. Sensory Evaluation Practices, 4th ed.; Academic Press: New York, NY, USA, 2012. [Google Scholar]
  9. Cliff, M.; Heymann, H. Development and use of time-intensity methodology for sensory evaluation: A review. Food Res.Int. 1993, 26, 375–385. [Google Scholar] [CrossRef]
  10. Moraes, P.C.B.; Bolini, H.M.A. Different sweeteners in beverages prepared with instant and roasted ground coffee: Ideal and equivalent sweetness. J. Sens. Stud. 2010, 25, 215–225. [Google Scholar]
  11. Lee, S.M.; Chung, S.J.; Lee, O.H.; Lee, H.S.; Kim, Y.K.; Kim, K.O. Development Of Sample Preparation, Presentation Procedure And Sensory Descriptive Analysis Of Green Tea. J. Sens. Stud. 2008, 23, 450–467. [Google Scholar] [CrossRef]
  12. Damásio, M.H.; Costell, E. Análisis Sensorial Descriptivo: Generación de Descriptores y Selección de Catadores. Rev. Agroquímica Y Tecnol. Aliment. 1991, 3, 165–178. [Google Scholar]
  13. Macfie, H.J.; Bratchell, N.; Greenhoff, K.; Vallis, L.V. Designs to balance the effect of order of presentation and first-order carry-over effects in hall tests. J Sens. Studies. 1989, 4, 129–148. [Google Scholar] [CrossRef]
  14. Meilgaard, M.; Civille, G.V.; Carr, B.T. Sensory Evaluation Techniques, 15th ed.; CRC Press: New York, NY, USA, 2015; p. 171. [Google Scholar]
  15. Amerine, M.A.; Pangborn, R.M.; Roessler, E.B. Principles of Sensory Evaluation of Food; Academic Press: New York, NY, USA, 1965; p. 602. [Google Scholar]
  16. Silva, A.; Jager, G.; Van-Bommel, R.; Van-Zyl, H.; Voss, H.P.; Hogg, T. Functional or emotional? How Dutch and Portuguese conceptualise beer, wine and non-alcoholic beer consumption. Food Qual. Prefer. 2016, 49, 54–65. [Google Scholar] [CrossRef]
  17. University of Campinas—UNICAMP. Helena Maria Andre Bolini. Time-Intensity Analysis of Flavors and Tastes—TIAF: Software. Register 12445-5. Rev. Propr. Ind. 2012, 2151, 178. Available online: http://revistas.inpi.gov.br/pdf/marcas2151.pdf (accessed on 14 July 2020).
  18. AMERICAN SOCIETY FOR TESTING AND MATERIALS INTERNATIONAL—ASTM International. E1909-11: Standard Guide for Time-Intensity Evaluation of Sensory Attributes; ASTM International: West Conshohocken, PA, USA, 2011. [Google Scholar]
  19. Palazzo, A.B.; Carvalho, M.A.R.; Efraim, P.; Bolini, H.M.A. The Determination of Isosweetness Concentrations of Sucralose, Rebaudioside and Neotame as Sucrose Substitutes in New Diet Chocolate Formulations Using the Time-Intensity Analysis. J. Sens. Stud. 2011, 26, 291–297. [Google Scholar] [CrossRef]
  20. Paixao, J.A. Caracterização e Avaliação Sensorial de Bebiba Preparada com Achocolatado em pó, Adoçada com Diferentes Edulcorantes. Master’s Thesis, Universidade Estadual de Campinas-Unicamp, Campinas, Brazil, 2014. [Google Scholar]
  21. Zepka, L.Q.; Borsarelli, C.D.; da Silva, M.A.A.P.; Mercadante, A.Z. Thermal degradation kinetics of carotenoids in a cashew apple juice model and its impact on the system color. J. Agric. Food Chem. 2009, 57, 7841–7845. [Google Scholar]
  22. Brazil. Decreto n° 6.871, de 04 de junho de 2009. MAPA. Regulamenta a Lei n° 8.918, de 14 de julho de 1994, sobre a padronização, a classificação, o registro, a inspeção e a fiscalização da produção e do comércio de bebidas. In Diário Oficial da União; Brazil, 4 June 2009. Available online: http://www.planalto.gov.br/ccivil_03/_Ato2007-2010/2009/Decreto/D6871.htm (accessed on 14 July 2020).
  23. Tenenhaus, M.; Pages, J.; Ambroisine, L.; Guinot, C. PLS methodology to study rela- tionships between hedonic judgements and product characteristics. Food Qual. Prefer. 2005, 16, 315–325. [Google Scholar] [CrossRef]
  24. Ferraz, J.; Esmerino, E.; Lins Silva, A.C.M.; Racowski, I.; Bolini, H.M.A. Sensory profile, drivers of liking, and influence of information on the acceptance of low-calorie synbiotic and probiotic chocolate ice cream. J. Food Sci. 2018, 83, 1375–1385. [Google Scholar]
  25. Rosa, S.E.S.; Cosenza, J.P.; Leão, L.T.S. Panorama do setor de bebidas no Brasil. Bndes Set. 2006, 23, 101–150. [Google Scholar]
  26. Filipe, S.; Ferreira, I.M.P.L.V.O.; Teixeira, N. Poli- peptídeos e proteínas com influência na qualidade da espuma da cerveja e métodos analíticos utilizados em seu estudo. Química Nova 2006, 29, 1326–1331. [Google Scholar]
  27. Silva, P.H.; Faria, F.C. Avaliação da intensidade de amargor e do seu princípio ativo em cervejas de diferentes características e marcas comerciais. Ciênc. Tecnol. Aliment. 2008, 28, 902–906. [Google Scholar] [CrossRef] [Green Version]
  28. Almaguer, C.; Schönberger, C.; Gastl, M.; Arendt, E.K.; Becker, T. Humulus lupulus—A story that begs to be told. A review. J. Inst. Brew. 2014, 120, 289–314. [Google Scholar]
  29. Costa, R.H.K. Produção de Cerveja com Baixo Teor Alcóolico. Master’s Thesis, Universidade de Saõ Paulo, Saõ Paulo, Brazil, 2016; 84p. [Google Scholar]
  30. Catarino, M.; Mendes, A. Non-alcoholic beer—A new industrial process. Sep. Purif. Technol. 2011, 79, 342–351. [Google Scholar] [CrossRef]
  31. Techakriengkrail, I.; Paterson, A.; Taidi, B.; Piggott, J.R. Relationships of sensory bitterness in lager beers to iso-alfa-acid contents. J. Inst. Brew. 2004, 110, 51–56. [Google Scholar] [CrossRef]
  32. Francesco, G.; Turchetti, B.; Sileoni, V.; Marconi, O.; Perretti, G. Screening of new strains of Saccharomycodes ludwigii and Zygosaccharomyces rouxii to produce low-alcohol beer. J. Inst. Brew. 2015, 121, 113–121. [Google Scholar] [CrossRef]
  33. Meyners, M.; Castura, J.C.; Carr, B.T. Existing and new approaches for the analysis of CATA data. Food Qual. Prefer. 2013, 30, 309–319. [Google Scholar] [CrossRef]
  34. Ramsey, I.; Ross, C.; Ford, R.; Fisk, I.; Yang, Q.; Gomez-Lopez, J.; Hort, H. Using a combined temporal approach to evaluate the influence of ethanol concentration on liking and sensory attributes of lager beer. Food Qual. Prefer. 2018, 68, 292–303. [Google Scholar] [CrossRef]
  35. Clark, R.; Linforth, R.; Bealin-Kelyy, F.; Hort, J. Effects of ethanol, carbonation and hop acids on volatile delivery in a model beer system. J. Inst. Brew. 2012, 117, 74–81. [Google Scholar] [CrossRef]
  36. Mcguire, R.G. Reporting of objective color measurements. Hortic. Sci. 1992, 27, 1254–1555. [Google Scholar] [CrossRef] [Green Version]
Figure 1. Preference drivers for partial least squares regression analysis. Abreviations = Yellow Color (COR); Foam Presence (FOA); Brightness (BRI); Turibidity (TURB); Alcoholich Aroma (AALC); Raw Malt Aroma(RAM); Roasted Malt Aroma (ROM); Fruity Aroma(AFRU); Malt Flavor (FFM); Bitter Taste (BIT); Bitter Residual (BTR); Sweet Residual (SWR); Alcoholic Flavor (FAL); Adstringent (ADS); Fruity Flavor (FRU); Sweet Taste (SWT); Acidity (ACID); Viscosity (VISC) Carbonation (CARB); Body (BOD).
Beverages 06 00073 g001
Figure 2. External preference map determined by multiple regression analysis by partial least squares between global impression averages and terms descriptors determined in the QDA (X: Attributes, Y: Consumers and Obs: Samples). Abreviations = Yellow Color (COR); Foam Presence (FOA); Brightness (BRI); Turibidity (TURB); Alcoholich Aroma (AALC); Raw Malt Aroma(RAM); Roasted Malt Aroma (ROM); Fruity Aroma(AFRU); Malt Flavor (FFM); Bitter Taste (BIT); Bitter Residual (BTR); Sweet Residual (SWR); Alcoholic Flavor (FAL); Adstringent (ADS); Fruity Flavor (FRU); Sweet Taste (SWT); Acidity (ACID); Viscosity (VISC) Carbonation (CARB); Body (BOD).
Beverages 06 00073 g002
Figure 3. Time-intensity curves related to the bitter stimulus of Pilsen-type beers of alchool and non-alcoholic beers. Abreviations = Alcoholic Sample 1 (Alc1); Alcoholic Sample 2 (Alc2); Alcoholic Sample 3 (Alc3); Non-Alcoholic Sample 1 (Non Alc 1); Non-Alcoholic Sample 2 (Non Alc 2); Non-Alcoholic Sample 3 (Non Alc 3).
Beverages 06 00073 g003
Figure 4. Time-intensity curves related to the alcoholic stimulus of Pilse beers of alcoholic and non-alcoholic beers. * Abreviations = Alcoholic Sample 1 (Alc1); Alcoholic Sample 2 (Alc2); Alcoholic Sample 3 (Alc3); Non-Alcoholic Sample 1 (Non Alc 1); Non-Alcoholic Sample 2 (Non Alc 2); Non-Alcoholic Sample 3 (Non Alc 3).
Beverages 06 00073 g004
Table 1. Definition of terms descriptors and references used in quantitative descriptive analysis (QDA®).
Appearance
AttributeDescriptionReference
Yellow Color (COR)Color characteristic of Pilsen beerWeak: Brahma beer (Ambev/São Paulo/Brazil) diluted 1:9 Strong: 70 mL of Brahma beer (Ambev/São Paulo/Brazil) + 10 mL Petra black beer (Petropolis Group/Petrópolis/Brazil)
Foam Presence (FOA)Foam that is located on the surface of the sampleWeak: Antarctica beer (Ambev/São Paulo/Brazil) opened 2 h before.
Strong: 100 mL of Antarctica beer (Ambev/São Paulo/Brazil) with 1 tablespoon of Cisne salt (Cisnei/Rio de Janeiro/Brazil), added at the time of analysis
Brightness (BRI)Reflection of light on sample surfaceWeak: 200 mL of canister juice (Maguary/Minas Gerais/Brazil).
Strong: Royal (Kraft Foods/São Paulo/Brazil) pineapple jelly
Turbidity (TURB)Reduced transparency due to the presence of suspended materials that interfere with the passage of light through the fluidWeak: Brahma beer (Ambev/São Paulo/Brazil) diluted 1:9
Strong: 100 mL Eisenbahn wheat beer (Eisenbahn /Blumenau/Brazil)
Aroma
Alcoholic (AALC)Aroma of alcohol, of alcoholic beverageNone: mineral water Bonafonte (Danone/São Paulo/Brazil)
Strong: 80 mL Antarctica beer (Ambev/São Paulo/Brazil) + 10 mL of Zulu alcohol (Zulu Company/ São Paulo/Brazil)
Raw Malt (RAM)Characteristic aroma of barley artificially germinated and driedWeak: Brahma beer (Ambev/São Paulo/Brazil) diluted 1:9
Strong: 30 g of Raw malt in seeds (Tap house brewery/Campinas/Brazil)
Roasted Malt (ROM)Characteristic aroma of barley artificially germinated, dried and toastedNone: mineral water Bonafonte (Danone/São Paulo/Brazil)
Strong: 10 of Brahma beer (Ambev/São Paulo/Brazil) + 2g roasted malt in seed (Tap house brewery/Campinas/Brazil)
Fruity (AFRU)Similar aroma to that of ripe fruitWeak: Brahma beer diluted (Ambev/São Paulo/Brazil) 1:9
Strong: 100 mL of Brahma beer (Ambev/São Paulo/Brazil) + 0.3 g of hops (Tap house brewery/Campinas/Brazil)
Flavor
Malt (FFM)Characteristic taste of barley artificially germinated and driedWeak: Brahma beer (Ambev/São Paulo/Brazil) diluted 1:9
Strong: Eisenbahn Malted Beer (Eisenbahn/Blumenau/Brazil)
Bitter Taste (BIT)Primary taste, promoted by hopsWeak: 200 mL of Antarctic beer sub-zero and 60 mL of mineral water
Strong: 200 mL of Heineken beer
Bitter Residual (BTR)Permanence of the primary taste promoted by hopsWeak: 200 mL of Antarctica beer (Ambev/São Paulo/Brazil) sub-zero
Strong: 200 mL of Heineken beer (Heineken/São Paulo/Brazil)
Sweet Residual (SWR)Permanence of the primary taste promoted by the production of sugarWeak: Brahma beer (Ambev/São Paulo/Brazil) diluted 1:9.
Strong: Sample of beverage prepared from chocolate (Nestle/Araras/Brazil) with addition of 0.0006% of neotame (Sweetmix/Brazil)
Alcoholic Taste (FAL)Alcohol flavor present in the sampleNone: mineral water Bonafonte (Danone/São Paulo/Brazil)
Strong: 200 mL of brahma beer (Ambev/São Paulo/Brazil) with 2.5 mL of Vodka Smirnoff (Smirnoff/Fortaleza/Brazil)
Astringent (ADS)An astringent taste is one that causes mouth mucus, which is part of an ingredient with a high amount of tanninWeak: Brahma beer diluted (Ambev/São Paulo/Brazil)1:9.
Strong: 250 mL of Brahma beer (Ambev/São Paulo/Brazil) + 20 mL of tannic acid
Fruity (FRU)Flavor that resembles fruitWeak: Brahma beer (Ambev/São Paulo/Brazil) diluted 1:9
Strong: IPA beer Colorado diluted 1: 5 (Ambev/São Paulo/Brazil)
Sweet Taste (SWT)Taste related to sugarWeak: Brahma beer diluted (Ambev/São Paulo/Brazil)1:9.
Strong: 200 mL of beer for 6 g of honey (Superbom/São Paulo/Brazil).
Acidity (ACID)Taste sour, like vinegar or lemonWeak: Brahma beer diluted (Ambev/São Paulo/Brazil) 1:9
Strong: Brahma beer (Ambev/São Paulo/Brazil) with 0.1% acetic acid
Textura
Body (BOD)Popping the sample into the mouthWeak: Brahma beer (Ambev/São Paulo/Brazil) diluted 1:9
Strong: 200 mL of Eisenbahn wheat beer (Eisenbahn/Blumenau/Brazil)
Viscosity (VISC)Sample flow in the throatWeak: Brahma beer diluída 1:10 (Ambev/São Paulo/Brazil)
Strong: 150 mL of Eisenbahn wheat beer (Eisenbahn/Blumenau/Brazil)
Carbonation (CARB)Perception of blisters in the oral cavityWeak: Aquarios Fresh (Coca-Cola/Brazil), opened 2 h before
Strong: Antarctica soda (Ambev/São Paulo/Brazil) shaken 5 times before of the analysis
Table 2. Averages * of the descriptor terms of traditional Pilsen beers samples (alcoholic and non-alcoholic) found using the quantitative descriptive analysis (QDA®).
Descriptors TermsAlc 1Non Alc1Alc 2Non Alc2Alc 3Non Alc3
Yellow Color (COR)2.630 c3.000 c2.470 c2.690 c4.830 b6.860 a
Presence of Foam (FOA)4.810 d4.930 d8.170 a6.080 c7.300 b7.230 b
Brightness (BRI)4.110 a4.710 a4.620 a4.560 a4.780 a4.570 a
Turbidity (TURB)1.490 c0.840 e2.340 a0.520 f1.340 d1.690 b
Alcohol Aroma (AALC)6.680 c0.004 d7.020 b0.001 d7.680 a0.000 d
Raw Malt Aroma (RAM)4.540 a3.100 c4.180 a2.910 c3.650 b4.490 a
Roasted Malt Aroma (ROM)2.880 b2.000 c2.120 c2.090 c4.060 a4.090 a
Fruity Aroma (AFRU)2.550 b1.720 c1.820 c1.720 c1.760 c2.960 a
Malt Flavor (FFM)2.760 c2.890 c2.880 c2.820 c4.660 a3.252 b
Bitter Taste (BIT)4.300 a3.850 a3.850 a3.870 a3.940 a3.880 a
Taste Residual Bitter (BTR)3.890 ab4.210 a2.140d3.090 c3.810 b4.050 ab
Sweet Residual Taste (SWR)1.830 a1.520 b0.650 c0.490 c0.520 c1.840 a
Alcoholic Flavor (FAL)7.400 b0.000 c7.650 a0.003 c7.690 a0.002 c
Astringency (ADS)2.110 a2.260 a2.060 a2.080 a2.020 a2.020 a
Fruity Flavor (FRU)1.720 b1.500 b1.720 ab1.130 c1.200 c1.990 ab
Sweet Taste (SWT)1.630 a1.180 b1.030 b1.160 b1.050 b1.200 b
Acidity (ACID)2.550 b3.060 a2.860 ab2.310 b2.510 b2.340 b
Body (BOD)3.010 b3.140 b2.980 b2.860 b3.010 b3.720 a
Viscosity (VISC)2.630 ab3.110 a2.470 b2.690 b2.830 ab2.860 ab
Carbonation (CARB)4.990 d4.680 e7.780 a6.000 c7.070 b7.130 b
* Means in the same row accompanied by the same letter are not significantly different by the Tukey test.
Table 3. Averages of the scores attributed by the time-intensity team to the bitter stimulus in alcoholic and non-alcoholic Pilsen beer samples.
AttributeAlc1Non Alc1Alc2Non Alc2Alc3Non Alc3
Imax6.74 a3.49 c6.84 a3.52 b6.85 a3.30 b
Timax15.63 c19.23 a15.64 c18.41 b15.41 c19.05 ab
Ttot38.80 b35.10 d38.68 b36.39 c39.88 a36.40 c
Area74.60 b61.99 d61.56 d50.50 e81.42 a69.82 c
Averages marked with equal letters on the same row do not differ statistically (p ≤ 0.05) by Tukey’s mean test. Imax = maximum intensity; Timax = time maximum intensity; Ttot = total time; Area = area under the curve.
Table 4. Averages of the scores attributed by the time-intensity team to the alcoholic stimulus in alcoholic and non-alcoholic Pilsen beer samples for the evaluated attributes.
AttributeAlc1Non Alc1Alc2Non Alc2Alc3Non Alc3
Imax6.68 a1.49 b6.71 a1.04 b6.85 a1.22 b
Timax15.50 a9.23 b15.27 a8.41 c15.20 a8.15 c
Ttot20.80 b11.02 d20.39 b12.33 d23.87 a12.40 c
Area74.54 b41.51 c74.28 b40.50 d81.42 a40.82 d
Averages marked with equal letters on the same row do not differ statistically (p ≤ 0.05) by Tukey’s mean test. Imax = maximum intensity; Timax = time maximum intensity; Ttot = total time; Area = area under the curve.
Table 5. Results found for the alcohol contentand color (L *, a * and b *) analyses by means of the Tukey and ANOVA test.
ParametersAlc1Non Alc2Alc2Non Alc2Alc5Non Alc6
Alcohol content5.1 a0.0 d4.3 c0.0 d4.7 b0.0 d
L *83.0 a80.5 c82.1 b79.1 d80.4 c38.8 c
a *0.3 e0.7 d0.1 f1.7 b0.8 c2.6 a
b *31.5 f34.4 e34.6 d44.2 a40.0 b38.8 ba
* Averages marked with equal letters on the same row do not differ statistically (p ≤ 0.05) by Tukey’s mean test.

