
USA Mid-Atlantic Consumer Preferences for Front Label Attributes for Local Wine


1
Department of Food Science, The Pennsylvania State University, University Park, PA 16802, USA
2
Sensory Evaluation Center, The Pennsylvania State University, University Park, PA 16802, USA
3
Department of Plant Science, The Pennsylvania State University, University Park, PA 16802, USA
*
Author to whom correspondence should be addressed.
Beverages 2021, 7(2), 22; https://0-doi-org.brum.beds.ac.uk/10.3390/beverages7020022
Submission received: 11 March 2021
/
Revised: 16 April 2021
/
Accepted: 21 April 2021
/
Published: 23 April 2021
(This article belongs to the Special Issue Feature Papers in Sensory Analysis of Beverages Section)
Abstract
:The purpose of this research was to investigate Mid-Atlantic USA wine consumers’ preferences for front wine label attributes for a lesser-known/unknown local wine variety. The wine consumer base in this part of the USA exceeds that of California. Although the mid-Atlantic is experiencing an increase in the number of wineries, there is a lack of region-specific consumer research that could be the basis for marketing strategies that may differ from those in more established wine regions, such as CA. We recruited 1011 mid-Atlantic consumers who drank wine (at least 1×/month) to view variations of a wine label, differing in wine tag, location description, font types, and images in a choice-based conjoint experiment. A greater percentage of consumers selected the “White Wine” tag and scripted fonts than the other options, with a generalized county text (“Proudly produced in Lehigh County, PA”) being selected by more participants than the American Viticultural Area (AVA) (“Lehigh Valley AVA”) or state (“Pennsylvania”) texts; however, the location text had a lower importance than the wine tag variable. This study implies that a generalized county text that describes a more specific location where the grapes were grown may be more favorable to mid-Atlantic consumers in comparison to AVA or state texts, and that traditional images and generic wine labels are more preferable than wine labels they have not seen before and more contemporary label styles. Wineries in the mid-Atlantic region may want to add generalized county texts to their labels to appeal to the regional audience. As AVAs are used to promote specific wine regions in the USA, and only some consumers choose wines based on these designations, governments and marketing organizations may want to increase education on local AVAs to increase consumer awareness and interest. In addition, consumer differences in variety-seeking behavior and subjective as well as objective wine knowledge, but not attitudes toward locally produced foods, affected wine label choice: Consumers scoring higher in variety-seeking and wine knowledge preferred the specific wine varietal over the generic wine tag; similarly, consumers that indicated familiarity with the wine varietal also preferred the specific wine tag over the generic label. Differences in consumer psychographics appear to modulate front wine label preferences.
1. Introduction
Vidal blanc is a hybrid grape variety that grows well in the climate of the northeast and mid-Atlantic regions of the USA but is relatively unknown by consumers in the wine market. As such, many winemakers do not sell their wines made from this grape under a Vidal blanc name but use general terms or non-grape names for their wines (e.g., “The Huntress” (Galer Estate Vidal blanc wine, Pennsylvania), “Joy White” (Cross Keys Vidal blanc wine, Virginia). Familiarity is known to affect consumer decisions, such as perceived appropriateness of use [1], implying that more familiar wines or wine types increase consumers’ imagined use cases and, therefore, increased interest. The Pennsylvanian climate is not suited for producing many of the well-known grape varieties that are familiar to consumers, such as Vitis vinifera varieties; the cool and wet climate is more preferential to less commonly recognized varieties, including hybrid varieties such as Vidal blanc [2].
Even though Pennsylvania (PA) is the sixth-largest wine-producing state in the country, it is not as well known by consumers as California or New York [3]; however, the PA wine industry has experienced continuous growth over the past decade and is developing into a solidified professional industry. For PA wineries, the majority selling less than 10,000 cases per year, cellar door purchases and wine tastings on-site are common income streams [4], supported by the proximity to major metropolitan areas in PA and neighboring states (mid-Atlantic states of New York, Pennsylvania, New Jersey, Virginia, Maryland, West Virginia, and Washington, DC, and Ohio).
According to the National Institute on Alcohol Abuse and Alcoholism (NIAAA), wine consumption in this region exceeds that of California (148,347,000 vs. 176,539,000 gallons in 2016) [5], demonstrating the size of the consumer base. While there has been an increase in consumer research conducted on these wine consumers, the increase in the number of wineries in the region and size of the market deserve greater attention and more region-specific marketing strategies that may be in contrast to what is appropriate for wine regions in states (e.g., CA) and countries (e.g., Australia) with a more greatly established wine industry.
In researching the USA wine market with Philadelphia, PA, and New York City, NY, consumers, Kelley et al. [6] found that even among those residing in these mid-Atlantic cities, only 37% had ever consumed PA wine. Potential reasons for this include an industry made up of many small-scale producers and the importance of direct-to-customer sales in Pennsylvania, where context and experience will drive local consumers toward a purchase. However, with the introduction of wine into supermarkets and other less specialized stores across the state in 2016 [7], local wines are now being seen at higher frequencies in direct comparison to their regional, national, and global competitors. With Pennsylvanian wines coming under new scrutiny in mass-market comparisons, and with the relative unknown existence of Vidal blanc, this research aims to investigate mid-Atlantic USA wine consumers’ preferences for front wine label attributes for a lesser-known/unknown local wine variety such as Vidal blanc, produced in a lesser-known wine region, such as Pennsylvania. Results from this study will be useful for producers to design their labels and sell their wines.
The front wine label is seen as one of the largest influencing factors of purchase among consumers [8,9,10]. The information presented on the label, through images and text, is influential in picking up and purchasing a bottle of wine. Chrea et al. [11] found that hedonic liking of wine labels was indicative of consumer choice, emphasizing the importance of appealing wine labels. For these reasons, wineries often contract their wine labels to be created by artists. Color [12,13], text font [14], location of origin [15,16], and wine name [17,18] on the front wine label have all been found to affect consumer response.
In their analysis of understanding typical and atypical packaging colors, Garaus and Halkias [12] compared gold and purple packaging for sparkling wine, finding that consumers were less skeptical of the “typical” gold packaging, as analyzed by typicality and skepticism scales. Lick et al. [13] also found that consumers’ flavor expectations varied based on the wine label color of red wines, with red and orange associated with fruity and flowery flavors, and red and black associated with tangy flavors. These studies show that color choice of the front wine label is an important factor in communicating with and conveying information to consumers.
In their analysis of font types, Gmuer et al. [14] found that a high fluency font (one that is easy to read) increased the hedonic values of a wine, even though participants rated the low fluency font (a hard-to-read script) as more elegant. However, in this study, participants were asked to read both a front and back wine label, where the back label included a paragraph of information, which may have influenced the preferred results of the study as not all wine consumers read the entirety of a label when they make their purchase decision.
Region of origin has been studied many times in conjunction with wine labels, as it is one portion of a wine label that can give some indication to consumers of what is in the bottle. Sáenz-Navajas et al. [15] found that region of origin was important to wine quality judgments in both an imitation auction context and a categorization task with French consumers. Veale and Quester [16] found that in the case of trying wines while looking at a label, the stated wine origin overrode the participants’ own sensory perceptions. Wine from a bottle with a well-known wine region on the label was perceived as higher in quality than the same wine in a bottle labeled with an unknown wine region. This concept was also confirmed by Guidry et al. [19] who involved Texan students in a study and found that the same wine labeled as originating from France was preferred over wine labeled as originating from Texas. Lockshin et al. [20] reported that region of origin affected consumer choice, where a region with high awareness increased purchase likelihood in a choice experiment. The size of the effect was partially modulated by consumer involvement and the presence of medals, with a gold-medal wine from a high-awareness region losing favor with consumers that showed less wine involvement, as assessed by the wine involvement scale developed by Lockshin et al. [21].
Different names for the same wine were studied in the Australian market between 2011 and 2016 [17], finding that for premium wines, the French synonymous variety name would incur a price premium compared to the non-French name (e.g., Syrah vs. Shiraz, Pinot Gris vs. Pinot Grigio). Sherman and Tuten [18] compared traditional, contemporary, and novelty wine label designs for three fictitious brands of Yakima Valley, WA, and Petite Syrah wines. They found that traditional labels with regard to brand name and label design seem to be more appealing to wine consumers than other styles of wine label; however, in their study, the same variety (Petite Syrah) was displayed on each label.
A method to discover the important qualities of a multifaceted product is conjoint analysis [22,23]. Conjoint analysis has been used many times to study aspects of wine labels to understand consumer wine choice and preference [11,16,20,24]. Scientifically, the ability to look at a large group of factors and levels in an experiment is usually limited by time, money, and sample. However, conjoint analysis as a designed experiment can uncover the importance of different categories as well as reveal potential interactions between them. Choice experiments also allow participants to evaluate many different conditions in a short amount of time by using an experimental design structure, making this methodology a versatile and very helpful way to reveal consumer product choice. Ultimately, conjoint analysis highlights the compromise that consumers make when choosing a product where they have to find their best trade-off with competing product categories. Choice-based conjoint analysis (CBCA) is a fast method that mimics in-store decisions—instead of rating each variation on a scale, consumers are selecting which option they would pick—which is more typical of a purchase experience. Here, CBCA was used to quantify the importance of different wine front label factors for a Vidal blanc wine from Pennsylvania. This study focused on PA wine consumer perception, as prior research has shown that the importance of place of origin is dependent on perceived consistent match with the product [25]. Specific to this study, we were interested in the importance of location and wine type on consumer perception of wines produced in close geographical proximity to the consumer [26].
Wine consumers are often grouped based on their behaviors, attitudes, knowledge, interests, engagement, and other such psychographic attributes in order to better understand their choices. In this study, we were interested which psychographic factors might affect the selection of front wine labels that featured a lesser-known, hybrid variety, Vidal blanc, and used different location texts, as well as how these factors possibly interact. Therefore, multiple psychographic scales were employed to better understand the consumer respondents. Variety-seeking (VARSEEK) behavior [27] has been studied in a wine context in the USA [28], and this scale was used to learn if those interested in new things may be more likely to choose an “unfamiliar” variety over a generic one. Subjective and objective wine knowledge may also play a role. If Vidal blanc has been heard of before, or if the consumer thinks they know what Vidal blanc is, they may be more interested than an unfamiliar or uninterested consumer [29]. Lastly, an attitudinal score for local-seeking behavior, termed “Locavores” [30], was used to see if different gradations of a locally produced wine were important for consumers when making their choices, as we surveyed consumers that live in or in close proximity to PA, where a majority of wine producers generate their main income through cellar door purchases and wine tastings on-site [4].
We hypothesize that (i) wine consumers, when presented with varied wine labels, will in general prefer more generic wine tags (e.g., white wine and white table wine) over more specific, unknown wine varieties, such as Vidal blanc; however, that may differ for those consumers that have had prior experiences with the unknown wine variety. We further hypothesize that (ii) a region-of-origin text that is perceived as regulated (e.g., an American Viticultural Area (AVA) location) will drive consumer choice, and that (iii) differences in wine label preference will be informed by differences in consumer psychographics (e.g., variety-seeking behavior, attitudes toward locally produced foods, subjective and objective wine knowledge).
2. Materials and Methods
2.1. Wine Labels
The created front wine labels differed in four attributes: Font, Image, Wine Type, and Location Text, as seen in Table 1. Bottle price, although important, was not included as an attribute for several reasons: although price is an important factor in wine-purchasing decisions [31], bottle price importance depends on the retail outlet from which it is purchased (e.g., grocery store vs. wine store vs. on-site of a winery) [32]. The median bottle price in the USA ranges from USD 10 to 15 [33], with typical V. vinifera wines produced in PA selling for around USD 18/750 mL [34] in retail outlets, making it less feasible for PA producers to compete based on price.
Nine labels were created in Adobe® Illustrator (Creative Cloud version 23.1, Adobe Inc., San Jose, CA, USA). The label design was based on the hedonic scores of four different versions in a pre-survey with 739 respondents (data not shown), where the chosen design was significantly more liked (F(32,952) = 9.51; p < 0.00001) than the other three versions. The fictitious winery name was created by the researchers to both sound believable and typical of a Pennsylvanian wine experience regardless of region (Mallard ducks are a common sight in parks in Pennsylvania). “Critter labels” have been used many times to gain interest among wine consumers, and local animals can portray ideas of the local experience [18]. The yellow/gold background color was based on a “typical” wine label [12] and is also a frequently used color in Bordeaux wine labels [9].
The wine tags selected were Vidal blanc, the hybrid grape of interest, as well as two different generic wine tags, White Wine and White Table Wine. These were selected as Vidal blanc wines are often given a generic descriptive tag in Pennsylvania (e.g., white wine), instead of labeling it with its varietal name (even if it is 100% that variety), assumingly due to consumer unfamiliarity.
The location texts used were meant to discern the importance of appellation of origin of lesser-known wine regions to mid-Atlantic wine consumers. In the USA, the appellation-of-origin statements on labels only indicates a minimum percentage of grapes coming from the labeled appellation, which can be a country, a state, a county, or an approved American Viticultural Area (AVA). However, in contrast to other countries, appellation-of-origin labels in the USA only concern geographical boundaries and do not bear any quality connotations, as for example, the French or the Italian controlled and guaranteed origin denomination systems. In addition to a geographical appellation of a state and an AVA, a generic county text was included as an option, as some Pennsylvanian wineries use similar texts on their front labels.
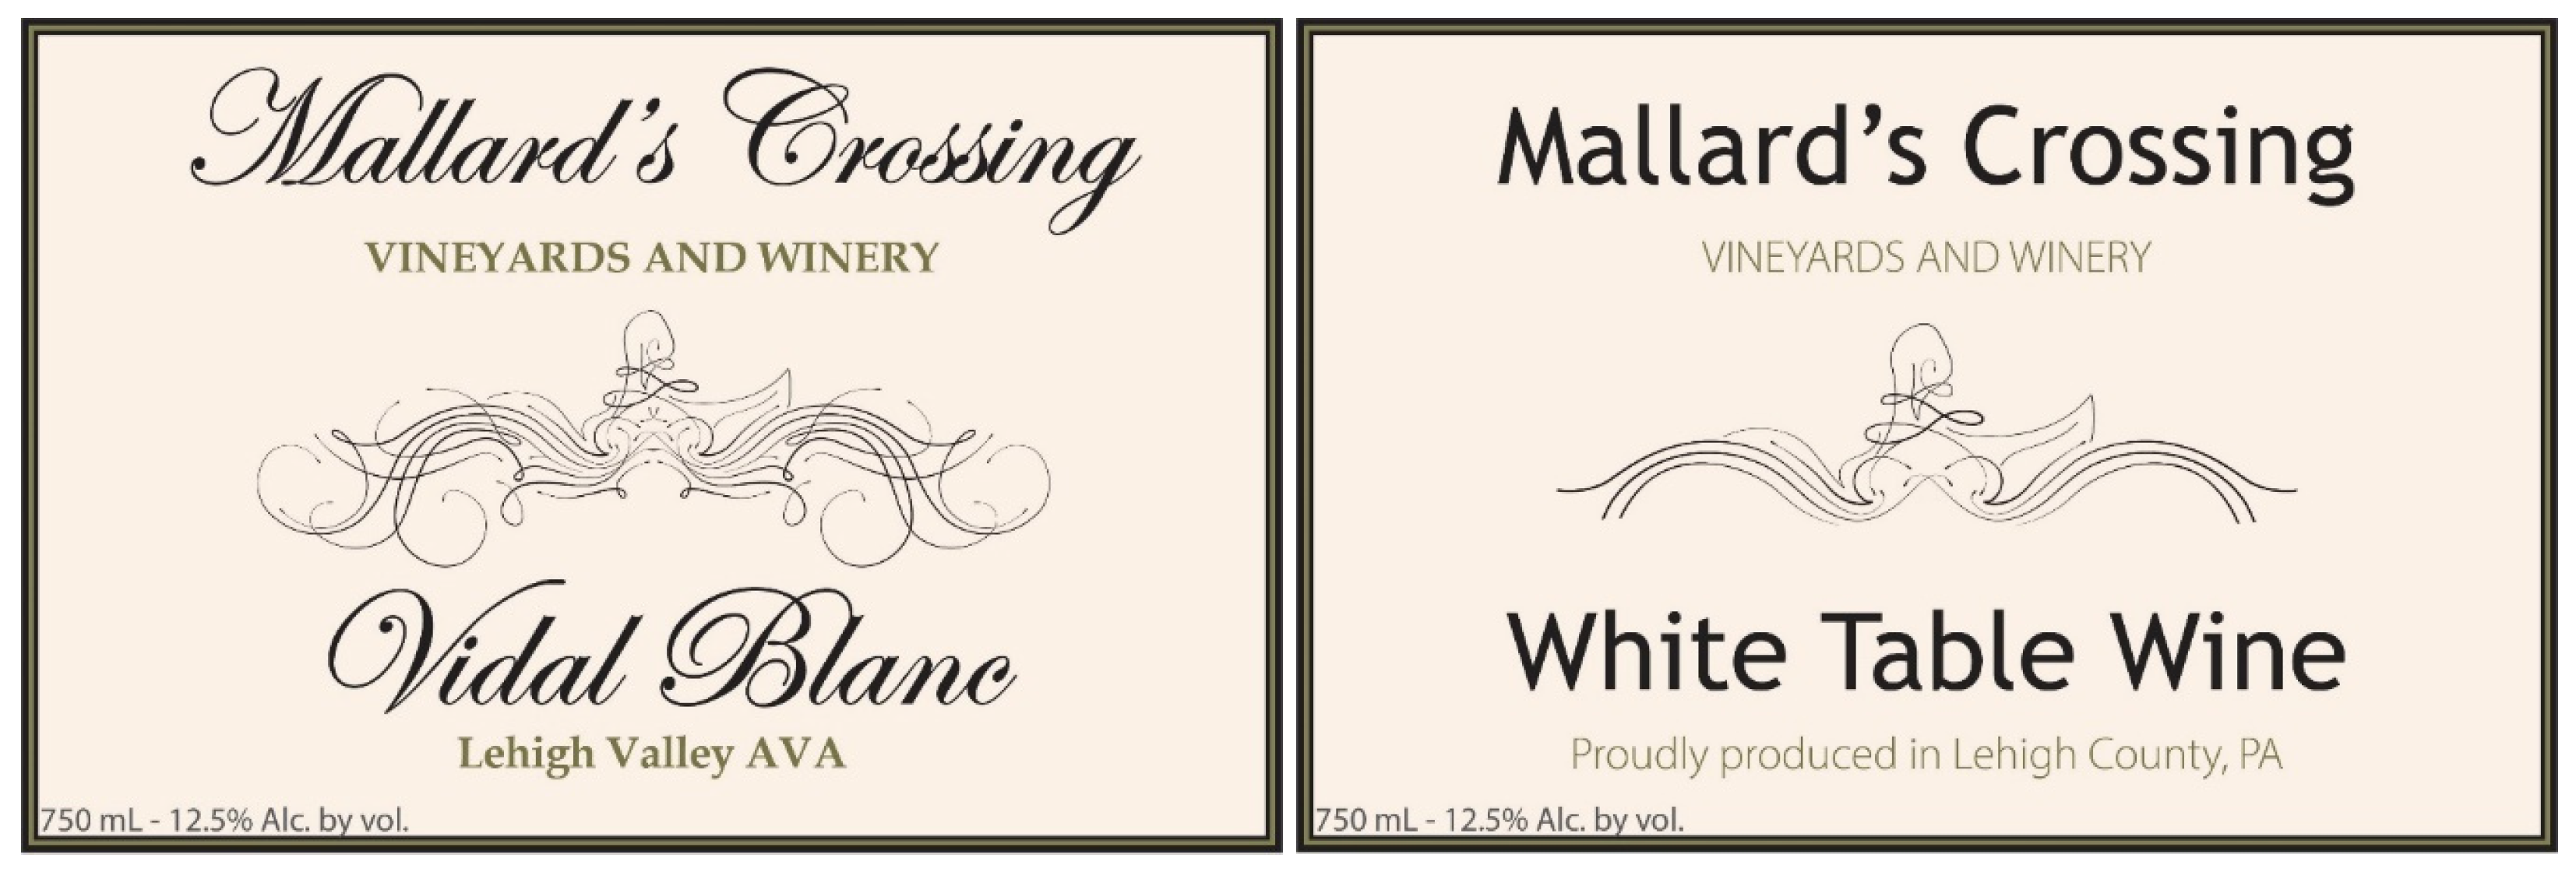
Two different fonts were used to discern if findings reported by Gmuer et al. [14] would also translate to a USA consumer population. A more “traditional” font with a cursive main and serif subtext font was compared to a more “casual” one with two sans-serif font styles. While the primary image featured on the label was not a main focus in this study, there was some concern that an overly flourished image with a sans-serif font would look too incongruent and cause mistrust or avoidance in consumers, such as atypical packaging colors did for consumers in Garaus and Halkias [12]. Therefore, two images were tested, one with and one without the extra flourishes. Example images of the created labels are shown in Figure 1.
2.2. Data Collection
The experiment described here was reviewed, approved, and acknowledged as exempt by The Pennsylvania State University’s Institutional Review Board under protocol STUDY000012536, and administered online. Implied informed consent was obtained from all participants on the first screen of the study, and only consenting participants’ data were collected. Consumers were recruited from the mid-Atlantic region by Dynata® Survey Sampling International (Westport, CT), based on recruitment criteria including consumers (i) at least 21 years of age and under the age of 70, (ii) with their main residence in the mid-Atlantic region of the United States (being described here as the states of Pennsylvania, New York, New Jersey, Virginia, Maryland, Delaware, West Virginia, and Washington, District of Columbia) and Ohio as a neighboring state to PA, as the majority of PA wines are sold in these states, and (iii) reportedly consuming white wine at least once per month (i.e., both high frequency and occasional wine drinkers [35]). Participants were compensated according to the Dyndata® compensation scheme.
Multiple criteria were used to ensure the quality of the data collected. Participants with repeat ID numbers managed through Dynata® were removed prior to data processing. Any surveys completed in under 5 min were also removed, as any participant would be hard-pressed to read every response and answer in under this time as determined by the research team. Participants were also screened based on intermittent checks in the survey (e.g., “Please select “disagree” for quality control”). Lastly, the age question was asked twice, once at the beginning of the survey and again at the end, and if these two values were not the same, the survey response was removed.
2.3. Choice-Based Conjoint Analysis (CBCA) and Psychographic Questionnaires
The choice-based conjoint analysis (CBCA) experiment was created and administered through Sawtooth Software and analyzed in Sawtooth Software Lighthouse Studio (version 9.8.0, Sawtooth Software, Inc., Provo, UT, USA). A Balanced-Overlap design provided by Sawtooth was selected so that panelists were forced to make decisions based on multiple factors at once, allowing for the analysis of interactions between factor levels. Four images were shown together in a task on the screen, and there were ten total tasks; there was no “No Choice” option available. Respondents were asked to choose the best option for them in each of the ten tasks. One of the tasks was fixed in order to pull apart location and wine tags specifically, as well as to serve as a model validity check and to test the simulated model. This holdout task was always the fifth task displayed. The other nine choice tasks were varied based on the experimental design provided by Sawtooth. From the CBCA data, utility scores were calculated using Sawtooth Software’s Hierarchical Bayes model (HB), which allows the estimation of individual participant’s utilities [22]. These utilities indicate how likely participants are to choose one level over another within one attribute. The utilities will always add up to zero, with positive ratings meaning a higher frequency of choice. Additionally, an overall importance number is calculated, summing up to 100, showing how important one factor is compared to another. The higher the importance number, the more this factor affects consumer choice [22].
After the task experiment, participants answered questions from three validated psychographic tools: The VARSEEK scale as adapted for wines [28] consists of 8 questions that ask the degree of agreement on a 5-point Likert scale to statements such as “I like to drink exotic wines”, with the summed responses possibly ranging from 8 to 40. Second, the 11 statements from the locavore scale [30] were shown and participants indicated agreement to questions including “Locally produced foods just taste better”, on a 7-point Likert scale (possible range 11–77). Third, agreement with the 9 statements from the subjective wine knowledge questionnaire [29], e.g., “I know how to judge the quality of a bottle of wine”, were measured on a 7-point Likert scale (possible range 9–63). The 5 objective wine knowledge questions, as described in [25], were also included where the correct answer was provided alongside 3 incorrect and a “Don’t know” option (e.g., Which is the name of New Zealand’s famed Sauvignon Blanc region? With corresponding response categories: Kapiti, Hawkes Bay, Waipara, Marlborough, I don’t know). Participants responded to additional questions regarding their knowledge of what the abbreviation AVA means, demographic characteristics (age, gender, state of residence, household income), and wine consumption habits. Lastly, participants were also asked about their familiarity with Vidal blanc as a wine tag and if they had previously consumed this wine.
For data analysis, correct responses to the objective wine knowledge questionnaire and total scores from the other surveys were used as indicated by the original publications. Reliability for the psychographic questionnaires (locavore, VARSEEK, subjective wine knowledge) was evaluated by Cronbach’s α.
3. Results and Discussion
3.1. Consumer Demographics
The CBCA was administered online from May 4–8 of 2020. The study had 1011 complete and usable respondents out of 2646 total responses, mostly due to not fulfilling our recruitment criteria, failing the attention and QC checks, and/or taking less than 5 min to complete the survey (Table 2). Of those completed surveys, 86% of participants took between 5 and 20 min to complete the survey. Respondents were 63% female (n = 638), with 24% of respondents being between the ages of 21 and 35 (n = 244), 40% between 36 and 50 (n = 402), and 36% between 50 and 70 (n = 365)—the median age was 41–45 years. Most participants were from New York (32%, n = 324), followed by Pennsylvania (20%, n = 206), New Jersey (15%, n = 152), Ohio (12%, n = 123), Virginia (11%, n = 114), with the rest (9%, n = 92) coming from Maryland, West Virginia, and Washington, DC. No panelists reported being from Delaware. The largest group of respondents (43%, n = 435) reported a yearly household income of over USD 100,000, with the median household income being USD 80,000–90,000, which aligns with a study by Thach and Camillo [36] who reported a median annual income of USD 85,000 for wine consumers across the 50 USA states.
Sixty percent of respondents indicated they consumed white wine at least once per week, placing them into the high-frequency wine drinker category [35]. Based on data published in 2019 by the Wine Market Council, approximately 39% of US adults, aged 21 and older, consume wine more frequently than once every 2–3 months. Of these consumers, 89.1% consumed wine once a month, which is the wine consumer we targeted as these consumers both like wine and purchase wine [35].
3.2. General Population Results from the CBCA Experiment
Utility scores for the total study populations were calculated using Sawtooth Software’s Hierarchical Bayes model (HB), as described in the Methods section. Using the holdout task, the created HB model accurately predicted participants’ real choices within a 5% absolute error for each label, with an average of 3.23% absolute error (Table 3), indicating valid results [37]. This check ensured that the model did fit the participants’ choices, and further analysis was conducted using the HB-modeled utilities.
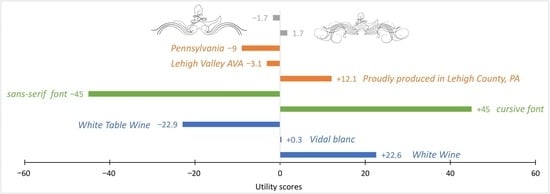
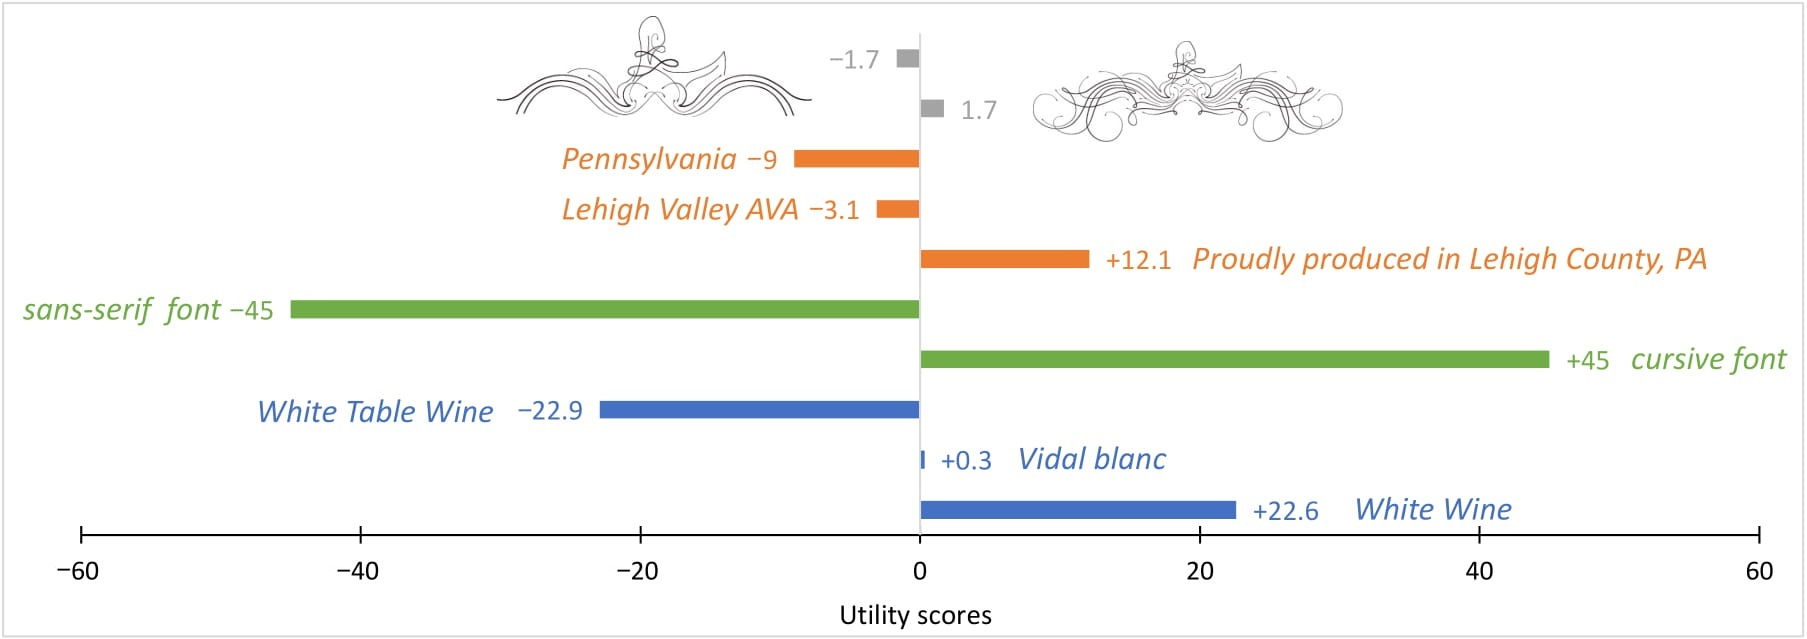
Among the tested factors—wine tag, location, font style, and image—wine tag had the highest importance score of 45.5% (Table 4). Within that category, White Wine had the highest utility score (+22.6), followed by the Vidal blanc (+0.3) and White Table Wine (−22.9) tags. While we correctly hypothesized that the generic white wine text would have a higher utility than Vidal blanc, the low utility score of White Table Wine was not expected. In the USA 27 Code of Federal Regulations 4.21 [38], table wine is defined as “grape wine having an alcoholic content not in excess of 14 percent by volume”, which does not require any stylistic or quality attributes. The Vidal blanc wine tag has a “Frenchness” to it, which was favorable in certain populations [17,19]; however, this was not as pronounced here in our general population.
This could be due to the presence of the location text, as each wine label had a Pennsylvania wine code, which would go against the “Frenchness”, as does the winery name, selected to include a representation of the Northeast USA (survey participants may not necessarily have associated Mallard ducks with “Frenchness”). The more familiar but less descriptive White Wine text was most preferred, which validates this more generic approach when marketing to a general wine consumer. It is also important to note that White Wine is often used for other wine varieties and white wine blends, and not just Vidal blanc. There may be some bias for consumers, if they had heard of Vidal blanc and disliked it, to select other wine texts based on the experience that those other wines would indicate a difference in sensory attributes. However, the label did not include wine style (e.g., dry, sweet, or otherwise), and so any expectations on wine style would have been unique to each participant.
Based on prior research, we speculated that font style would affect consumer choice and found that font had the second highest importance score (34.5%; Table 4), with the scripted font being much more preferred to the sans-serif font (+45.0 vs. −45.0). This is in contrast to results by Gmuer et al. [14]; however, as mentioned before, our consumers were not forced to read a large body of text in the scripted font used in our study, which may explain the differing results. The script may be considered more “traditional”, which has been found to be preferred by wine consumers [18]. Also of note is that each label contained the legally required alcohol and sulfite statements. Since this text could not be enlarged on the image, and the location texts were extremely important to this research, we used an identical font size and type on all labels as comments from those who participated in the initial pre-test found it difficult to read these statements when presented in a smaller scripted font size.
Our second hypothesis concerned the impact of the location where we hypothesized that location text would be an important driver of consumer choice. Here, however, location was ranked fourth in importance (importance score of 14.6%; Table 4), which is surprising, as many studies have seen region of origin impact consumer choice strongly [15,16,19,20]. This may be due to the lesser-known state of Pennsylvania as a wine-producing state.
Within this category, we hypothesized that the regulatory AVA text (Lehigh Valley AVA) would be most preferred due to the perceived government oversight and prestige; this, however, was not found (Table 4). Instead, the generalized county text Proudly produced in Lehigh County, PA was the most preferred (+12.1; Table 4) over both the AVA text (−3.1) and the state text Pennsylvania (−9.0; Table 4). This confusion or lack of knowledge about AVA designations among mid-Atlantic consumers was mirrored in the question asking participants to identify the correct meaning of AVA, where only 116 of the 1011 participants (11.5%) selected the correct answer, 395 participants (39%) admitting to not knowing, and almost half (49.5%) of the participants (n = 500) incorrectly identified what AVA meant, even with the “I don’t know” option available (Table 5). It should be noted that this question was included after the objective knowledge questionnaire and the response categories were created to generally follow the same format as the other wine knowledge questions (i.e., one correct response, several incorrect responses, and a “I don’t know” option).
These results reveal a need for consumer education and/or targeted marketing campaigns by the wine industry to inform wine consumers about AVAs and the potential benefits associated with the designation.
Alternative to the more strictly regulated AVA designation, a county-specific text, such as Proudly produced in Lehigh County, PA, may be feasibly added to the front wine label to increase consumer appeal. Combining such text with the AVA (e.g., Proudly produced in the Lehigh Valley AVA) may also attract more consumer interest. A study found that Sonoma County, CA, resonated stronger and raised more awareness among USA wine consumers than any of the Sonoma County AVAs [39,40], which indicates some usefulness of using a county label text over AVAs for consumer recognition and advertising. This may be even more true for an emerging region such as Pennsylvania compared to the more well-known Sonoma wine region. The preference for the Proudly produced in Lehigh County, PA tag may result from the general familiarity of counties as regions where people live, where locations are more known geographically and politically, than a potentially niche AVA that may not be as recognized by the general public.
3.3. Differences in Consumer Psychographics and Wine Knowledge Affect Wine Label Preference
Participants were asked to answer multiple validated questionnaires to understand how these psychographic factors and their wine knowledge and familiarity affected their choices in the conjoint analysis. Participants were segmented into terciles (low, medium, and high scorers) based on their responses to these psychographic questionnaires. The mean utility scores of these tercile groups were then calculated and compared.
The main wine tag factor (e.g., White Table Wine vs. White Wine vs. Vidal blanc) was used to better understand consumer decisions, as this attribute had the highest importance score and was pertinent to the research objectives in this study. The location text with an importance score of 14.6 was too small to detect any significant differences in utility scores due to consumer psychographics, and neither were any meaningful differences found for the font type category. All consumers seemed to agree in their preference for the cursive font.
Consumers reported their familiarity with Vidal blanc as a wine variety, and, if familiar, their opinions on the variety. We hypothesized that this familiarity would naturally affect the appeal of the Vidal blanc wine tag, and thus, participants were separated into three groups based on their answers to that question, and the mean utility scores were calculated for each group (Table 6). Those who reported being familiar with Vidal blanc (29.7%; n = 300) strongly preferred the Vidal blanc wine labels (utility score of +23.2) over both the White Wine and White Table Wine tags (+4.0 and −27.2 utilities, respectively, for the ‘yes’ group). This was in stark contrast to the overall analysis (+0.3 for the Vidal blanc tag; Table 4) and to those consumers who had never or only maybe heard of Vidal blanc before (−10.0 and −7.4, respectively, for the Vidal blanc tag; Table 6). Consumers who answered “yes” or “maybe” to being familiar with Vidal blanc were also asked what their opinions were of the varietal. Of the 476 questioned, only 10 participants responded they disliked Vidal blanc, with 203 responding that they liked the varietal and 263 having no preference.
The total scores for subjective wine knowledge [29], variety-seeking behavior (VARSEEK) [27,28], and locavorism [30] covered nearly all of the possible score ranges, and each followed a somewhat normal distribution; the mean utility scores for the low, medium, and high scoring terciles are reported in Table 7.
Overall, locavorism sum scores were on average 51.2 ± 8.4 (SD) (range 15–75), with an overall item mean of 4.65 ± 1.06 (SD), item averages ranging from 5.86 (item 9) to 3.11 (item 6), and high internal validity (Cronbach’s α = 0.80). These values are similar to those reported in the original work by Reich et al. [30]. Consumers’ locavorism behavior, however, did not affect label preferences for the wine tag attribute in any meaningful way, with each consumer tercile mirroring the global utility scores (Table 7). This was in opposition to our hypothesis and surprising, especially with the large range of locavore scores found, ranging from 15 to 75 out of a possible minimum and maximum of 11 and 77, respectively. Based on anecdotal evidence from focus groups conducted for a different consumer wine study, it appears that locally produced wines may not be as large of a factor in consumer choice compared to the way locavorism affects the purchase of produce, meats, or dairy products. It could also be that our survey participants were less knowledgeable about wine production—additional research is needed to determine how locally produced wines could appeal more to consumers that show strong locavorism for other food products.
For the wine-specific VARSEEK scores, we found an average sum score of 29.6 ± 5.2 (SD) (range 8–40; Table 7), with an overall item average of 3.70 ± 0.37 (SD) and item averages ranging from 3.16 (item 8) to 4.12 (item 5). Internal validity was high (Cronbach’s α = 0.84). Our respondents appear to be similar in VARSEEK scores to US wine consumers in the Southern US [28] and higher in variety-seeking behavior compared to US residents recruited via MTurk (23.2 ± 5.3 (SD)) [41].
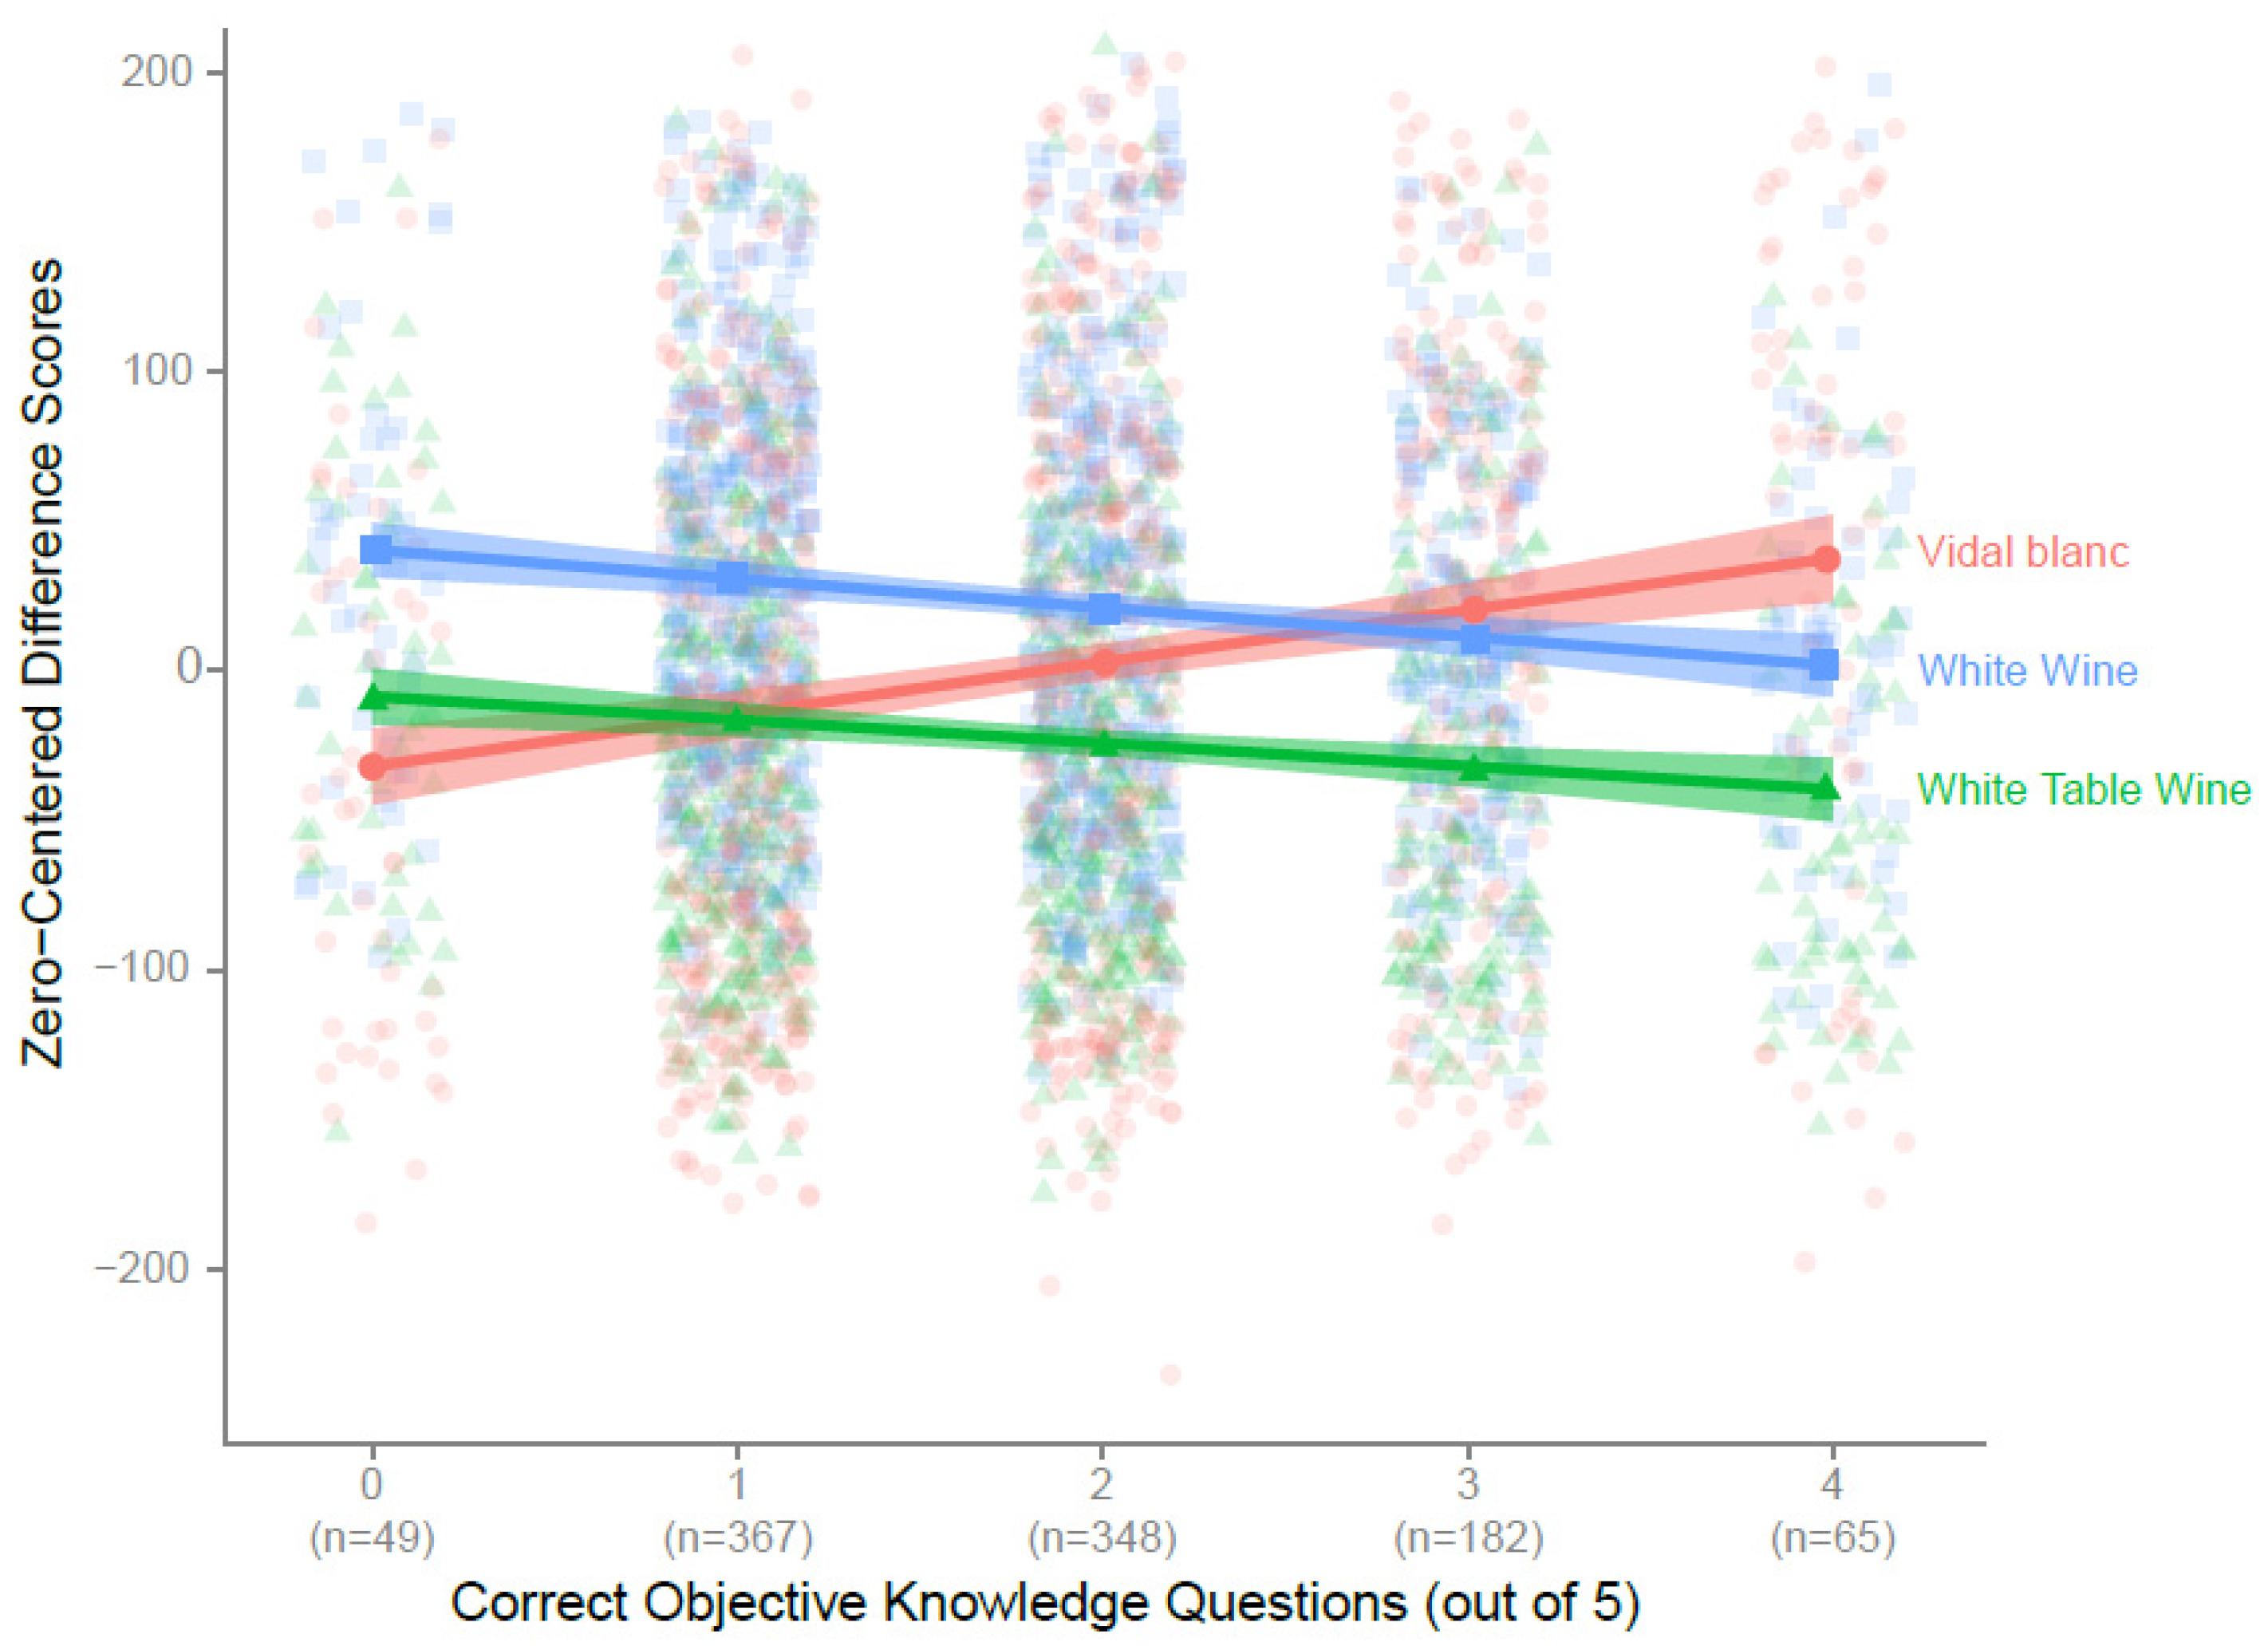
For subjective and objective wine knowledge, our respondents appear to subjectively think they know more about wine (average of 35.8 ± 10.4 (SD)) (Table 7) compared to those who participated in the Ellis and Thompson study (average of 24.0 ± 9.0 (SD)) [41]. Internal validity for the subjective wine knowledge questions was very high (Cronbach’s α = 0.91). In contrast, our respondents appeared to be less knowledgeable based on their responses to objective wine knowledge questions, with an average of 1.8 ± 1.0 (SD)) compared to the 3.3 ± 2.1 (SD) reported by Ellis and Thompson [30]. For the objective wine knowledge scores [29] there were no participants who got all five answers correct (max. score of five), with most participants correctly answering one to two question items (Figure 2). Objective wine knowledge scores were not significantly correlated to the subjective wine knowledge scores, confirming Ellis and Caruana’s findings [29] that these two scores evaluate different aspects of consumer wine knowledge.
In contrast to the non-differentiating effect of locavorism on wine label choice, in both subjective wine knowledge and variety-seeking behavior, significant differences in wine label choice emerged (Table 7), as hypothesized. This may be somewhat connected to the significant positive correlation between consumers’ VARSEEK and subjective wine knowledge scores (r(1009) = 0.402, p < 0.0001), similar to previous reports [41]. Those showing low variety-seeking behavior, scoring 8–28 points out of 40 (n = 369; Table 7), show an equal avoidance of both White Table Wine and Vidal blanc compared to the White Wine tag (utility scores of −18.1 and −15.5 vs. +33.6). The middle third, with 29–32 points (n = 363; Table 7), reflects the global utilities, with a low positive Vidal blanc utility score (+7.0), a high negative White Table Wine utility (−27.1), and White Wine as the most preferred selection (+20.1). The tercile with the highest variety-seeking behavior (33–40 points; n = 279; Table 7) shows a reverse behavior of the lowest tercile: consumers in this group strongly preferred the Vidal blanc and White Wine tags (utility scores of +16.0 and +11.3, respectively) and clearly avoided the White Table Wine tag (−27.2; Table 7). The subjective wine knowledge score mirrored these results fairly consistently, which would be expected as these two scales were positively correlated.
Respondents with low subjective wine knowledge (less than 32 out of a maximum of 63; Table 7) showed a strong preference for the White Wine label tag (+29.7) over White Table Wine (−18.0) and Vidal blanc (−11.7). In contrast, the highest positive utility score for Vidal blanc (+15.3) was found for the respondents with the highest subjective wine knowledge scores (41–63 out of 63; n = 325).
Last, for the objective wine knowledge questions, it is of interest to note that none of the participating wine consumers, 2/3 of them being classified as high-frequency wine drinkers, were able to correctly answer all 5 questions. This could be due to the fact that the questions were developed by researchers outside of the USA and tested with 399 interviewees, 89% of whom were from New Zealand (54%), Australia (20%), and Britain (15%), and only 11% US Americans [42]. No details about the US American participants in the Forbes study [42] were provided, so it is unclear if they were similar wine consumers to the ones participating in this study or not.
Even though none of the 1011 wine consumers in our study correctly answered all five questions, separating participants based on their objective wine knowledge scores revealed an interesting and significant correlation to the three levels of the wine tag (r(1009) = 0.173, p < 0.0001): with increasing correct answers, the utility score for the Vidal blanc text on the label increased from −33.1 for zero correct answers to +36.7 when four out of five questions were answered correctly (Figure 2).
This implies that those who know more factual information about wine have a more positive impression of Vidal blanc. That also means that a specific varietal name for more knowledgeable wine consumers is preferred over the generic White Wine and White Table Wine tags.
Attitudinal, behavioral, and knowledge differences among consumers have previously been shown to affect wine preference [28,41]; here, we similarly found that consumers with higher variety-seeking behavior and subjective and objective wine knowledge all preferred the specific wine varietal on the front label. Local PA wine producers who often use cellar door and tasting rooms to sell their wines could use this to attract such consumers, who supposedly would also be more likely to visit wineries.
4. Conclusions
Based on a choice-based conjoint analysis online survey of 1011 mid-Atlantic consumers of the USA, wine labels from a lesser-known region, such as Pennsylvania, were selected more often with an elegant, serif-type script and a generic White Wine label tag. However, the preference for the generic White Wine tag over the variety-specific Vidal blanc tag seems heavily affected by (i) familiarity and prior experiences with Vidal blanc, (ii) interest in trying new wines as assessed by the wine-specific VARSEEK scale, and (iii) both objective and subjective knowledge of wines. Consumers that score higher in variety-seeking behavior and/or objectively or subjectively know more about wines showed a higher interest in the labels with the specific wine varietal on the label (here Vidal blanc). Interestingly, although consumers displayed a wide range of locavorism, as assessed by the locavore questionnaire, this did not affect wine label preference.
When choosing between wine labels that feature variations of a lesser-known wine region, albeit in closer proximity to consumers’ homes compared to California, for example, consumers overall preferred labels that featured a local county text over the one featuring the producing state or labels with an AVA designation. However, based on characteristics that describe the target customer, for example, a more informed customer, the winery may want to further explore using variables that had utilities and importance scores that appealed to this more-informed segment.
We found that wine labels that featured a local county text were preferred over those with a producing state or an AVA text. This preference was not expected but could be easily implemented by producers to draw attention to locally produced wines and regional profiles in Pennsylvania and other, similar lesser-known wine regions. The consumer preferences for font, wine tag, and regional text provide wine producers with actionable insight to create front wine labels that are enticing to local consumers, where these wines can compete against regional, national, and international brands. One limitation of this study was that we did not include local, non-PA locations that are more known for their wines, such as NY or the Finger Lakes AVA. Future research could study consumer preference for locally produced wines with varying reputation, such as PA vs. NY.
In this research, we used one label design to understand what attributes influenced choice, keeping everything else equal. Future research could expand into different wine label styles (such as abstract art, photos, color schemes, etc.) to see if the results of this study are replicable across a variety of wine label styles, similar to Sherman and Tuten [18]. They found traditional labels with similar information displayed to be preferred over novel designs when all other information was equal, which is why a more typical and “traditional” wine label design was used in this study.
Overall, the US respondents in this study, although consuming wine regularly and thinking they know a lot about wine, do not appear to be highly knowledgeable as measured by the objective wine knowledge questionnaire. Instead of ignoring these consumers, this presents a great opportunity for smaller and local wineries to reach out and educate these consumers. This also presents an opportunity for more research into this large but possibly understudied consumer segment. Research findings from traditional wine-consuming countries such as France or even California may not translate at all to wine consumers in the mid-Atlantic region surveyed here.
Participants who responded that they may have heard or have tried Vidal blanc wines before were asked to describe (in words) where they think they had heard of it. In looking at these free-word responses, multiple consumers thought that Vidal blanc was another name for “white wine” generically, perhaps mistaking it for “vin blanc” in French. Context effects may have played a role in this confusion, as the two other wine tags were generic white wine terms. This may have misled consumers, and it is important to note that this could have skewed results. Therefore, in future exploration of hybrid varieties in Pennsylvania, another less confusing variety or adding a second more known variety (e.g., Riesling) could better control for a potential familiarity effect and would allow further exploring how to increase consumer interest in unknown or lesser-known wine varieties.
Author Contributions
Conceptualization, M.J.T., K.M.K., and H.H.; methodology, M.J.T. and H.H.; formal analysis, M.J.T.; resources, H.H.; data curation, M.J.T. and H.H.; writing—original draft preparation, M.J.T.; writing—review and editing, K.M.K. and H.H.; visualization, M.J.T. and H.H.; supervision, H.H.; funding acquisition, K.M.K. and H.H. All authors have read and agreed to the published version of the manuscript.
Funding
This work was supported by the Pennsylvania Wine Marketing and Research Board and the PA Liquor Control Board (Project No. #224959) and by the USDA National Institute of Food and Agriculture project PEN04624, accession number 1013412 (H.H.) and PEN04599, accession number 1008955 (K.M.K.). None of these organizations have had any role in the design of the study; in the collection, analyses, or interpretation of data; in the writing of the manuscript, or in the decision to publish the results.
Institutional Review Board Statement
The study was conducted according to the guidelines of the Declaration of Helsinki, and reviewed, approved, and acknowledged as exempt by the Institutional Review Board of The Pennsylvania State University (protocol STUDY000012536, 5 June 2019).
Informed Consent Statement
Informed consent was obtained from all subjects involved in the study.
Data Availability Statement
All relevant data underlying the results presented in the study that can be publicly displayed are available within the paper. The use and public sharing of all other data for any future research are limited due to the presence of sensitive identifying information.
Acknowledgments
We thank students and staff of the Sensory Evaluation Center (SEC) at The Pennsylvania State University for valuable feedback during the questionnaire development.
Conflicts of Interest
The authors declare no conflict of interest. The funders had no role in the design of the study; in the collection, analyses, or interpretation of data; in the writing of the manuscript, or in the decision to publish the results.
References
- Giacalone, D.; Jaeger, S.R. Better the Devil You Know? How Product Familiarity Affects Usage Versatility of Foods and Beverages. J. Econ. Psychol. 2016, 55, 120–138. [Google Scholar] [CrossRef]
- Pennsylvania Winery Association PA Grape Guide. Available online: https://pennsylvaniawine.com/wp-content/uploads/2020/09/PWA_WineGuide2020-GrapeGuide-2.pdf (accessed on 4 December 2020).
- DOT-TTB Department of the Treasury Alcohol and Tobacco Tax and Trade Bureau Statistical Report-Wine. 2018. Available online: https://www.ttb.gov/statistics/wine-2018-statistics (accessed on 4 December 2020).
- Pennsylvania Winery Association; MKF Research LLC. The Economic Impact of Pennsylvania Wine, Wine Grapes and Juice Grapes-2011. Available online: https://pennsylvaniawine.com/wp-content/uploads/2017/04/PAWines_2007EconomicImpactReport.pdf (accessed on 4 December 2020).
- National Institute on Alcohol Abuse and Alcoholism (NIAA) Surveillance Report #110 Apparent per Capita Alcohol Conumsption: National, State, and Regional Tredns, 1977–2016. Available online: https://pubs.niaaa.nih.gov/publications/surveillance110/CONS16.htm (accessed on 19 January 2021).
- Kelley, K.M.; Hyde, J.; Bruwer, J.U.S. Wine Consumer Preferences for Bottle Characteristics, Back Label Extrinsic Cues and Wine Composition: A Conjoint Analysis. Asia Pac. J. Mark. Logist. 2015, 27, 516–534. [Google Scholar] [CrossRef]
- Pennsylvania General Assembly 2016 Act 39 Liquor Code-Omnibus Amendments. Available online: https://www.lcb.pa.gov/Legal/Pages/Act39of2016.aspx (accessed on 4 August 2020).
- Mueller, S.; Szolnoki, G. The Relative Influence of Packaging, Labelling, Branding and Sensory Attributes on Liking and Purchase Intent: Consumers Differ in Their Responsiveness. Food Qual. Prefer. 2010, 21, 774–783. [Google Scholar] [CrossRef]
- Celhay, F.; Remaud, H. What Does Your Wine Label Mean to Consumers? A Semiotic Investigation of Bordeaux Wine Visual Codes. Food Qual. Prefer. 2018, 65, 129–145. [Google Scholar] [CrossRef]
- Van Tonder, E.M.; Mulder, D. Marketing Communication for Organic Wine: Semiotic Guidelines for Wine Bottle Front Labels. Communicatio 2015, 41, 131–151. [Google Scholar] [CrossRef]
- Chrea, C.; Melo, L.; Evans, G.; Forde, C.; Delahunty, C.; Cox, D.N. An Investigation Using Three Approaches to Understand the Influence of Extrinsic Product Cues on Consumer Behavior: An Example of Australian Wines. J. Sens. Stud. 2011, 26, 13–24. [Google Scholar] [CrossRef]
- Garaus, M.; Halkias, G. One Color Fits All: Product Category Color Norms and (a)Typical Package Colors. Rev. Manag. Sci. 2020, 14, 1077–1099. [Google Scholar] [CrossRef]
- Lick, E.; König, B.; Kpossa, M.R.; Buller, V. Sensory Expectations Generated by Colours of Red Wine Labels. J. Retail. Consum. Serv. 2017, 37, 146–158. [Google Scholar] [CrossRef]
- Gmuer, A.; Siegrist, M.; Dohle, S. Does Wine Label Processing Fluency Influence Wine Hedonics? Food Qual. Prefer. 2015, 44, 12–16. [Google Scholar] [CrossRef]
- Sáenz-Navajas, M.P.; Campo, E.; Sutan, A.; Ballester, J.; Valentin, D. Perception of Wine Quality According to Extrinsic Cues: The Case of Burgundy Wine Consumers. Food Qual. Prefer. 2013, 27, 44–53. [Google Scholar] [CrossRef]
- Veale, R.; Quester, P. Do Consumer Expectations Match Experience? Predicting the Influence of Price and Country of Origin on Perceptions of Product Quality. Int. Bus. Rev. 2009, 18, 134–144. [Google Scholar] [CrossRef]
- Oczkowski, E. The Impact of Different Names for a Wine Variety on Prices. Int. J. Wine Bus. Res. 2018, 30, 185–200. [Google Scholar] [CrossRef]
- Sherman, S.; Tuten, T. Message on a Bottle: The Wine Label’s Influence. Int. J. Wine Bus. Res. 2011, 23, 221–234. [Google Scholar] [CrossRef]
- Guidry, J.A.; Babin, B.J.; Graziano, W.G.; Schneider, W.J. Pride and Prejudice in the Evaluation of Wine? Int. J. Wine Bus. Res. 2009, 21, 298–311. [Google Scholar] [CrossRef]
- Lockshin, L.; Jarvis, W.; d’Hauteville, F.; Perrouty, J.P. Using Simulations from Discrete Choice Experiments to Measure Consumer Sensitivity to Brand, Region, Price, and Awards in Wine Choice. Food Qual. Prefer. 2006, 17, 166–178. [Google Scholar] [CrossRef]
- Lockshin, L.S.; Spawton, A.L.; Macintosh, G. Using Product, Brand and Purchasing Involvement for Retail Segmentation. J. Retail. Consum. Serv. 1997, 4, 171–183. [Google Scholar] [CrossRef]
- Orme, B. Interpreting the results of conjoint analysis. In Getting Started with Conjoint Analysis: Strategies for Product Design and Pricing Research; Research Publishers LLC: Madison, WI, USA, 2019; pp. 77–88. [Google Scholar]
- Rao, V.R. Applied Conjoint Analysis; Springer: Berlin, Heidelberg, 2014. [Google Scholar]
- Kelley, K.; Hyde, J.; Bruwer, J. Usage Rate Segmentation: Enriching the US Wine Market Profile. Int. J. Wine Res. 2015, 7, 49–61. [Google Scholar] [CrossRef] [Green Version]
- Van Ittersum, K.; Candel, M.J.J.M.; Meulenberg, M.T.G. The Influence of the Image of a Product’s Region of Origin on Product Evaluation. J. Bus. Res. 2003, 56, 215–226. [Google Scholar] [CrossRef]
- Deng, X.; Butler, J.S. Expenditures on Wine in General and Local Wine in Particular: Marketing and Econometric Analysis. J. Agribus. 2018, 36, 109–132. [Google Scholar] [CrossRef]
- Van Trijp, H.C.M.; Steenkamp, J.-B.E.M. Consumers’ Variety Seeking Tendency with Respect to Foods: Measurement and Managerial Implications. Eur. Rev. Agric. Econ. 1992, 19, 181–195. [Google Scholar] [CrossRef]
- Olsen, J.E.; Atkin, T.; Thach, L.; Cuellar, S.S. Variety Seeking by Wine Consumers in the Southern States of the US. Int. J. Wine Bus. Res. 2015, 27, 260–280. [Google Scholar] [CrossRef]
- Ellis, D.; Caruana, A. Consumer Wine Knowledge: Components and Segments. Int. J. Wine Bus. Res. 2018, 30, 277–291. [Google Scholar] [CrossRef]
- Reich, B.J.; Beck, J.T.; Price, J. Food as Ideology: Measurement and Validation of Locavorism. J. Consum. Res. 2018, 45. [Google Scholar] [CrossRef]
- Quester, P.G.; Smart, J. The Influence of Consumption Situation and Product Involvement over Consumers’ Use of Product Attribute. J. Consum. Mark. 1998, 15, 220–238. [Google Scholar] [CrossRef]
- Martínez-Carrasco Martínez, L.; Brugarolas Mollá-Bauzá, M.; del Campo Gomis, F.J.; Martínez Poveda, Á. Influence of Purchase Place and Consumption Frequency over Quality Wine Preferences. Food Qual. Prefer. 2006, 17, 315–327. [Google Scholar] [CrossRef]
- Thach, L.; Olsen, J. Profiling the High Frequency Wine Consumer by Price Segmentation in the US Market. Wine Econ. Policy 2015, 4, 53–59. [Google Scholar] [CrossRef] [Green Version]
- Kelley, K.M.; Todd, M.; Hopfer, H.; Centinari, M. Identifying Wine Consumers Interested in Environmentally Sustainable Production Practices. Int. J. Wine Bus. Res 2021. under review. [Google Scholar]
- Wine Market Council Wine Consumer Segmentation Slide Handbook. Available online: https://winemarketcouncil.com/wp-content/uploads/dlm_uploads/2019/09/2019_WMC_US_Wine_Consumer_Segmentation_Slide_Handbook_11-6-19.pptx (accessed on 7 August 2020).
- Thach, L.; Camillo, A. A Snapshot of the American Wine Consumer in 2018. Available online: https://www.winebusiness.com/news/?go=getArticle&dataId=207060 (accessed on 4 December 2020).
- Moore, W.L.; Gray-Lee, J.; Louviere, J.J. A Cross-Validity Comparison of Conjoint Analysis and Choice Models at Different Levels of Aggregation. Mark. Lett. 1998, 9, 195–207. [Google Scholar] [CrossRef]
- Alcohol and Tobacco Tax and Trade Bureau USDT 27 CFR § 4.21-The Standards of Identity. Available online: https://www.law.cornell.edu/cfr/text/27/4.21 (accessed on 7 August 2020).
- Atkin, T.S.; Newton, S.K. Consumer Awareness and Quality Perceptions: A Case for Sonoma County Wines. J. Wine Res. 2012, 23, 155–171. [Google Scholar] [CrossRef]
- Johnson, R.; Bruwer, J. Regional Brand Image and Perceived Wine Quality: The Consumer Perspective. Int. J. Wine Bus. Res. 2007, 19, 276–297. [Google Scholar] [CrossRef]
- Ellis, D.; Mattison Thompson, F. The Effect of Wine Knowledge Type on Variety Seeking Behavior in Wine Purchasing. J. Wine Res. 2018, 29, 71–86. [Google Scholar] [CrossRef]
- Forbes, S.L. The Influence of Gender on Wine Purchasing and Consumption. Int. J. Wine Bus. Res. 2012, 24, 146–159. [Google Scholar] [CrossRef]
Figure 1.
Two example wine labels used in the choice-based conjoint analysis (CBCA) experiment displaying variations in wine type, production location, font, and primary image.
Figure 1.
Two example wine labels used in the choice-based conjoint analysis (CBCA) experiment displaying variations in wine type, production location, font, and primary image.

Figure 2.
Participants’ zero-centered difference scores over correct responses to the objective knowledge questionnaire with linear regression lines for each wine tag (red circles—Vidal Blanc: , R2 = 0.03; p = 3.34 × 10⁻⁸; blue squares—White Wine: , R2 = 0.02; p = 1.80 × 10⁻⁵; green triangles—White Table Wine: , R2 = 0.01; p = 0.0007).


Table 1.
Description of the four factors, and associated levels evaluated in the choice-based conjoint analysis (CBCA) experiment. Using an orthogonal design, each factor level was combined in all possible combinations and participants rated all 36 tasks.
Table 1.
Description of the four factors, and associated levels evaluated in the choice-based conjoint analysis (CBCA) experiment. Using an orthogonal design, each factor level was combined in all possible combinations and participants rated all 36 tasks.
| Factors | 1 | 2 | 3 |
|---|---|---|---|
| Image |  (embellished) |  (simple) | -- |
| Font | Edwardian Script, Book Antiqua Bold (cursive) | Trebuchet, Myriad Variable Concept Light (sans-serif) | -- |
| Wine Type Text | Vidal blanc | White Wine | White Table Wine |
| Location Text | Lehigh Valley AVA (AVA) | Pennsylvania (state) | Proudly produced in Lehigh County, PA (county) |
Table 2.
Demographic summary of consumer survey respondents (n = 1011).
| Category | Response Option | Counts | Percentage |
|---|---|---|---|
| Gender | Male | 372 | 36.8% |
| Female | 638 | 63.1% | |
| Prefer not to answer/other | 1 | 0.1% | |
| Age | 21–25 | 43 | 4.2% |
| 26–30 | 76 | 7.5% | |
| 31–35 | 125 | 12.4% | |
| 36–40 | 141 | 13.9% | |
| 41–45 | 141 | 13.9% | |
| 46–50 | 120 | 11.9% | |
| 51–55 | 62 | 6.1% | |
| 56–60 | 72 | 7.1% | |
| 61–65 | 120 | 11.9% | |
| 66–70 | 111 | 11.0% | |
| State | New York | 324 | 32.0% |
| Pennsylvania | 206 | 20.4% | |
| New Jersey | 152 | 15.0% | |
| Ohio | 123 | 12.2% | |
| Virginia | 114 | 11.3% | |
| Maryland | 63 | 6.2% | |
| Washington, DC | 18 | 1.8% | |
| West Virginia | 11 | 1.1% | |
| Income | Less than USD 20,000 | 48 | 4.7% |
| USD 20,000–39,000 | 103 | 10.2% | |
| USD 40,000–59,000 | 139 | 13.7% | |
| USD 60,000–79,000 | 145 | 14.3% | |
| USD 80,000–99,000 | 141 | 13.9% | |
| Over USD 100,000 | 435 | 43.0% | |
| Wine Consumption | Daily | 71 | 7.0% |
| A few times per week | 328 | 32.4% | |
| About once per week | 208 | 20.6% | |
| A few times a month | 279 | 27.6% | |
| About once a month | 125 | 12.4% |
Table 3.
Comparison of the holdout task percentages found compared to the Hierarchical Bayes (HB) model estimate for the entire consumer population (n = 1011). All the presented wine labels in the holdout task used cursive font and the more embellished image.
Table 3.
Comparison of the holdout task percentages found compared to the Hierarchical Bayes (HB) model estimate for the entire consumer population (n = 1011). All the presented wine labels in the holdout task used cursive font and the more embellished image.
| Label | HB Model Estimate | Actual Percentage |
|---|---|---|
| White Wine, Pennsylvania | 23.4% | 18.9% |
| White Wine, County text | 30.6% | 33.3% |
| Vidal blanc, Pennsylvania | 16.4% | 20.0% |
| Vidal blanc, County text | 29.7% | 27.7% |
Table 4.
Utilities and importance values as estimated by the Hierarchical Bayes (HB) model for the entire survey population (n = 1011).
Table 4.
Utilities and importance values as estimated by the Hierarchical Bayes (HB) model for the entire survey population (n = 1011).
| Attribute | Importance | Levels | Utilities |
|---|---|---|---|
| Wine Type | 45.4 | White Wine | 22.6 |
| Vidal blanc | 0.3 | ||
| White Table Wine | −22.9 | ||
| Font Type | 34.5 | Cursive | 45.0 |
| Sans-Serif | −45.0 | ||
| Location Text | 14.6 | County text: Proudly produced in Lehigh County, PA | 12.1 |
| AVA text: Lehigh Valley AVA | −3.1 | ||
| State text: Pennsylvania | −9.0 | ||
| Image | 5.5 | Flourished Image | 1.7 |
| Simple Image | −1.7 |
Table 5.
Breakdown of 1011 participants’ responses to the question “What does AVA indicate when on a wine label?”. The italic answer is the correct response.
Table 5.
Breakdown of 1011 participants’ responses to the question “What does AVA indicate when on a wine label?”. The italic answer is the correct response.
| Response | Percentage (Count) |
|---|---|
| The majority of the grapes are grown in the area designated on the label | 11% (116) |
| The wine is produced in accordance with winemaking laws designated by this region | 8% (77) |
| The wine has been certified by the American Viticultural Association for quality | 37% (370) |
| All of the grapes used to grow the wine are grown in the USA. | 5% (53) |
| I don’t know | 39% (395) |
Table 6.
Participant responses to the question how familiar they are with the varietal Vidal blanc, and the mean utility scores for each response group.
Table 6.
Participant responses to the question how familiar they are with the varietal Vidal blanc, and the mean utility scores for each response group.
| Count | White Wine | Vidal Blanc | White Table Wine | |
|---|---|---|---|---|
| No | 535 | +30.7 | −10.0 | −20.6 |
| Maybe | 176 | +29.8 | −7.4 | −22.5 |
| Yes | 300 | +4.0 | +23.2 | −27.2 |
Table 7.
Participants’ mean sum scores ± standard deviation and ranges for the locavorism, VARSEEK and Subjective Knowledge scales, reported for overall and each tercile, and the corresponding mean utility scores of each level in the wine type factor.
Table 7.
Participants’ mean sum scores ± standard deviation and ranges for the locavorism, VARSEEK and Subjective Knowledge scales, reported for overall and each tercile, and the corresponding mean utility scores of each level in the wine type factor.
| Locavorism | Mean ± SD | Range | Counts | White Wine | Vidal Blanc | White Table Wine |
|---|---|---|---|---|---|---|
| Overall | 51.2 ± 8.4 | 15–75 | 1011 | 22.6 | 0.3 | −22.9 |
| Low | 42.2 ± 4.9 | 15–47 | 343 | 25.7 | 1.5 | −27.2 |
| Medium | 51.4 ± 2.2 | 48–55 | 343 | 22.6 | 0.8 | −23.4 |
| High | 60.5 ± 4.2 | 56–75 | 325 | 19.4 | −1.5 | −17.9 |
| Variety Seeking (VARSEEK) | ||||||
| Overall | 29.6 ± 5.2 | 8–40 | 1011 | 22.6 | 0.3 | −22.9 |
| Low | 24.2 ± 3.7 | 8–28 | 369 | 33.6 | −18.1 | −15.5 |
| Medium | 30.5 ± 1.1 | 29–32 | 363 | 20.1 | 7.0 | −27.1 |
| High | 35.6 ± 2.2 | 33–40 | 279 | 11.3 | 16.0 | −27.2 |
| Subjective Knowledge | ||||||
| Overall | 35.8 ± 10.4 | 9–63 | 1011 | 22.6 | 0.3 | −22.9 |
| Low | 24.8 ± 5.8 | 9–32 | 366 | 29.7 | −11.7 | −18.0 |
| Medium | 36.9 ± 2.3 | 33–40 | 320 | 26.9 | −1.2 | −25.7 |
| High | 47.1 ± 5.5 | 41–63 | 325 | 10.4 | 15.3 | −25.7 |
Publisher’s Note: MDPI stays neutral with regard to jurisdictional claims in published maps and institutional affiliations. |
© 2021 by the authors. Licensee MDPI, Basel, Switzerland. This article is an open access article distributed under the terms and conditions of the Creative Commons Attribution (CC BY) license (https://creativecommons.org/licenses/by/4.0/).
Share and Cite
MDPI and ACS Style
Todd, M.J.; Kelley, K.M.; Hopfer, H. USA Mid-Atlantic Consumer Preferences for Front Label Attributes for Local Wine. Beverages 2021, 7, 22. https://0-doi-org.brum.beds.ac.uk/10.3390/beverages7020022
AMA Style
Todd MJ, Kelley KM, Hopfer H. USA Mid-Atlantic Consumer Preferences for Front Label Attributes for Local Wine. Beverages. 2021; 7(2):22. https://0-doi-org.brum.beds.ac.uk/10.3390/beverages7020022
Chicago/Turabian StyleTodd, Marielle J., Kathleen M. Kelley, and Helene Hopfer. 2021. "USA Mid-Atlantic Consumer Preferences for Front Label Attributes for Local Wine" Beverages 7, no. 2: 22. https://0-doi-org.brum.beds.ac.uk/10.3390/beverages7020022
Note that from the first issue of 2016, this journal uses article numbers instead of page numbers. See further details here.