
An Assessment of the Competitive Position of the Emergent Uruguayan Wine Industry: A Preliminary Netnographic Baseline Study


1
Wine Business Institute, Sonoma State University, Rohnert Park, CA 94928, USA
2
International Center for Hospitality Research & Development, Dedman College of Hospitality, Florida State University, Tallahassee, FL 32306, USA
*
Author to whom correspondence should be addressed.
Beverages 2021, 7(2), 26; https://0-doi-org.brum.beds.ac.uk/10.3390/beverages7020026
Submission received: 20 April 2021
/
Revised: 10 May 2021
/
Accepted: 14 May 2021
/
Published: 20 May 2021
(This article belongs to the Special Issue Featured Papers in Wine, Spirits and Oenological Products Section)
Abstract
:This study investigates the competitive position of the Uruguayan wine industry and its potential to become a player in the global wine trade. The study adopts an exploratory, holistic, and qualitative research design, applying desk research, cyberethnography, and electronic correspondence with stakeholders. The research, based on the theory of global business competitiveness, aims to determine the opportunities Uruguay’s wine industry could exploit, based on its competencies, to become a player in the worldwide wine business landscape. The results show that Uruguay is a young wine-producing country; however, it has the potential to become a global competitor. Critical factors identified in the study are geographic location, favorable climate, terrain, hydropower and the high density of the hydrographic network, available agricultural land, the available and well-educated workforce, unique land infrastructure, and the newness of the grape varietal (Tannat) being introduced to the world market with promising results. The paper contributes to the body of knowledge of competitive strategy in wine business research and adds to the scarce literature on the Uruguayan wine industry. Finally, it assesses Uruguay’s current positioning of wine production and competitiveness. The results will benefit stakeholders in the Uruguayan wine industry, researchers, and practitioners in the field.
1. Introduction
Origin and Development of the Viticulture and Enology in Uruguay
Uruguay is a South American country with global positioning coordinates like South Africa and Australia. Together with other South American countries, Uruguay is evolving as a tourist destination, especially in wine tourism. Uruguay is part of the South American wine production cluster which encompasses all countries except Guyana, Suriname, and French Guyana. The origin of viticulture and enology in Uruguay began around the 15th century, concurrently with several other regions and with the settlement of the Jesuit missionaries. Today, grape growing and wine making is a commercial undertaking similar to other wine producing countries, which market their wines domestically and globally.
Historical records reveal that the early commercial development of viticulture in Uruguay began toward the end of the 18th century [1,2,3]. Therefore, the wine industry in Uruguay can be defined as a young industry compared to the rest of the world [1]. The work of Baptista [1] provides essential discoveries about the evolution of the Uruguayan wine industry [1]. From the late 1800s to the 1930s, the Uruguayan wine industry experienced severe challenges, including the destructive period of the phylloxera (an almost microscopic insect pest that feeds on the roots and leaves of grapevines), followed by the great depression and then the events of WWII.
Nevertheless, over the last two decades, despite all challenges, Uruguayan industry leaders, with the government’s support, implemented revolutionary and innovative changes that put the Uruguayan wine industry on the world stage. Much like the success of Argentina and Chile with the varietals Malbec and Carménère, respectively, the work of Frutos and Cury [4] demonstrates that Uruguay today aims to establish a viticultural and enological identity, partially with the grape varietal Tannat, a grape originally from southern France [3]. Uruguayan wines have received significant worldwide recognition and awards for scoring high points in international wine competitions [5]. In sum, current literature, experts’ anecdotes, and statistical records [6] show that Uruguay is on the path to becoming a competitive wine-producing country.
2. Scope of the Research
Studies about wine production, operation, distribution, and global competitiveness have engaged scholars from around the world for decades. While the worldwide vineyard surface has continued to decline since the year 2000, from 7.8 mha (million hectares) to an estimate of 7.4 mha in 2019 [7], the industry is strategically becoming more competitive. Export is key to global competitiveness, and wine-producing countries compete with the application of innovative technologies like the use of drones in farming [8,9] continuous improvement in quality, yield optimization, and strategic marketing [10] as well as using various strategies based on the highest quality and least quantity. In addition, the skills, experience, and capabilities of viticulturists have become crucial components of the process, since great wines are the derivate products of high-quality grapes, and are finished in the bottle and not in the vineyard. The predictive analytical data released on 22 April 2020, by The International Organization of Vine and Wine [7] supports this trend.
The report also provides statistics about wine production and the surface areas of worldwide grape production. The data show that the surface area of the world vineyard is estimated at 7.4 mha, stable since 2016, and a decline from 7.8 mha in 2010. However, world wine production shows a significant decrease compared to previous years. There is an increase, however, in export activities which in 2019 grew by +0.9%. Noticeably the wine production in the southern hemisphere indicates low volumes for 2020 for most countries except for South Africa and Uruguay.
The above estimates include positive results about Uruguay. Nevertheless, Uruguay’s production, compared to the rest of the world, is statistically insignificant since its vineyard surface area is less than 1% of the global planted areas; hence, such an inclusion in the report [7] shows positivity and significance for the future, meaning that The International Organization of Vine and Wine is noticing the developmental capabilities of the Uruguayan wine industry.
Regardless of the importance of the wine export of emerging countries, scholars failed to pay attention to the potential of the Uruguayan wine market share in global wine production, and little is known about the competitiveness of its grape and wine industry. This research is considered a baseline study [11,12]. Within this context, a baseline study is defined as “the collection of data about the current situation of the Uruguayan wine industry and a detailed analysis of status-quo to identify the starting points for future research.” As a starting point to investigate the potentiality of Uruguay to achieve global competitiveness, the study analyzes the data and evaluates the results based on five basic economic factors: land, labor, capital, and supply and demand. The aim is to establish a base of resources that, when analyzed, can lead to the creation of a platform, hence the baseline, for future research for academia and practitioners in the field in their business endeavors. For this research, the data are collected using the netnographic or cyberethnography methodology. Accordingly, the study aims to gather, summarize, and synthesize information relevant to the Uruguayan wine industry and to establish a proposal for future research. It presents a brief analysis of the global wine industry and attempts to assess the current strategic position of the Uruguayan wine industry. The results will constitute the building block for future studies about Uruguay’s wine industry and its long-term potential to achieve and sustain a competitive advantage. Ultimately, the results will be beneficial to researchers in academia, practitioners in the field, and marketers involved in the global wine trade. The final objective is to encourage scholars to conduct future research on the developmental Uruguayan wine industry to compare, contrast, and make predictions about future advancements in the global wine trade.
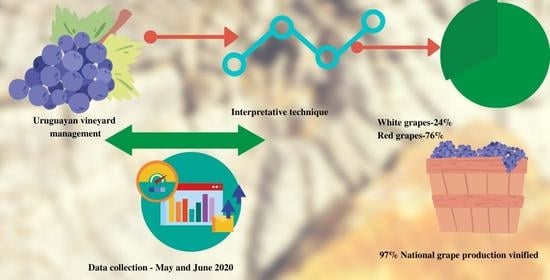
The data in Figure 1 show that the total Uruguayan wine production remains statistically insignificant compared to the rest of the world.
The data in Figure 2 show the total value of the world wine trade and the monetary significance in terms of export/import, which is of economic importance to any trading country to maintain a balance of trade.
The data in Figure 3 show the increase in value for YOY, considering the year 2003 as 100%, representing the base year. This is significant considering the decline in the vineyard surface, which means that marketing strategies are increasing value while production decreases.
3. Literature Review
Unlike most established wine-producing countries, research about the Uruguayan wine industry is limited. A few scholars have examined the origin and evolution of viticulture and enology in Uruguay across wine-related disciplines [1,2,3,4,13,14,15,16] Disappointingly, a global ethnographic internet search in many search engines, and scholarly publications’ repositories, using keywords such as “Uruguayan Wines,” “Uruguayan Wine Industry,” “Uruguay Wine Export,” “Uruguay Wine Competitiveness,” and “Uruguay Wine Research” did not return any significant literature. Research and publishing about strategy, marketing, supply chain, value chain, and export in the Uruguayan wine industry are minimal. An additional search of the literature on viticulture and enology, including plant biology, was also unsuccessful. Thus, Uruguay’s wine research, in general, is scarce.
Nevertheless, from the academic literature available, practitioners’ websites, and promotional internet companies, there is sufficient literature to conduct this preliminary baseline study [11]. Accordingly, useful data are extrapolated from the literature and analyzed, and relevant findings are present in the discussion section. Accordingly, the literature indicates that wine production, with the application of innovative technologies and efficient strategic planning, fluctuates year-over-year, allowing premium wine producers to build reserves while keeping inventories at a constant level to meet the overall demand. However, when financially feasible, building high-quality wine reserves contributes to the establishment of an optimal inventory level and an ideal future price point, which, when formulated strategically, will set a precedent for future pricing. One possible explanation for the stable world wine production since 2016 is that most wine-producing countries have, or are, optimizing the size of their vineyard surface, and so is Uruguay.
According to the literature [2], Uruguay’s vineyard surface represented 4661 ha (Hectares) of the total grapes planted in 1996 and, according to INAVI [6], in 2010, the Uruguay vineyard surface represented a total of 7614 ha, of which 6157 ha were red grapes, and 1457 ha were white grapes. However, in 2019, the vineyard surface for red grapes was 4742 ha and 1138 ha for white grapes. This represents a total surface of 5880 ha in 2019. Hence, there is a factual reduction of −320 ha and −1414 ha for white and red grapes, respectively, for a total decrease of −1734 ha red and white grapes combined [6]. The above data exclude the surface for table grapes. Uruguay’s wine industry leaders seem to follow the global vineyard surface reduction strategy based on the data presented above. A potential explanation for Uruguay’s reduction in vineyard surface is the country’s marketing strategy to produce less quantity and higher quality wines. Some well-established countries use a focus strategy of premiumization; others may use diversification strategies, as in the case of Uruguay.
Historical Highlights and Current Developments
On 11 March 2020, Mark Johanson published an article in CNN Travel, online edition, titled “Why Uruguay could be the world’s next great wine destination” [17]. However, despite media reports about developing wine destinations, a triggering event must take place or anything in business to succeed. Using an analogy, the success of the Californian wine industry is due to a triggering event that happened in Paris in 1976. The Californian wines became world-famous with a simple but historically significant breakthrough in France by Chateau Montelena: “The Judgment of Paris, According to Borca” [18,19,20]. A California wine was judged and selected as the most competitive in a blind tasting. Hence, the success of what now is known as the world-famous Napa Valley was a critical trigger that positively contributed to the development and global recognition of Californian wines. A similar case is the successful launch of the Australian Yellow Tail wine in the US, using the “Blue Ocean Strategy” [21].
In the case of the Uruguayan wines, there is evidence that the wines are slowly gaining global recognition for their unique attributes, demonstrated by the high point scores and awards in international wine competitions that they have received [9]; however, there has not been a significant breakthrough as of yet. According to INAVI [22], Uruguay received eight medals recently, two gold and six silver, during the 2020 wine competition of the Vinalies Internationales and the Bacchus International. Therefore, according to INAVI [6], innovative strategies support Uruguayan winemaking efforts as they become a competitive country in quality, if not in quantity, due to limited vineyard coverage [6]. Uruguay’s net vineyard surface for wine grapes declined from 6144 ha (Hectares), or about 0.0830% of the world’s total vineyard surface, in 2010 to 5880 ha, or 0.0794%, in 2019 [6]. The wine producers’ strategies appear to focus on creating a national wine product identity by emphasizing their grape growing effort with the red varietal “Tannat,” a uniquely suitable grape. However, other varietals are also cultivated and are delivering promising results. According to the literature, there has not yet been a trigger to strategically position the Uruguayan wines on the world market with an optimal price point. The grape Tannat is an excellent opportunity and could become the catalyst for the future success of the Uruguayan wine industry.
Historically, the cultivation of grapes for wine production in Uruguay is an activity that has been developed in the last century and a half. Its territory is positioned in a temperate zone of the southern hemisphere, which is considered high potential for high-quality grape production. Winemaking activity is concentrated in the south of the country, and grape production and winemaking are regulated by the National Institute of Vitiviniculture (INAVI), the institution in charge of executing the national wine policy [6]. According to INAVI [6], there are active vineyards cultivating grapes and producing wine in 15 of the 19 departments of the country. However, most of the production is concentrated in the southern part of the country, mainly in five departments: Canelones, Montevideo, Colonia, San José, and Maldonado. Historical notes [3] show that the Tannat grapevine originated from Madiran, in the region of Gascogne, in southern France, neighboring Spain/the Basque Region. Basque settlers, including Pascual Harriague, brought the Tannat vines to Uruguay in the early 19th century [6,23].
In South American wine regions, winemakers were quickly interested in the new grape varietal, and it spread rather fast, beginning in Argentina. At the beginning of the 20th century, the grape also arrived in California, where winemakers continue their experimentation. Tannat in Uruguay is also known as Harriague, and its promising results have caught the interest of all of Uruguay’s wine producers. The grape is now known as the most famous “renaissance grape,” producing a high-quality, more palatable wine with much less acid than the original French clone. Producers such as Bodega Garzon [9] contend that Uruguay’s Tannat wines have a unique character, and are more elegant, with softer tannins and accentuated blackberry fruit notes. Viticulturists have improved the original vines, which are now different from the original French canes or “old vines” brought to Uruguay. The new clones produce a higher quality grape, which turns into high-quality wines. The new clones produce grapes with lower acidity levels, complex fruit attributes, and higher alcohol levels. Despite the effort to capitalize on the potential success of the Tannat grape, Uruguay produces other wines that are gaining the same recognition as the Tannat. The Tannat grapevines planted represent 26.56% of the total national vineyard surface and only 27.61% of the total national grape production.
According to the latest data from INAVI [6] and OIV [7] the Uruguayan wine industry is striving to specialize in premium wines and aiming at achieving the high-end sector of the global market. In support of their strategic goal, unplanned and unexpectedly, the 2020 harvest is considered “historic” by experts, despite climate change claims and the worldwide health and economic instability caused by the COVID-19 pandemic. In terms of export, Uruguay is trailing Argentina and Chile in product quality, and it is far behind in export revenues, which can be described as meager. For this research, it has been challenging to find reliable data because OIV does not track its low statistical significance. Although not verifiable, the agency “Uruguay XXI” [24] cites that Uruguayan wine export revenues at the beginning of 2020 were approximately $3.4 million. It states that it has exceeded the revenues for 2018 and 2019 during the same period. Wine managers in Uruguay are planning to capitalize on the harvested high-quality grapes produced in 2020, hoping to penetrate the world market further and gain market shares. INAVI [6] intends to monitor the development of the COVID-19 pandemic, especially its effect on major importing countries like Brazil and the U. S., to exploit and capture their niche market for imported premium wines. Uruguayan export data gathered to date indicates that despite the COVID-19 pandemic health crisis, an increase of 10% in export revenues from over 50 countries is projected compared to 2019. The leading importers are Brazil, the United States, Russia, Mexico, and Asia.
4. Theoretical Background
According to Camillo et al. [25] “global wine trade competitiveness” within the framework of the global wine business is defined as “the capability to sustain trade, maximize market shares, and gain market dominance in the global environment,” and “wine market globalization” is defined as “all economic activities in the global wine marketplace that allow stakeholders to export and import wines across the world.” Therefore, firms are considered competitive when they can sustain production and trade with consistent quality wines at competitive prices while producing superior returns [25]. Within this framework, “competitiveness” is based and built upon the assumption that wine companies can access sufficient capital, acquire land, attract labor, and optimize operation by acquiring and applying new technologies conducive to competing in the global marketplace. According to Porter [26,27,28], competitive advantage has given rise to many theories and has been attributed to endless definitions, depending on its application and scope [28]. Consequently, within this context, “competitive advantage is characterized as the long-term advantage one business entity has over competing entities within its competitive industry.” “Global competitive advantage” has the same characteristics; however, it has no special or geographic limitations except for lack of diplomatic and commercial reciprocity. Thus, achieving a competitive advantage strengthens the firm’s strategic position within the business environment. According to Porter [28] the theory of global competitive advantage proposes that States/countries and businesses should pursue policies that create high-quality goods that can sell at high prices in the global marketplace [28,29]. According to Porter [28] the crucial factor is productivity growth with a focus on national and global strategies. Within these economic activities, competitive advantage is created when a firm develops core competencies, distinctive competencies, or a combination of both, that allow it to outpace its competitors. Various scholars have introduced, investigated, studied, and refined competency and distinctive competency [30,31,32,33,34,35,36]. A competency can be described as a “bundle of resources and capabilities that create a competitive advantage when exploited.” Instead, a distinctive competency is a competency that is unique to a firm or a business and creates a superior competitive advantage. Distinctive means that it is uniquely different and, in its nature, cannot be easily copied, duplicated, imitated, or otherwise used because it may be rare and unchallenged. Thus, a distinctive competency becomes the foundation for the development of an invincible competitive advantage. Sources of distinctive competencies can be proprietary technological breakthroughs, industry position, unique resource accessibility, market relations, cost advantage, business processes, manufacturing processes, people capability and knowledge, customer satisfaction, geographic location, terroir, climate, or being the first organization to use this competency. It can be a synergistic integration of several complementary components of a business model or employee skills, e.g., the experience of a viticulturist or enologist working in synergy through every step of the grape growing and winemaking process. This creates one of the fiercest forms of competitive advantage. Notwithstanding the previous definitions, the most unique “distinctive competency” framework states that a company should not strive to be competitive; it should be the only one creating and owning the absolute competitive advantage by being the only firm offering a particular product or service. Consequently, it becomes challenging or impossible for competitors to comprehend, copy, duplicate, substitute, or replicate. This is particularly true when the business aspects of importance, function, concept, philosophy, and individuality are interconnected in a compelling enterprise of operational complexity.
Considering the challenges and opportunities in developing distinctive competencies, it is a strategy every enterprise must aim at creating as the building block for sustaining long-term competitive advantage. In an everchanging environment, like the wine industry, the distinctive competencies will eventually lose their strengths and become less distinct or less unique due to newcomers, with either better products, similar products, or substitutions. Therefore, to sustain a competitive advantage, the distinctive competencies must be dynamic, continuously evolving, and innovative, and the firm must constantly monitor the competition. Within the context of the competitive environment, firms must also develop and integrate Dynamic capabilities [37,38] meaning that competencies must be continuously monitored and adjusted either deliberately, preventatively, or reactively, to mitigate the environmental changes in the global competitive wine business landscape. Thus, the process becomes a daunting task for management.
4.1. Theoretical Framework
A theoretical framework is proposed concerning wine industry capabilities and competitive advantage strategies to support the analysis and reply to the research questions from published literature. Consequently, the concept of dynamic capabilities as introduced by Teece et al. [38] and competitive advantage strategies, according to Porter [28] are integral in the relationship of the global wine industry, with a specific focus on the Uruguayan wine industry [25]. First, before discussing the concept and formulation of gaining a competitive advantage, one must assess the capability and capacity of a firm or, in this case, an industry. Therefore, it is crucial to consider that it will have zero value whenever an opportunity presents itself if there is no capacity. According to McMillan [39], “the winners of tomorrow will be the wineries that…critically evaluate their organization’s capacity to react, develop solutions and execute quickly, then evaluate their success or failure to continuously improve.” In the wine business, excess capacity is the opposite; it exists when the market demand for wine is less than the volume of the winery could potentially supply. However, lack of capacity is the inability to meet market demand due to capacity constraints.
Hence, striving for competitive advantage will depend on the capability and capacity to produce and meet buyer demands. Accordingly, achieving a competitive advantage within and outside the country’s boundaries will depend on various factors including, but not limited to, the number of competing companies, the size of the industry and its attractiveness, the target market size, demand, the purchasing power of the consumer, the price point and sustained price level, and the consistency of product quality, among others [40]. The work of management scholars [25,29,30,31,32,33,40] suggests that crucial components in the formulation of the competitive framework are the determinants of competitive advantage. In the process of strategizing for competitive advantage, there are important determinants to consider: product quality, consistency, the continuum of the supply chain, branding, product benefits to the consumer, product lifecycle, target market and the size of the industry, the number of competitors competing for the same market share, and the capability and capacity of the firm. In formulating a strategy, the critical factors of success or failure must also be investigated: strengths, weaknesses, opportunities, and threats. In striving for global competitiveness, an extended PESTLE analysis is also essential. PESTLE stands for political, economic, social, technological, legal, environmental, the factors that determine whether a firm can compete in the global hyper-competitive wine marketplace [25]. In addition, Porter’s Five Forces model will complement the preceding analytical tools and techniques [26,29]. Lastly, although not always relevant, the factor of “country culture” can also be investigated, if applicable. In southern Europe especially, wine is part of the culture and a way of living. In other countries, this may not be the case.
In formulating strategic intent to choose which market to target and compete with, the firm must decide what strategy is best suited to achieve a competitive advantage. The strategic choices are cost leadership, differentiation, and focus, or a combination of two strategies, such as differentiation and focus. Table 1 shows a pricing scenario and terminology currently applicable in the US, regardless of the product’s country of origin. The prices represent a computed average based on current pricing, which can fluctuate depending on the individual firm’s pricing strategy, based on demographics and geographic location [41,42]. The following paragraph highlights the selection process and consideration for a competitive strategy.
4.2. Strategic Choice
4.2.1. Cost Leadership
4.2.2. Differentiation
It targets customer demographics that appreciate better product benefits, higher quality for the increased price level. Refer to Table 1, items 7 through 10.
4.2.3. Focus
It targets specific demographics in specific markets, including niche markets using cost leadership or differentiation strategy. For a focus strategy to succeed, it must implement a strategy that targets a specific market, such as a minute niche others cannot serve, such as the scenario presented in Table 1. However, the focus strategy could target the luxury market. Refer to Table 1, items 10 through 12.
5. Research questions
Based on the aim of the research, a set of research questions are proposed.
- A.
- What are the critical competing factors of the Uruguayan wine industry?
With the competitive nature of the global wine market increasing, the Uruguayan wine industry will face great challenges competing in global export markets. Therefore, the critical competing factors necessary for Uruguay to successfully penetrate and expand exports in the global market are challenged, and the Uruguayan wine industry will need to determine how to focus its attention and effort most effectively toward increasing awareness of competitive threats and opportunities in the global wine business landscape.
- B.
- How do these factors compare to global competitors?
Uruguay is considered one of the New World (NW) wine-producing countries with a short history of winemaking. Consequently, it lacks history, expertise, and recognition as a successful wine-producing country with competitive wine quality. Therefore, great effort is being made in becoming a competitive global player and adapting to the main challenging forces against countries that have historically enjoyed status as worldwide industry leaders.
- C.
- What are the opportunities for the Uruguayan wine industry to become a competitive player in the global wine business landscape?
Opportunities will continue to exist in all markets and regions of the wine world; however, so will threats. The main threats will come from new entrants like India with a production and consumption potential like China. Therefore, the opportunities may not be supported because of the size of the market and the capacity to supply the markets. However, supplying quality products to niche markets may reduce the threats caused by new and powerful entrants.
6. Methodology
6.1. Research Design
This study adopts an exploratory, holistic, and qualitative research design to investigate the phenomenon in detail. Given the insufficient empirical research literature available on the topic of competitive advantage in the wine industry in Uruguay, this study builds on the research of various scholars and their published literature. Specifically, we base our research on a theoretical background, formulating a framework to explore if Uruguay could become a competitive player in the global wine market by creating and sustaining competitive advantage through strategic choice, competitive pricing, and dynamic capabilities [25,28,30,31,32,33,37,38,40].
This study design uses desk research and netnography [44,45] to collect and extrapolate data. Netnography or cyberethnography is a qualitative method to gather data using online search engines. It is an interpretive research method that applies non-intrusive observation, which focuses primarily on the context of online textual communication and not on the physical forms of human communication [45]. This methodology, which has been popular among marketing scholars, and scholars of various disciplines, is beginning to be used by wine research scholars as well. It is designed to gather data from online platforms, including social media and company websites and blogs, by searching for specific keywords or #hashtags and by eye-scanning individual websites and webpage content [46,47,48,49].
6.2. Data Collection
Data were collected during May and June 2020 from aggregate sources. As for the data collection, desk research was conducted first to analyze the data on hand. Online data were searched using keywords and #hashtags, as highlighted in the methodology section. To find relevant content and apply different techniques for data usability, multiple internet search engines like Google, Yahoo, Edge, and Safari were used in the process. In addition, statistical data were obtained from wine producers and Uruguayan Government Agencies. First, the online statistical content was screened for relevant information. Consequently, data that were useful for the study were downloaded from the sources, sorted, catalogued with identifiable codes, and stored for further reading. The most relevant content was marked. The downloadable files were available in various formats such as Pdf, Microsoft Word, Excel, and PowerPoint. Some files were convertible, e.g., PDF to Word and Excel, making the coding and extrapolation expedient. Other formats, such as PNG, JPEG, or JPG, were not convertible and needed to be transcribed. Some data were available only in the Spanish language; however, it was translated into English closest to its original meaning. The terms that were not translatable, such as the names of regions or specific localities, were left in their original form. Aggregate data were analyzed for its original meaning and interpretation, for potential use in the research, and for the scope of reporting it. Relevant aggregate data were transcribed for further processing and for creating tables and figures which have been included in the text. Where appropriate, both the authors and the publisher were credited for the work. Qualitative data were extrapolated, elaborated, and reported according to the guidelines. Since this is an empirical–baseline study, for which a holistic approach was considered, additional data like that pertaining to competitive South American countries were collected and used appropriately.
Consequently, the aggregate data were collectively analyzed by applying interpretative techniques such as content analysis, coding, and recursive abstraction [50,51]. The study further triangulates aggregate data by testing for validity and reliability by directly analyzing stakeholders in the Uruguayan wine industry. Furthermore, through direct electronic requests, the authors collected data from practitioner and agency reports, readily available on digital archives, and through content analysis of firms’ online reports, press kits, and cyclical press releases, bulletins, or newsletters. The final data used were further checked for validity, creditability, and reliability by examining and contrasting the reporting of the same cases by various sources through positive and negative analyses and confirmability and balance [52,53]. The goal was to collect sufficient qualifiable data, analyzed, synthesized, and summarized to be used for testing, validation, and contribution to strengthening the research. By analyzing Uruguay’s current positioning of wine production and competitiveness, this baseline study attempts to determine if Uruguay’s wine industry could exploit its resources to sustain a competitive advantage.
7. Findings
The first section presents Uruguay’s country characteristics and wine industry infrastructure. It is the second-smallest country in South America, after Suriname. It has nineteen regions with the following departments: Artigas, Canelones, Cerro Largo, Colonia, Durazno, Flores, Florida, Lavalleja, Maldonado, Montevideo, Paysandu, Rio Negro, Rivera, Rocha, Salto, San Jose, Soriano, Tacuarembo, Treinta y Tres. Grapes are farmed in only 15 of them, representing a wide geographical distribution of viticulture throughout the country. The vineyards have adapted to various microclimates, in which there is great diversity in terms of temperature, humidity, thermal amplitude, rainfall, and soil types, and varied terrain ranging from flat to rolling terrain and hills, with the influence of rivers and the ocean, among others. In the departments dedicated to viticulture, there is diversity in terms of the distribution of the cultivated area, the number of existing vineyards, and grape production. The south of the country has the highest concentration of vineyards, exactly in the Departments of Canelones, Montevideo, and San José and towards the south–west in Colonia. The Department of Canelones consists of 66.9% of the vineyards that occupy 65.9% of the surface and contribute 74.4% of the national grape production. Montevideo is second with 15.1% of the vineyards, 12% of the surface, and 12.2% of the production. The Departments of Colonia and San José consist of 6.4% and 3.6% of the vineyards, 6% and 4.8% of the surface, and 3.5% and 3.7% of production, respectively. In the south–east area of the country, the Department of Maldonado consists of about 2.9% of the vineyards, 6.4% of the surface, and 3.5% of the national production. The vineyards in the Departments of Lavalleja and Rocha consist of small surface areas with low production. The remaining vineyards are located on the west coast: in the Departments of Artigas, Salto, Paysandú, and Soriano; in the north: Rivera and Tacuarembó; and to the center: Peach and central–south in Florida. About 96% of the population resides in urban areas, overwhelmingly in the southern part of the country. About half of the approximately 3,473,730 inhabitants live in and around the capital of Montevideo [54]. The seasonal climatic temperatures are generally warm, with no freezing temperatures, which are very favorable for viticulture. There is abundant rainfall throughout the year. The average temperatures overall range from 16 °C to 20 °C (61 °F to 68 °F), and high humidity levels are frequent, which can adversely affect the process of grape growth and maturation. It has an overall fertile land and a very fertile low coastal land, and the terrain overall is predominantly rolling plains and low hills. The average elevation is about 109 m or 358 feet. The highest elevation is 514 m or 1686 feet. The terrain has numerous and varied microclimates that contribute to high-quality and highly complex wines. The agricultural land for aggregate agricultural use is estimated to be close to 90% of the total landmass. The land is rich in hydropower, which makes it ideal for farming, especially for viticulture. The hydrographic network has high density and is highly branched, and all river currents have a similar single slope toward the Atlantic Ocean. Due to abundant rainfall, up to 1000 mm, or 39.4 inches per year, the water plain is low; however, vineyards use controlled irrigation for grape quality and yield optimization. Being a country below the Equator, the seasons are reversed compared to those north of the Equator. Thus, the grape cultivation in Uruguay happens between September and March of every year for still wines. Harvest for sparkling wines may start in January, depending on the ripeness of the grapes and the sugar content [55]. Although the landmass to populations ratio is about five hectares or 12.4 acres per inhabitant, the agricultural activities in 2017 represented only 6.2% of the total GDP, compared to 24.1% and 69.7% for industry and services, respectively [56]. Although Uruguay has a diversified economy in economic terms, the agricultural sector appears to have opportunities for growth and expansion. In addition, Uruguay has enjoyed an export surplus, which indicates that it is less dependent on imports. Only a few years ago, Uruguay was a rice importer, and today it is a rice exporter. As of April 2019, various sources, including [6] reported that Uruguay’s agricultural land used for viticulture had 1271 vineyards, with 6144 hectares of vineyard surface, cultivated by 925 growers, represented by 843 companies/ individuals. According to [6] as of 2020, there are 201 registered commercial wineries. Figure 4 shows the dispersion of the wineries across the departments. In addition, according to Bodegas.com [57], wine production has an induced economic impact on tourism, and there is a substantial development in wine tourism or “enotourism.” The Bodegas.com website lists about 89 commercial wineries engaged in wine tourism [57].
7.1. Factors of Production
The viticultural sector operates mainly in the southern part of the country, in the Departments of Canelones, Montevideo, Colonia, and San José. In 2020, the Department of Maldonado, located in the country’s southeast, had higher than expected production. About 75% of grapes are produced from single vineyards averaging ≤ 5 ha or 12.4 acres in size. Table 2 shows that in 2020, the vineyard surface in South America declined as it did in the rest of the world, and wine production declined proportionally. Compared to other South American countries, Uruguay ranks fifth in terms of vineyard surface; however, it ranks fourth in production due to greater output [6].
The average age of Uruguayan vineyards is less than 21 years old, thus making the potential for vineyard management and growth control ideal. The Tannat vine represents the most extensive vineyard surface, followed by Muscat of Hamburg and Ugni Blanc varietals, and to a lesser extent, Merlot and Marselan varietals, which are under 50 years of age. However, embedded in these vineyards’ surfaces is evidence that Tannat and Muscat of Hamburg are also being farmed and probably are replacing the older vines. Ownership characteristics are different in every country and so are in Uruguay. Table 3 shows land ownership by typology. About 45% of the land used for planting is privately owned, and 51.7% are under shared ownership between commodatarios (similar to a leasehold), tenants, partners, and mediators. The meaning of commodatarios, from Latin commodatum or (commodity), is based on ancient Roman law, and in Scots law, “a proper loan, that is, loan of a thing to be returned in precisely the form in which it was lent. It is a gratuitous contract, the obligation being to return the goods, fair wear, and tear excepted” [58,59].
7.2. Aggregate Production by Grape Type
Table 4 shows the aggregate production by grape typology. About 80% of the vineyard surface produces 76% red grapes, and about 24% of the vineyard surface produces white grapes, which means that the yield by surface is higher for red grapes than white grapes. This represents a yield of 17,000 kg or 17 metric tons per hectare for white grapes and 13,300 kg or 13.3 metric tons per hectare for red grapes.
Table 5 shows the red grape types sorted out by varietal, vineyard surface, and production for 2019. The table indicates that the most popular varietals are the Tannat, with 27.6% of the National Total Production and 26.6% of the surface, and the Hamburg Muscat, with 21.8% and 18.9% of the National Total Production and Area, respectively. These are followed by the less popular Merlot, with 8.9% and 11.2%; the Cabernet Sauvignon, with 4% and 6.5%; the Cabernet Franc, with 2.9% and 3.9%; the Marselan, with 2.6% and 2.6%. Other grapes which score less than 2% either by surface or production, or both, are, in this context, statistically insignificant.
Table 6 demonstrates the white grape types sorted out by varietal, vineyard surface, and production for 2019. The table shows the most popular varietals are the Ugni Blanc, with 16.4% of the National Total Production and 10.5% of the surface, followed by the Sauvignon Blanc with 2% and 2.1%, respectively and the Chardonnay with 1.4% and 1.7%, respectively.
The INAVI [6] database shows that the total vinifera (grapes destined to produce wine) harvest for 2020 consisted of 83,284,835 kg, or about 96.6% of the total production, of which 19,599,605 kg or about 26% were white grapes, and 63,685,230 kg or about 76% were red grapes. However, the total harvest was 86,229,241 kg, including white table grapes 853,723 kg and red tables grapes 2,090,683 or about 3.4% of the total harvest combined. Table grapes production is not within the scope of this research. However, the authors included this data to prevent inaccuracies when comparing the data shown herein and the original data shown by INAVI [6].
Table 7 shows the end process and destination of harvested grapes. The analysis revealed that 97% of the total national grapes production was vinified, sold to winemakers, made into wine in its own winery, sold to a cooperative, sold to individuals, or for own consumption. As for the latter, fresh consumption represented only 3% of the total production.
8. Synthesis and Discussion
8.1. Critical Success/Failure Factors of the Uruguayan Wine Industry
8.1.1. The Factor “Land”
The current vineyard surface of 5884 ha (±14530 ac) represents about 0.0794% of the agricultural land available for farming. The land is fertile and it is being exploited, but only at a small percentage. Cattle breeding is the largest agricultural product. Interestingly, the ratio of cattle to people is about 4:1. According to Global Edge [60,61], export statistics show that meat and meat products combined represent about 31.4% of its total export. However, wine export has not yet been traced by national and international statistical institutions and cannot be measured in relationship to land use. In early 1990, the MERCOSUR, South America’s free trading block, required Uruguay to adhere to the agreement and change its wine strategy to stay competitive with Chile and Argentina. The action compelled Uruguay to modify the vineyards’ surfaces and mitigate the total grape farming by increasing premium wine production and reducing the production of bulk wines. With the help of international consultants, the change in vineyard infrastructure led to vineyard surface reduction, the production of high-quality wines, the opening of premium wineries, and the expansion of related economic activities like wine tourism. Regardless of the semantic use of either terrain to terroir, because Uruguay’s wine industry is young, its soil is considered virgin, unlike the old-world countries that have been exploited for over 2000 years. To date, there have been about 99 different soil types identified; they consist of clay, sandy loam, limestone, and granite, with good drainage. The only challenge is the control of moderate to high humidity, which can be devastating and destroy entire crops. According to Bodega Garzon [5], Uruguay’s vineyard expansion and exploitation of vast unfarmed land to produce high-quality wines by applying sustainable practices demonstrates that the country is conducive to becoming a global player. Data show that Uruguayan viticulturists are highly educated and trained to manage the land and in wine grape farming, and so are the enologists who are able to exploit the land and produce world-class wine that can compete in the world wine production [6].
8.1.2. The Factor “Human” (Labor)
Uruguayans benefit from one of the most developed social systems in terms of social laws, with well-established social security, well-developed health care, educational systems, and technological advancements. It relies substantially on renewable energy sources but is still dependent on oil and mineral fuels. It outlawed smoking in public places in 2006, and it legalized recreational cannabis and same-sex marriage in 2013. Most significantly, in 2019, it was the first country in the world to implement a traceability system for its entire agricultural production, including wine production. The people are highly educated due to the free education system from elementary school to post-secondary. The country boasts a 99% literacy rate. However, the social system causes a high unemployment rate of (currently) 8.7% ± 26% male and ±30% female.
Consequently, there is an indication of brain drain as about 18% of human capital emigrates. Hence, investment in education is not benefiting Uruguay in the long run. As of 2019, the largest population’s cohort ranges between the age of 25 and 54 years: 39.48% (male 658,871/female 671,172) [14,57], due to emigration and a low birth rate 0.27/1000 the population ages at a fast pace. The labor force available is about 50% of the ±3,473,650 population [54]. The active labor force is employed in agriculture at 8.1%, in industry at 18.9%, and service at 73%, and, as mentioned above, the unemployment rate is at about 8.7%. In addition, Uruguay granted asylum and/or legal residency to over 16,000 Venezuelan refugees. In sum, the small population is facing challenges. Nevertheless, the government strives to improve the economic status quo, primarily through the agricultural sector and its potential expansion in export. The pro-capita income (Purchasing Power Parity) ranks 3rd among the thirteen South American countries, after the Falk Islands and Chile [12,54,56]. Accordingly, there is an indication that Uruguay is well positioned within the South American competitive landscape.
8.1.3. The Factor “Capital”
Capital is one of the three economic factors believed to be the pillars of any economy. To a certain extent, capital is a crucial factor in the wine industry as well. Self-financed businesses and raising money for new ventures are contingent on many factors, and the most crucial is the risk factor [62]. If an industry is not attractive, the money will not flow into it. Whether it is internal financing or through Foreign Direct Investments (FDIs), the risk factor must remain low because it attracts highly qualified investors and employees. Data show that Uruguay’s wine industry attractiveness is moderate to high, considered from a futuristic point of view. According to COFACE [62], Uruguay’s economy is promising and attractive because it has abundant agricultural and forestry resources, social homogeneity, political stability, active reform policy (business environment, public finance, social security coverage), a favorable business environment, substantial foreign direct investment, and it is a member of Mercosur. It has preferred trade relations with the EU and the United States. This is a very favorable environment for capitalizing on the current conditions to grow the wine industry. On the other side, to support the entire economy, it must reduce its vulnerability to commodity prices, especially in the export of soybeans, beef, and dairy products, to which wine will be part of the aggregate export products. Furthermore, it must become less export-dependent on Brazil, Argentine, and China, it must improve transportation infrastructure, and it must reduce competitiveness by decreasing currency inflation and stabilizing the public debt.
8.1.4. The “Supply and Demand” Factors
As cited in the literature review [39], the opportunity has zero value if there is no capacity. Specifically, using a hypothetical scenario, if Uruguay’s sustainable competitive advantage were to be built solely on the quality of the Tannat grape, increasing demand, thus causing a price increase, the capacity to increase the production of Tannat wine could be limited due to grape production constraints. More specifically, if it takes four years for a new vineyard to produce wine, and at least three more years for a premium wine to be released to the market, the demand for additional Tannat wine would not be met. Hence, the opportunity to market and sell more wine has zero value due to production capacity constraints.
The data show that Uruguay can build capacity to develop an efficient supply chain for the wine industry. It has the land, labor, technological capability, and the country’s attractiveness and industry. In establishing the supply chain and value chain, the continuum is key to develop and build capacity to meet demand. Disruption, due to breakdown of the continuum, can cause adverse short-term or long-term effects on the supply chain, including loss of market shares and divestment. Therefore, given the successful launch of Uruguayan premium wines in the global market, supported by the awards received to date, the uniqueness of the land, climate, and the newness of a product like the Tannat grape, an ideal global demand level can be generated with opportunity for growth.
A successful example is the “Winery of the Year” award given by Wine Spectator Magazine to Garzon Winery [5]. Once success has been achieved and demand has been created, the wine producer has reached the point of no return. The success, however, will depend entirely on the synergistic strategy of all stakeholders in the supply chain. Summarizing the five economic factors, the data collected shows that Uruguay has fertile and expandable agricultural land, a well-educated, young workforce ready to be deployed, and access to capital. Thus, the data show that these economic factors are crucial components in creating demand and building and sustaining wine industry goals for achieving a global competitive advantage.
8.2. Answer to the Research Questions
- A.
- What are the critical competing factors of the Uruguayan wine industry?
- Being one of the countries in the southern hemisphere to produce wine earlier provides a first mover’s advantage in experimentation, new product release, immediate corrective action if needed, earlier market penetration, and monitoring of competitors in the rest of the world.
- The geographic location, favorable climate, terrain, hydropower and the high density of the hydrographic network, available agricultural land, an available and well-educated workforce, unique land infrastructure, the newness of grape varietal (Tannat) being introduced to the world market with positive results, the government support to aid the industry and grow the export business, as well as complementary economic developments such as enotourism and its multiplier effect and its contribution to the local economy. Since the data were collected using cyberethnography without interviewing key players and a sample of the population, the list presented above may not be exhaustive.
- The attractiveness of the industry and the political landscape may attract investors interested in investing in the wine industry, both domestic and foreign. Although Uruguay’s ranking in terms of ease to do business is not high, it moves upward. This is supported by the membership with the Mercosur, OIV, and the preferred trade relations with the EU and the United States. Uruguay has benefited from export surplus, indicating that the wine industry could follow suit and positively contribute to the country’s GDP.
- B.
- How do these factors compare to global competitors?
- Being a young wine-producing country, the grape and wine production infrastructure is also new, which means that Uruguay has a significant advantage in using the latest technology, the latest and most efficient viticultural and enological management practices, and can become completely environmentally sustainable before other established countries. In 2019, Uruguay became the first country in the world to implement traceability technology and track all agricultural products. Currently, about 73% of the workforce is employed in the service industry, which means that it is well-trained technologically. Being over 90% dependable on renewal energy is also an asset. This technological advancement can significantly benefit the wine industry, especially the viticultural sector. Uruguay has less dependency on imported fuel and natural gas while striving to become competitively sustainable.
- C.
- What are the opportunities for the Uruguayan wine industry to become a competitive player in the global wine business landscape?
- In 1987, the Uruguayan Government enacted a law to create the National Institute of Vitiviniculture (INAVI) [6], which was assigned with the legal status of a person of non-state public law and with legal headquarters in the city of Las Piedras, department of Canelones. In January 1988, INAVI formally began operating as the governing body of the country’s wine policy. Today, INAVI is the governing body of all wine activity in the country. It has the legal authority to control the production process, regulate volume and quality, and develop the industrial process. INAVI plays a vital role in the promotion, development, and research of wine activities. In addition to the tasks assigned by law, INAVI has the function of advising the Executive Power on a mandatory basis and supervising compliance with the regulations that are issued in the wine sector. In collaboration with other governmental agencies, the agency is a catalyst for significant activities in establishing a booming and globally competitive wine industry.As an example, a particular project supported by INAVI was launched in 2019 to end in 2022, with the title “Adjustment, dissemination, and application of the integrated production regulations for wine grapes, aligned with the demands of the international wine market” [1]. The scope is to strive to consolidate a sustainable and differentiated production system in Uruguayan viticulture under an integrated production standard. The goal is to make the Uruguayan wine industry achieve better conditions of competitiveness to meet an increasingly demanding international wine market in terms of environmental care, food safety, and worker safety in production systems. Therefore, it would be possible to increase the volume of wine placement in the international market, while meeting the required quality standards, and ensuring a product with a low content of pesticide residues and the lowest impact on the general environment [23].
- By achieving the same or exceeding the standard of competing countries, Uruguay can position itself as a global player in the global marketplace. Uruguayan wine producers are striving to become global players, and as such, the government holds a membership with the OIV, The International Organization of Vine and Wine, an intergovernmental organization made up of members from 47 wine-producing countries [7]. Membership allows access to data, competition, education, and other benefits and compels members to act according to the organization’s rules. OIV and INAVI are the primary sources of the data gathered for the study, although additional, non-scientific data were gathered from other sources.
According to the preceding summary, the research questions were answered. Question A is answered mainly in Item 2. Question B also is answered in that Uruguay is comparable to other countries, and it can also take the lead in future endeavors within the wine industry. The explanation provided in Question C demonstrates that the industry is not operating in a vacuum. Instead, it has the full support of the government. Therefore, all three research questions have been sufficiently answered.
8.3. Proposed Strategies for Growth and Exploitation Factors
As mentioned earlier, Uruguay’s current wine market can only grow by increasing its export capability. Thus, applying the various theories of competitive advantage emphasized in the text, stakeholders should draw on the work of management and determine the best strategy to pursue to achieve and sustain competitive advantage.
The first consideration is to decide the strategic choice as to how to compete against players in the wine industry: cost leadership, differentiation, or focus strategy. In Table 1, we present pricing terminology and price association as important factors in formulating a strategy. The price for each target market is established, in most cases, at harvest time, when quality and quantity produced is determined. Consequently, a market and a strategic choice is formulated, and a marketing campaign is established. Table 1 is a reference tool showing prices which fluctuate over time due to conditions determined by the factors “demand, supply, and price affordability of consumer.”
Consequently, the stakeholders must answer a strategic question: should a player compete based on cost leadership, differentiation, focus, or a combination of focus and differentiation strategies? This first decision is crucial in the long run. Therefore, managers of the Uruguayan wine industry must determine their competitive position, investigate the competitors’ position, and formulate the best strategy to compete. Subsequently, a strategy that began with internal and external environmental scanning or a SWOT analysis, followed by a PESTLE analysis and applying Porter’s Five Forces model [26,63], would allow for data gathering and analyses. The results of the analyses will enable the managers to formulate and apply their competitive strategies. Table 8 and Table 9 show a sample SWOT and PESTLE analysis, respectively, adapted for global competition. Lastly, although not always relevant, the factor of “country culture” can also be investigated, if applicable.
Figure 5, below, depicts a graphic representation of Porter’s Five Forces Model and the factors which influence the activities in the global wine trade. Based on the authors’ extensive experience in global wine trade research, the factor which most influences the buyer’s behavior in the buying decision making process is the threat of substitution. Threats of substitution can include the consumer switching to beer and other beverages, the falsification of wine by unethical suppliers, the influence of various advertising channels like social media efforts which influence the buyer’s consumption behavior and psychographics, the effect of new legislation on alcohol quantity consumption in regard to drinking and driving, and the reaction of consumers to possible health related claims and benefits.
In sum, analyzing a target market for business development and expansion to achieve a competitive advantage is crucial to management. In the global marketplace, most factors are interrelated. Hence, a PESTLE analysis provides a holistic view of the country a firm wishes to do business with, from historical, current, and future perspectives. When a PESTLE analysis is conducted on a global basis, it is referred to as LONG PESTLE. A wine industry analysis is a critical evaluation of the factors integral to the wine industry, emphasizing its application to a new entrant or an established company that seeks to formulate a growth strategy for possible market expansion.
9. Conclusions
The study results benefit the players in the Uruguayan wine industry, scholars engaged in wine research, and practitioners in the field. The paper contributes to the body of knowledge of strategic management, strategic marketing, globalization within the wine business, wine trade growth strategy, and international business studies overall. From the research methodologies applied, the results have been summarized and synthesized and offer valuable data useful to future research. Wine companies wishing to expand their business globally and eventually reach the strategic objective need the right tools and information, some of which were presented above. This work represents a preliminary baseline study as the building block for future research concerning the Uruguayan wine industry.
This research had limitations. Firstly, it was conducted using cyberethnography or netnography. Therefore, the reliability of the aggregate data depends on the sources from which they were obtained. The data were obtained from a variety of resources available through the internet. However, most of the technical and statistical data were obtained mainly from the Instituto Nacional de Vitivinicultura [6]. In synthesizing the data, several computation irregularities were observed. In two instances, the data were later verified by contacting the sources directly. Uruguay is a young wine-producing country, and data show that it is striving to become a competitive player in the global wine trade. Data availability and accessibility are challenging. For this research, it was determined that only one government agency, the Instituto Nacional de Vitivinicultura [6] accurately tracks and consolidates data relevant to the wine industry. It consolidates data from various sources, including the Department of Agriculture and producers’ self-reporting or mandatory reporting. Data gathered from other sources were examined, and after careful evaluation, it was determined that it derived from INAVI after all.
Regardless of the current global political landscape, globalization remains a challenge for wine companies attempting to enter a new market and grow their market share by competing against rivals. In this interconnected and politically unstable environment, strategic decisions are made at an unprecedented rate, hence, missing an opportunity could mean the end for many companies. Nevertheless, penetrating a new global market remains a complex undertaking. Therefore, wine companies wishing to grow their market in one or more foreign countries must make effective strategic choices and decisions and apply a well-formulated strategic marketing plan. To reach the strategic objective, stakeholders need the right tools and information [64], which were presented in this study.
This investigation has provided a significant amount of data and relevant findings. It is difficult for companies to penetrate a global market without the necessary expertise. This study should be replicated with face-to-face interviews with stakeholders on location while companies are attempting to establish a global presence or expand their export capabilities. Related topics should be researched in marketing with an emphasis on consumer behavior, pricing, and future developments. In the interim, practitioners in the field may be capable of using most of the tools and information presented in this study to pursue a preliminary investigation on how to achieve global competitiveness or country by country-specific research.
Author Contributions
A.A.C.: Data collection and literatue review; W.G.K.: Methodology, data nalysis, synthesis, discussion, and conclusion. All authors have read and agreed to the published version of the manuscript.
Funding
This research received no external funding.
Data Availability Statement
Data is contained within the article.
Acknowledgments
We would like to thank Christian A. Wylie (Managing Director of Bodega Garzon Winery, www.BodegaGarzon.com) and Martina Litta (Comercio Exterior, I.NA.VI., Canelones, Uruguay, http://www.inavi.com.uy/) for their vital support and for providing qualitative and quantitative data about the Uruguayan Wine Industry.
Conflicts of Interest
The authors declare no competing financial interest.
References
- Baptista, B. La temprana vitivinicultura en Uruguay: Surgimiento y consolidación (1870–1930). Am. Lat. Hist. Econ. 2008, 29, 99–129. Available online: http://www.scielo.org.mx/scielo.php?script=sci_arttext&pid=S1405-22532008000100003&lng=es&tlng=es (accessed on 20 June 2020).
- Carrau, F.M. The emergence of a new Uruguayan wine industry. J. Wine Res. 1997, 8, 179–185. [Google Scholar] [CrossRef]
- Galanti, A. El Vino. La Industria Vitivinícola Uruguaya. Estudio Crítico Ilustrado; Tipograpfia Italia: Mendoza, Argentina, 1919; pp. 73–173. Available online: https://babel.hathitrust.org/cgi/pt?id=uc1.$c47020&view=1up&seq=7 (accessed on 13 June 2020).
- Frutos, E.D.; Curi, A.B. Desafíos y proyección de una viticultura joven de escala reducida: Tannat del Uruguay. BIO Web Conf. 2019, 12, 03007. [Google Scholar] [CrossRef]
- Bodega Garzon. Premios Y Reconocimientos, Nuestros Vinos Premiados a Nivel Internacional. Bodega Garson, Uruguay. Available online: https://bodegagarzon.com/es/premios/?concurso=wine-spectator&wine_sel=&pais=&galardon=&year_sel= (accessed on 20 May 2020).
- INAVI. Estadísticas Anuales De Viñedos—2019 Datos Departamentales. Instituto Nacional de Vitivinicultura (INAVI). 2020. Available online: http://www.inavi.com.uy/vinedos/estadisticas (accessed on 22 June 2020).
- OIV. 2019 Wine Production; International Organisation of Vine and Wine Intergovernmental Organisation: Paris, France, 2020; Available online: http://www.oiv.int/en/statistiques (accessed on 20 May 2020).
- Analist Group. Precision Farming with the Drone: NDVI Vineyard Analysis. How to generate and analyze the NDVI of a Vineyard with the Drone for Precision Farming. Available online: https://blog.analistgroup.com/en/precision-farming-with-the-drone-ndvi-vineyard-analysis/ (accessed on 20 June 2020).
- Smith, P. Drones in Precision Agriculture. DroneBelow.com. 2019. Available online: https://dronebelow.com/2018/07/19/drones-in-precision-agriculture (accessed on 25 June 2020).
- Carpenter, G.; Humphreys, A. Disruptive Innovation. What the Wine Industry Understands about Connecting with Consumers. Harvard Business Review Online Edition 2019. Available online: https://hbr.org/2019/03/what-the-u-s-wine-industry-understands-about-connecting-with-customers (accessed on 25 June 2020).
- Cooper, J.O.; Heron, T.E.; Heward, W.L. Applied Behavioral Analysis, 2nd ed.; Pearson Education, Inc.: Upper Saddle River, NJ, USA, 2007. [Google Scholar]
- GIZ. Baseline Study of the Armenian Wine Sector. Development Strategy for 2015–2025; GIZ (Deutsche Gesellschaft für Internationale Zusammenarbeit, GmbH): Bonn, Germany; iCare (The International Center for Agribusiness Research and Education): Yerevan, Armenia, 2014; Available online: https://icare.am/arc/publications (accessed on 7 August 2019).
- Barreto, S. La escuela agricola ‘Jackson’ de El Manga. Rev. Union Viticultores Bodeg. 1936, 135, 4–19. [Google Scholar]
- Barreto, S. Cartillas Comision Pro-lndustria Vitivinicola; Ministerio de Lndustria: Montevideo, Uruguay, 1932. [Google Scholar]
- Varzi, P. La lndustria Vitivinicolaen Nuestro Pais; El Economista Umguayo: Montevideo, Uruguay, 1917. [Google Scholar]
- Versini, G.; Carrau, F.M.; Gioia, O.; Dalla Serra, A. Caracterizacion de perfil aromatico del vino Moscatel Miel de Uruguay y su relacion con otros Moscateles. In Proceedings of the XXI Congreso Mundial de la Viña y el Vino de OIV, Punta del Este, Uruguay, 27–30 November 1995; pp. 173–174. [Google Scholar]
- CNN. Why Uruguay Could Be the World’s Next Great Wine Destination. 11 March 2020. Available online: https://www.cnn.com/travel/article/uruguay-winery-bodega-garzn/index.html (accessed on 15 May 2020).
- Cicchetti, D.V. Who won the 1976 blind tasting of French Bordeaux and US Cabernets? Parametrics to the rescue. J. Wine Res. 2004, 15, 211–220. [Google Scholar] [CrossRef]
- Hulkower, N.D. The judgment of Paris according to Borda. J. Wine Res. 2009, 20, 171–182. [Google Scholar] [CrossRef]
- Taber, G.M. Judgment of Paris: California vs. France and the Historic 1976 Paris Tasting that Revolutionized Wine; Simon and Schuster: New York, NY, USA. Available online: https://www.simonandschuster.com/books/Judgment-of-Paris/George-M-Taber/9780743297325 (accessed on 20 May 2020).
- Kim, C.W.; Mauborgne, R. Blue Ocean Strategy: How to Create Uncontested Market Space and Make the Competition Irrelevant; Harvard Business School Press: Boston, MA, USA, 2005; Volume 28, pp. 31–32. [Google Scholar]
- INAVI. VINOS URUGUAYOS PREMIADOS EN EL MUNDO. Uruguay Obtuvo Ocho Medallas -Dos De Oro Y Seis De Plata- En Las Ediciones 2020 De Los Concursos Vinalies Internationales Y Concurso Internacional De Vinos Bacchus. 2020. Available online: http://www.inavi.com.uy/noticias/vinos-uruguayos-premiados-en-el-mundo (accessed on 20 May 2020).
- INIA. Special Research Project. National Institute for Agricultural Research. 2020. Available online: http://www.inia.uy/Proyectos/Paginas/FPTA_353.aspx# (accessed on 20 June 2020).
- Uruguay XXI. Vinos Uruguayos De Calidad Histórica Se Preparan Para Salir Al Mundo. Uruguay XXI, Promoción De Exportaciones, Inversiones e Imagen País. 2020. Available online: https://www.uruguayxxi.gub.uy/es/noticias/articulo/vinos-uruguayos-de-calidad-historica-se-preparan-para-salir-al-mundo (accessed on 20 May 2020).
- Camillo, A.A.; Holt, S.; Marques, J.; Hu, J. A strategic analysis of the competing factors in the global wine trade and the development of a mode. In Handbook of Research on Effective Marketing in Contemporary Globalism; Christiansen, B., Yıldız, S., Yıldız, E., Eds.; IGI Global: Hershey, PA, USA, 2014; pp. 281–300. [Google Scholar] [CrossRef]
- Porter, M.E. How competitive forces shape strategy. Harvard Business Review, March–April 1979. [Google Scholar]
- Porter, M.E. Competitive Strategy: Technique for Analyzing Industries and Competitors; Free Press: New York, NY, USA, 1980. [Google Scholar]
- Porter, M.E. The Competitive Advantage: Creating and Sustaining Superior Performance; Free Press: New York, NY, USA, 1985. [Google Scholar]
- Porter, M.E. (Ed.) Competition in global industries: A conceptual framework. In Competition in Global Industries; Harvard Business School Press: Boston, MA, USA, 1986. [Google Scholar]
- Hitt, M.A.; Ireland, R.D. Corporate distinctive competence, strategy, industry and performance. Strateg. Manag. J. 1985, 6, 273–293, July–September. [Google Scholar] [CrossRef]
- Ljungquist, U. Core competency beyond identification: Presentation of a model. Manag. Decis. 2007, 45, 393–402. [Google Scholar] [CrossRef]
- Mooney, A. Core competence, distinctive competence, and competitive advantage: What is the difference? J. Educ. Bus. 2007, 83, 110–115. [Google Scholar] [CrossRef]
- Prahalad, C.; Hamel, G. The core competence of the corporation. Harv. Bus. Rev. 1990, 68, 79–91. [Google Scholar]
- Snow, C.C.; Hrebiniak, L.G. Strategy, distinctive competence, and organizational performance. In Strategic Management Concepts and Cases, 3rd ed.; Thompson, A.A., Jr., Strickland, A.J., Eds.; Business Publications: Piano, TX, USA, 1984. [Google Scholar]
- Stoner, C.R. Distinctive competence and competitive advantage. J. Small Bus. Manag. 1987, 25, 33–46. [Google Scholar]
- Yang, C. The integrated model of core competence and core capability. Total Qual. Manag. 2015, 26, 173–189. [Google Scholar] [CrossRef]
- Teece, D.J.; Pisano, G. The dynamic capabilities of firms: An introduction. Ind. Corp. Chang. 1994, 3, 537–556. [Google Scholar] [CrossRef] [Green Version]
- Teece, D.J.; Pisano, G.; Shuen, A. Dynamic capabilities and strategic management. Strateg. Manag. J. 1997, 18, 509–533. [Google Scholar] [CrossRef]
- McMIllan, B. The State of the U.S. Wine Industry 2021; Silicon Valley Bank, Wine Division: Santa Clara, CA, USA, 2021; p. 4. Available online: https://www.svb.com/globalassets/trendsandinsights/reports/wine/sotwi-2021/svb-state-of-the-wine-industry-report-2021.pdf (accessed on 30 April 2021).
- Barney, J. Firm resources and sustained competitive advantage. J. Manag. 1991, 17, 99–120. [Google Scholar] [CrossRef]
- Apstein, M. Wine Pricing, Still Economics 101. Wine Review Online.com. Available online: http://www.winereviewonline.com/Michael_Apstein_on_wine_pricing.cfm (accessed on 22 September 2019).
- Camillo, A.A. An analysis of wine list engineering of Three Michelin Star U.S. restaurants: A preliminary study. 2020, Unpublished manuscript.
- Précis of the, U.S. Wine Market and Three-tier Sales Channel. Tincknell & Tincknell, wine sales and marketing consultants. Available online: https://marketingwine.nfshost.com/wp-content/uploads/2020/06/tt-precis-of-us-wine-market-and-three-tier-sales-channel.pdf (accessed on 20 May 2020).
- Kozinets, R.V. I want to believe’: A netnography of the X-Philes’ subculture of consumption. Adv. Consum. Res. 1997, 24, 470–475. Available online: http://acrwebsite.org/volumes/8088/volumes/v24/NA-24 (accessed on 22 June 2020).
- Kozinets, R.V. The field behind the screen: Using netnography for marketing research in online communities. J Mark. Res. 2002, 39, 61–72. [Google Scholar] [CrossRef] [Green Version]
- Kozinets, R.V.; Dolbec, P.Y.; Earley, A. Netnographic analysis: Understanding culture through social media data. In Sage Handbook of Qualitative Data Analysis; Flick, U., Ed.; Sage: London, UK, 2014; pp. 262–275. [Google Scholar]
- Fait, M.; Cavallo, F.; Maizza, A.; Iaia, L.; Scorrano, P. An interpretative model for the Web image analysis: The case of a wine tourism destination. In Proceedings of the International Conference of the Society for Global Business & Economic Development, Ancona, Italy, 16–18 July 2014. [Google Scholar]
- Puri, A. The web of insights: The art and practice of webnography. Int. J. Mark. Res. 2007, 49, 387–408. [Google Scholar] [CrossRef] [Green Version]
- Reynolds, J.; Xun, J. Applying netnography to market research: The case of the online forum. J Target. Meas. Anal. Mark. 2010, 18, 17–31. [Google Scholar]
- Monder, R. Trading places: The ethnographic process in small firms’ research. Entrep. Reg. Dev. 1999, 11, 95–108. [Google Scholar]
- Willis, D.G.; Sullivan-Bolyai, S.; Knafl, K.; Cohen, M.Z. Distinguishing features and similarities between descriptive phenomenological and qualitative description research. West. J. Nurs. Res. 2016, 38, 1185–1204. [Google Scholar] [CrossRef] [PubMed]
- Åkerlind, G.S. Variation and commonality in phenomenographic research methods. High. Educ. Res. Dev. 2012, 31, 115–127. [Google Scholar] [CrossRef]
- Berg, B.L. Qualitative Research Methods for the Social Sciences, 7th ed.; Pearson Education: Boston, MA, USA, 2009. [Google Scholar]
- United Nations. World Population Prospects 2019, Online Edition. Rev. 1; United Nations, Department of Economic and Social Affairs, Population Division: New York, NY, USA, 2019; Available online: https://population.un.org/wpp/Download/Standard/Population (accessed on 22 June 2020).
- Zimmer, G. Harvest Report, Uruguay 2020; Gabi Zimmer Reports Web Publishing, Uruguay. Available online: https://gabizimmer.com/free-report (accessed on 20 June 2020).
- CIA. CIA World Fact Book, Uruguay. CIA Library. Available online: https://www.cia.gov/library/publications/the-world-factbook/geos/uy.html (accessed on 22 June 2020).
- Bodegas. Enoturismo. La Bodegas Del Uruguay. Available online: http://www.bodegasdeluruguay.com.uy/bodegas (accessed on 23 June 2020).
- Defiendace. Comodato vs Depósito. Sito de la Republica Argentina. Available online: https://www.defiendase.com/articulos/comodato-vs-deposito/2737 (accessed on 22 June 2020).
- Legal Dictionary. Meaning of Commodatum. Legal Dictionary. 2020. Available online: https://legal-dictionary.thefreedictionary.com/commodatum (accessed on 22 June 2020).
- Global Edge. Global Insight: Uruguay, Introduction. Global Business Knowledge. 2020. Available online: https://globaledge.msu.edu/countries/uruguay (accessed on 19 June 2020).
- Global Edge. Global Insight: Uruguay, Trade Statistics. Global Business Knowledge. 2020. Available online: https://globaledge.msu.edu/countries/uruguay/tradestats (accessed on 19 June 2020).
- COFACE. Uruguay’s Micro Economic Indicators. Coface Economic Studies. Available online: https://www.coface.com/Economic-Studies-and-Country-Risks/Uruguay (accessed on 13 June 2020).
- Porter, M.E. The Five Competitive Forces That Shape Strategy. Harvard Business Review, January 2008. [Google Scholar]
- Wine by Numbers. Global Trade 2019. A Statistical Analysis Provided by the Unione Italiana Vini. Association for The General Conservation of the Activities of the Wine Industry Economic Cycle. Il Corriere Vinicolo. Available online: www.winebynumbers.it (accessed on 20 May 2020).
Figure 1.
Countries with the highest production for the year *2019 (*estimate). Source: The International Organization of Vine and Wine [7].
Figure 1.
Countries with the highest production for the year *2019 (*estimate). Source: The International Organization of Vine and Wine [7].

Figure 2.
World wine trade 2003–*2019 (*Estimate). Source: The International Organization of Vine and Wine [7].
Figure 2.
World wine trade 2003–*2019 (*Estimate). Source: The International Organization of Vine and Wine [7].
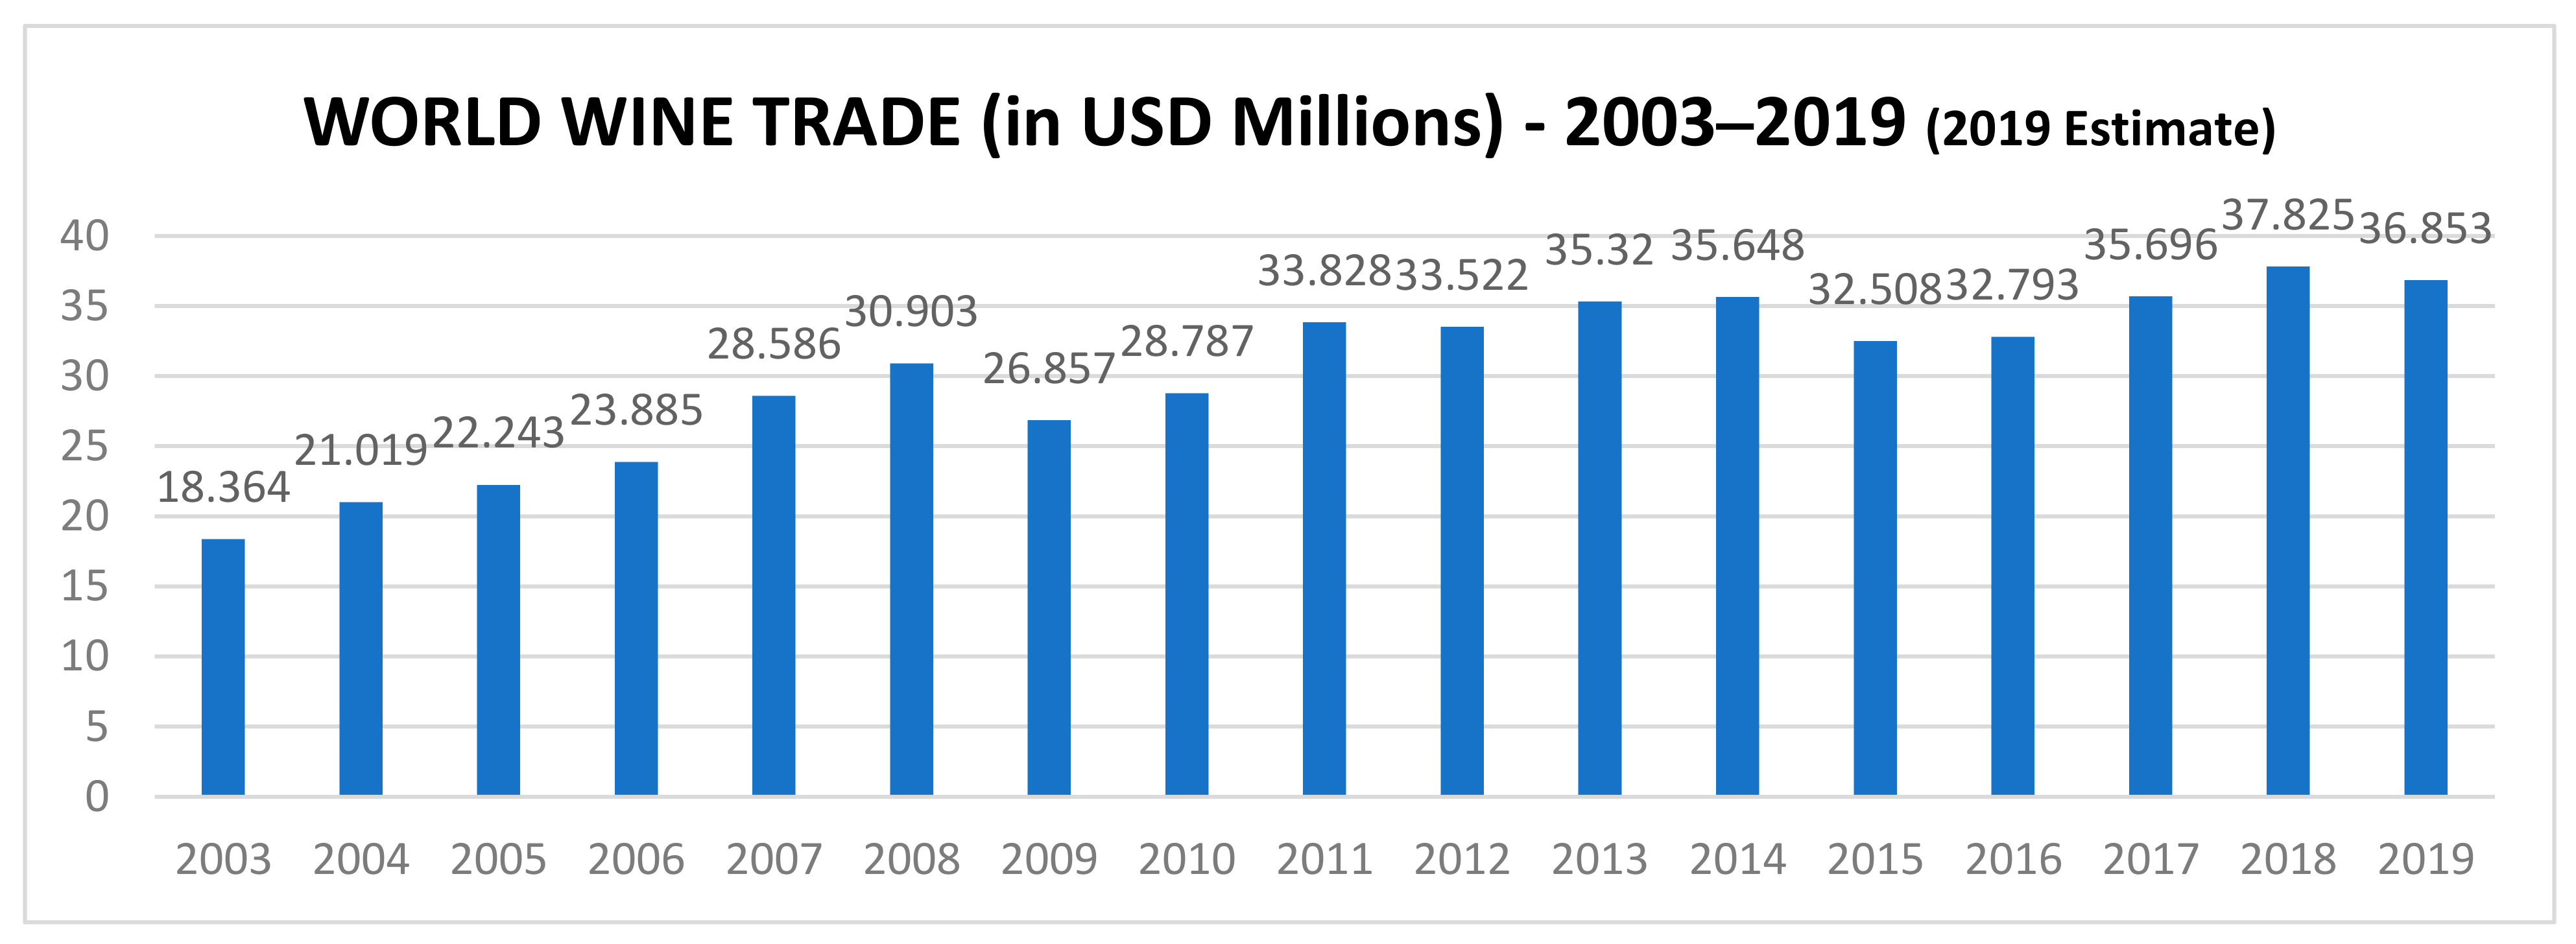
Figure 3.
World wine total value index-year-over-year (YOY) increase/decrease. 2003–*2019 (*estimate). Source: International Organization of Vine and Wine [7].
Figure 3.
World wine total value index-year-over-year (YOY) increase/decrease. 2003–*2019 (*estimate). Source: International Organization of Vine and Wine [7].


Figure 5.
Sample Porter’s five forces model applied to the wine trade. Source: Authors’ synthesis from literature review [63].
Figure 5.
Sample Porter’s five forces model applied to the wine trade. Source: Authors’ synthesis from literature review [63].


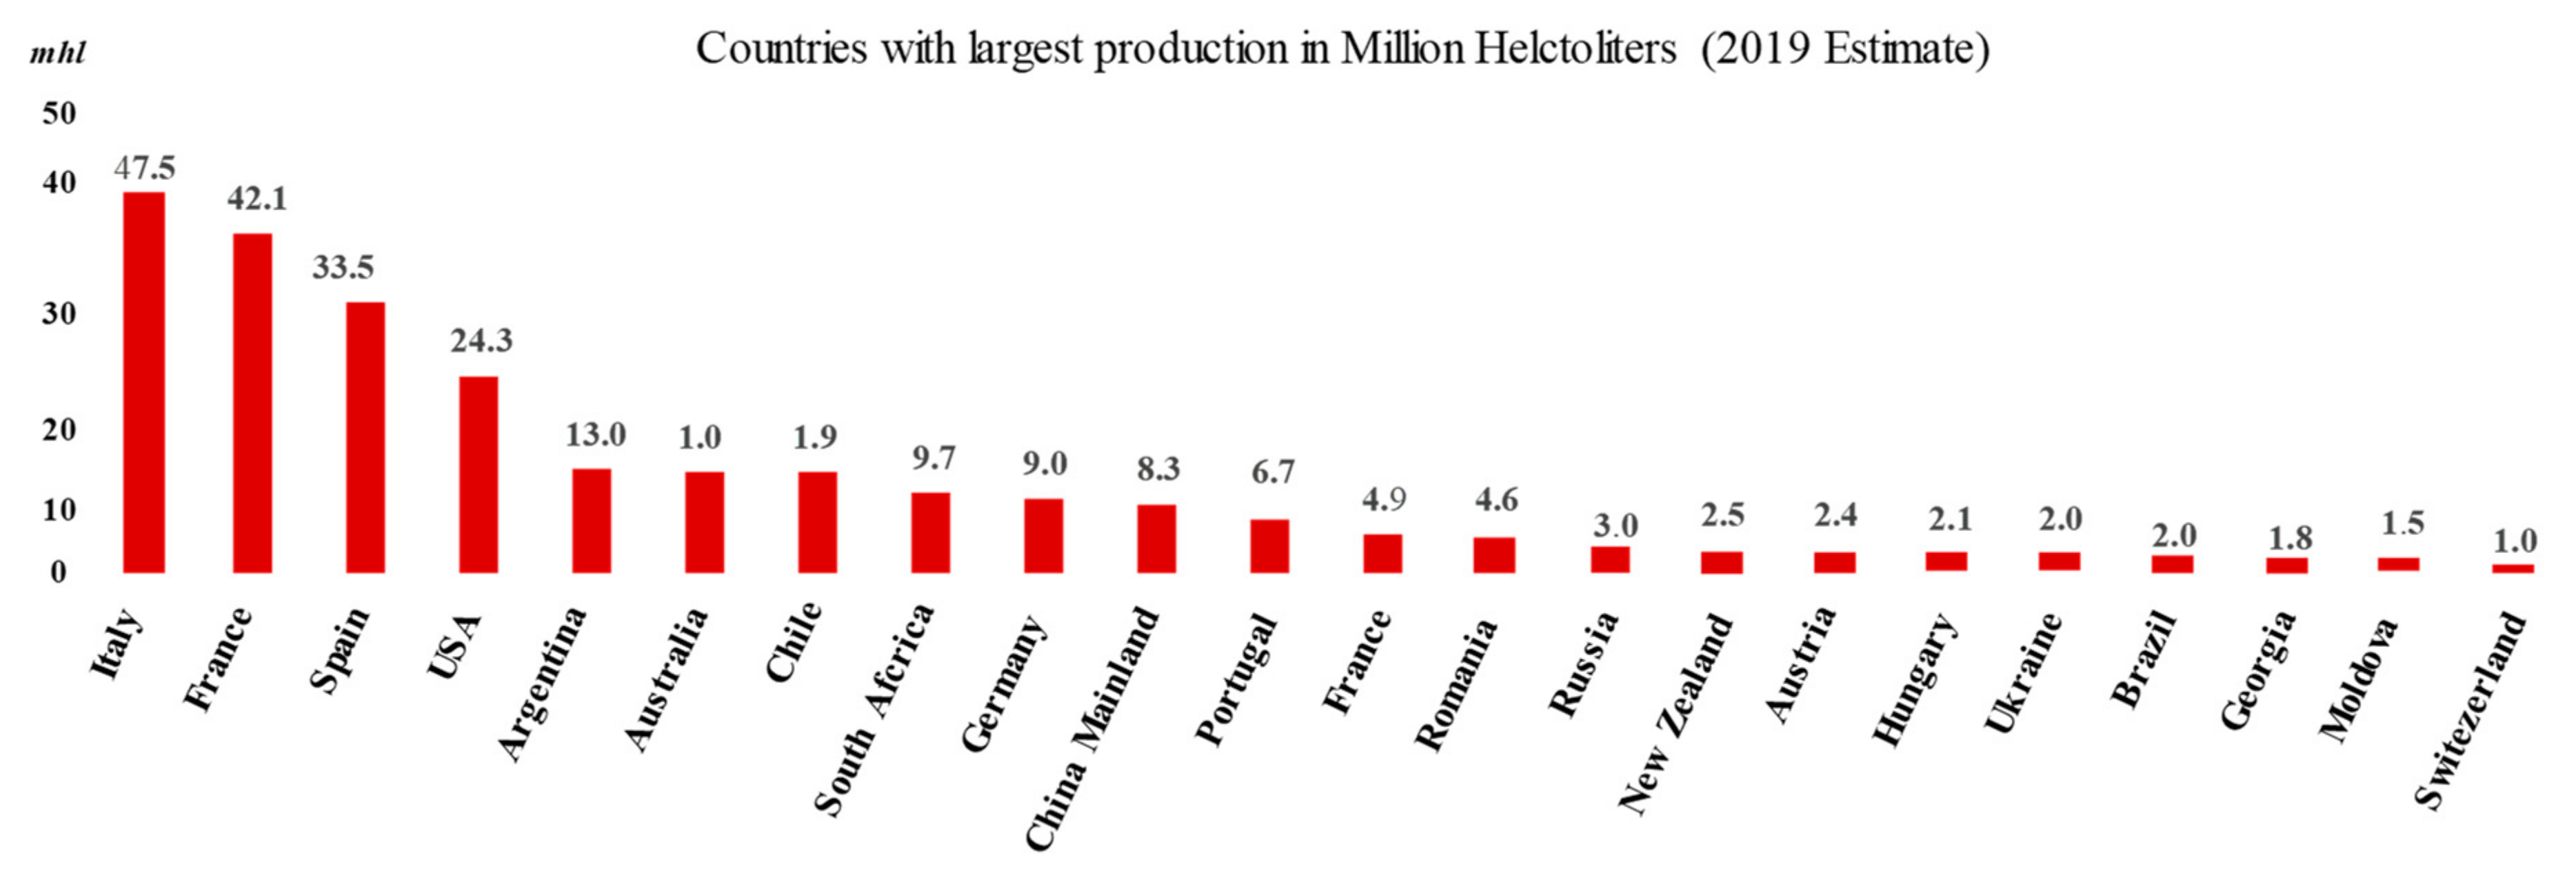
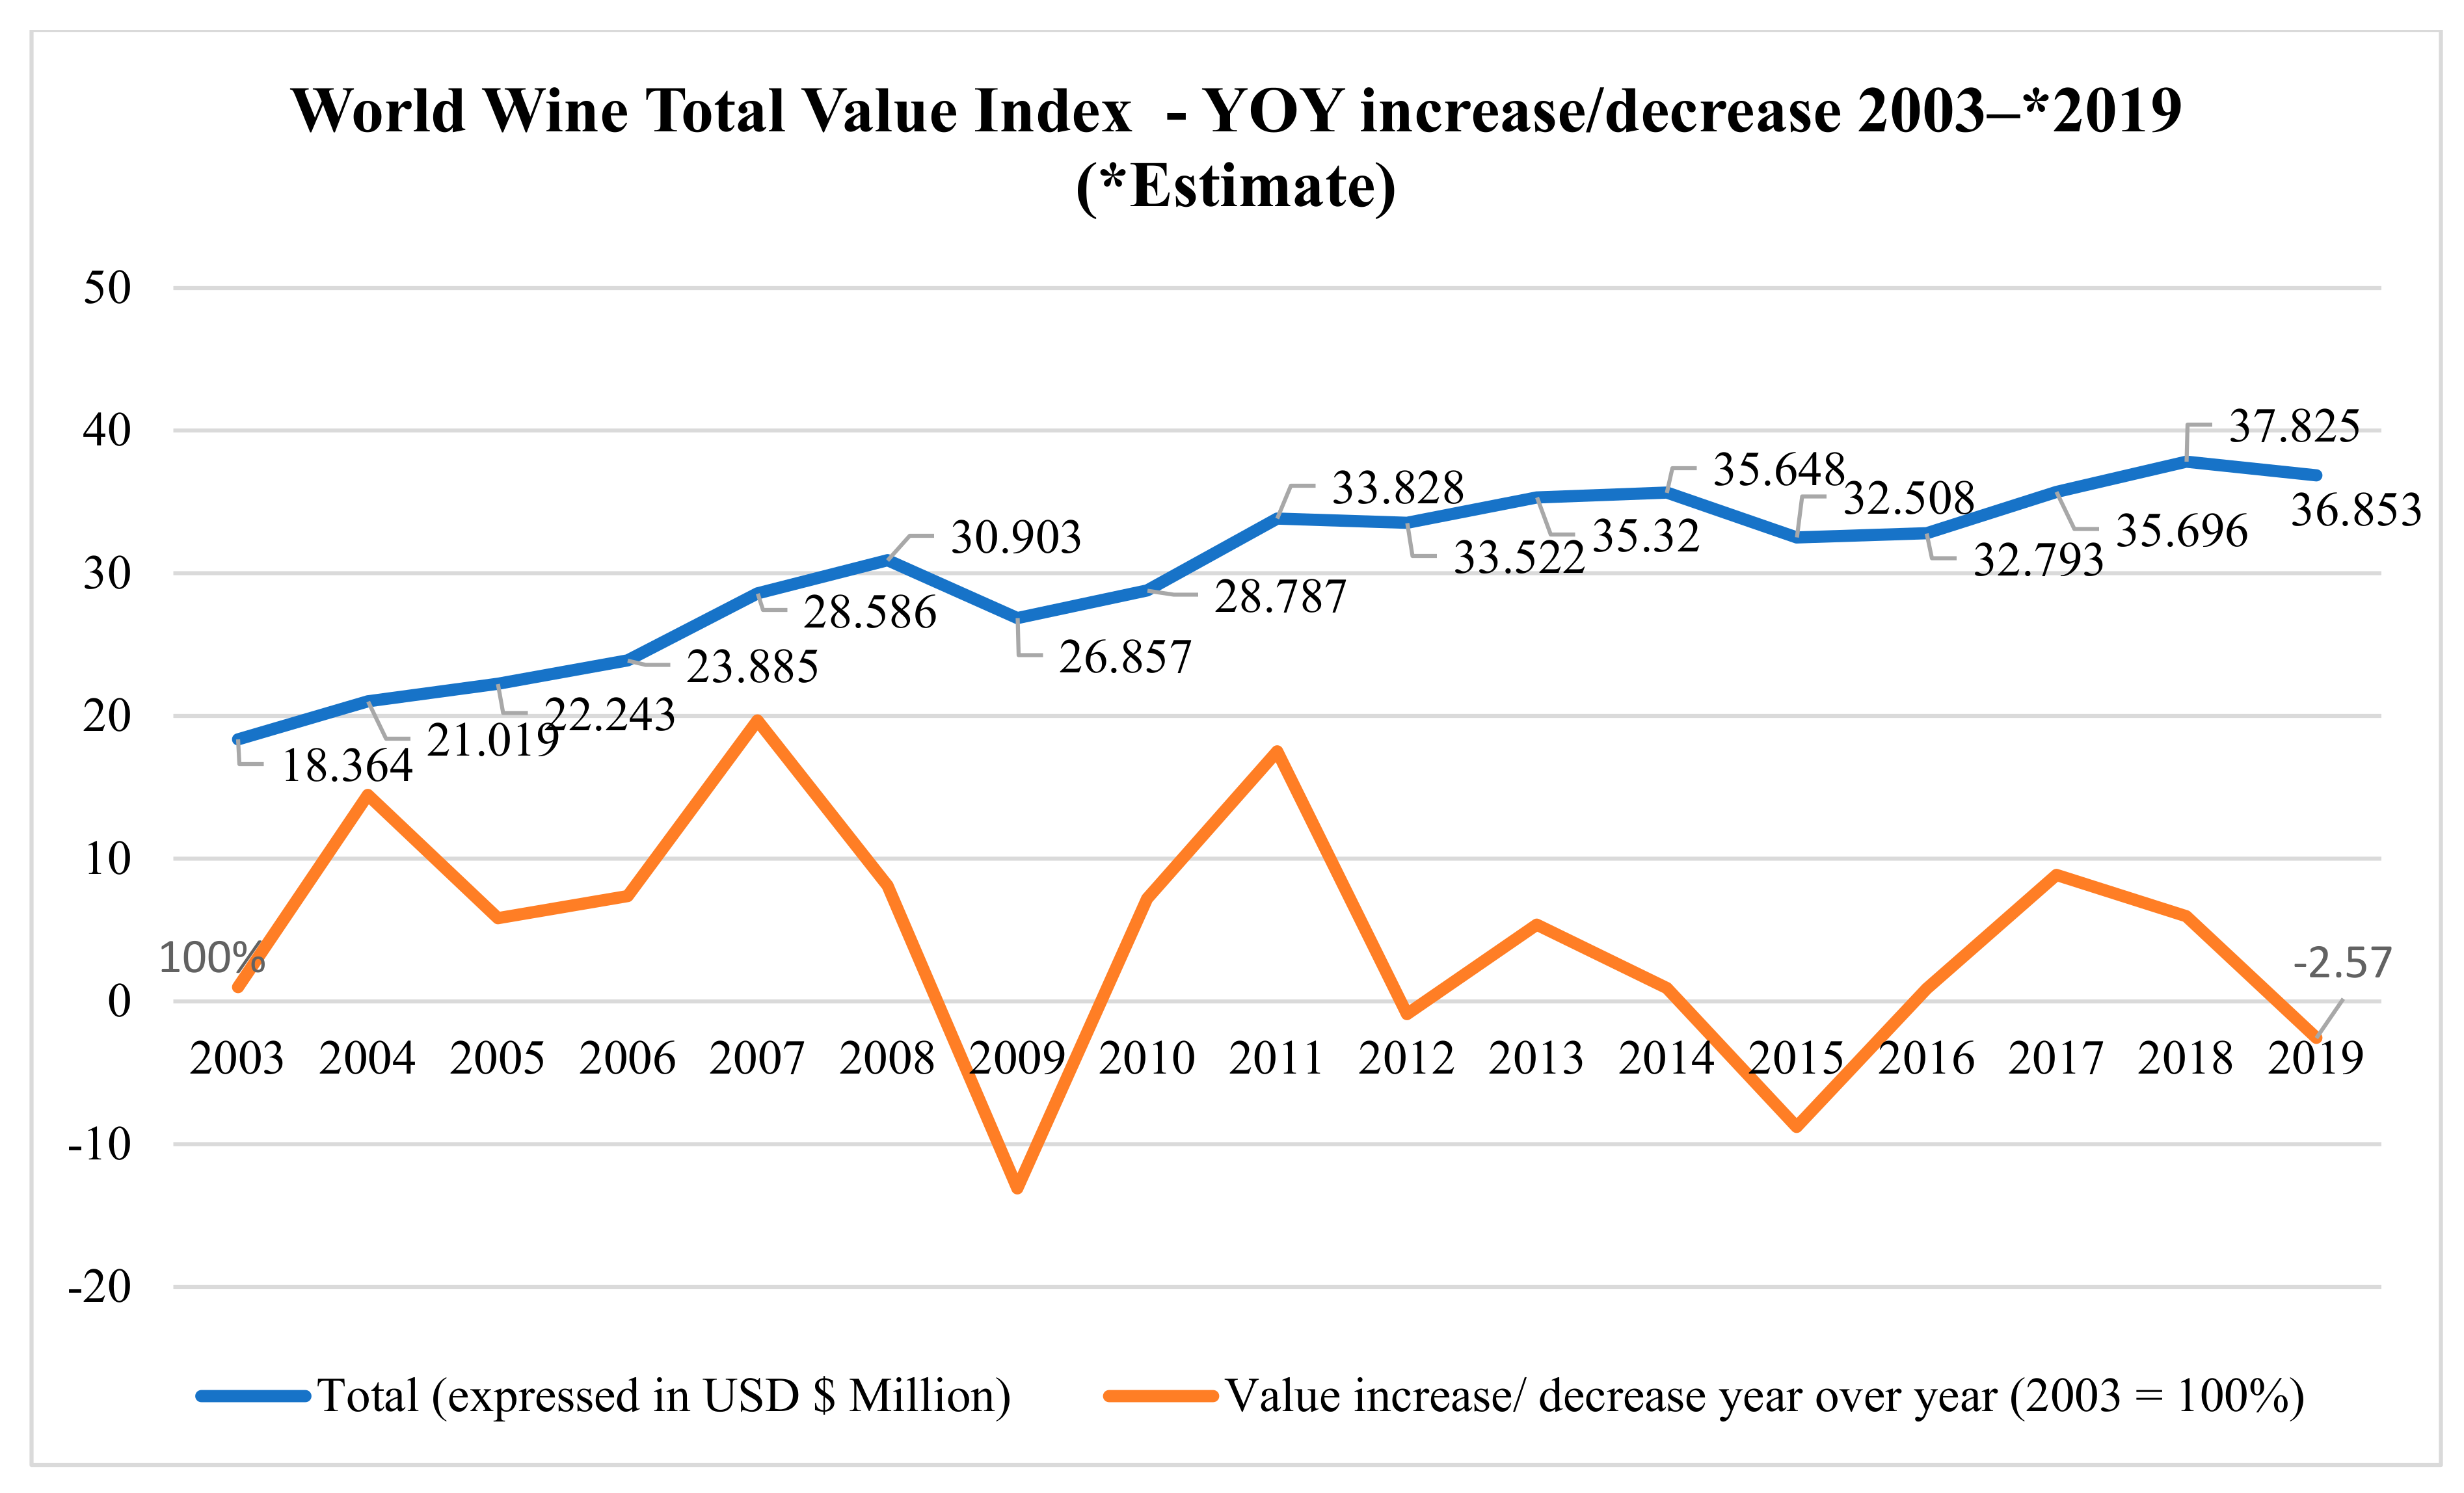
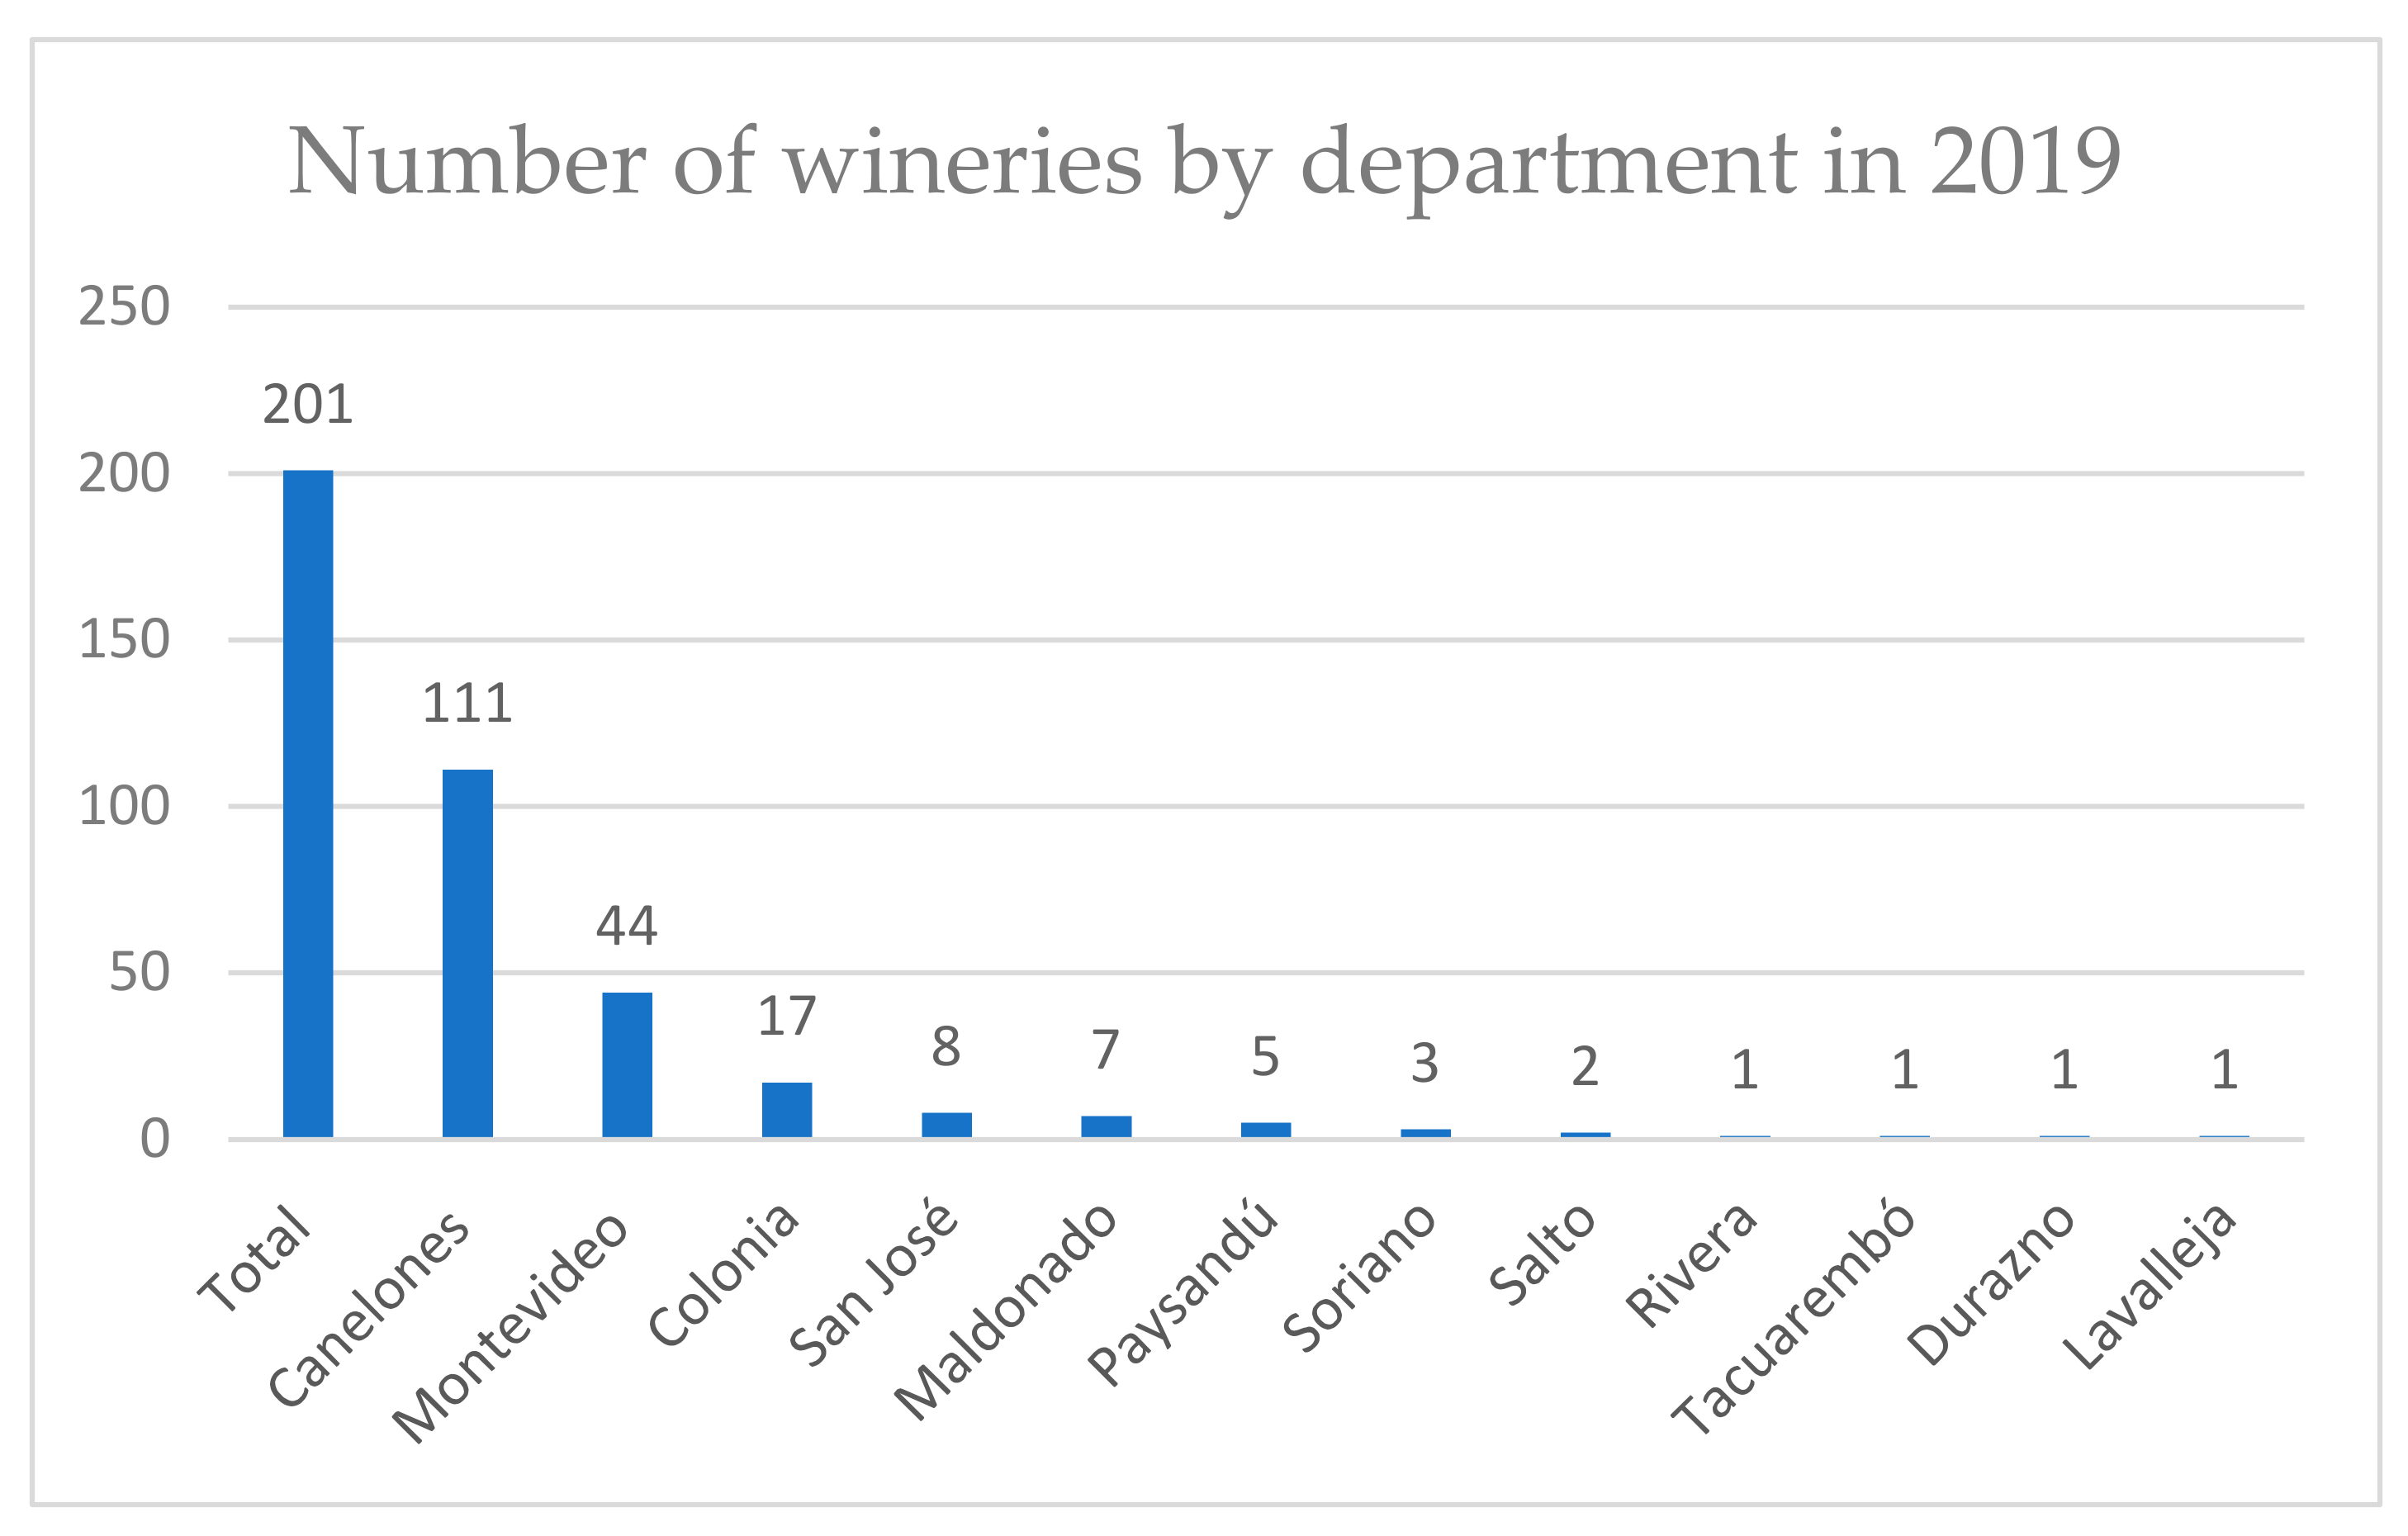
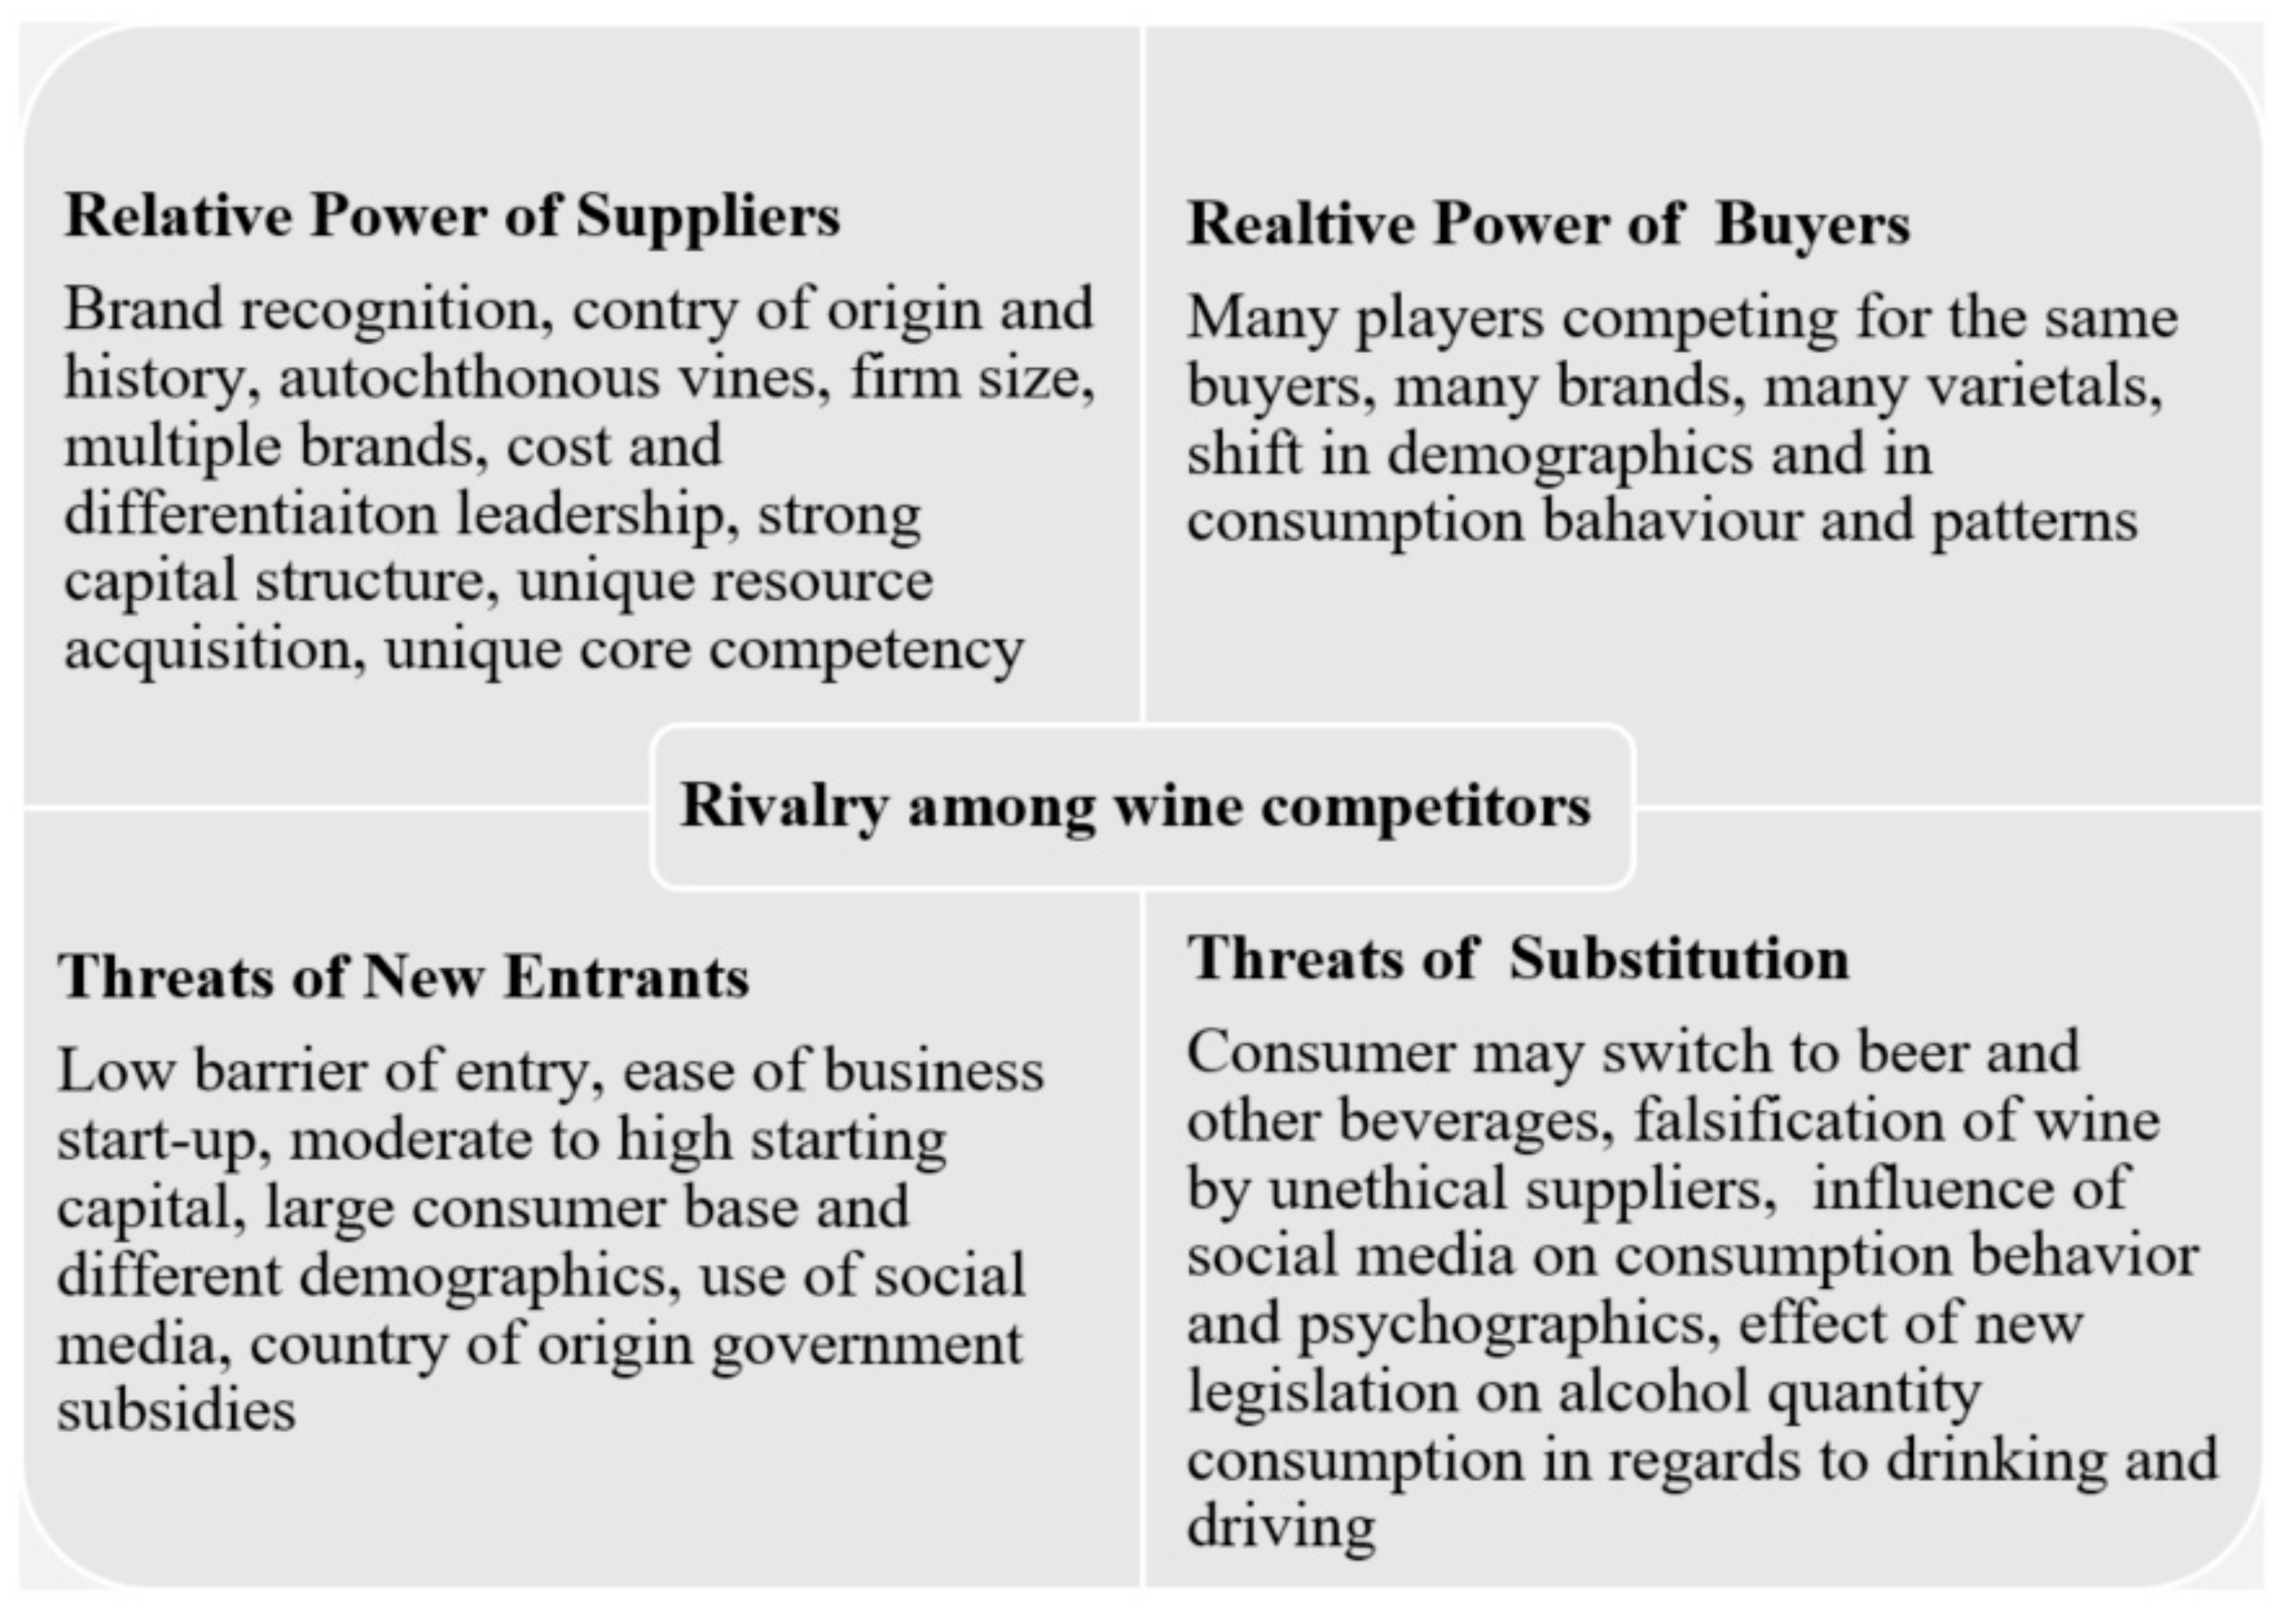
Table 1.
Pricing terminology and price range used in the wine value chain.
|
|
|
|
|
|
|
|
|
|
|
|
|
|
Source: Wine Production, Operation, and Distribution, Wine Business Institute, Précis of the U.S. Wine Market and Three-tier Sales Channel [43].
Table 2.
Estimate of wine production output and vineyard surface in South America.
| South America Wine Production 2020 Mhl (million Hectoliters) ** Estimate | South America Vineyard Surface Area in 2020-kha (1000 hectares) ** Estimate, ## Includes Non-Vinifera Grapes | ||
|---|---|---|---|
| Argentine ** | 11,600,000 | Argentine | 215,000 |
| Chile ** | 10,500,000 | Chile | 220,000 |
| Brazil ** | 2,000,000 | Brazil | 81,000 |
| Uruguay ** | 650,000 | Peru ** ## | 11,000 |
| Peru ** | 610,000 | Uruguay | 5880 |
| Bolivia ** | 82,000 | Bolivia ** | 3000 |
| Total ** | 25,442,000 | Total ** | 535,880 |
Table 3.
Land ownership by typology.
| Type of Ownership | Number of Vineyards | Percentage Share Of the Land |
|---|---|---|
| Aparcero (sharecropper) | 56 | 4.4% |
| Arrendatario (tenant) | 259 | 20.3% |
| Comodatario(leaseholder) | 323 | 25.4% |
| Medianero (mediator) | 21 | 1.6% |
| Ocupante(tenant) | 11 | 0.9% |
| Poseedor (keeper, proprietor, possessor) | 2 | 0.2% |
| Propietario (proprietor, owner) | 578 | 45.4% |
| Usufructuario (usufructuary, tenant for life) | 6 | 0.5% |
| Otros (other types of ownership) | 18 | 1.4% |
| Total | 100% |
Source: author’s own representation constructed from aggregate data collection from INAVI [6].
Table 4.
Aggregate grape production by typology in 2019.
| Grape Type | Production in (kg) | Percentage | Surface (ha) | Percentage |
|---|---|---|---|---|
| Red grapes | 65,775,913 | 76% | 4942 | 80% |
| White grapes | 20,453,328 | 24% | 1202 | 20% |
| Total production % | 86,229,241 | 100% | 6144 | 100% |
Source: INAVI [6].
Table 5.
List of red grape varietals currently cultivated and vineyard surface in Uruguay.
| 2019 Statistics | ||||
|---|---|---|---|---|
| Varietals | Surface | Production | ||
| Red Vinifera Grapes | ha (hectares) | Percent of National Surface | kg | Percent of National Production |
| Cot Rouge | 0 | 0.00% | 0 | 0.00% |
| Bonarda | 0 | 0.00% | 0 | 0.00% |
| Fortana | 0 | 0.00% | 0 | 0.00% |
| Grand Noir (Granoir) | 0 | 0.00% | 0 | 0.00% |
| Cereza O Criolla | 0 | 0.00% | 0 | 0.00% |
| Jurançon Noir | 0.06 | 0.00% | 0 | 0.00% |
| Carignan | 0.11 | 0.00% | 0 | 0.00% |
| Gamay | 0.18 | 0.00% | 637 | 0.00% |
| Aubun | 0.27 | 0.00% | 1000 | 0.00% |
| Barbera | 0.99 | 0.02% | 9000 | 0.01% |
| Mourvedre | 1.11 | 0.02% | 3800 | 0.00% |
| Garnacha (Grenache) | 1.19 | 0.02% | 8700 | 0.01% |
| Cinsaut (Picapol) | 1.45 | 0.02% | 0 | 0.00% |
| Folle Noire (Vidiella) | 2.10 | 0.03% | 17,390 | 0.02% |
| Ruby Cabernet | 2.57 | 0.04% | 18,000 | 0.02% |
| Egiodola | 2.85 | 0.05% | 60,780 | 0.07% |
| Nebbiolo | 4.28 | 0.07% | 24,080 | 0.03% |
| Hibridos Tintos | 4.40 | 0.07% | 10,163 | 0.01% |
| Mezcla (Tinta) | 8.10 | 0.13% | 80,765 | 0.09% |
| Tempranillo | 15.83 | 0.26% | 191,174 | 0.22% |
| Alicante Bouchet | 20.60 | 0.34% | 472,110 | 0.55% |
| Concord | 24.26 | 0.39% | 472,965 | 0.55% |
| Petit Verdot | 31.36 | 0.51% | 283,024 | 0.33% |
| Cot (Malbec) | 35.55 | 0.58% | 511,012 | 0.59% |
| Arinarnoa | 54.45 | 0.89% | 914,375 | 1.06% |
| Syrah | 55.97 | 0.91% | 606,520 | 0.70% |
| Pinot Noire | 58.44 | 0.95% | 316,437 | 0.37% |
| Frutilla | 66.02 | 1.07% | 606,450 | 0.70% |
| Otras Tintas De Vino | 70.03 | 1.14% | 580,698 | 0.67% |
| Marselan | 158.57 | 2.58% | 2,277,344 | 2.64% |
| Cabernet Franc | 239.40 | 3.90% | 2,500,526 | 2.90% |
| Cabernet Sauvignon | 397.93 | 6.48% | 3,433,035 | 3.98% |
| Merlot | 689.32 | 11.22% | 7,684,209 | 8.91% |
| Moscatel Hamburgo (Vino) | 1163.24 | 18.93% | 18,790,185 | 21.79% |
| Tannat (Harriague) | 1631.71 | 26.56% | 23,810,851 | 27.61% |
| Total Tintas Vino (Total Red Vinifera) | 4742 | 77.18% | 63,685,230 | 73.86% |
Source: Planilla De Datos Nacionales, 2019. Años, 2019: Procesamiento de las Declaraciones Juradas de Cosecha Efectiva y Composición de Viñedos, INAVI [6].
Table 6.
List of white grape varietals currently cultivated and vineyard surface in Uruguay.
| 2019 Statistics | ||||
|---|---|---|---|---|
| Varietals | Surface | Production | ||
| White Vinifera Grapes | ha (hectares) | Percent of Total National Surface | kg | Percent of Total National Production |
| Mezcla (Blanca) | 0 | 0.00% | 0 | 0.00% |
| Chasselas | 0 | 0.00% | 0 | 0.00% |
| Pedro Ximenez | 0 | 0.00% | 0 | 0.00% |
| Colombard | 0 | 0.00% | 0 | 0.00% |
| Ducomander | 0 | 0.00% | 0 | 0.00% |
| Silvaner | 0.02 | 0.00% | 0 | 0.00% |
| Riesling Renano | 0.02 | 0.00% | 663 | 0.00% |
| Riesling Italico | 0.10 | 0.00% | 406 | 0.00% |
| Jacquere | 0.11 | 0.00% | 1010 | 0.00% |
| Falso Pinot | 0.14 | 0.00% | 1535 | 0.00% |
| Gross Manseng | 0.65 | 0.01% | 6689 | 0.01% |
| Folle Blanche | 1.26 | 0.02% | 0 | 0.00% |
| Muscat Ottonel | 1.27 | 0.02% | 7250 | 0.01% |
| Chenin | 1.74 | 0.03% | 57,670 | 0.07% |
| Marsanne | 2.00 | 0.03% | 14,988 | 0.02% |
| Roussanne | 3.01 | 0.05% | 19,883 | 0.02% |
| Pinot Blanco | 3.18 | 0.05% | 16,120 | 0.02% |
| Hibridos Blancos | 4.17 | 0.07% | 6810 | 0.01% |
| Riesling | 5.02 | 0.08% | 27,570 | 0.03% |
| Torrontes | 6.37 | 0.10% | 134,386 | 0.16% |
| Muscat De Frontignan | 6.84 | 0.11% | 94,380 | 0.11% |
| Arriloba | 7.09 | 0.12% | 132,282 | 0.15% |
| Trebbiano | 10.19 | 0.17% | 118,580 | 0.14% |
| Sauvignon Gris | 10.82 | 0.18% | 164,123 | 0.19% |
| Pinot Gris | 11.05 | 0.18% | 50,397 | 0.06% |
| Gewurztraminer | 12.84 | 0.21% | 58,816 | 0.07% |
| Semillon | 13.22 | 0.22% | 106,909 | 0.12% |
| Moscatel Blanco | 18.03 | 0.29% | 347,174 | 0.40% |
| Otras Blancas De Vino | 32.78 | 0.53% | 311,985 | 0.36% |
| Viogner | 47.52 | 0.77% | 492,215 | 0.57% |
| Albariño | 57.36 | 0.93% | 381,378 | 0.44% |
| Chardonnay | 104.49 | 1.70% | 1,208,042 | 1.40% |
| Sauvignon | 129.86 | 2.11% | 1,738,928 | 2.02% |
| Ugni Blanc | 646.45 | 10.52% | 14,099,416 | 16.35% |
| Total Blancas De Vino (Total white vinifera) | 1138 | 18.51% | 19,599,605 | 22.73% |
Source: Planilla De Datos Nacionales 2019. Años, 2019: Procesamiento de las Declaraciones Juradas de Cosecha Efectiva y Composición de Viñedos, INAVI [6].
Table 7.
End process and destination of harvested grapes.
| Grapes Distributed to Buyers for Various Use or Processed for Own Production by Producers | ||
|---|---|---|
| Description | Production (kg) | Percentage |
| Sold To Wineries | 65.742.601 | 76.24% |
| Sold For Fresh Consumption | 2.630.405 | 3.05% |
| Sold To Individuals For Vinification | 89.872 | 0.10% |
| Vinified In Own Cellar | 16.701.410 | 19.37% |
| Sold To Cooperative Vineriw | 995.689 | 1.15% |
| Vinified For Own Consumption | 43.657 | 0.05% |
| Sold As Grape Juice | 25.607 | 0.03% |
| Total national production | 86.229.241 | 100% |
Source: Planilla De Datos Nacionales 2019. Años, 2019: Procesamiento de las Declaraciones Juradas de Cosecha Efectiva y Composición de Viñedos, INAVI [6].
Table 8.
Sample SWOT analysis for a wine company.
| Strengths | Weaknesses | Opportunities | Threats |
|---|---|---|---|
|
|
|
|
Source: Authors’ synthesis from literature review
Table 9.
Sample global long PESTLE analysis summary by country.
| Levels | Local | National | Global | |
|---|---|---|---|---|
| Environment | ||||
| Political | Policies of local political entities: services available; eligibility. | National government policies: subsidies; grants; R&D funding. | Global trade agreements, double taxation, free trade zone, diplomatic relationship. | |
| Economic | Local income-per-capita; state of the local economy; economic resources. | Country’s fiscal policy; interest rates; government loans. | Cross-border opportunities and economic growth, trade balance, foreign reserves | |
| Social | Size and growth of local population, literacy, life expectancy. | Demographic changes: aging, family composition, migration, ethnicity, level of diversity and minorities | Migration and immigration; study abroad, cross-cultural family union | |
| Technological | Development and installation of new technologies | Country’s level of technological advancement and service provision | Global–technological changes; communication channels. | |
| Legal | Local law enforcement, licensing, permits, ease of doing business. | The Country’s “law of the land.” In commonwealth countries, it is the British law plus national amendments | International agreements on sustainability, human rights, freedom of speech, religion, and expression | |
| Environmental | Contribution to local environmental sustainability | National sustainability issues: air, water, and land pollution, preservation, and prevention initiatives | Global sustainability issues: air, water, and land pollution, preservation, and prevention initiatives–carbon footprints | |
Source: Authors’ synthesis from literature review
Publisher’s Note: MDPI stays neutral with regard to jurisdictional claims in published maps and institutional affiliations. |
© 2021 by the authors. Licensee MDPI, Basel, Switzerland. This article is an open access article distributed under the terms and conditions of the Creative Commons Attribution (CC BY) license (https://creativecommons.org/licenses/by/4.0/).
Share and Cite
MDPI and ACS Style
Camillo, A.A.; Kim, W.G. An Assessment of the Competitive Position of the Emergent Uruguayan Wine Industry: A Preliminary Netnographic Baseline Study. Beverages 2021, 7, 26. https://0-doi-org.brum.beds.ac.uk/10.3390/beverages7020026
AMA Style
Camillo AA, Kim WG. An Assessment of the Competitive Position of the Emergent Uruguayan Wine Industry: A Preliminary Netnographic Baseline Study. Beverages. 2021; 7(2):26. https://0-doi-org.brum.beds.ac.uk/10.3390/beverages7020026
Chicago/Turabian StyleCamillo, Angelo A., and Woo Gon Kim. 2021. "An Assessment of the Competitive Position of the Emergent Uruguayan Wine Industry: A Preliminary Netnographic Baseline Study" Beverages 7, no. 2: 26. https://0-doi-org.brum.beds.ac.uk/10.3390/beverages7020026
Note that from the first issue of 2016, this journal uses article numbers instead of page numbers. See further details here.