
Self-Rated Aversion to Taste Qualities and the PROP Taster Phenotype Associate with Alcoholic Beverage Intake and Preference


1
Department of Biological Sciences, Brock University, St. Catharines, ON L2S 3A1, Canada
2
Cool Climate Oenology and Viticulture Institute, Brock University, St. Catharines, ON L2S 3A1, Canada
3
Department of Psychology, Brock University, St. Catharines, ON L2S 3A1, Canada
4
National Wine and Grape Industry Centre, Charles Sturt University, Wagga Wagga, NSW 2678, Australia
5
Sustainability Research Centre, University of the Sunshine Coast, Sippy Downs, QLD 4556, Australia
*
Author to whom correspondence should be addressed.
Beverages 2021, 7(2), 37; https://0-doi-org.brum.beds.ac.uk/10.3390/beverages7020037
Submission received: 29 April 2021
/
Revised: 18 May 2021
/
Accepted: 3 June 2021
/
Published: 9 June 2021
(This article belongs to the Special Issue Feature Papers in Sensory Analysis of Beverages Section)
Abstract
:Consumers often identify “taste” as an important factor when selecting alcoholic beverages. Although it is assumed that reduced alcohol consumption in PROP super-tasters is due to a greater dislike of the nominally aversive sensations that they experience more intensely (e.g., bitterness) when compared to PROP non-tasters, this question has not been specifically asked to them. Therefore, we examined consumers’ self-reported aversion towards specific sensory attributes (bitter, hot/burn, dry, sour, sweet, carbonation) for four alcoholic beverage types (white wine, red wine, beer, spirits) using a convenience sample of U.S. wine consumers (n = 925). Participants rated 18 statements describing different combinations of sensory attributes and alcoholic beverages on a 5-point Likert scale (e.g., Beer tastes too bitter for me). Individuals who tended to agree more strongly with the statements (i.e., they were more averse; p(F) < 0.05) tended to (i) consume less of all beverage types, (ii) consume a higher proportion of white wine (p(r) < 0.05), and (iii) were more likely to be female or PROP super-tasters. The results suggest that self-reported aversion to specific sensory attributes is associated with not only lower overall intake of alcoholic beverages, but also a shift in the relative proportions of beverage type consumed; a key finding for studies investigating how taste perception impacts alcohol consumption.
1. Introduction
Individual differences in the perception of oral taste and chemesthetic sensations exist and influence the development of food preferences, intake, and health-related outcomes (reviewed in: [1,2,3,4]). As consumers often cite flavour as one of the most important factors in food and beverage choice (e.g., [5,6,7,8]), understanding factors that impact their choice are important. According to the National Health Interview Survey, in 2018, two-thirds of U.S. adults consumed alcoholic beverages [9]. Thus, as alcoholic beverage consumption is widespread, research into the impact of taste and chemesthesis is warranted. Importantly, this research may provide insights that can be applied to reduce the harm associated with alcohol-related disease, while also providing valuable consumer information to the food and beverage industry.
Thibodeau et al. [10] found that alcohol consumption was not always linearly associated with orosensory responsiveness. Individuals with intermediate responsiveness to bitterness and astringency tended to drink more alcohol than low or high responders [10]. The authors attribute this observation to the fact that the flavour of alcoholic beverages is likely optimized by producers for the ‘average’ consumer. Importantly, alcoholic beverages are one of a growing number of products for which a wide variety of styles and flavors are available [11]. Thus, research into the impact of individual differences in taste perception and aversion in particular is needed to determine if, rather than reducing consumption of alcoholic beverages, consumers with particular taste aversions instead shift their consumption towards other alcoholic beverage types, perhaps better ‘optimized’ for their palate. Importantly, this research may explain why overall alcohol consumption is not associated with bitterness perception in some studies [12,13]. By considering both the volume and the proportion of alcoholic beverages consumed across categories (e.g., beer vs. wine), types (e.g., red wine vs. white wine), and styles (e.g., dry white wine vs. sweet white wine), a more nuanced picture of alcohol consumption can be obtained.
The dominant sensations elicited by ethanol, the primary product of fermentation, are nominally aversive (bitterness, burning/tingling, astringency [14,15,16]). Thus, it has been hypothesized that individuals who are more responsive to these sensations consume less alcohol as it is less likely to be pleasant. This hypothesis is consistent with the work of Nolden and Hayes [15] who found that increased responsiveness to bitterness and burning/tingling of ethanol was associated with a decrease in the frequency of beer, wine, and unmixed spirits consumption. In contrast, Higgins and Hayes [17] reported that the intensity of tetralone (a hop extract that is bitter) and pale ale consumption were positively correlated for pale ale consumers, suggesting that for a subset of consumers the bitterness elicited by hops may be desirable. Furthermore, ethanol also elicits sweetness [14,15,16], a sensation that is typically characterized as appetitive [18]. Lanier et al. [19] demonstrated that increased sweetness of sampled scotch was associated with an increase in overall alcohol consumption, whereas the opposite was true for the bitterness. In the same study, Lanier et al. [19] found increased sweetness and decreased bitterness were associated with a higher liking of sampled beer but did not directly mediate overall alcohol consumption. Together, these studies demonstrate that characterizing the aversive/appetitive nature of the taste and chemesthetic sensations elicited by alcoholic beverages is complex.
Increased orosensory responsiveness is not always associated with lower alcohol consumption and the nature of the relationship may depend on whether the orosensation in question is considered aversive or appetitive in a given context or for a given consumer. Thus, in the current study, participants were asked to self-report on a 5-point Likert scale their aversion towards the sensory attributes of a range of alcoholic beverages described in 18 statements (e.g., Beer tastes too bitter for me). Although this approach is different from measuring orosensory/hedonic responses directly in sampled products, it may provide new insights into how consumers experience alcoholic beverages. It builds on the hypothesis that differences in orosensory responsiveness towards a product lead to differences in liking, which ultimately impact the products’ consumption [2,3]. By determining whether the intensity of specific orosensations is experienced as aversive (i.e., too intense) or appetitive (i.e., not too intense) we hope to better understand the link between responsiveness and liking. If this approach yields useful information, it also lends itself to large field-based trials and samples without the need for a physical sensory lab. The latter consideration has become increasingly salient in several countries recently, with COVID-related policies and protocols restricting access and use of many ‘brick-and-mortar’ sensory laboratories.
The development of food likes and dislikes is influenced by learning (reviewed in: [20]). When a new food or beverage is consumed, our innate dislike (or aversion towards) some of the sensations elicited (e.g., bitterness, burning) may reinforce our overall dislike for the product [20]. Conversely, our innate liking of the appetitive sensations (e.g., sweetness) may reinforce our liking [20]. Nevertheless, extrinsic factors (e.g., brand name, food packaging/labelling, cost, emotional context, perceived satiety) also impact liking (see [21] for a review). As consumers in our study also self-reported their liking of several alcoholic beverages, we tested the association between self-reported aversion towards and liking of alcoholic beverages. Although preliminary, the results inform if and to what degree self-reported aversion impacts both liking and consumption patterns.
1.1. PROP Taster Status
Measures of overall differences in orosensory responsiveness, such as taste phenotypes [22,23,24], can be used as general proxies for responsiveness (e.g., [25,26,27]). The most well-established taste phenotype from literature is PROP taster status (PTS). PTS measures an individual’s responsiveness to the bitter compound, 6-n-propylthiouracil (PROP). As such, individuals are typically classified into three phenotypic groups: PROP non-tasters (pNT) for whom PROP elicits little or no sensation, PROP medium-tasters (pMT) for whom PROP elicits a mildly bitter sensation, and PROP super-tasters (pST) for whom PROP elicits a highly bitter sensation [28,29]. PROP bitterness is positively correlated with suprathreshold sweetness, bitterness [13,22,23,28,30], saltiness, sourness, [13,22,23,30], astringency, and metallic intensity [23,30] in aqueous solutions. As PTS can be accessed rapidly and easily [31], it is a useful proxy for orosensory responsiveness in epidemiological studies investigating the impact of taste perception on food and beverage consumption (e.g., [12,13,32,33]) and is advantageous when conducting sensory research under COVID-related restrictions as outlined above.
PTS is also associated with differences in the perception of ethanol and alcoholic beverages. PROP tasters (pST and pMT) rated the bitterness of ethanol (10–50%, [34]) and irritation (30–50%; [34,35]) as higher than PROP non-tasters. Using phenylthiocarbamide (PTC), a compound that activates the same bitter taste receptor as PROP, no differences in intensity were found between PTC tasters and non-tasters for lower concentrations of ethanol (4.25–17% [36]). In addition, tetralone (7–35 ppm) intensity did not differ on the basis of PTS groups [36]. When real alcoholic beverages are sampled (beer and wine), pST also rate the intensity of the orosensations elicited (bitterness, astringency, sourness, heat/irritation) higher than pNT in most [37,38,39] but not all studies [40]. On balance, the literature supports the hypothesis that pST rate the intensity of the taste/chemesthetic sensations elicited by alcoholic beverages higher than pNT.
Differences in alcohol consumption have been reported on the basis of PTS. pNT consumed more beer during their first year of drinking than pST [37], but current overall drinking patterns did not differ in some studies [13,37,41,42]. In contrast, PROP responsiveness was associated with overall alcohol consumption [19,43], although it did not directly mediate consumption. Increased PROP responsiveness was also associated with the consumption of fewer “shots of liquor” and “glasses of cocktails” but did not impact consumption of “cans of beer” or “glasses of wine” in a sample of Italian cocktail consumers [25]. When a larger sample of Italians was surveyed as part of the Italian Taste Project, PROP responsiveness was negatively correlated to beer, wine, and spirits/liquor consumption, but not aperitifs/cocktails [44]. In addition, in a prior study using the same dataset as the current study, increased PROP responsiveness was associated with lower alcohol consumption [45]. Thus, determining whether PTS associates with self-rated aversion toward specific taste qualities, as measured by the alcohol taste statements, may provide further insights into the drivers of alcohol consumption.
Ullrich et al. [46] reported that food adventurous pMT/pST liked more foods than their non-adventurous counterparts, whereas adventurousness had a minimum effect in pNT. Although preference/liking of alcoholic beverages has been associated with both food [46,47] and alcoholic beverage [45] neophobia, PTS did not mediate this relationship in the study on wine liking using the same study participants [45]. In contrast, Ullrich et al. [46] reported that PROP tasters who were more food adventurous liked strong alcohol more than tasters who were less food adventurous, providing some preliminary evidence that food/alcoholic beverage adventurousness may mediate the association between PROP responsiveness and alcohol liking. Thus, investigating the impact of alcohol adventurousness on alcoholic beverage aversion is also warranted.
1.2. Study Aims
Consumers often cite taste as a key driver when selecting alcoholic beverages for consumption. However, as consumers likely use the term taste as a general term describing any sensation elicited during food consumption [48,49], it is often not clear what aspects of “taste” they are describing. Measuring orosensory and hedonic responsiveness directly can be cost and time prohibitive when larger sample sizes are desired. Thus, exploring novel ways to capture consumers’ responses to alcoholic beverages through survey-based approaches can enable expanded research in the field and provide an alternative tool when COVID-related restrictions limit traditional lab-based sensory data collection. To this end, we sought to determine whether aversion towards the taste and/or chemesthetic sensations is driving differences in alcohol preferences and consumption. Importantly, by comparing self-reported aversion toward the orosensations elicited by alcoholic beverages to general measures of taste responsiveness (PROP, sex) and personality measures (alcohol adventurousness), further insights into both alcohol behavior and consumers’ awareness of and ability to self-report its drivers are forthcoming. More generally, the study provides insights into the relationships between orosensory responsiveness, aversion, liking, and consumption of alcoholic beverages.
The following aims informed the analyses conducted in the study:
- To determine how participants describe their aversion towards the taste and chemesthetic sensations elicited by alcoholic beverages.
- To determine whether these descriptions provide ecologically relevant insights into alcohol consumption patterns.
- To determine whether self-reported liking of alcoholic beverages is correlated to consumers’ description of alcohol taste aversion.
- To determine whether PTS, sex, or alcohol adventurousness are associated with alcohol taste aversion.
2. Materials and Methods
2.1. Participants
Printed surveys were mailed to 5000 randomly selected consumers from the mailing list of a large wine retailing group in the northeastern United States. Three weeks after the survey was mailed, a reminder was sent to encourage participants to complete and return their responses. A prize draw was also included to incentivized participation with cash prizes valued at USD 500 (1st prize), USD 250 (2nd prize), USD 125 (3rd prize), USD 50 (4th prize), and 10 USD 20 prizes. Using prepaid business envelopes, 1014 participants returned their responses within 6 weeks, representing a response rate of 20%. All participants consented to the study by returning their survey responses by mail and only those wishing to be entered in the prize draw provided contact details (name and phone number). The study was approved by the Institutional Review Board of the University at Buffalo (#121710 [4]) and was consistent with the Declaration of Helsinki.
The data of 87 participants was excluded as they failed to fully complete the alcohol taste statements, the primary focus of this study. As a result, the final sample consisted of 925 consumers, of which 364 were male and 552 were female. Participant age was captured using the following categories: under 21 (n = 2), 21–25 (n = 8), 26–30 (n = 32), 31–35 (n = 45), 36–40 (n = 36), 41–45 (n = 78), 46–50 (n = 110), 51–55 (n = 138), 56–60 (n = 148), 61–65 (n = 111), and over 65 (n = 214). Participants self-reported their ethnicity as Caucasian (n = 893), African American (n = 11), Asian or Pacific Islander (n = 3), Hispanic Latino (n = 3), American Indian (n = 3), and other (n = 4). Some participants did not disclose sex (n = 9), age (n = 3), or ethnicity (n = 8).
The following procedure was used to check for potential outliers. Potential outliers were identified as values three times the interquartile range above the third quartile or below the first quartile [23,50]. As outliers can be very common in large datasets [50], scattergrams were generated to determine if the potential outliers should be removed. A visual examination of the distribution was used to decide if potential outliers are likely true outliers and thus should be removed. Any further exclusions based on missing data and/or outliers are described below, and sample sizes are included for all analyses.
2.2. Questionnaire and Data Treameant
As part of a larger study, participants were asked to complete several measures. Those included in the current study are described below.
Participants provided opinions on a range of taste and chemesthetic sensations commonly elicited by alcoholic beverages (alcohol taste statements; Table 1) using a 5-point Likert scale ranging from strongly disagree (1) to strongly agree (5). On the basis of the results of the principal components analysis (see Section 3.1 for details), alcohol taste statements with similar response patterns were grouped into indices (Table 1). For each index, scores were obtained by taking the mean of all alcohol taste statements within the group (e.g., for “overall alcohol” index the mean was taken of A1 and A2). No outliers were detected for the alcohol taste statements, resulting in a sample size of 925 for these analyses.
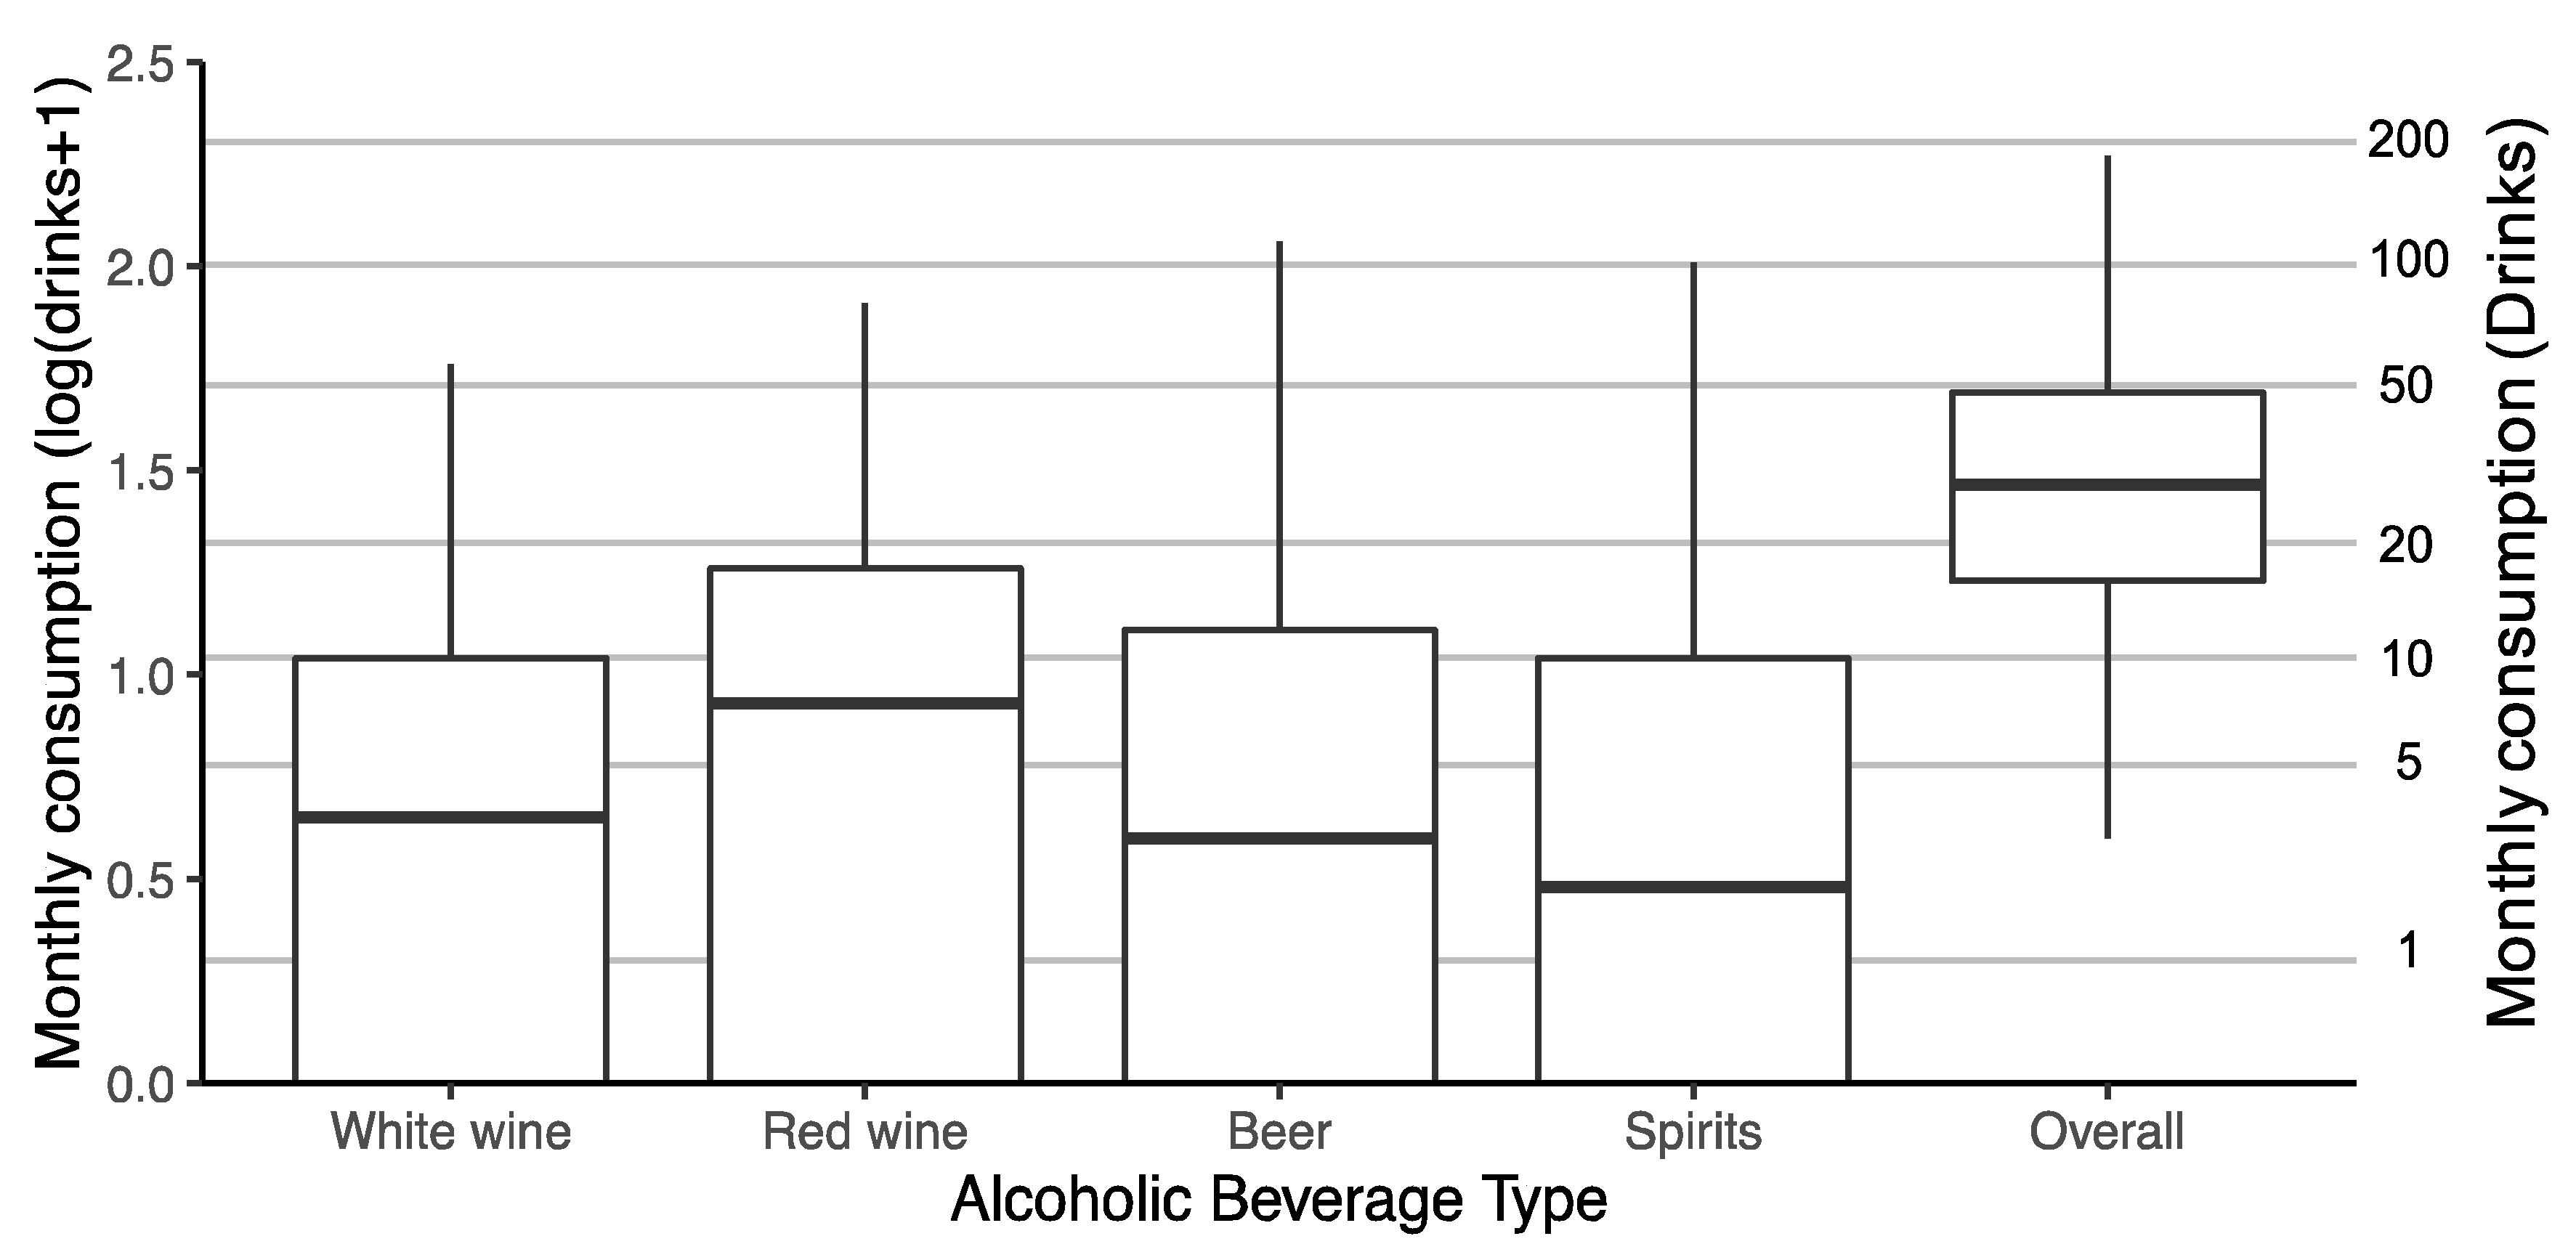
Alcohol consumption was captured for five alcoholic beverage categories (white wine, red wine, beer, spirits, other) by asking two questions; “On average, how many times a month do you drink the following beverages?” and “On days when you drink alcoholic beverages, how many do you consume (i.e., average number of drinks per day)?” Response categories for the frequency of consumption were 1, 2, 3, 4, 5, 6, 7, 8, 9, 10, 11, 12, 13, 14, 15–19, 20–24, 25–29, and ≥30. When reporting the number of drinks per day, participants were told that a standard drink was 12 oz. (bottle) of beer, 6 oz. (glass) of wine, or 1.5 oz. of spirits and were free to write in any numerical value. Total monthly consumption for each alcoholic beverage category was obtained by multiplying their responses to each question, an approach successfully used in previous studies [10,45]. Overall total monthly consumption for all alcoholic beverages was obtained by summing the values for each beverage category. Raw monthly alcohol consumption scores were not normally distributed. Data were transformed (log(value + 1)) to meet the assumptions of normality (Figure A1).
Thirty-three participants did not fully complete the alcohol consumption questions, so their data were excluded. Before log transformation, potential outliers were detected for white wine consumption (>40; n = 17), red wine (>68; n = 10), beer (>48; n = 46), spirits (>40; n = 31), and overall alcohol (>144; n = 18). Scattergrams were plotted to visualize the outliers, leading to the removal of data for consumers with high consumption of white wine (n = 1; 95 drinks), red wine (n = 2, 96–450 drinks), beer (n = 2, 152–336 drinks), and spirits (n = 1, 180 drinks). Two additional participants were excluded as their stated total alcohol consumption was very high (226–256 drinks). Data were removed when the outlier did not appear to belong to the distribution. Importantly, after log transformation, all retained alcohol consumption values fell within the acceptable range (3X IQR above the 3rd quartile). Thus, after outlier analysis and checking for missing data, 41 participants were excluded, resulting in a final sample size of 884. The mean number of drinks consumed per month was 7.2 +/− 10.4 (SD) for white wine, 11.6 +/− 13.8 (SD) for red wine, 10.0 +/− 17.6 (SD) for beer, 7.4 +/− 13.4 (SD) for spirits, and 36.2 +/− 30.7 (SD) overall (Figure A1).
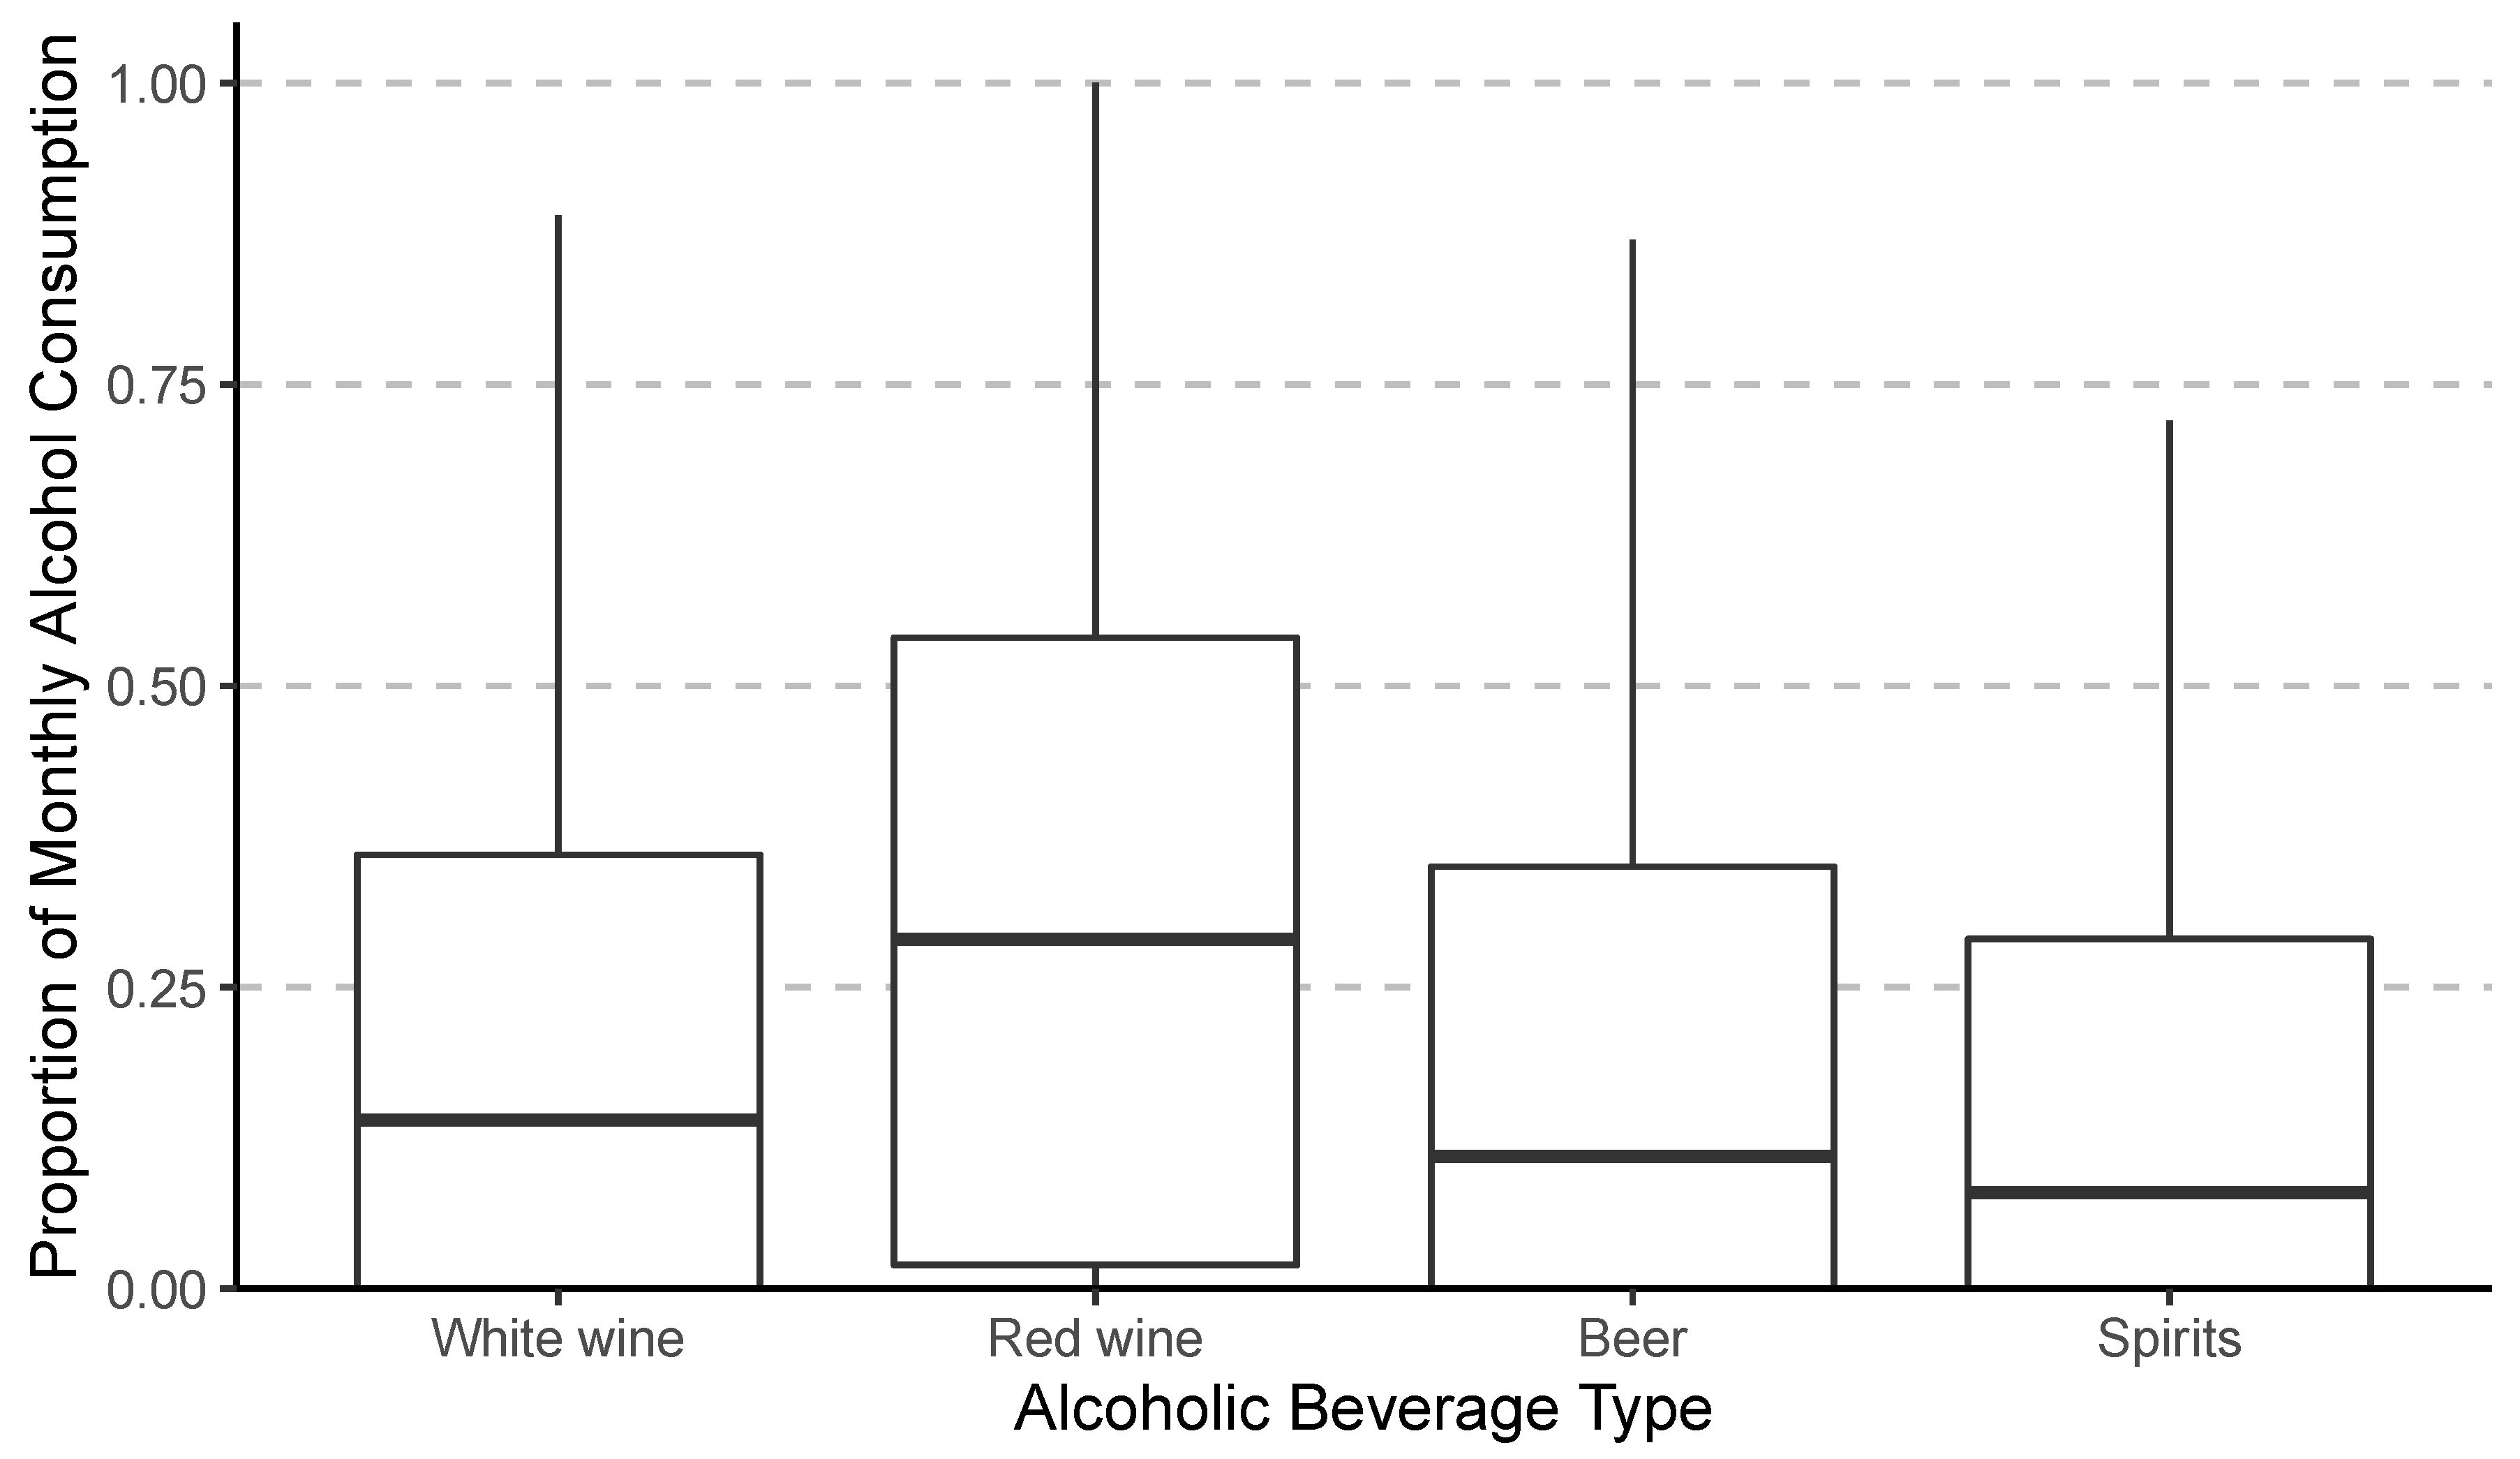
Next, the proportion of alcohol consumed by beverage type (red wine, white wine, beer, and spirits) was calculated. For each participant, monthly alcohol consumption for each beverage type was divided by their overall alcohol consumption (Figure A2). As a result, scores for each beverage type ranged from 0 to 1, with the sum of all beverage types equal to 1. In total, 72 participants were excluded as they did not currently consume any alcohol (n = 31) or they were previously excluded from the monthly alcohol consumption analyses (n = 41). As no outliers were identified, the final sample size was 853. The mean proportion of drinks consumed per month was 0.25 +/− 0.30 (SD) for white wine, 0.35 +/− 0.32 (SD) for red wine, 0.22 +/− 0.27 (SD) for beer, and 0.19 +/− 0.25 (SD) for spirits.
Alcoholic beverage adventurousness was measured by asking participants “How often do you try new alcoholic beverages?” Participants responded by selecting “never” (n = 150, 16%), “rarely” (n = 497, 54%), “some of the time” (n = 263, 28%), or “most of the time” (n = 12, 1%). Overall, 3 participants did not provide a response, resulting in alcohol adventurousness being captured for 922 participants. A ‘high’ adventurousness group was created by combining participants who responded “some of the time” or “most of the time” [45,51], and ‘low’ and ‘none’ groups by using the responses for “rarely” and “never”, respectively.
Participants completed the Alcohol Use Disorders Identification Test (AUDIT; [52]) and the overall risk level was calculated based on the instructions from Barbor et al. [52]. A preliminary review of AUDIT responses showed that most participants in the study fell in the lowest risk category (data not shown) and that most of the variance in scores could be attributed to the questions “How often do you have a drink containing alcohol?” and “How many drinks containing alcohol do you have on a typical day when you are drinking?”. Therefore, only the responses to these questions were retained for further analysis. Participants reported their frequency of alcohol consumption using five options (never, n = 13; monthly or less, n = 119; 2 to 4 times per month, n = 251; 2 to 3 times per week, n = 269; 4 or more times per week, n = 236). Data for the “never” and “monthly or less” responses were combined to better balance sub-sample sizes. The number of drinks per day was collected using five response choices (1 or 2; 3 or 4; 5 or 6; 7 to 9; 10 or more). However, due to small sample sizes for some of these response categories, participants were divided into two groups for the analysis (1 or 2, n = 649; 3 or more, n = 239). In total, 37 participants did not complete the AUDIT resulting in a sample size of 888 for these questions.
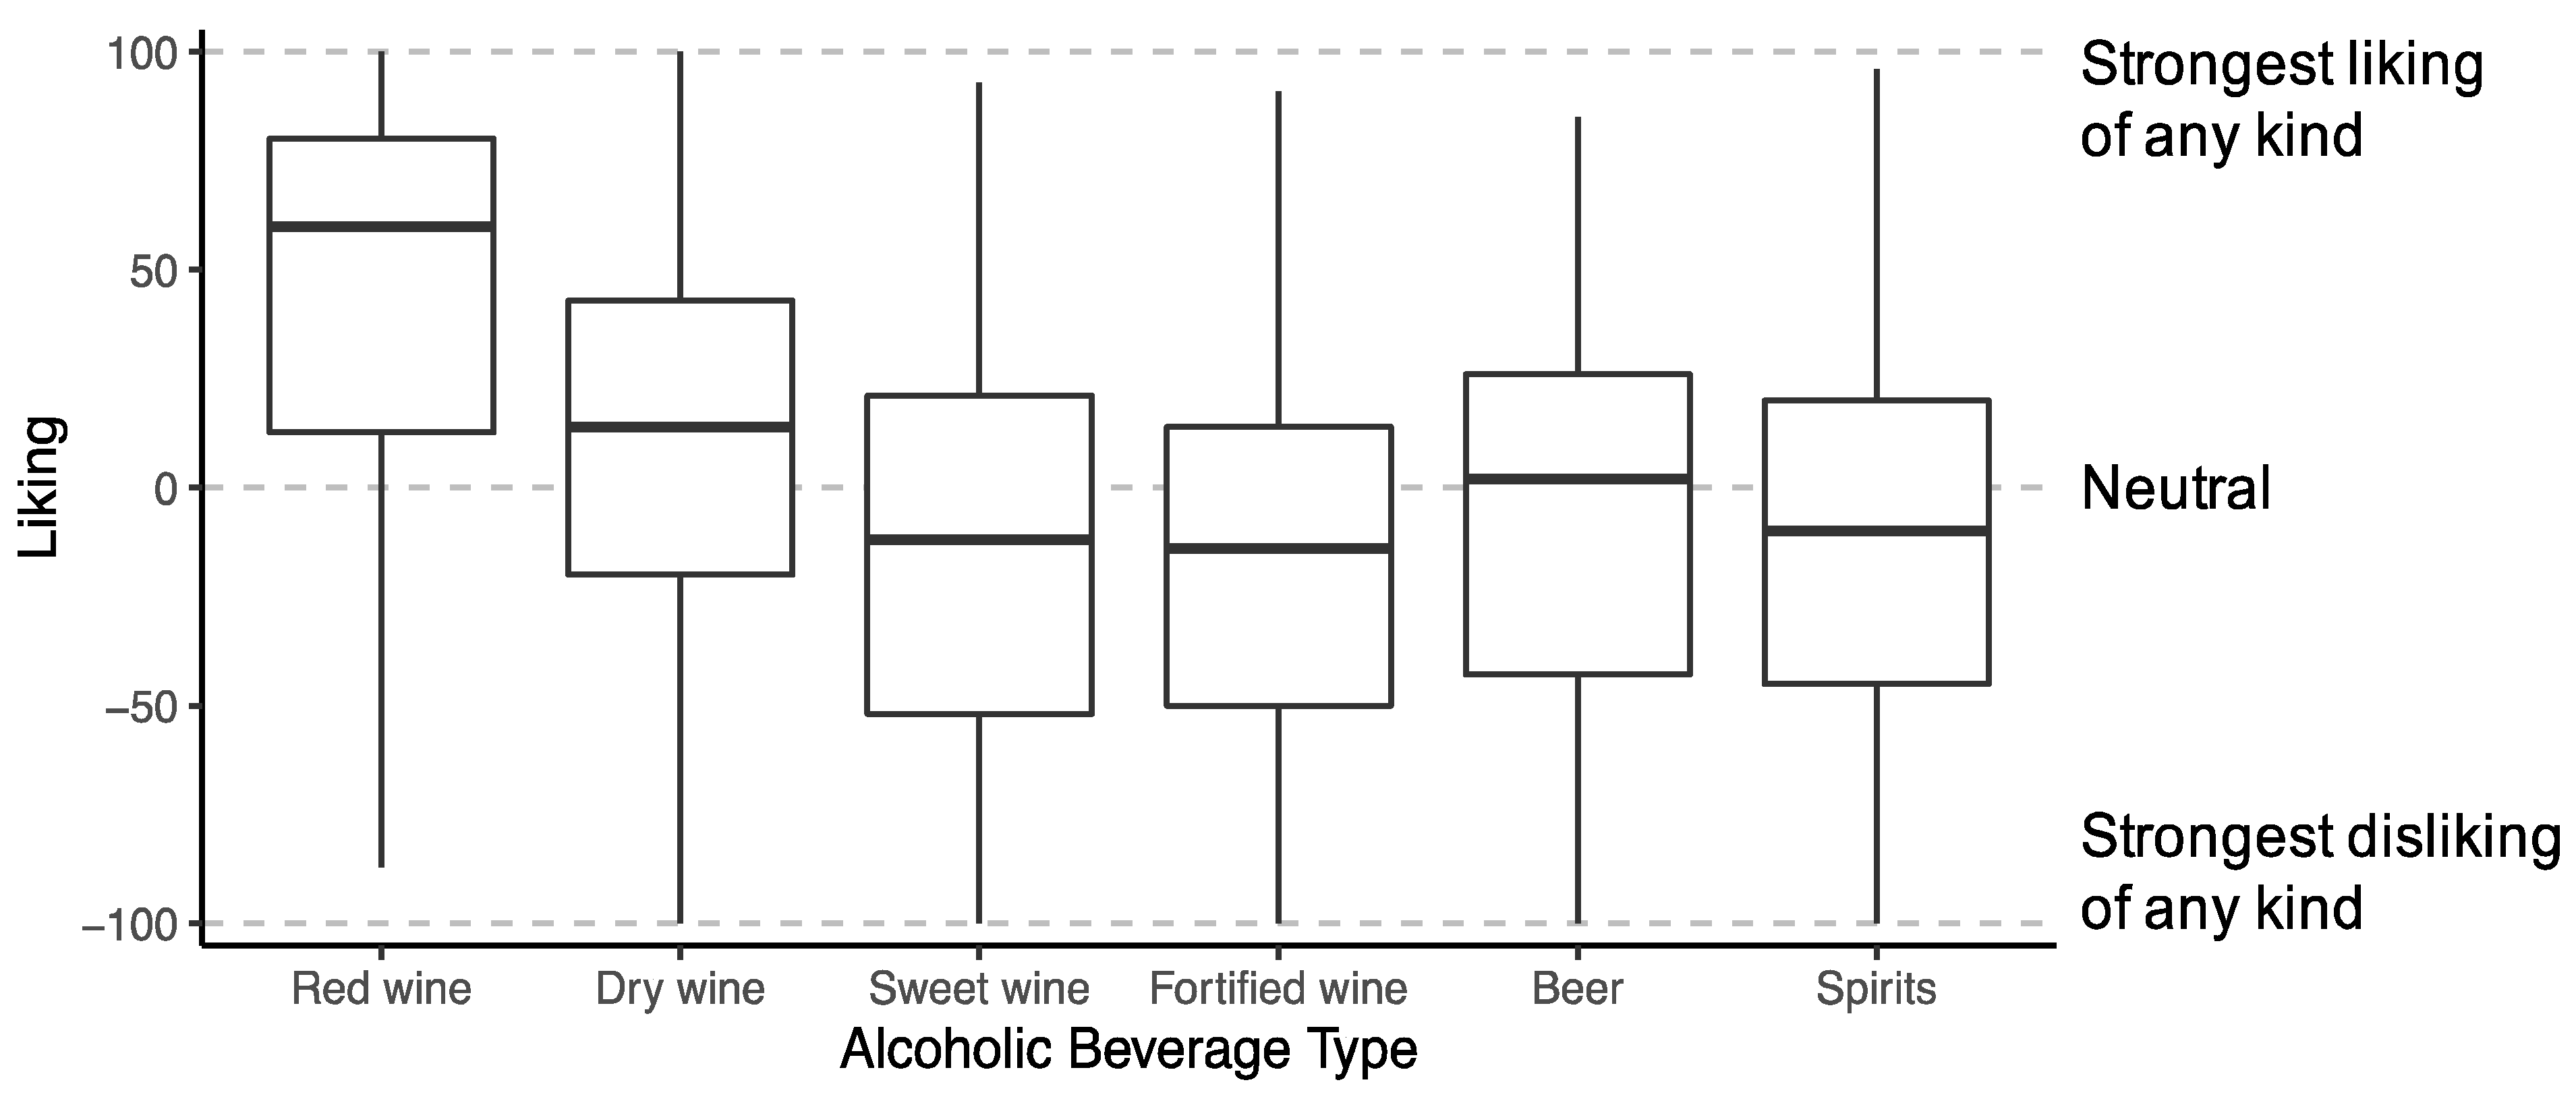
Self-reported alcoholic beverage liking was captured using a generalized degree of liking scale (gDOL; [51,53,54]). Participants self-reported their liking of 38 alcoholic beverages from −100 (strongest dislike of any kind) to +100 (strongest liking of any kind) where 0 was neutral. Alcoholic beverages were interspersed within a large set of items (n = 116) including other foods (e.g., pizza, fresh strawberries), non-alcoholic beverages (e.g., skim milk, unsweetened grapefruit juice), and activities (e.g., driving fast on a twisty road, warm fire on a cold day). Participants who indicated that they had never tried a beverage/food/activity did not provided liking ratings for that item. Most participants had not tried all the alcoholic beverages (n = 657) with a mean number of “never tried” alcoholic beverages of 6.9 +/− 8.2 (SD). Although this ensured that participants did not rate alcoholic beverages they had not tried, it left several empty cells. As such, indices of liking for alcoholic beverages were generated for different alcoholic beverage types (see Appendix B, Table A1). A general index of beer liking was created by averaging liking scores of 13 beer types. Similarly, an index of spirits liking was created by averaging liking scores for eight spirit types. Wine-related products were divided into four indices based on the clusters identified by Pickering et al. [45] in the same dataset. The wine-related indices were red wine, dry wine, sweet wine, and fortified wine. Participants were included in an index if they rated their liking of at least one item within the index. Liking ratings of ready-to-drink mixed alcohol, flavored vodka, and liqueurs were excluded from the indices as they vary widely in ingredients, production practices, and orosensory characteristics, limiting our ability to clearly define the style. Sample sizes ranged from 883 to 910. No further exclusions were needed as no outliers were detected. For all liking indices with two or more items, Cronbach’s alpha (α > 0.70) indicated acceptable levels of internal reliability [55]. However, some items in the beer and sweet wine indices may be redundant as Cronbach’s alpha was above 0.90 [55]. Similar conclusions regarding internal reliability can be drawn from the mean interitem correlations, which were also within or slightly above an acceptable range (MIC; 0.15–0.50) [56]. Readers are referred to Appendix B where the summary and internal reliability statistics are provided in Table A1 and boxplots for each index are shown in Figure A3.
All data analyses were performed using XLSTAT Version 2020.5.1 (Addinsoft, New York, NY, USA) and Microsoft® Excel® for Mac Version 16.48 (Microsoft®, Mississauga, ON, Canada). All MANOVA and ANOVAs were replicated in IBM SPSS Statistics for Windows, Version 26.0.0.0 (IMP Corp. Armonk, NY, USA) in order to generate effect sizes and to calculate power, as these are not available through XLSTAT. Significance for all analyses was set at p = 0.05. Unless otherwise noted, all data were normally distributed (a skew of less than 2 and a kurtosis of less than 7 [57]). Figure 1, Figure A1, Figure A2, and Figure A3 were generated using in RStudio Version 1.1.463 (RStudio, Inc., Boston, MA, USA) using ggplot2 (Version 3.2.1; [58]). Effect sizes for Pearson’s correlations were considered small, medium, or large, when absolute r values were greater than 0.1, 0.2, or 0.3, respectively [59]. Specific details of the data analyses are included in the results for brevity.
2.3. PROP Phenotyping
Paper filter disks impregnated with 50 mmol/L of 6-n-propylthiouracil (MP Biomedicals, Solon, OH, USA) were prepared as described by Zhao et al. [31]. Based on previously successful mail studies [45,51], a single disk was included with each survey package to measure PROP responsiveness. Instructions for self-administration and rating of the disk were included at the end of the survey. Briefly, participants were asked to thoroughly rinse their mouth with water before placing the disk on the tip of their tongue for 30 s or until fully wetted. Next, participants rated the intensity of the sensation elicited using a generalized labelled magnitude scale (gLMS; [60]). Thirty-seven participants did not complete the PROP responsiveness task and were excluded. Participants were divided into PROP phenotypes using criteria previously established for other studies based on the same dataset [45,51]; 256 non-tasters (NT), <9 mm; 467 medium-tasters (MT), 9–50 mm; 165 super-tasters (ST). Mean PROP responsiveness was 27.4 +/− 26.2 (SD). PROP responsiveness was not normally distributed, so log(score + 1) was performed to improve normality (data not shown). No outliers were detected.
3. Results and Data Analysis
3.1. Alcohol Taste Statements and Alcohol Consumption
To determine whether any patterns exist in responses to the alcohol taste statements and to reduce the dimensionality of the data, principal component analysis (Pearson’s correlation) with varimax rotation was performed (n = 925). The Kaiser-Meyer-Olkin measure was 0.802, which indicates that the sample size was adequate [61,62]. Bartlett’s test for sphericity showed that the statements were sufficiently intercorrelated to continue (χ2 (153) = 7560, p < 0.001). Six factors had eigenvalues above 1.0 and were retained for varimax rotation (Table 1). The cumulative variability explained by the six factors was 72%.
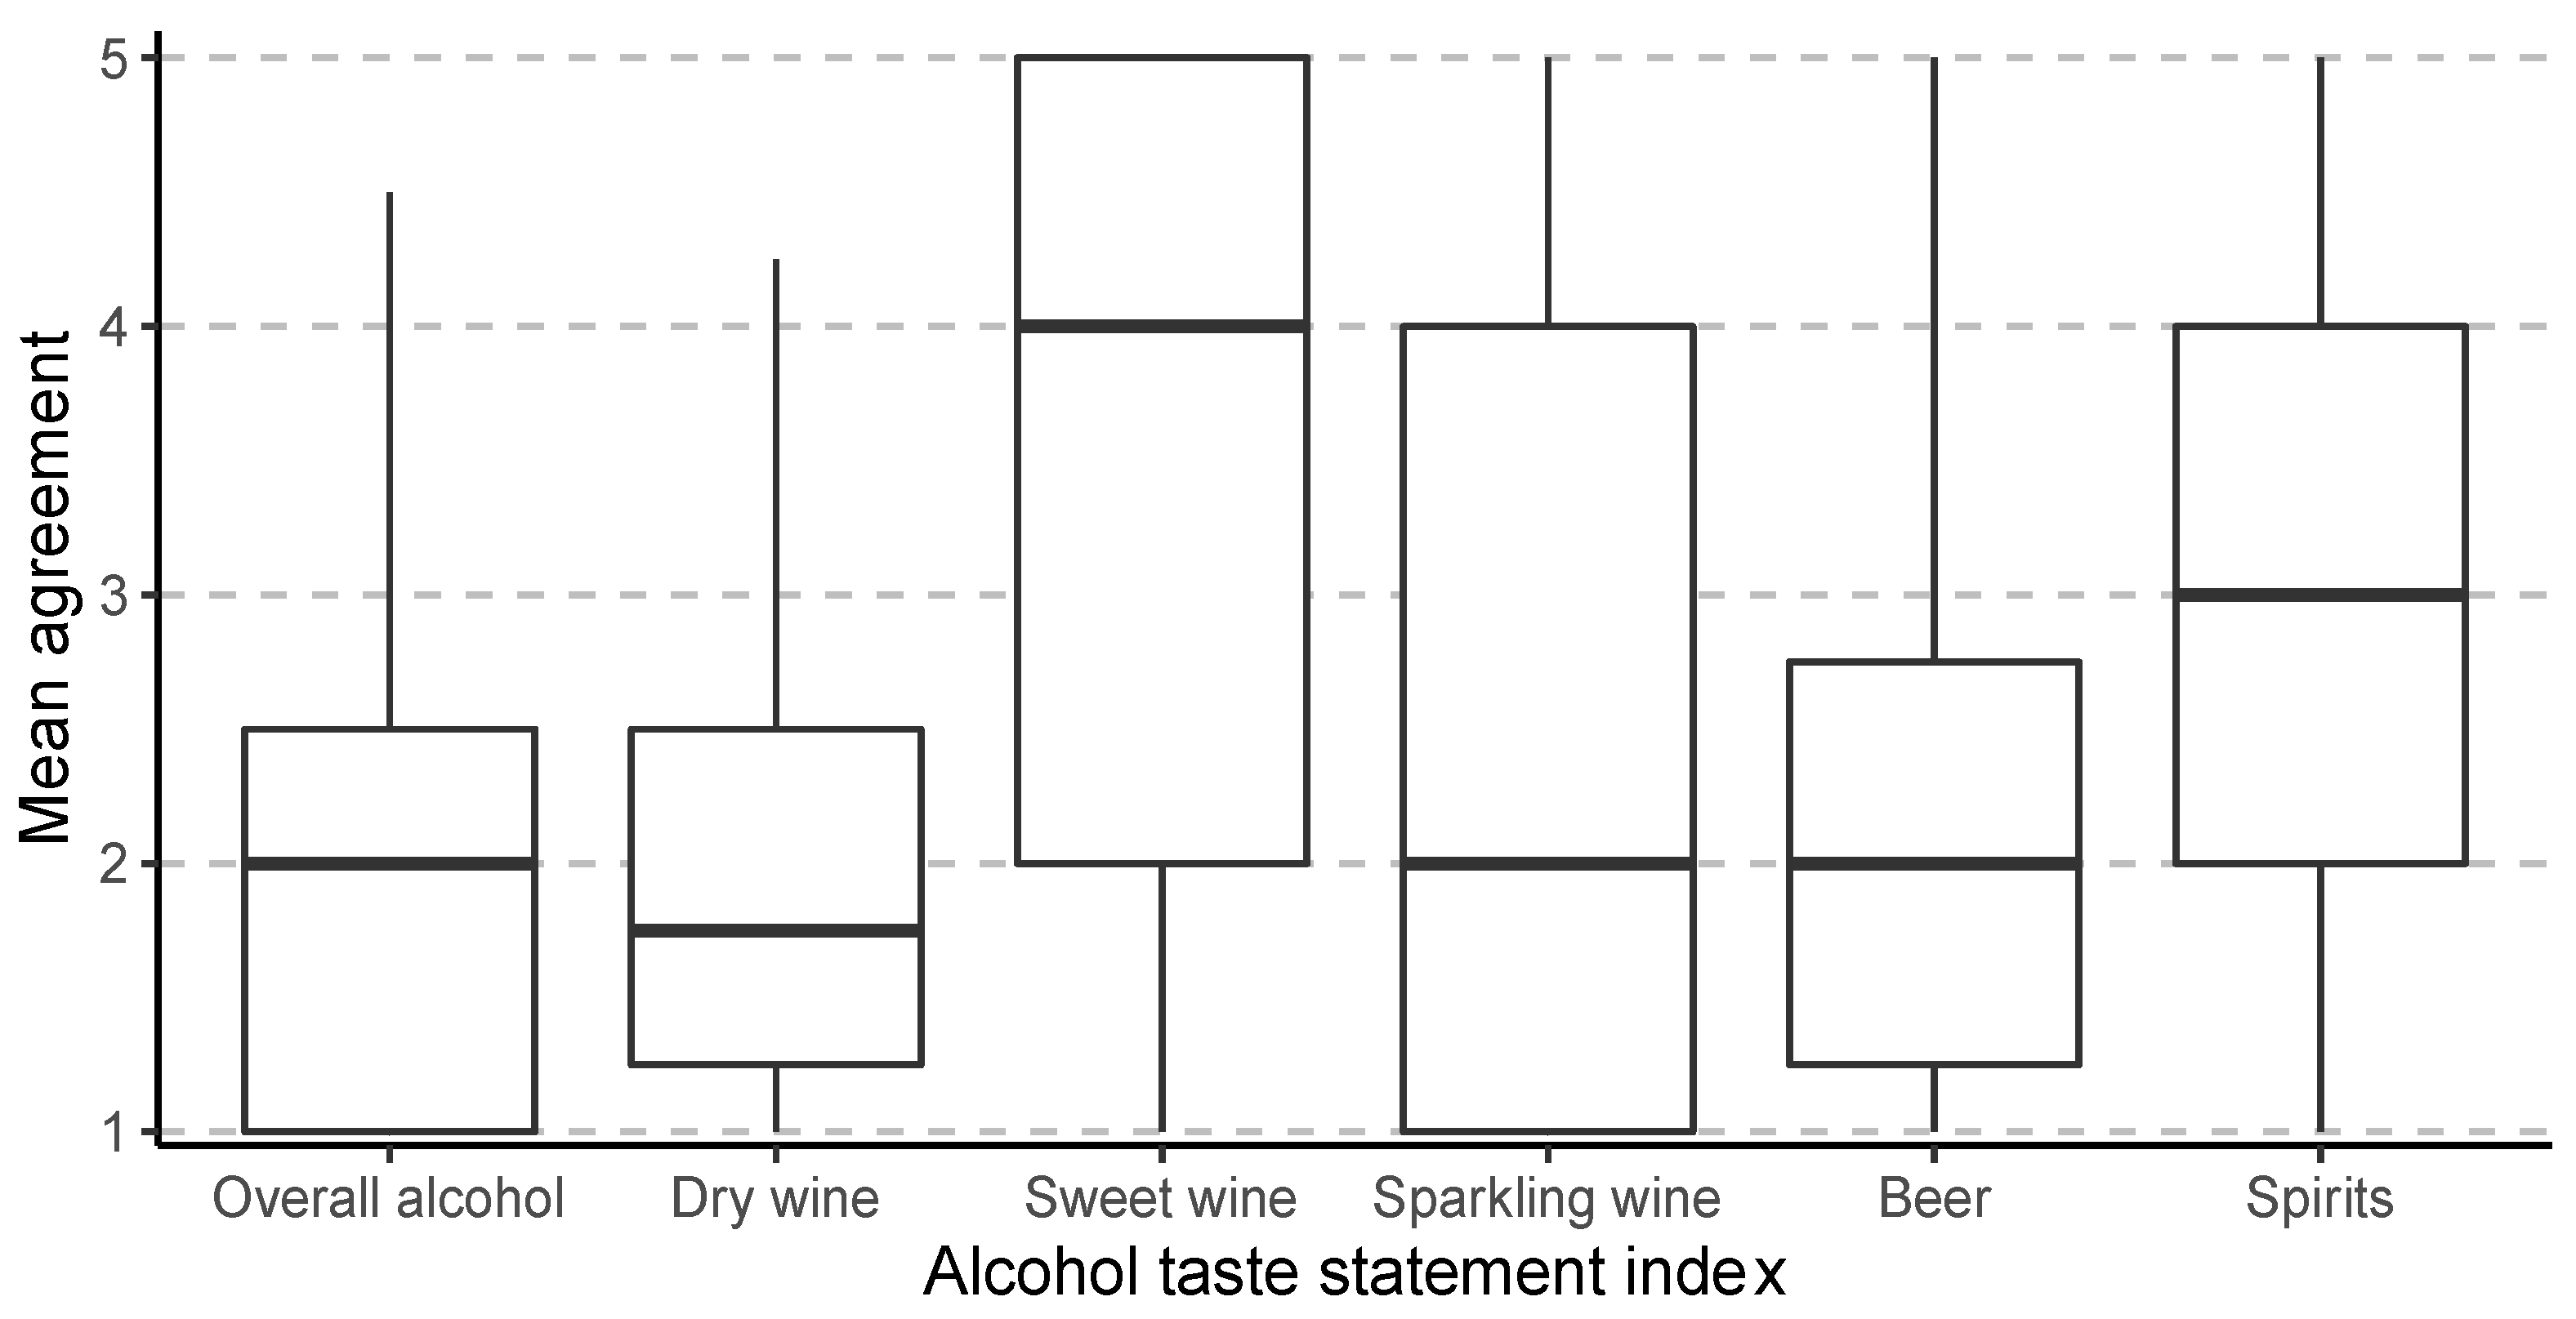
Based on the factor for which each statement was most strongly loaded, the statements were divided into six initial groups, each corresponding to a different factor. Two changes to the groupings were made based on face validity, resulting in the identification of seven indices. Statement A7 (hot/burn of wine), was moved from Factor 5 (overall alcohol) to Factor 1 (dry wine) as factor loadings were similar for both. A new index (sweet wine) was created for A9 (sweetness of sweet wine) as it was strongly negatively loaded on Factor 1 (dry wine), whereas all the other statements were positively loaded (A7, A4, A5, A8). Indices were largely based on the type of alcoholic beverage referenced in the statement. The only group formed based on the attribute described was for complexity (Factor 2). As complexity is difficult to define [63] and a definition was not provided to participants, it was excluded from the remaining part of the study. Internal reliability of the indices, as measured by Cronbach’s alpha (α > 0.70) and MIC (0.15–0.50) was acceptable, although MIC values above 0.5 for overall alcohol and spirits suggest that some items may be redundant [55,56]. Mean agreement with the alcohol taste indices was 1.9 +/− 0.9 (SD) for overall alcohol, 2.0 +/− 0.9 (SD) for dry wine, 3.6 +/− 1.4 (SD) for sweet wine, 2.5 +/− 1.5 (SD) for sparkling wine, 2.1 +/− 1.0 (SD) for beer, and 3.00 +/− 1.3 (SD) spirits. The distribution of scores is shown in Figure 1.
In part to determine whether the alcohol taste indices (Table 1) were an ecologically useful measure, we assessed their correlation (Pearson’s) to overall monthly alcohol consumption or to monthly consumption of white wine, red wine, beer, or spirits (n = 884; Table 2). Using the same approach, correlations between individual alcohol taste statements and alcohol consumption were performed (data not shown). The results confirmed that the trends reported here for the indices were consistent with those for all the individual taste statements included in each index. Higher numerical values for the alcohol taste indices indicate an increase in agreement; thus, negative correlations indicate that participants who describe alcoholic beverages as more aversive tend to consume less. In general, as participants agreed more strongly with the alcohol taste indices, they tended to consume less of all alcoholic beverage types. One exception was found, such that consumers that tended to agree with the statement “sweet white wine tastes too sweet for me” (A9, or sweet wine index) tended to also consume more red wine. This finding suggests that consumers who find the sweetness of sweet white wine aversive may shift their consumption to red wine that is typically dry. Although correlations between consumption and alcohol taste indices were found for many combinations, effect sizes were largest when the type of alcoholic beverage described and consumed were the same.
Next, we tested for correlations (Pearson’s) between alcohol taste indices and the proportion of each alcoholic beverage type consumed by participants (n = 853, Table 2). Using the same approach, correlations between individual alcohol taste statements and alcohol consumption were performed (data not shown). Alcohol taste indices increased as participants agreed more strongly with the statement; thus, positive correlations indicate that as the proportion of an alcoholic beverage consumed increases, participants also describe the alcohol taste index as more aversive. Results for the individual alcohol taste statements were largely consistent with those for the index to which they belonged. Participants that described most alcoholic beverages as aversive tended to also consume a higher proportion of white wine. Participants that consumed a higher proportion of red wine tended to describe dry wine as less aversive and sweet wine as more aversive. Similarly, participants that consumed a higher proportion of beer or spirits also described the sensations they elicit as less aversive. However, although the dry wine index was positively correlated with the proportion of white wine consumed, A7 (r = 0.003, p = 0.939) and A8 (r = −0.075, p = 0.028) were uncorrelated and negative correlated with the proportion of white wine consumed, respectively. Similarly, although the dry wine index was negatively correlated with the proportion of red wine consumed, A8 (r = −0.004, p = 0.915) was not correlated with the proportion of red wine consumed. The fact that A7 and A8 describe wine in general, whereas A4 and A5, the other two members of the index, describe red wine, may partially explain these inconsistencies.
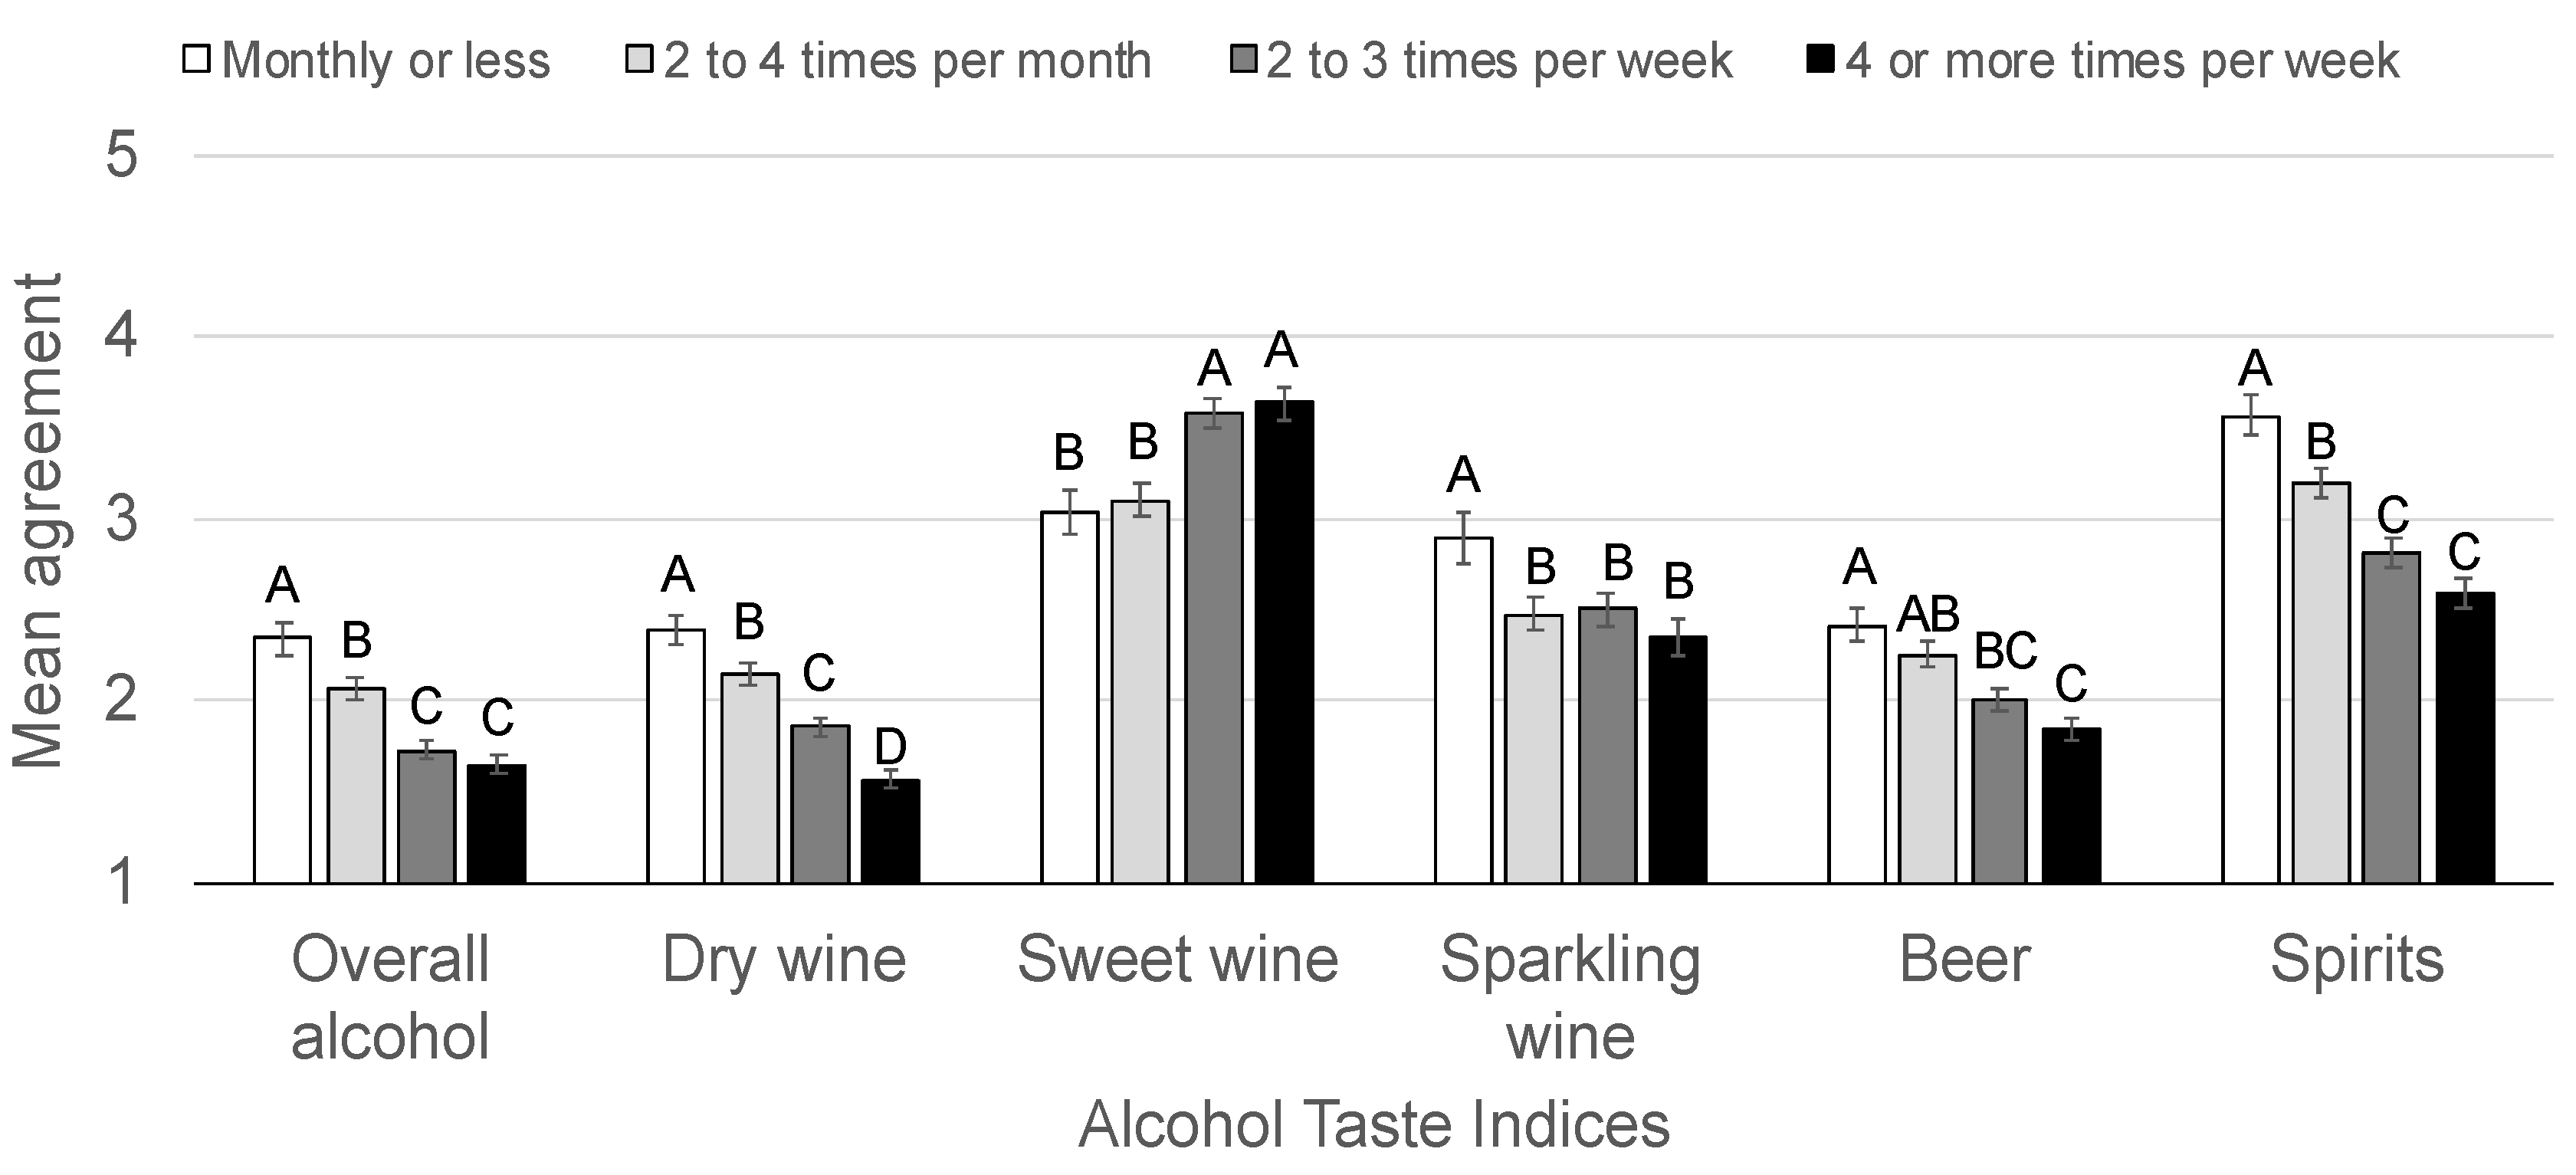
To investigate the association between the alcohol taste indices and the frequency of alcohol consumption, a MANOVA was performed where the six indices were included as dependent variables and categorical alcohol consumption frequency from the AUDIT was used as the explanatory variable. In total, 37 participants did not complete the AUDIT, so the final sample size was 888. The MANOVA was significant (F (18, 2643) = 9.3, p < 0.001, η2p = 0.06, observed power = 1.00) so separate one-way ANOVAs were performed. Alcohol taste indices varied significantly based on the frequency of alcohol consumption for overall alcohol (F (3, 884) = 23.8, p < 0.001, η2p = 0.08), dry wine (F (4, 883) = 34.3, p < 0.001, η2p = 0.10), sweet wine (F (3, 884) = 11.1, p < 0.001, η2p = 0.04), sparkling wine (F (3, 884) = 4.1, p = 0.007, η2p = 0.01), beer (F (3, 884) = 11.6, p < 0.001, η2p = 0.04), and spirits (F (3, 884) = 21.1, p < 0.001, η2p = 0.07). Tukey’s HSD was used to separate the means with results summarized in Figure 2. For most indices, individuals who consumed alcoholic beverages more frequently tended to describe alcoholic beverages as less aversive. However, the opposite was true for sweet wine, where individuals that described sweet wine as too sweet tended to consume alcoholic beverages more frequently.
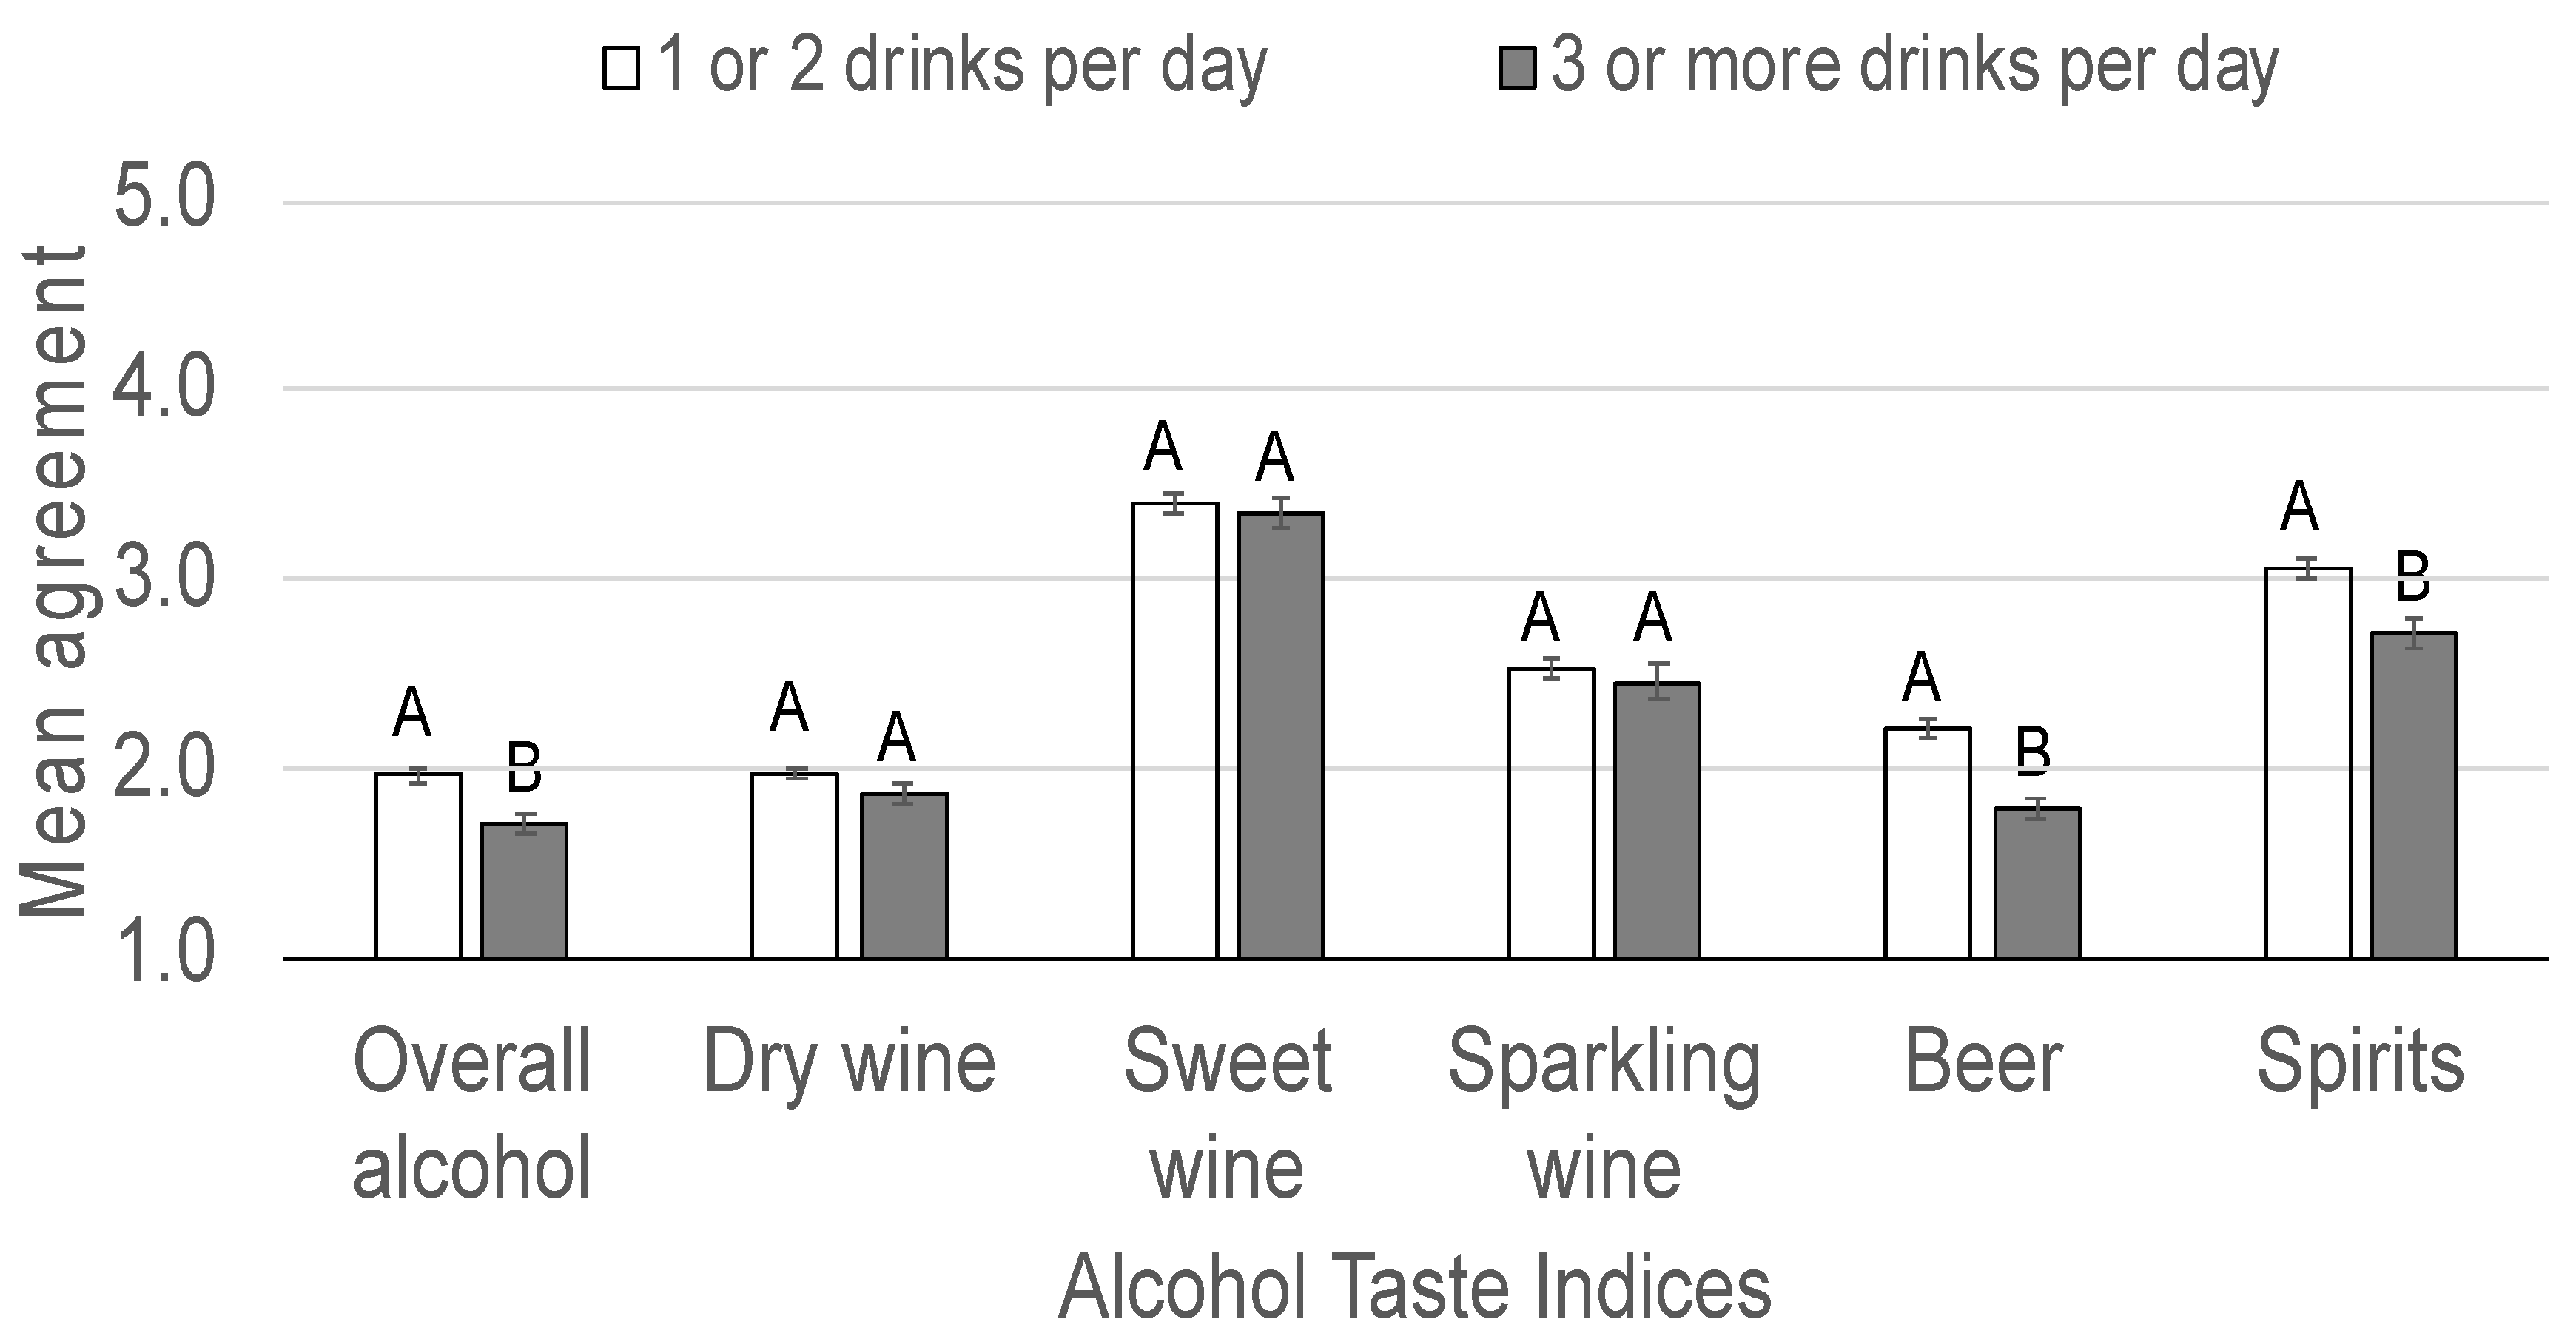
The same approach was used to assess the AUDIT responses for the number of drinks consumed on a typical day when drinking. A MANOVA showed that the alcohol taste indices varied with the number of drinks consumed (F (6, 881) = 6.3, p < 0.001, η2p = 0.04, observed power = 0.99) so t-tests were performed for each alcohol taste index. Alcohol taste indices varied significantly for overall alcohol (t (886) = 3.8, p < 0.001, d = 0.30), beer (t (886) = 5.5, p < 0.001, d = 0.43), and spirits (t (886) = 3.6, p = 0.003, d = 0.28) but no differences were found for dry wine (t (886) = 1.7, p = 0.090, d = 0.13), sweet wine (t (886) = 0.4, p = 0.665, d = 0.03), or sparkling wine (t (886) = 0.7, p = 0.495, d = 0.05). Results are summarized in Figure 3.
3.2. Alcohol Taste Indices and Alcohol Preferences
Although flavour is often cited as an important driver of food liking, other extrinsic factors (e.g., brand name, food packaging/labelling, cost, emotional context, perceived satiety) also impact liking (see [21] for a review). Thus, we sought to determine whether the alcohol taste indices were correlated (Pearson’s) to the alcohol liking indices (Table 3). In general, self-reported liking of most alcoholic beverages (red wine, dry white wine, fortified wine, beer, and spirits) was negatively correlated to alcohol taste indices (i.e., as aversion increased, liking decreased). One exception was the sweet wine alcohol taste index. In this case, increased aversion to the sweetness of sweet wine was positively correlated to the self-reported liking of red wine (r = 0.24, p < 0.001), dry white wine (r = 0.21, p < 0.001), and beer (r = 0.11, p = 0.001) was negatively correlated to the liking of fortified wine (r = −0.08, p = 0.015) and was not correlated to spirits liking (r = 0.02, p = 0.530). Liking for sweet wine did not follow the same patterns as liking for the other alcoholic beverages. As aversion increased for dry white wine, sweet wine liking increased (r = 0.18, p < 0.001), whereas increased aversion for sweet wine (r = −0.51, p < 0.001) and sparkling wine (r = −0.19, p < 0.001) was associated with decreased liking of sweet wine. In addition, the correlations were strongest when the same type of alcoholic beverages was captured by the alcohol taste statement index and self-reported liking. Thus, these findings further support the link between taste/chemesthetic sensations and the liking of a product.
3.3. Factors That Impact Alcohol Taste Index Scores
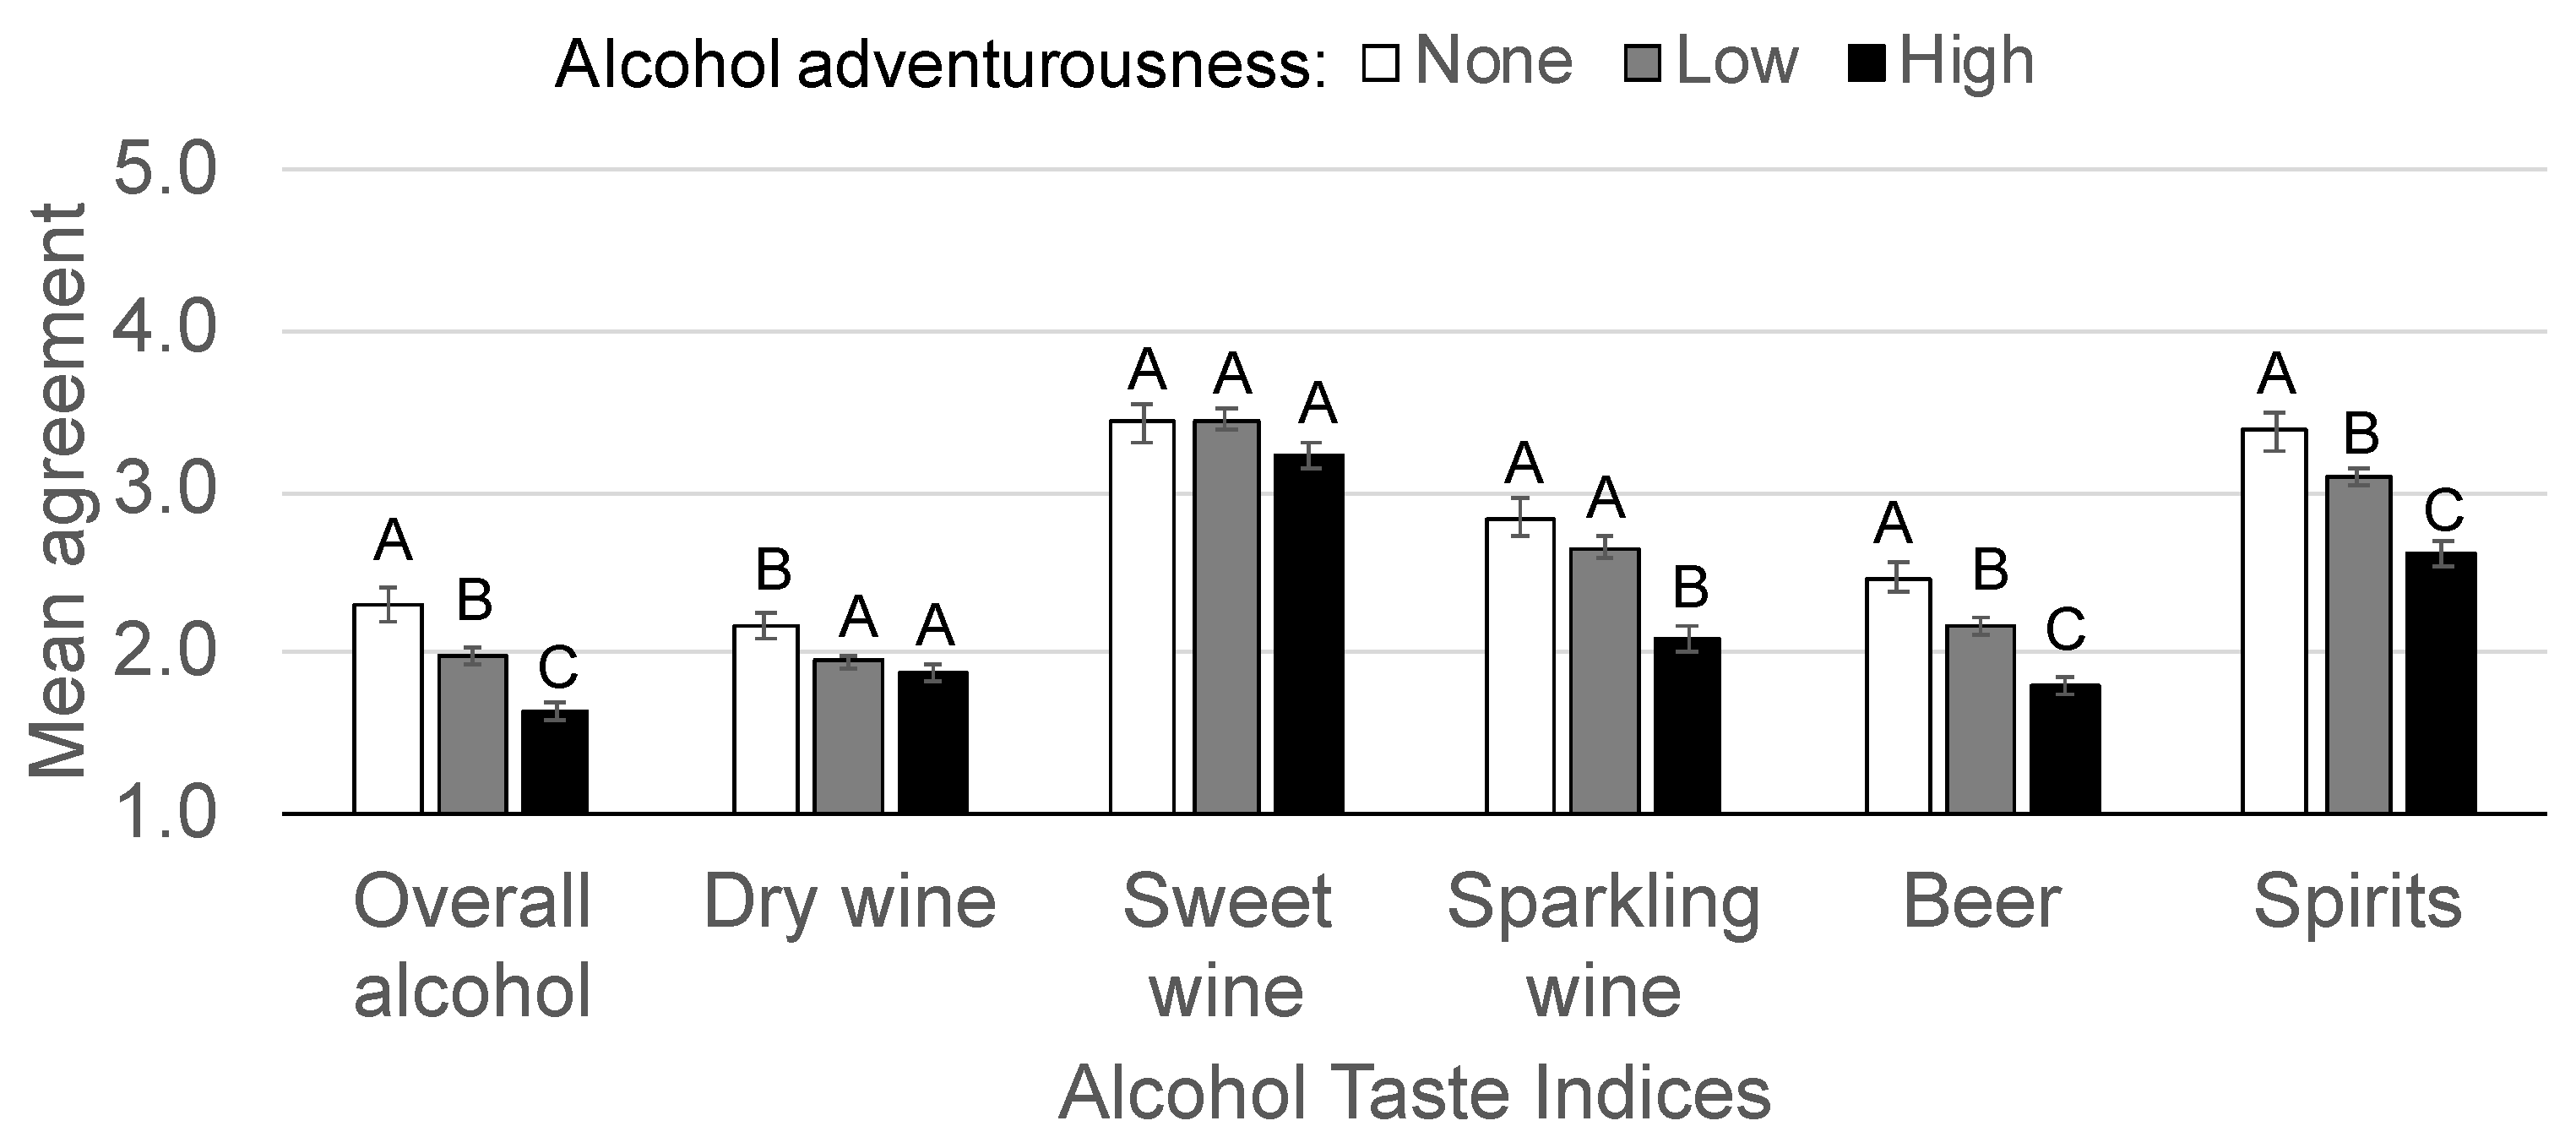
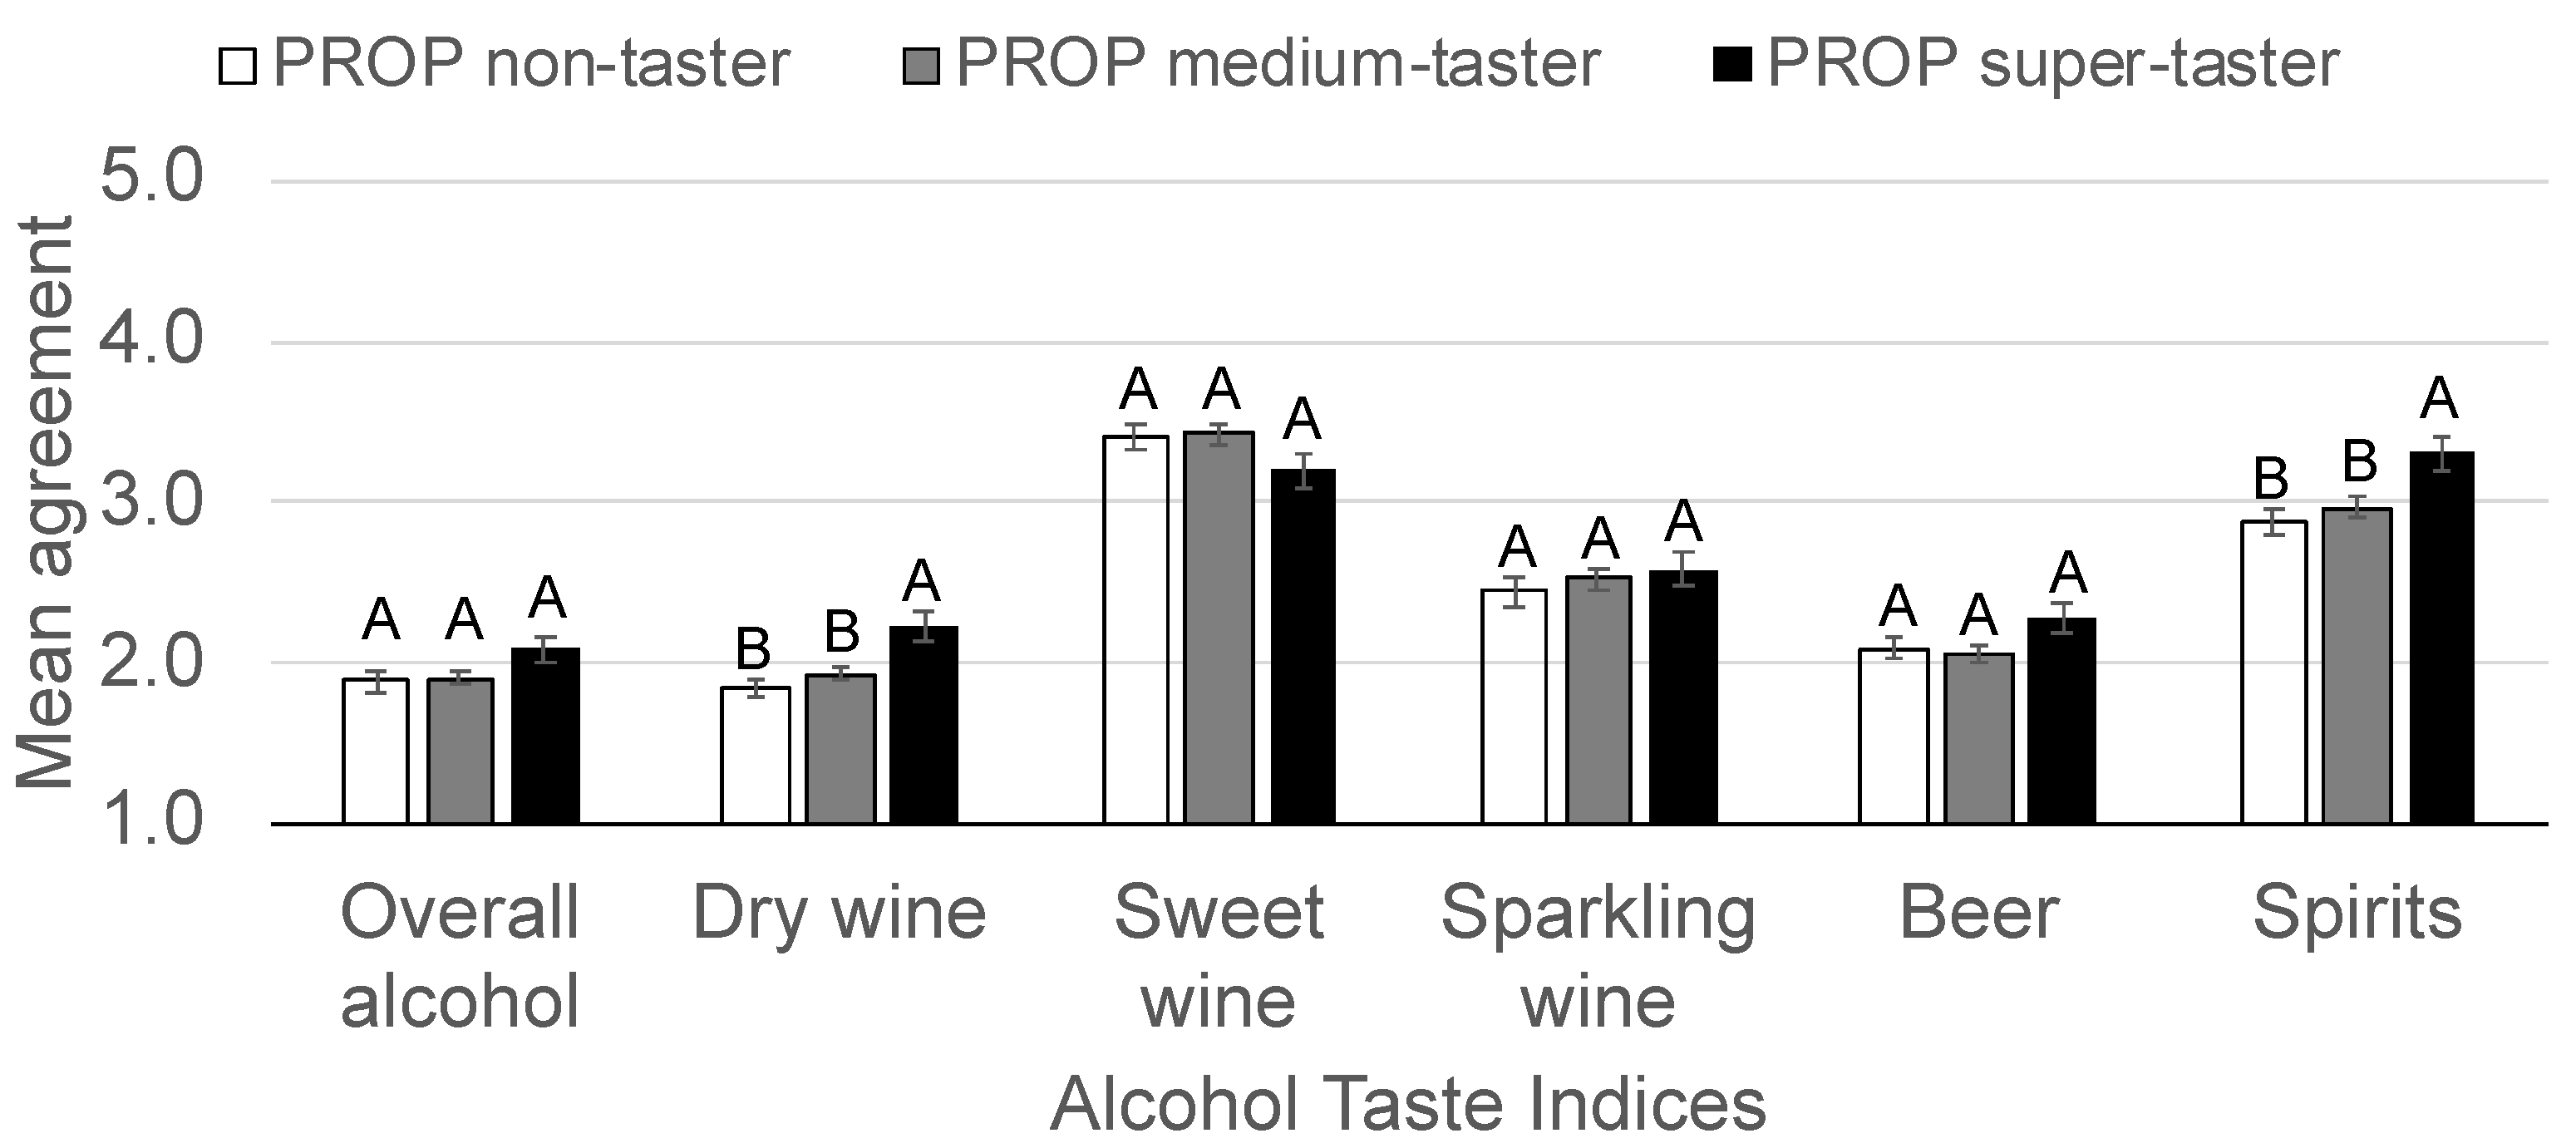
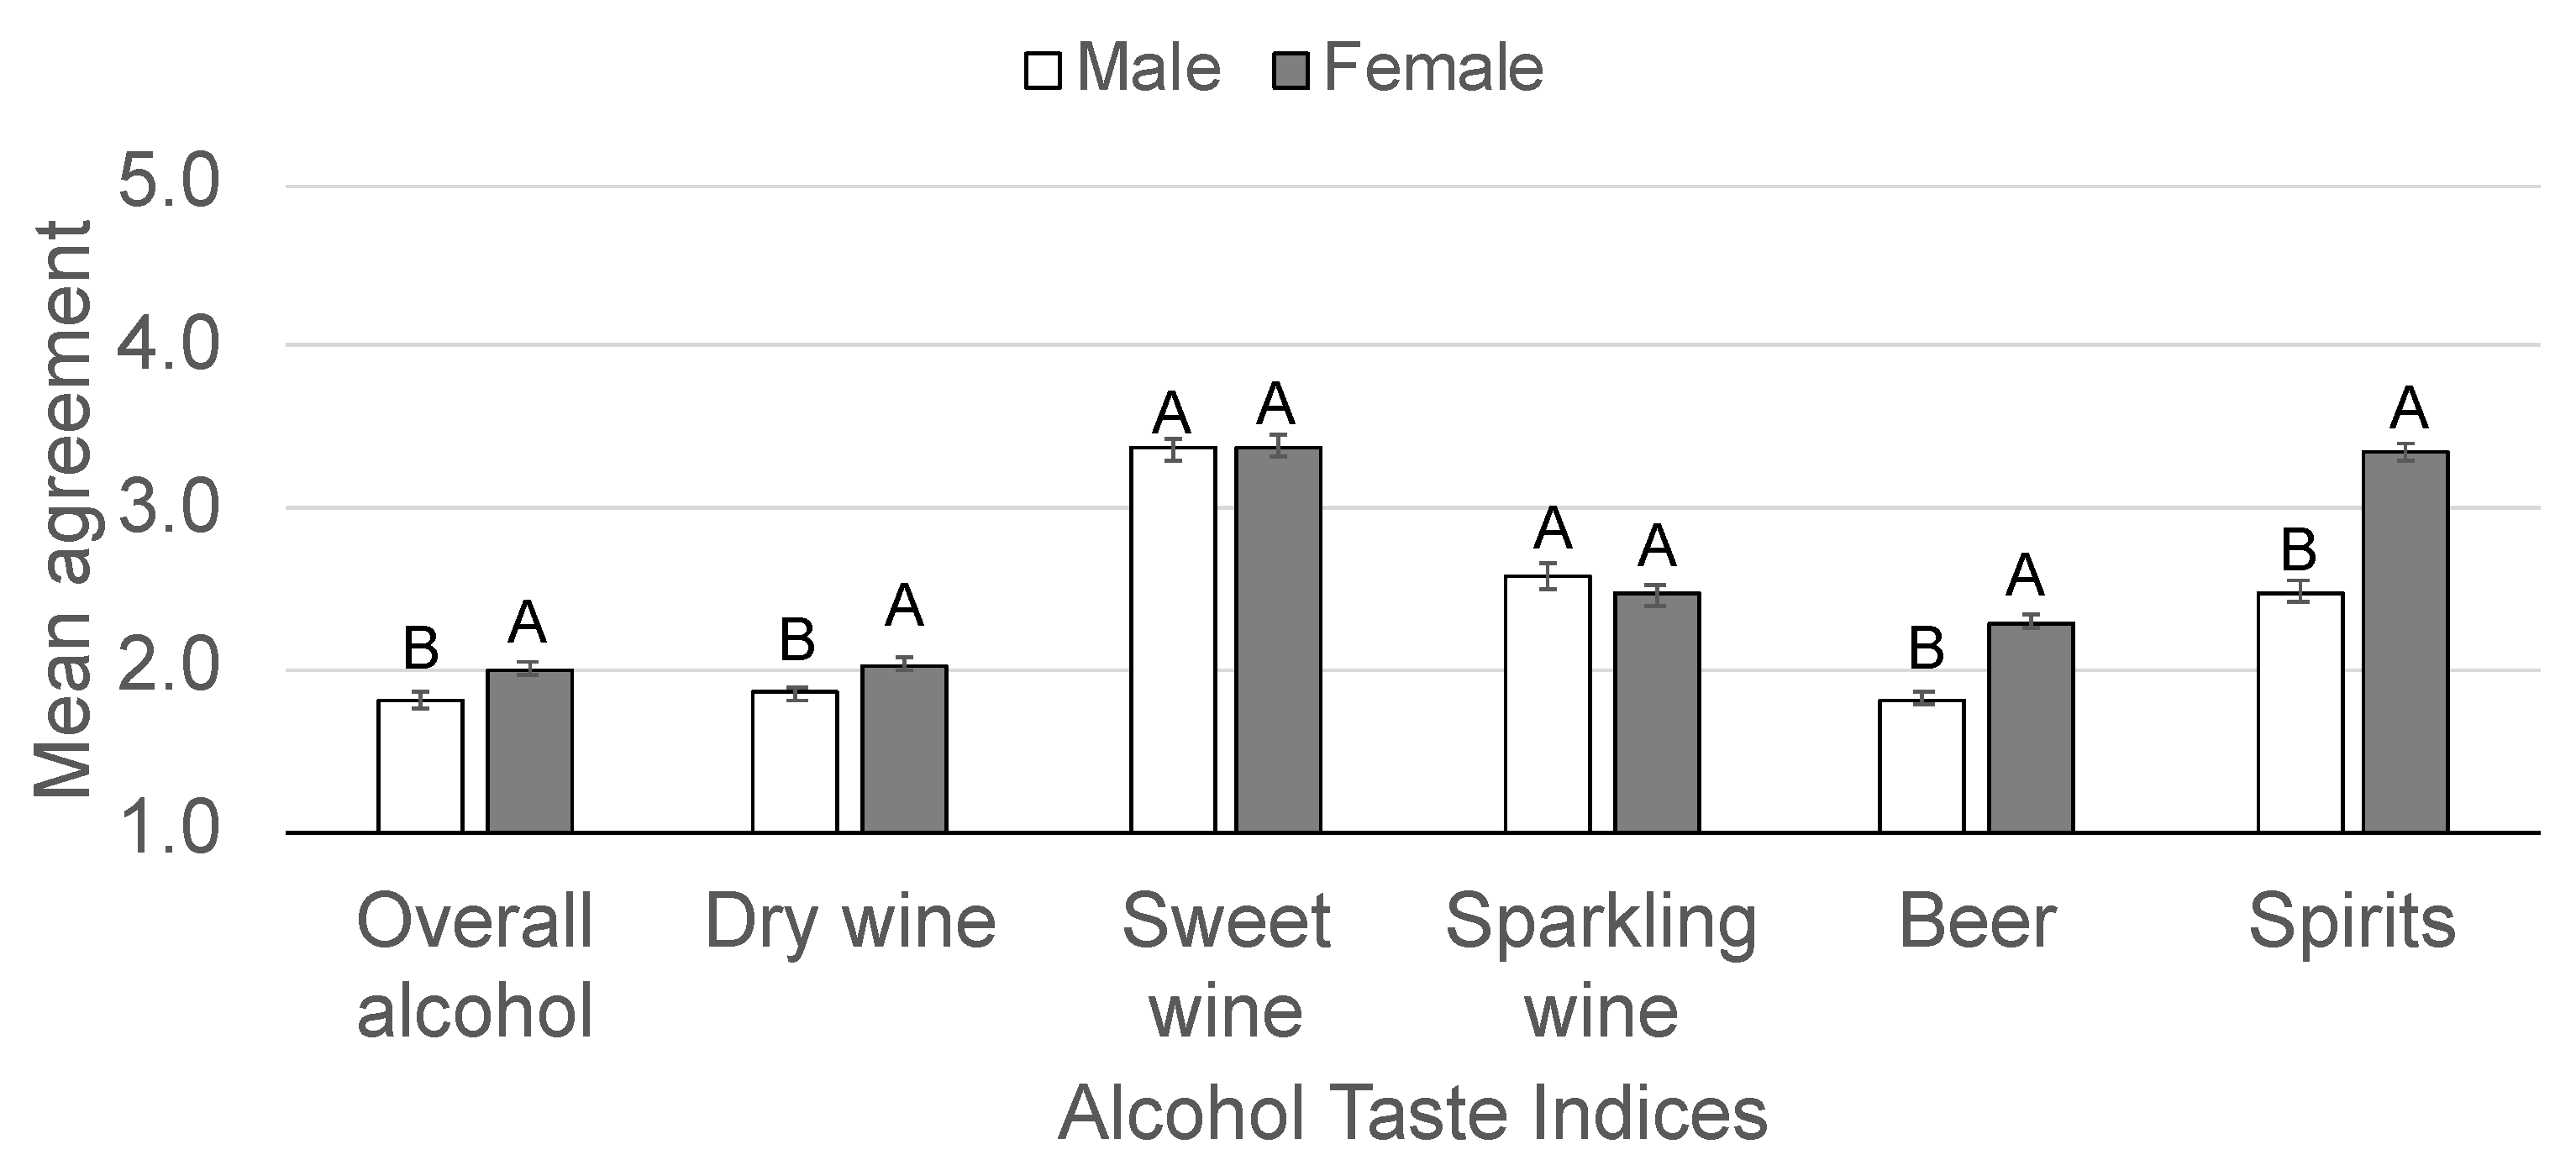
As the alcohol taste indices were associated with differences in alcohol consumption, we sought to determine whether sex (male or female), PTS (pNT, pMT or pST), or alcohol adventurousness (none, low, or high) impacted scores. Data for 46 participants were excluded as they failed to complete at least one of the above measures, resulting in a final sample size of 879. MANOVA confirmed that sex (F (6, 872) = 24.7, p < 0.001, η2p = 0.15, observed power = 1.00), PTS (F (12, 1744) = 2.2, p = 0.009, η2p = 0.02, observed power = 0.96), and alcohol adventurousness (F (12, 1744) = 8.2, p < 0.001, η2p = 0.053, observed power = 1.00) each impacted the ratings of the alcohol taste statements. As a result, all three variables were retained and included in three-way ANOVAs with all two-way interactions for each of the alcohol taste indices. As none of the interactions were significant (data not shown), the analysis was repeated without interaction terms. The variance inflation factor was below 1.3 for all combinations of the explanatory variables, indicating they were not intercorrelated [64]. Results are summarized in Table 4. Tukey’s HSD was used as a means separation test and the results are summarized in Figure 4, Figure 5 and Figure 6.
Based on the three-way ANOVAs, in general, as alcohol adventurousness increased, alcoholic beverages were described as less aversive by consumers. pST tended to describe alcoholic beverages as more aversive than pNT. Similarly, females tended to describe alcoholic beverages as more aversive than males. Differences in the magnitude between PTS groups tended to be smaller than those for sex or alcohol adventurousness. As this finding may be partially attributable to the use of PTS groups, further analysis using PROP responsiveness was warranted. To this end, Pearson’s correlation was used to test for an association between log-transformed PROP responsiveness and the alcohol taste indices. PROP responsiveness was significantly positively correlated with scores for the dry wine index (r = 0.12, p < 0.001) and the spirits index (r = 0.09, p = 0.008). Similarly, the positive correlation between the overall alcohol index PROP responsiveness (r = 0.06, p = 0.062) approach significance. PROP responsiveness was not correlated with the sweet wine index (r = −0.050, p = 0.138), the sparkling wine index (r = 0.02, p = 0.477), or the beer index (r = 0.04, p = 0.203). When a similar approach, was used to test for correlation between PROP responsiveness and the individual alcohol taste statements, results for individual statements were largely consistent with those of the index to which they belong (data not shown). However, A12 (beer tastes too bitter me) was positively correlated with PROP responsiveness (r = 0.09, p = 0.010).
4. Discussion
Principal component analysis showed that untrained consumers grouped the alcohol taste statements by alcoholic beverage type rather than by the sensation described (Table 1). This result might suggest that consumers group all the aversive sensations together for each alcoholic beverage type, rather than considering them individually. For example, the same participants tended to describe wine as too dry, too bitter, too hot/burn, and too sour. Novices and wine experts perform equally when identifying basic tastes [65], which may be akin to comparing trained and untrained consumers. Thus, our findings suggest that finer discrimination of the taste/chemesthetic sensations elicited by alcoholic beverages in the current context may not be possible. Instead, self-reported aversion towards the taste and chemesthetic sensations elicited by alcoholic beverages may be generalized, reflecting the rapid and global judgements typically made when perceiving overall flavour [66]. Nevertheless, considerable differences in the intensity of the taste/chemesthetic sensations exist within the alcoholic beverage categories studied here. Thus, consideration of styles within specific sub-groups of alcoholic beverages (e.g., lager vs. pale ale) may better capture aversion towards specific taste/chemesthetic sensations, rather than general aversion.
As the survey was administered by mail, the alcohol taste statements were not randomized across participants. Instead, they were grouped by alcoholic beverage type, which may have led to order effects or habituation [67], partially explaining the results. However, the survey also included four questions about the complexity of alcoholic beverages that were spatially separated throughout the survey (appearing with each beverage type), and these were grouped together regardless of the alcoholic beverages type in the principal component analysis. Thus, participants were able to distinguish aversion for some types of sensations/concepts.
Consumers that tended to describe the ‘sweetness of sweet wine’ as more aversive, also tended to describe the sensations elicited by red and dry wine (hot/burns, bitter, dry, sour) as less aversive. This finding suggests that aversion towards sweetness is a key feature used by consumers when differentiating wine styles. In fact, cluster analysis of wine liking scores in the same dataset [45] demonstrated that liking for sweet wines (dessert, coolers, fruit wine, flavored fruit wine, sweet wine, and sweet rosé) was distinct from red wine, dry white wine, and fortified wine. As the sweetness of different sweet wine styles can also vary considerably [68], more research is needed to determine whether aversion to the sweetness of sweet wine is similar across styles. Conversely, consumers tended to rate their aversion towards all the taste/chemesthetic sensations elicited by beer (sour, bitter, sweet, and carbonation) similarly. Importantly, our findings suggest that capturing aversion towards the sweetness of alcoholic beverages is important. Furthermore, as sweet-related aversion may follow a distinct pattern to that of the other sensations elicited by alcoholic beverages (e.g., bitter, sour), careful consideration is needed before including sweet-related alcohol taste statements in alcohol taste indices.
Boxplots for most of the alcohol taste statement indices (overall alcohol, dry wine, sparkling wine, and beer) showed that consumers tended to disagree that the taste and chemesthetic sensations were too intense. Conversely, most consumers tended to agree that sweet wine was too sweet (Figure 1). Thus, the finding suggests that taste sensations that are typically characterized as aversive (hot/burns, bitter, sour) and those typically considered appetitive [18] may not always be described as such by alcoholic beverage consumers. More research is encouraged to determine in which contexts and for which consumers taste and chemesthetic sensations are considered aversive or appetitive.
While we did not design the study to formally validate a new scale for measuring consumers’ experiences of alcoholic beverages, the indices developed based on their self-reported aversion showed acceptable internal reliability and were correlated with both alcohol consumption and preferences. Together, the results provide a proof-of-concept correlation and further research is encouraged to develop a formal measure of self-reported aversion to alcoholic beverages. Future research could address factors that limited our ability to fully validate the alcohol taste indices, including use of a fully representative sample of alcohol consumers, defining alcoholic beverage types (e.g., sweet wine), and determining test-retest reliability [69]. In addition, testing statements for all combinations of alcoholic beverages and orosensations that are commonly elicited (e.g., beer tastes too hot/burns for me) would allow for a more thorough assessment of potential items for inclusion in the scale [69]. Future studies should also screen participants that currently abstain from alcohol to determine if they have previously consumed it. Importantly, lifetime abstainers should be excluded as they cannot rate their aversion towards alcoholic beverages if they have never consumed them. Further research is also encouraged to determine if similar measures can be developed for non-alcoholic beverages and food.
4.1. Alcohol Taste Indices, Consumption and Liking
Not unexpectedly, individuals that are more averse to the taste and chemesthetic sensations elicited by alcoholic beverages tend to drink less of all alcoholic beverage types (overall and drinks per day when drinking) and tend to drink less frequently. These results raise the question of whether self-reported aversion to the taste and chemesthetic sensations elicited by alcoholic beverages are protective against alcohol misuse or risk of developing an alcohol use disorder. Most consumers in our sample are in the lowest risk category of the AUDIT, limiting our ability to address the question; however, we recommend that further research includes individuals with or at higher risk of developing an alcohol use disorder to further examine this possibility.
Although orosensory responsiveness was not measured, our results are consistent with studies that have shown that higher orosensory responsiveness is associated with lower alcohol consumption [10,15,19]. Importantly, by asking consumers to rate their aversion towards taste and chemesthetic sensations, we are able to determine whether consumers find the sensations appetitive or aversive. More research comparing our approach (e.g., “beer tastes too bitter”) with more traditional orosensory ratings (e.g., “beer tastes bitter”) is recommended. In particular, this strategy may help to resolve reports where orosensory responsiveness is positively correlated with alcohol consumption, such as Higgins and Hayes’ [17] finding that tetralone intensity and pale ale consumption were positively correlated for pale ale consumers.
Proportionally, participants tended to consume less of the alcoholic beverages they found most aversive and more of the beverages they found less aversive. Thus, increased aversion towards alcoholic beverages was associated with both reductions and shifts in alcohol consumption. As the alcohol taste indices are also strongly negatively correlated to alcoholic beverage liking, these findings support the hypothesis that alcoholic beverage disliking is at least partially driven by taste/chemesthetic aversion. More research is needed to confirm these findings in sampled products and in different cohorts. Furthermore, research where extrinsic factors that impact liking are included is encouraged, as it would allow us to determine if/how extrinsic factors impact aversion. For example, determining whether taste/chemesthetic-related claims on alcoholic beverage packaging (e.g., “no harsh bitterness”) mediate the liking or consumption of alcoholic beverages may provide additional insights into optimal strategies for targeted marketing of alcoholic beverages [70].
4.2. Alcohol Taste Indices, PTS, Sex and Alcohol Adventurousness
Pickering et al. [45] demonstrated in the same dataset that wine consumption and liking were lower in pST and individuals with low alcohol adventurousness. Thus, we correctly hypothesized that pST and individuals with lower levels of alcohol adventurousness would report higher levels of aversion to the taste/chemesthetic sensations elicited by alcoholic beverages than would pNT and individuals with high levels of alcohol adventurousness, respectively. Although the findings may not be surprising, they do provide evidence of a direct and missing link between orosensory responsiveness and consumption/liking. That is, the greater orosensory responsiveness of pST compared to pNT results in higher aversion and thereby lower liking and consumption. Future research on PTS and alcoholic beverage behavior is encouraged to include consumers’ self-reported aversion to tastes as a potential mediating factor, given that some studies report that liking is highest in pNT and lowest in pST [45,71,72], some do not [26,42,73], and others fail to find a significant association [32,74].
Additionally, consistent with Pickering et al. [45], no interaction was found between PTS and alcohol adventurousness. Ullrich et al. [46] have reported that food adventurousness impacted the liking of alcoholic beverages for PROP tasters (i.e., combined pMT and pST) but not for pNT. Although the current study and Pickering et al. [45] asked participants to rate their liking of alcoholic beverages, Ullrich et al. [46] counted the number of alcoholic beverages liked. Thus, methodological differences may account for the different results.
The impact of sex on the rating of the alcohol taste indices was investigated, as females are more responsive to basic taste stimuli than males [75,76]. Thus, we hypothesized that when compared to males, the increased responsiveness of females would result in higher aversion towards the taste/chemesthetic sensations in alcoholic beverages. Consistent with our hypothesis, females self-reported higher levels of aversion to four alcohol taste indices (overall alcohol, dry wine, beer, and spirits). As such, it is plausible that the increased aversion to taste and chemesthetic sensations in females may explain reports of gender/sex differences in overall alcohol consumption [44,77,78] or alcohol liking [44], both of which are lower in females than males. When the wine consumption (total intake and frequency) of males and females was compared in an earlier study using the same data, no sex differences were reported [45]. However, the study did not consider the consumption of beer or spirits, where sex-based differences in consumption are possible. Furthermore, as consumers in the current study were recruited using the mailing list of a wine retailing group and red wine was the preferred alcoholic beverage in the current study (Figure A3), Pickering et al. [45] may not have captured many individuals that dislike wine. As such, differences in wine consumption based on aversion to the taste/chemesthetic sensations of alcoholic beverages may yet be identified in a more representative sample of alcoholic beverage consumers. Further research to fully characterize the relationship between taste responsiveness/aversion and alcohol behavior is needed and is timely, as the origin of sex/gender-related differences (e.g., biological or social) is currently being debated [79].
5. Conclusions
The current study provides insights into the value of self-reported aversion towards the taste and chemesthetic sensations elicited by alcoholic beverages and its impact on alcoholic beverage liking and consumption in a large sample of consumers (N = 925). Higher aversion towards the taste and chemesthetic sensations elicited by alcoholic beverages was associated with lower liking and monthly consumption of most alcoholic beverages. Sex and PTS are proxies for orosensory responsiveness, and both were associated with differences in the alcohol taste indices. As such, our findings suggest that greater orosensory responsiveness likely contributes to higher aversion to the taste and chemesthetic sensations elicited by alcoholic beverages, which in turn reduces liking and consumption. However, the current study also demonstrated that consumers shift their consumption towards alcoholic beverages they describe as less aversive. As a result, future studies exploring the relationship between taste and chemesthetic responsiveness and alcohol behavior should examine both overall consumption and the proportion of alcoholic beverage types consumed. In addition, capturing self-reported aversion may help to more fully explain the relationship between orosensory responsiveness and alcohol preferences/consumption. Self-reported aversion towards orosensations, particularly in alcoholic beverages that elicit a nominally aversive sensation (e.g., bitterness), may allow consumers to be segmented into groups that vary in their liking of the sensation in order to obtain a more nuanced picture of overall preferences and consumption. Importantly, despite the lack of training, consumers’ self-reported aversion did associate with alcohol behavior, suggesting that the approach can be adapted to capture valuable information during product development by alcohol producers.
Author Contributions
Conceptualization, G.J.P.; methodology, G.J.P.; formal analysis, G.J.P. and M.K.T.; investigation, G.J.P.; resources G.J.P.; data curation, G.J.P. and M.K.T.; writing—original draft preparation, M.K.T.; writing—review and editing, G.J.P. and M.K.T.; visualization, M.K.T.; project administration, G.J.P.; funding acquisition, G.J.P. All authors have read and agreed to the published version of the manuscript.
Funding
This research was funded by a National Sciences and Engineering Research Council of Canada (Discovery Grant), grant number 11733181 to G.J.P.
Institutional Review Board Statement
The study was conducted according to the guidelines of the Declaration of Helsinki and approved by the Institutional Review Board of the University at Buffalo (121710 [4]).
Informed Consent Statement
Informed consent was obtained from all subjects involved in the study.
Data Availability Statement
The data presented in this study are available on request from the corresponding author. The data are not publicly available to maintain the confidentiality of participants.
Acknowledgments
The authors would like to acknowledge the research group in integrated marketing (RIM) at the School of Management, State University of New York at Buffalo for their support, and Arun K. Jain (deceased) and Ram Bezawada in particular. The authors would also like to thank the reviewers for providing feedback that strengthened the manuscript during the peer review process.
Conflicts of Interest
The authors declare no conflict of interest. The funders had no role in the design of the study; in the collection, analyses, or interpretation of data; in the writing of the manuscript, or in the decision to publish the results.
Appendix A. Alcohol Consumption Boxplots
Figure A1.
Boxplots showing the monthly consumption of alcoholic beverages overall and by type (white wine, red wine, beer, and spirits; n = 884).
Figure A1.
Boxplots showing the monthly consumption of alcoholic beverages overall and by type (white wine, red wine, beer, and spirits; n = 884).

Figure A2.
Boxplots showing the proportion of white wine, red wine, beer, and spirits consumed monthly (n = 853).
Figure A2.
Boxplots showing the proportion of white wine, red wine, beer, and spirits consumed monthly (n = 853).

Appendix B. Liking Indices
Figure A3.
Boxplots showing the mean self-reported liking scores (gDOL) for red wine (n = 904), dry wine (n = 910), sweet wine (n = 911), fortified wine (n = 883), beer (n = 900), and spirits (n = 905).
Figure A3.
Boxplots showing the mean self-reported liking scores (gDOL) for red wine (n = 904), dry wine (n = 910), sweet wine (n = 911), fortified wine (n = 883), beer (n = 900), and spirits (n = 905).


Table A1.
Summary of alcoholic beverage liking indices (MIC = mean interitem correlation, α = Cronbach’s alpha). * Wine-related products were divided into four indices based on the clusters identified by Pickering et al. [45] in the same dataset.
Table A1.
Summary of alcoholic beverage liking indices (MIC = mean interitem correlation, α = Cronbach’s alpha). * Wine-related products were divided into four indices based on the clusters identified by Pickering et al. [45] in the same dataset.
| Index | Items | Descriptive Stats | Internal Reliability | ||||
|---|---|---|---|---|---|---|---|
| M | SD | n | α | MIC | |||
| Red wine * (1 item) | Red wine | 40 | −55 | 904 | NA | NA | |
| Dry wine * (2 items) | Dry white wine | Dry sparkling wine | 8 | 49 | 910 | 0.68 | 0.51 |
| Sweet wine * (6 items) | Wine coolers (e.g., Seagram’s Escapes, Sun Country); Fruit wine (e.g., Becker Farms Vizcara); Dessert wine (e.g., Icewine, Sauternes); Sweet white wine | Flavored fruit wine (e.g., Arbor mist); Sweet rosé wine (e.g., Carlo Rossi Rosé) | −14 | 47 | 911 | 0.91 | 0.61 |
| Fortified wine * (5 items) | Port wine (e.g., Graham’s Tawny, Sandeman Ruby); Hard cider (e.g., George Hornsby’s, Woodchuck) | Dry sherry; Dry rosé wine; Sweet sherry | −17 | 44 | 883 | 0.83 | 0.49 |
| Beer (13 items) | India Pale Ale (e.g., Victory Brewing IPA, Southern Tier); Lambic beer (e.g., Lindemans Belgian Framboise); Mild and brown ale (e.g., Newcastle Brown Ale); Ultra-light beer (e.g., MGD 60, Michelob Ultra); Stout and Porter (e.g., Guinness extra stout); Lager beer (e.g., Heineken, Labatt Blue); Wheat beer | Light beer (e.g., Miller Lite, Bud Light); Malt liquor (e.g., Colt 45, Steel Reserve); Pale ale (e.g., Sierra Nevada, Bass); Pilsner beer (e.g., Pilsner Urquell); Strong/high alcohol beer; Ale (e.g., Sam Adams) | −9 | 48 | 901 | 0.94 | 0.54 |
| Spirits (8 items) | Scotch (blend or single malt); Unflavored vodka (e.g., Svedka, Grey Goose); Rum (straight); Brandy/Cognac | Bourbon; Whisky; Tequila; Gin | −14 | 44 | 905 | 0.88 | 0.46 |
| Excluded (3 items) | Ready-to-drink mixed alcohol (e.g., Bacardi’s Rum Runner, Jack and Cola); Flavoured vodka | Liqueurs (e.g., Bailey’s Irish Cream) | NA | NA | NA | NA | NA |
References
- Tepper, B.J. Nutritional implications of genetic taste variation: The role of PROP sensitivity and other taste phenotypes. Annu. Rev. Nutr. 2008, 28, 367–388. [Google Scholar] [CrossRef] [PubMed]
- Garcia-Bailo, B.; Toguri, C.; Eny, K.M.; El-Sohemy, A. Genetic variation in taste and its influence on food selection. OMICS J. Integr. Biol. 2009, 13, 69–80. [Google Scholar] [CrossRef] [PubMed] [Green Version]
- Thibodeau, M.; Pickering, G.J. The role of taste in alcohol preference, consumption and risk behavior. Crit. Rev. Food Sci. Nutr. 2019, 59, 676–692. [Google Scholar] [CrossRef] [PubMed]
- Hayes, J.E.; Keast, R.S.J. Two decades of supertasting: Where do we stand? Physiol. Behav. 2011, 104, 1072–1074. [Google Scholar] [CrossRef] [PubMed] [Green Version]
- Glanz, K.; Basil, M.; Maibach, E.; Goldberf, J.; Snyder, D. Why americans eat what they do. J. Am. Diet. Assoc. 1998, 98, 1118–1126. [Google Scholar] [CrossRef]
- Aggarwal, A.; Rehm, C.D.; Monsivais, P.; Drewnowski, A. Importance of taste, nutrition, cost and convenience in relation to diet quality: Evidence of nutrition resilience among US adults using National Health and Nutrition Examination Survey (NHANES) 2007–2010. Prev. Med. 2016, 90, 184–192. [Google Scholar] [CrossRef] [Green Version]
- Kourouniotis, S.; Keast, R.S.J.; Riddell, L.J.; Lacy, K.; Thorpe, M.G.; Cicerale, S. The importance of taste on dietary choice, behaviour and intake in a group of young adults. Appetite 2016, 103, 1–7. [Google Scholar] [CrossRef]
- Small-Kelly, S. Taste Responsiveness and Beer Behaviour. Master’s Thesis, Brock University, St. Catharines, ON, Canada, 2018. [Google Scholar]
- Boersma, P.; Villarroel, M.A.; Vahratian, A. Heavy Drinking among U.S Adults 2018, NCHS Data Brief, No 374; Centers for Disease Control and Prevention: Hyattsville, MD, USA, 2020.
- Thibodeau, M.; Bajec, M.; Pickering, G. Orosensory responsiveness and alcohol behaviour. Physiol. Behav. 2017, 177, 91–98. [Google Scholar] [CrossRef]
- Graefe, D.A.; Graefe, A.R. Gender and craft beer: Participation and preferences in Pennsylvania. Int. J. Sociol. Leis. 2021, 4, 45–60. [Google Scholar] [CrossRef]
- Ng, G.I.; Chen, C.M.; Graubard, B.I.; Hoffman, H.J.; Breslow, R.A. Alcohol and taste intensity. Chem. Percept. 2019, 12, 90–99. [Google Scholar] [CrossRef]
- Fischer, M.E.; Cruickshanks, K.J.; Pankow, J.S.; Pankratz, N.; Schubert, C.R.; Huang, G.-H.; Klein, B.E.K.; Klein, R.; Pinto, A. The associations between 6-n-propylthiouracil (PROP) intensity and taste intensities differ by TAS2R38 haplotype. J. Nutr. Nutr. 2014, 7, 143–152. [Google Scholar] [CrossRef] [Green Version]
- Thibodeau, M.; Pickering, G. Perception of aqueous ethanol binary mixtures containing alcohol-relevant taste and chemesthetic stimuli. Beverages 2021, 7, 23. [Google Scholar] [CrossRef]
- Nolden, A.A.; Hayes, J.E. Perceptual qualities of ethanol depend on concentration, and variation in these percepts associates with drinking frequency. Chem. Percept. 2015, 8, 149–157. [Google Scholar] [CrossRef] [PubMed] [Green Version]
- Small-Kelly, S.; Pickering, G. Variation in orosensory responsiveness to alcoholic beverages and their constituents—The role of the thermal taste phenotype. Chem. Percept. 2020, 13, 45–58. [Google Scholar] [CrossRef]
- Higgins, M.J.; Hayes, J.E. Regional variation of bitter taste and aftertaste in humans. Chem. Senses 2019, 44, 721–732. [Google Scholar] [CrossRef] [PubMed]
- Beauchamp, G.K. Why do we like sweet taste: A bitter tale? Physiol. Behav. 2016, 164, 432–437. [Google Scholar] [CrossRef] [Green Version]
- Lanier, S.A.; Hayes, J.E.; Duffy, V.B. Sweet and bitter tastes of alcoholic beverages mediate alcohol intake in of-age undergraduates. Physiol. Behav. 2005, 83, 821–831. [Google Scholar] [CrossRef] [PubMed]
- Yeomans, M.R. Understanding individual differences in acquired flavour liking in humans. Chem. Percept. 2010, 3, 34–41. [Google Scholar] [CrossRef]
- Li, X.E.; Jervis, S.M.; Drake, M.A. Examining extrinsic factors that influence product acceptance: A review. J. Food Sci. 2015, 80, R901–R909. [Google Scholar] [CrossRef]
- Yang, Q.; Hollowood, T.; Hort, J. Phenotypic variation in oronasal perception and the relative effects of PROP and thermal taster status. Food Qual. Prefer. 2014, 38, 83–91. [Google Scholar] [CrossRef] [Green Version]
- Bajec, M.R.; Pickering, G.J. Thermal taste, PROP responsiveness, and perception of oral sensations. Physiol. Behav. 2008, 95, 581–590. [Google Scholar] [CrossRef]
- Yang, Q.; Williamson, A.-M.; Hasted, A.; Hort, J. Exploring the relationships between taste phenotypes, genotypes, ethnicity, gender and taste perception using Chi-square and regression tree analysis. Food Qual. Prefer. 2020, 83, 103928. [Google Scholar] [CrossRef]
- Pierguidi, L.; Spinelli, S.; Dinnella, C.; Prescott, J.; Monteleone, E. Sensory acceptability and personality traits both determine which contexts are preferred for consumption of alcoholic cocktails. Food Qual. Prefer. 2020, 85, 103978. [Google Scholar] [CrossRef]
- Pickering, G.J.; Hayes, J.E. Influence of biological, experiential and psychological factors in wine preference segmentation. Aust. J. Grape Wine Res. 2017, 23, 154–161. [Google Scholar] [CrossRef] [PubMed]
- Duffy, V.B.; Peterson, J.M.; Bartoshuk, L.M. Associations between taste genetics, oral sensations and alcohol intake. Physiol. Behav. 2004, 82, 435–445. [Google Scholar] [CrossRef] [PubMed]
- Bartoshuk, L.M.; Duffy, V.B.; Miller, I.J. PTC/PROP tasting: Anatomy, psycophysics and sex effects. Physiol. Behav. 1994, 56, 1165–1171. [Google Scholar] [CrossRef]
- Bartoshuk, L.M.; Cunningham, K.E.; Dabrila, G.M.; Duffy, V.B.; Etter, L.; Fast, K.R.; Lucchina, L.A.; Prutkin, J.; Snyder, D.J. From sweets to hot peppers: Genetic variation in taste, oral pain, and oral touch. In Tastes & Aromas: The Chemical Senses in Science and Industry; Bell, G.A., Watson, A.J., Eds.; UNSW/Blackwell Science: Sydney, Australia, 1999. [Google Scholar]
- Thibodeau, M.; Saliba, A.; Bajec, M.; Pickering, G. Examination and validation of classification schema for determining thermal taste status. Chem. Percept. 2019, 12, 69–89. [Google Scholar] [CrossRef]
- Zhao, L.; Kirkmeyer, S.V.; Tepper, B.J. A paper screening test to assess genetic taste sensitivity to 6-n-propylthiouracil. Physiol. Behav. 2003, 78, 625–633. [Google Scholar] [CrossRef]
- Concas, M.P.; Catamo, E.; Biino, G.; Toniolo, D.; Gasparini, P.; Robino, A. Factors associated with food liking and their relationship with metabolic traits in Italian cohorts. Food Qual. Prefer. 2019, 75, 64–70. [Google Scholar] [CrossRef]
- Monteleone, E.; Spinelli, S.; Dinnella, C.; Endrizzi, I.; Laureati, M.; Pagliarini, E.; Sinesio, F.; Gasperi, F.; Torri, L.; Aprea, E.; et al. Exploring influences on food choice in a large population sample: The Italian Taste project. Food Qual. Prefer. 2017, 59, 123–140. [Google Scholar] [CrossRef]
- Bartoshuk, L.M.; Conner, E.; Grubin, D.; Karrer, T.; Kochenbach, K.; Palesco, M.; Snow, D.; Pelchat, M.; Danowski, S. PROP supertasters and the perception of ethyl alcohol. Chem. Senses 1993, 18, 526–527. [Google Scholar] [CrossRef]
- Prescott, J.; Swain-Campbell, N. Responses to repeated oral irritation by capsaicin, cinnamaldehyde and ethanol in PROP tasters and non-tasters. Chem. Senses 2000, 25, 239–246. [Google Scholar] [CrossRef]
- Mattes, R.D.; DiMeglio, D. Ethanol perception and ingestion. Physiol. Behav. 2001, 72, 217–229. [Google Scholar] [CrossRef]
- Intranuovo, L.R.; Powers, A.S. The Perceived Bitterness of Beer and 6-n-Propylthiouracil (PROP) Taste Sensitivity. Ann. N. Y. Acad. Sci. 1998, 855, 813–815. [Google Scholar] [CrossRef]
- Pickering, G.J.; Simukova, K.; DiBattista, D. Intensity of taste and astringency sensations elicited by red wines is associated with sensitivity to PROP (6-n-propylthiouracil). Food Qual. Prefer. 2004, 15, 147–154. [Google Scholar] [CrossRef]
- Pickering, G.J.; Robert, G. Perception of mouthfeel sensations elicited by red wine are associated with sensitivity to 6-n-propylthiouracil. J. Sens. Stud. 2006, 21, 249–265. [Google Scholar] [CrossRef]
- Pickering, G.J.; Moyes, A.; Bajec, M.R.; DeCourville, N. Thermal taster status associates with oral sensations elicited by wine. Aust. J. Grape Wine Res. 2010, 16, 361–367. [Google Scholar] [CrossRef]
- Fu, D.; Riordan, S.; Kieran, S.; Andrews, R.A.; Ring, H.Z.; Ring, B.Z. Complex relationship between TAS2R receptor variations, bitterness perception, and alcohol consumption observed in a population of wine drinkers. Food Funct. 2019, 10, 1643–1652. [Google Scholar] [CrossRef]
- Bajec, M.R. Astringency and Other Oral Sensations: Biological Sources of Individual Variation and Association with Food and Beverage Behaviour. Ph.D. Thesis, Brock University, St. Catharines, ON, Canada, 2010. [Google Scholar]
- Ong, J.-S.; Hwang, L.-D.; Zhong, V.W.; An, J.; Gharahkhani, P.; Breslin, P.A.S.; Wright, M.J.; Lawlor, D.A.; Whitfield, J.; MacGregor, S.; et al. Understanding the role of bitter taste perception in coffee, tea and alcohol consumption through Mendelian randomization. Sci. Rep. 2018, 8, 16414. [Google Scholar] [CrossRef] [Green Version]
- Cravero, M.C.; Laureati, M.; Spinelli, S.; Bonello, F.; Monteleone, E.; Proserpio, C.; Lottero, M.R.; Pagliarini, E.; Dinnella, C. Profiling individual differences in alcoholic beverage preference and consumption: New insights from a large-scale study. Foods 2020, 9, 1131. [Google Scholar] [CrossRef]
- Pickering, G.J.; Jain, A.K.; Bezawada, R. Segmentation and drivers of wine liking and consumption in US wine consumers. Int. J. Wine Res. 2014, 6, 1–11. [Google Scholar] [CrossRef] [Green Version]
- Ullrich, N.V.; Touger-Decker, R.; O’Sullivan-Maillet, J.; Tepper, B.J. PROP taster status and self-perceived food adventurousness influence food preferences. J. Am. Diet. Assoc. 2004, 104, 543–549. [Google Scholar] [CrossRef] [PubMed]
- Logue, A.W.; Smith, M.E. Predictors of food preferences in adult humans. Appetite 1986, 7, 109–125. [Google Scholar] [CrossRef]
- Boltong, A.; Keast, R.; Aranda, S. Talking about taste: How do oncology clinicians discuss and document taste problems? Cancer Forum. 2011, 35, 81–87. [Google Scholar]
- Prescott, J. Flavour as a psychological construct: Implications for perceiving and measuring the sensory qualities of foods. Food Qual. Prefer. 1999, 10, 349–356. [Google Scholar] [CrossRef]
- Baguley, T. Serious Stats: A Guide to Advanced Statistics for the Behavioral Sciences; Palgrave Macmillan: Basingstoke, UK; New York, NY, USA, 2012; ISBN 9780230577176. [Google Scholar]
- Pickering, G.J.; Jain, A.K.; Bezawada, R. Super-tasting gastronomes? Taste phenotype characterization of foodies and wine experts. Food Qual. Prefer. 2013, 28, 85–91. [Google Scholar] [CrossRef]
- Barbor, T.F.; Higgins-Biddle, J.C.; Saunders, J.B.; Monteiro, M.G. The Alcohol Use Disorders Identification Test Guidelines for Use in Primary Care; World Heath Organization: Geneva, Switzerland, 2001. [Google Scholar]
- Duffy, V.B.; Hayes, J.E.; Sullivan, B.S.; Faghri, P. Surveying food and beverage liking. Ann. N. Y. Acad. Sci. 2009, 1170, 558–568. [Google Scholar] [CrossRef] [PubMed]
- Byrnes, N.K.; Hayes, J.E. Personality factors predict spicy food liking and intake. Food Qual. Prefer. 2013, 28, 213–221. [Google Scholar] [CrossRef] [Green Version]
- Tavakol, M.; Dennick, R. Making sense of Cronbach’s alpha. Int. J. Med. Educ. 2011, 2, 53–55. [Google Scholar] [CrossRef]
- Widaman, K.F.; Little, T.D.; Preacher, K.J.; Sawalani, G.M. On creating and using short forms of scales in secondary research. In Secondary Data Analysis: An Introduction for Psychologists; Trzesniewski, K., Donnellan, M., Lucas, R., Eds.; American Psychological Association: Washington, DC, USA, 2011. [Google Scholar]
- Kim, H.-Y. Statistical notes for clinical researchers: Assessing normal distribution (2) using skewness and kurtosis. Restor. Dent. Endod. 2013, 38, 52. [Google Scholar] [CrossRef] [PubMed]
- Wickham, H. ggplot2: Elegant Graphics for Data Analysis; Springer: New York, NY, USA, 2016; ISBN 9783319242774. [Google Scholar]
- Gignac, G.E.; Szodorai, E.T. Effect size guidelines for individual differences researchers. Personal. Individ. Differ. 2016, 102, 74–78. [Google Scholar] [CrossRef]
- Bartoshuk, L.M.; Duffy, V.B.; Green, B.G.; Hoffman, H.J.; Ko, C.-W.; Lucchina, L.A.; Marks, L.E.; Snyder, D.J.; Weiffenbach, J.M. Valid across-group comparisons with labeled scales: The gLMS versus magnitude matching. Physiol. Behav. 2004, 82, 109–114. [Google Scholar] [CrossRef] [PubMed]
- Field, A. Discovering Statistics Using IBM SPSS Statistics, 4th ed.; SAGE Publications Ltd.: London, UK, 2013. [Google Scholar]
- Kaiser, H.F. An index of factorial simplicity. Psychometrika 1974, 39, 31–36. [Google Scholar] [CrossRef]
- Parr, W.; Mouret, M.; Blackmore, S.; Pelquest-Hunt, T.; Urdapilleta, I. Representation of complexity in wine: Influence of expertise. Food Qual. Prefer. 2011, 22, 647–660. [Google Scholar] [CrossRef]
- Kim, J.H. Multicollinearity and misleading statistical results. Korean J. Anesth. 2019, 72, 558–569. [Google Scholar] [CrossRef] [PubMed] [Green Version]
- Croijmans, I.; Majid, A. Not all flavor expertise is equal: The language of wine and coffee experts. PLoS ONE 2016, 11, e0155845. [Google Scholar] [CrossRef]
- Prescott, J. Multisensory processes in flavour perception and their influence on food choice. Curr. Opin. Food Sci. 2015, 6, 47–52. [Google Scholar] [CrossRef]
- Lawless, H.T.; Heymann, H. Sensory Evaluation of Food: Principles and Practices, 2nd ed.; Springer: New York, NY, USA, 2010. [Google Scholar]
- Jackson, R.S. Wine Science: Principles and Applications, 3rd ed.; Academic Press: Burlington, MA, USA, 2008. [Google Scholar]
- Boateng, G.O.; Neilands, T.B.; Frongillo, E.A.; Melgar-Quiñonez, H.R.; Young, S.L. Best practices for developing and validating scales for health, social, and behavioral research: A primer. Front. Public Health 2018, 6, 149. [Google Scholar] [CrossRef]
- Pickering, G.J. Wine market segmentation and exploitation based on taste phenotypes: Evidence and opportunities. In Proceedings of the International Conference on Innovation and Trends in Wine Management, Dijon, France, 22 June 2012; pp. 1–8. [Google Scholar]
- Pickering, G.J.; Cullen, C.W. The influence of taste sensitivity and adventurousness on genration Y’s liking scores for sparkling wine. In Proceedings of the 4th International Conference of the Academy of Wine Business Research, Siena, Italy, 17–19 July 2008. [Google Scholar]
- Tepper, B.J.; White, E.A.; Koelliker, Y.; Lanzara, C.; D’Adamo, P.; Gasparini, P. Genetic variation in taste sensitivity to 6-n-propylthiouracil and its relationship to taste perception and food selection. Ann. N. Y. Acad. Sci. 2009, 1170, 126–139. [Google Scholar] [CrossRef]
- Yang, Q.; Dorado, R.; Chaya, C.; Hort, J. The impact of PROP and thermal taster status on the emotional response to beer. Food Qual. Prefer. 2018, 68, 420–430. [Google Scholar] [CrossRef]
- Catanzaro, D.; Chesbro, E.; Velkey, A.J. Relationship between food preferences and PROP taster status of college students. Appetite 2013, 68, 124–131. [Google Scholar] [CrossRef]
- Barragán, R.; Coltell, O.; Portolés, O.; Asensio, E.M.; Sorlí, J.V.; Ortega-Azorín, C.; González, J.I.; Sáiz, C.; Fernández-Carrión, R.; Ordovas, J.M.; et al. Bitter, sweet, salty, sour and umami taste perception decreases with age: Sex-specific analysis, modulation by genetic variants and taste-preference associations in 18 to 80 year-old subjects. Nutrients 2018, 10, 1539. [Google Scholar] [CrossRef] [PubMed] [Green Version]
- Michon, C.; O’Sullivan, M.; Delahunty, C.; Kerry, J. The investigation of gender-related sensitivity differences in food perception. J. Sens. Stud. 2009, 24, 922–937. [Google Scholar] [CrossRef]
- World Health Organization. Global Status Report on Alcohol and Health 2018; Poznyak, V., Rekve, D., Eds.; WHO: Geneva, Switzerland, 2018; ISBN 978-92-4-156563-9. [Google Scholar]
- Salvatore, J.E.; Cho, S.B.; Dick, D.M. Genes, environments, and sex differences in alcohol research. J. Stud. Alcohol Drugs 2017, 78, 494–501. [Google Scholar] [CrossRef] [PubMed]
- Spence, C. Do men and women really live in different taste worlds? Food Qual. Prefer. 2019, 73, 38–45. [Google Scholar] [CrossRef]
Figure 1.
Boxplots of Likert scores for the alcohol taste indices (n = 925).

Figure 2.
Mean scores for the alcohol taste indices grouped by frequency of alcohol consumption (monthly or less (n = 132), 2 to 4 times per month (n = 251), 2 to 3 times per week (n = 269), 4 or more times per week (n = 236)). Significantly different means from one-way ANOVA are indicated with different letters.

Figure 3.
Mean scores for the alcohol taste indices grouped by drinks per day when consuming alcoholic beverages (1 or 2, n = 649; 3 or more, n = 239). Significantly different means from t-tests are indicated with different letters.
Figure 3.
Mean scores for the alcohol taste indices grouped by drinks per day when consuming alcoholic beverages (1 or 2, n = 649; 3 or more, n = 239). Significantly different means from t-tests are indicated with different letters.

Figure 4.
Mean scores for the alcohol taste indices grouped by alcohol adventurousness (137 none, 478 low, 464 high). Significantly different means from three-way ANOVAs indicated with different letters.
Figure 4.
Mean scores for the alcohol taste indices grouped by alcohol adventurousness (137 none, 478 low, 464 high). Significantly different means from three-way ANOVAs indicated with different letters.

Figure 5.
Mean scores for the alcohol taste indices grouped by PROP taster status (255 pNT, 459 pMT, 165 pST). Significantly different means from three-way ANOVAs indicated with different letters.
Figure 5.
Mean scores for the alcohol taste indices grouped by PROP taster status (255 pNT, 459 pMT, 165 pST). Significantly different means from three-way ANOVAs indicated with different letters.

Figure 6.
Mean scores for the alcohol taste indices grouped by sex (351 male, 528 female). Significantly different means from three-way ANOVAs indicated with different letters.
Figure 6.
Mean scores for the alcohol taste indices grouped by sex (351 male, 528 female). Significantly different means from three-way ANOVAs indicated with different letters.

Table 1.
Factor loadings for the principal component analysis of the alcohol taste statements after varimax rotation. Bolded values indicate on which factor each statement is most strongly loaded (N = 925; MIC = mean interitem correlation, α = Cronbach’s alpha).
Table 1.
Factor loadings for the principal component analysis of the alcohol taste statements after varimax rotation. Bolded values indicate on which factor each statement is most strongly loaded (N = 925; MIC = mean interitem correlation, α = Cronbach’s alpha).
| Item or Index | Factor | |||||
|---|---|---|---|---|---|---|
| 1 | 2 | 3 | 4 | 5 | 6 | |
| Overall alcohol (α = 0.82, MIC = 0.69) | ||||||
| A1: Alcoholic beverages tend to taste too bitter for me. | 0.260 | 0.097 | 0.267 | 0.294 | 0.706 | 0.020 |
| A2: Alcoholic beverages tend to taste too hot/burn for me. | 0.144 | 0.147 | 0.210 | 0.251 | 0.781 | 0.016 |
| Dry wine (α = 0.79, MIC = 0.48) | ||||||
| A7: Wine tastes too hot/burns for me. | 0.466 | 0.139 | 0.161 | 0.012 | 0.553 | 0.209 |
| A4: Red wine tastes too bitter for me. | 0.836 | 0.044 | 0.090 | 0.147 | 0.232 | 0.018 |
| A5: Red wine tastes too dry for me. | 0.848 | 0.020 | 0.112 | 0.148 | 0.121 | 0.041 |
| A8: Dry white wine tastes too sour for me. | 0.579 | 0.067 | 0.109 | 0.209 | 0.176 | 0.174 |
| Sweet wine | ||||||
| A9: Sweet white wine tastes too sweet for me. | −0.541 | 0.110 | −0.137 | 0.087 | 0.303 | 0.366 |
| Sparkling wine | ||||||
| A6: I don’t like the taste of the carbonation (‘bubbles’) in sparkling wine. | 0.051 | 0.054 | 0.100 | 0.073 | 0.045 | 0.911 |
| Beer (α = 0.83, MIC = 0.55) | ||||||
| A11: Beer tastes too sour for me. | 0.146 | 0.041 | 0.858 | 0.111 | 0.188 | −0.013 |
| A12: Beer tastes too bitter for me. | 0.140 | 0.036 | 0.847 | 0.141 | 0.188 | −0.033 |
| A13: Beer tastes too sweet for me. | −0.036 | 0.109 | 0.667 | 0.005 | 0.243 | 0.081 |
| A14: I don’t like the taste of the carbonation (‘bubbles’) in beer. | 0.081 | 0.015 | 0.735 | 0.111 | −0.077 | 0.381 |
| Spirits (α = 0.88, MIC = 0.79) | ||||||
| A16: Straight spirits (e.g., whisky) taste too hot/burn for me. | 0.096 | −0.006 | 0.060 | 0.893 | 0.169 | 0.031 |
| A17: Straight spirits (e.g., whisky) taste too bitter for me. | 0.143 | 0.043 | 0.160 | 0.896 | 0.146 | 0.060 |
| Complex (α = 0.77, MIC = 0.46) | ||||||
| A3: Alcoholic beverages tend to taste quite complex for me. | 0.003 | 0.817 | −0.019 | 0.046 | 0.263 | 0.012 |
| A10: Wine tends to taste quite complex for me. | 0.043 | 0.833 | −0.066 | −0.054 | 0.111 | 0.039 |
| A15: Beer tends to taste quite complex for me. | 0.008 | 0.711 | 0.451 | 0.062 | −0.127 | 0.041 |
| A18: Spirits tend to taste quite complex for me. | 0.080 | 0.603 | 0.103 | 0.554 | −0.026 | 0.099 |
| Percent (%) of variability explained | 13.6 | 12.9 | 16.0 | 12.3 | 10.5 | 6.7 |
Table 2.
Correlation between alcohol taste statement indices and measures of alcohol consumption by beverage type (overall, white wine, red wine, beer, and spirits). Correlation coefficients (r) are shaded in green and red to highlight significant positive and negative correlations, respectively. Effect sizes were considered small (*), medium (**), or large (***) when absolute r values exceeded 0.1, 0.2, or 0.3, respectively [59]. (NA = “not applicable”).
| Alcohol Taste Index. | White Wine | Red Wine | Beer | Spirits | Overall | |||||
|---|---|---|---|---|---|---|---|---|---|---|
| r | p | r | p | r | p | r | p | r | p | |
| Monthly alcohol consumption (n = 884) | ||||||||||
| Overall alcohol | −0.12 * | 0.001 | −0.17 * | <0.001 | −0.21 ** | <0.001 | −0.22 ** | <0.001 | −0.34 *** | <0.001 |
| Dry wine | −0.07 | 0.040 | −0.40 *** | <0.001 | −0.08 | 0.022 | −0.07 | 0.036 | −0.27 ** | <0.001 |
| Sweet wine | −0.03 | 0.412 | 0.18 * | <0.001 | 0.01 | 0.853 | 0.02 | 0.495 | 0.13 * | <0.001 |
| Sparkling wine | −0.08 | 0.021 | −0.06 | 0.061 | −0.04 | 0.228 | −0.07 | 0.044 | −0.06 | 0.055 |
| Beer | −0.01 | 0.725 | −0.12 * | <0.001 | −0.47 *** | <0.001 | −0.09 | 0.005 | −0.26 ** | <0.001 |
| Spirits | 0.05 | 0.143 | −0.14 * | <0.001 | −0.19 * | <0.001 | −0.38 *** | <0.001 | −0.27 ** | <0.001 |
| Proportion of alcohol consumption (n = 853) | ||||||||||
| Overall alcohol | 0.09 | 0.007 | 0.05 | 0.142 | −0.07 | 0.045 | −0.10 * | 0.003 | NA | |
| Dry wine | 0.15 * | <0.001 | −0.27 ** | <0.001 | 0.08 | 0.023 | 0.09 | 0.007 | NA | |
| Sweet wine | −0.06 | 0.063 | 0.16 * | <0.001 | −0.08 | 0.027 | −0.05 | 0.132 | NA | |
| Sparkling wine | 0.00 | 0.904 | −0.01 | 0.818 | 0.01 | 0.857 | 0.01 | 0.806 | NA | |
| Beer | 0.20 ** | <0.001 | 0.09 | 0.011 | −0.38 *** | <0.001 | 0.05 | 0.120 | NA | |
| Spirits | 0.21 ** | <0.001 | 0.08 | 0.016 | −0.07 | 0.034 | −0.27 ** | <0.001 | NA | |
Table 3.
Correlation between alcohol taste statement indices and self-reported alcoholic beverage liking (red wine, dry wine, sweet wine, fortified wine, beer, spirits). Correlation coefficients (r) are shaded in green and red to highlight significant positive and negative correlations, respectively. Effect sizes were considered small (*), medium (**), or large (***) when absolute r values exceeded 0.1, 0.2, or 0.3, respectively [59]. (NA = “not applicable”).
| Alcohol Taste Index | Self-Reported Liking | |||||||||||
|---|---|---|---|---|---|---|---|---|---|---|---|---|
| Red Wine (n = 904) | Dry White Wine (n = 910) | Sweet Wine (n = 911) | Fortified Wine (n = 883) | Beer (n = 900) | Spirits (n = 905) | |||||||
| r | p | r | p | r | p | r | p | R | p | r | p | |
| Overall alcohol | −0.25 ** | <0.001 | −0.16 * | <0.001 | 0.02 | 0.638 | −0.14 * | <0.001 | −0.28 ** | <0.001 | −0.29 ** | <0.001 |
| Dry wine | −0.58 *** | <0.001 | −0.41 *** | <0.001 | 0.18 * | <0.001 | −0.21 ** | <0.001 | −0.26 ** | <0.001 | −0.22 ** | <0.001 |
| Sweet wine | 0.24 ** | <0.001 | 0.21 ** | <0.001 | −0.51 *** | <0.001 | −0.08 | 0.015 | 0.11 * | 0.001 | 0.02 | 0.530 |
| Sparkling wine | −0.05 | 0.127 | −0.31 *** | <0.001 | −0.19 * | <0.001 | −0.19 * | <0.001 | −0.13 * | <0.001 | −0.15 * | <0.001 |
| Beer | −0.18 * | <0.001 | −0.17 * | <0.001 | 0.04 | 0.180 | −0.19 * | <0.001 | −0.62 *** | <0.001 | −0.23 ** | <0.001 |
| Spirits | −0.24 ** | <0.001 | −0.12 * | <0.001 | 0.00 | 0.968 | −0.22 ** | <0.001 | −0.26 ** | <0.001 | −0.53 *** | <0.001 |
Table 4.
Summary of three-way ANOVAs where alcohol taste indices were the dependent variables and alcohol adventurousness (none, low, high), PROP taster status (pNT, pMT, pST), and sex (male, female) were the independent variables.
Table 4.
Summary of three-way ANOVAs where alcohol taste indices were the dependent variables and alcohol adventurousness (none, low, high), PROP taster status (pNT, pMT, pST), and sex (male, female) were the independent variables.
| Alcohol Taste Index | Model df = 5, 873 | Alcohol Adventurousness df = 2 | PROP Taster Status df = 2 | Sex df = 1 | ||||||||
|---|---|---|---|---|---|---|---|---|---|---|---|---|
| R2 | F | p | F | p | η2p | F | p | η2p | F | p | η2p | |
| Overall alcohol | 0.068 | 12.7 | <0.001 | 25.2 | <0.001 | 0.06 | 2.6 | 0.077 | 0.01 | 4.5 | 0.035 | 0.01 |
| Dry wine | 0.038 | 6.9 | <0.001 | 5.1 | 0.006 | 0.01 | 8.2 | <0.001 | 0.02 | 4.3 | 0.037 | 0.01 |
| Sweet wine | 0.009 | 1.5 | 0.183 | |||||||||
| Sparkling wine | 0.042 | 7.7 | <0.001 | 17.9 | <0.001 | 0.04 | 0.9 | 0.392 | <0.01 | 3.2 | 0.074 | <0.01 |
| Beer | 0.094 | 18.1 | <0.001 | 19.6 | <0.001 | 0.04 | 1.8 | 0.172 | <0.01 | 38.3 | <0.001 | 0.04 |
| Spirits | 0.142 | 28.9 | <0.001 | 17.2 | <0.001 | 0.04 | 3.3 | 0.037 | 0.01 | 85.8 | <0.001 | 0.01 |
Publisher’s Note: MDPI stays neutral with regard to jurisdictional claims in published maps and institutional affiliations. |
© 2021 by the authors. Licensee MDPI, Basel, Switzerland. This article is an open access article distributed under the terms and conditions of the Creative Commons Attribution (CC BY) license (https://creativecommons.org/licenses/by/4.0/).
Share and Cite
MDPI and ACS Style
Pickering, G.J.; Thibodeau, M.K. Self-Rated Aversion to Taste Qualities and the PROP Taster Phenotype Associate with Alcoholic Beverage Intake and Preference. Beverages 2021, 7, 37. https://0-doi-org.brum.beds.ac.uk/10.3390/beverages7020037
AMA Style
Pickering GJ, Thibodeau MK. Self-Rated Aversion to Taste Qualities and the PROP Taster Phenotype Associate with Alcoholic Beverage Intake and Preference. Beverages. 2021; 7(2):37. https://0-doi-org.brum.beds.ac.uk/10.3390/beverages7020037
Chicago/Turabian StylePickering, Gary J., and Margaret K. Thibodeau. 2021. "Self-Rated Aversion to Taste Qualities and the PROP Taster Phenotype Associate with Alcoholic Beverage Intake and Preference" Beverages 7, no. 2: 37. https://0-doi-org.brum.beds.ac.uk/10.3390/beverages7020037
Note that from the first issue of 2016, this journal uses article numbers instead of page numbers. See further details here.