
Systematic Review of Methods Used for Food Pairing with Coffee, Tea, Wine, and Beer


1
Department of Technology and Innovation, University of Southern Denmark, 5230 Odense, Denmark
2
Department of Food Science, University of Copenhagen, 1958 Frederiksberg, Denmark
3
CoffeeMind, 2500 Valby, Denmark
*
Author to whom correspondence should be addressed.
†
Postal address: Future Consumer Lab, Department of Food Science, University of Copenhagen, Rolighedsvej 26, 1958 Frederiksberg, Denmark.
Beverages 2021, 7(2), 40; https://0-doi-org.brum.beds.ac.uk/10.3390/beverages7020040
Submission received: 27 April 2021
/
Revised: 2 June 2021
/
Accepted: 3 June 2021
/
Published: 17 June 2021
(This article belongs to the Special Issue Feature Papers in Sensory Analysis of Beverages Section)
Abstract
:The current article is aimed at systematically reviewing the research methods used for food pairing with coffee, tea, wine, and beer. The primary aim of this review was to elucidate the state-of-the-art methods used for analysing food and beverage pairings with coffee, tea, wine, and beer; secondarily, to identify the basis of the selection criteria; and lastly, the method used to evaluate those pairings. The search was performed in three databases: Web of Science, ScienceDirect, and Scopus. Criteria for inclusion were studies with an experimental design, a descriptive analysis (DA), and/or hedonic consumer analysis of beverage and food pairing. The outcome had to be measured on a hedonic Likert scale, a line scale, a just about right (JAR), or a modified JAR scale or other relevant scale measurement method for the given attribute. A total of 24 studies were included in this review—the majority aimed at finding good food and beverage pairings. Most pairings were based on suggestions from experts on popular/common, similar origin, or quality of beverages and foods. The outcomes were measured in several different scales, precluding a direct comparison. The 24 articles used in this review did not provide a so-called “golden standard” of the pairing method. Only three articles provided a more scientifically based approach to investigate why a food and beverage pairing is perceived as a good match, using aromatic similarity, the primary taste, and the sensation of koku as their experimental factors.
1. Introduction
Food pairing is a well-used concept, yet it is not precisely defined. Food pairing can occur when two foods or a food and a beverage are consumed together, making the sensory experience better than when each is consumed alone [1]. A good pairing match can result of the foods and/or beverages sharing many chemical components [2]. Food paring can further be considered as the fun creative side of cooking [3]. Chefs and sommeliers have their own way of pairing foods in a meal or finding the right wine or beverages to the said meal. After interviewing 10 wine and 10 beer experts, Eschevins et al. [4] identified 15 different common pairing principles, distributed in 4 categories (perceptual, conceptual, affective, and others). Similarly, Spence [5] found 12 different common pairing principles focusing on flavour pairing, distributed in two categories (cognitive/intellectual and perceptual). All those principles are somewhat alike, yet they have different focuses. Those two articles contribute to better understand the mindset behind food and beverage pairings.
Pairing is not only recommended for improving the eating experience. Often, pairings will also be part of a network of interests including, e.g., recommending certain local or luxury beverages. One study found that by recommending a certain wine on the menu, the sale tripled [6]. Harrington and Hammond [7] reported that wine pairing is based on personal preference or on the mantra “it feels good” in many U.S. restaurants. Further, they stress that most pairing recommendations are based on products from the wine industry where, e.g., viticulture, production, and tourism constitute the main activity. Further, pairing wine to food, unlike beer or other beverages, has gained a symbolic meaning of social status, and mainstream consumers would consider that wine is the proper beverage pairing to food [8]. However, in many cultures, food is accompanied by other beverages such as tea or coffee. On the basis of this, would it be possible to arouse the curiosity of consumers and challenge the wine–food pair with other beverages?
Coffee is a beverage often served at the end of a meal, and often together with a sweet dessert. Would it be possible to serve a hot coffee as the beverage to a main course meal? For example, in South America, coffee is served with traditional maize-based meals (e.g., called “huminta” in Bolivia). On this basis, the pairing of coffee with food is a relevant topic, and only a few recommendations can be found online on the popular press, written by chefs [9], coffee producers [10], baristas [11], cheese producers [12], and roasters [13]. Worldwide, especially among the coffee community, it has been a dream for many years that coffee should be generally present in restaurants with the same prestige, handcraft, appreciation, and care alongside the other beverages on the menu. This has been far from occurring yet on a larger scale. Perhaps it is because no one knows how to address the food–coffee pairing subject; no base literature exists, in either the scientific field or from popular literature, and even if this is not the cause of the lack of progress, it is for sure not making the efforts easier. There is a need to investigate if these pairing principles based on wine and beer could also be applied in amended form to coffee. However, the question remains—where to begin? Therefore, this paper explored previous scientific studies on food and beverage pairings in order to map out what pairing and evaluation methods have been used thus far.
1.1. Aim
The aim of this systematic review was to identify scientific literature investigating food and beverage pairing, firstly using only coffee as a beverage. On the basis of this search criteria, we only found two studies. Then, the search was widened to include tea; unfortunately, it also produced the same result. In the end, wine and beer were also included. The intent was to find the basis of the selection criteria of the selected food and beverage pairings and, furthermore, to map the method used to evaluate the pairings.
The objective was as follows: To map previously used food and beverage pairing methods by performing a systematic review of scientific literature available on beverage and food pairings containing coffee, tea, wine, and beer.
1.2. Limitations
A meta-analysis of the articles was not possible due to three main differences. (1) The type of beverage and food tested. (2) The difference in the tasting method. (3) The difference in analytical method and the difference in outcome variables, meaning that the measures were not comparable.
Only the experimental studies that investigated the food–beverage pairings were included. Food–food pairings and other forms of pairing that do not involve an experimental design have been excluded.
2. Method
This systematic review follows PRISMA guidelines [14].
2.1. Literature Search Strategy
The electronic databases Web of Science, ScienceDirect, and Scopus were searched between 28 February and 15 March 2019, with no time restriction. A second search was performed on 2 November 2020, focusing on literature published in 2019 and 2020. The specific search strategy and selection of the search terms was as follows: (beverage*/coffee */tea/wine*/beer* AND food* AND pairing*) and (beverage*/coffee*/tea/wine*/beer* AND pairing*) and (food* AND pairing*) on Web of Science, (beverage/coffee/tea/wine/beer AND food AND pairing) on Science Direct, and (beverage/coffee/tea/wine/beer AND food AND pairing) and (beverage/coffee/tea/wine/beer AND pairing) on Scopus; these were entered, and 1122 hits were obtained. Articles identified through other sources, such as references in the selected articles, were also included, providing a total hit at 1147 articles. The language was restricted to English.
2.2. Inclusion and Exclusion Criteria
The studies included in this review were selected according to the PICOS chart (see Table 1). Furthermore, a list of exclusion criteria was set up in order to maintain as high a quality and integrity of the review as possible.
Exclusion criteria were: (1) Studies that were not in the context of food; (2) studies that did not have the participants physically consume the food; (3) studies that did not involve food–food pairings; (4) studies that did not measure the hedonic liking or preference of the pairing; (5) studies that were not on humans; (6) studies in languages other than English.
2.3. Screening
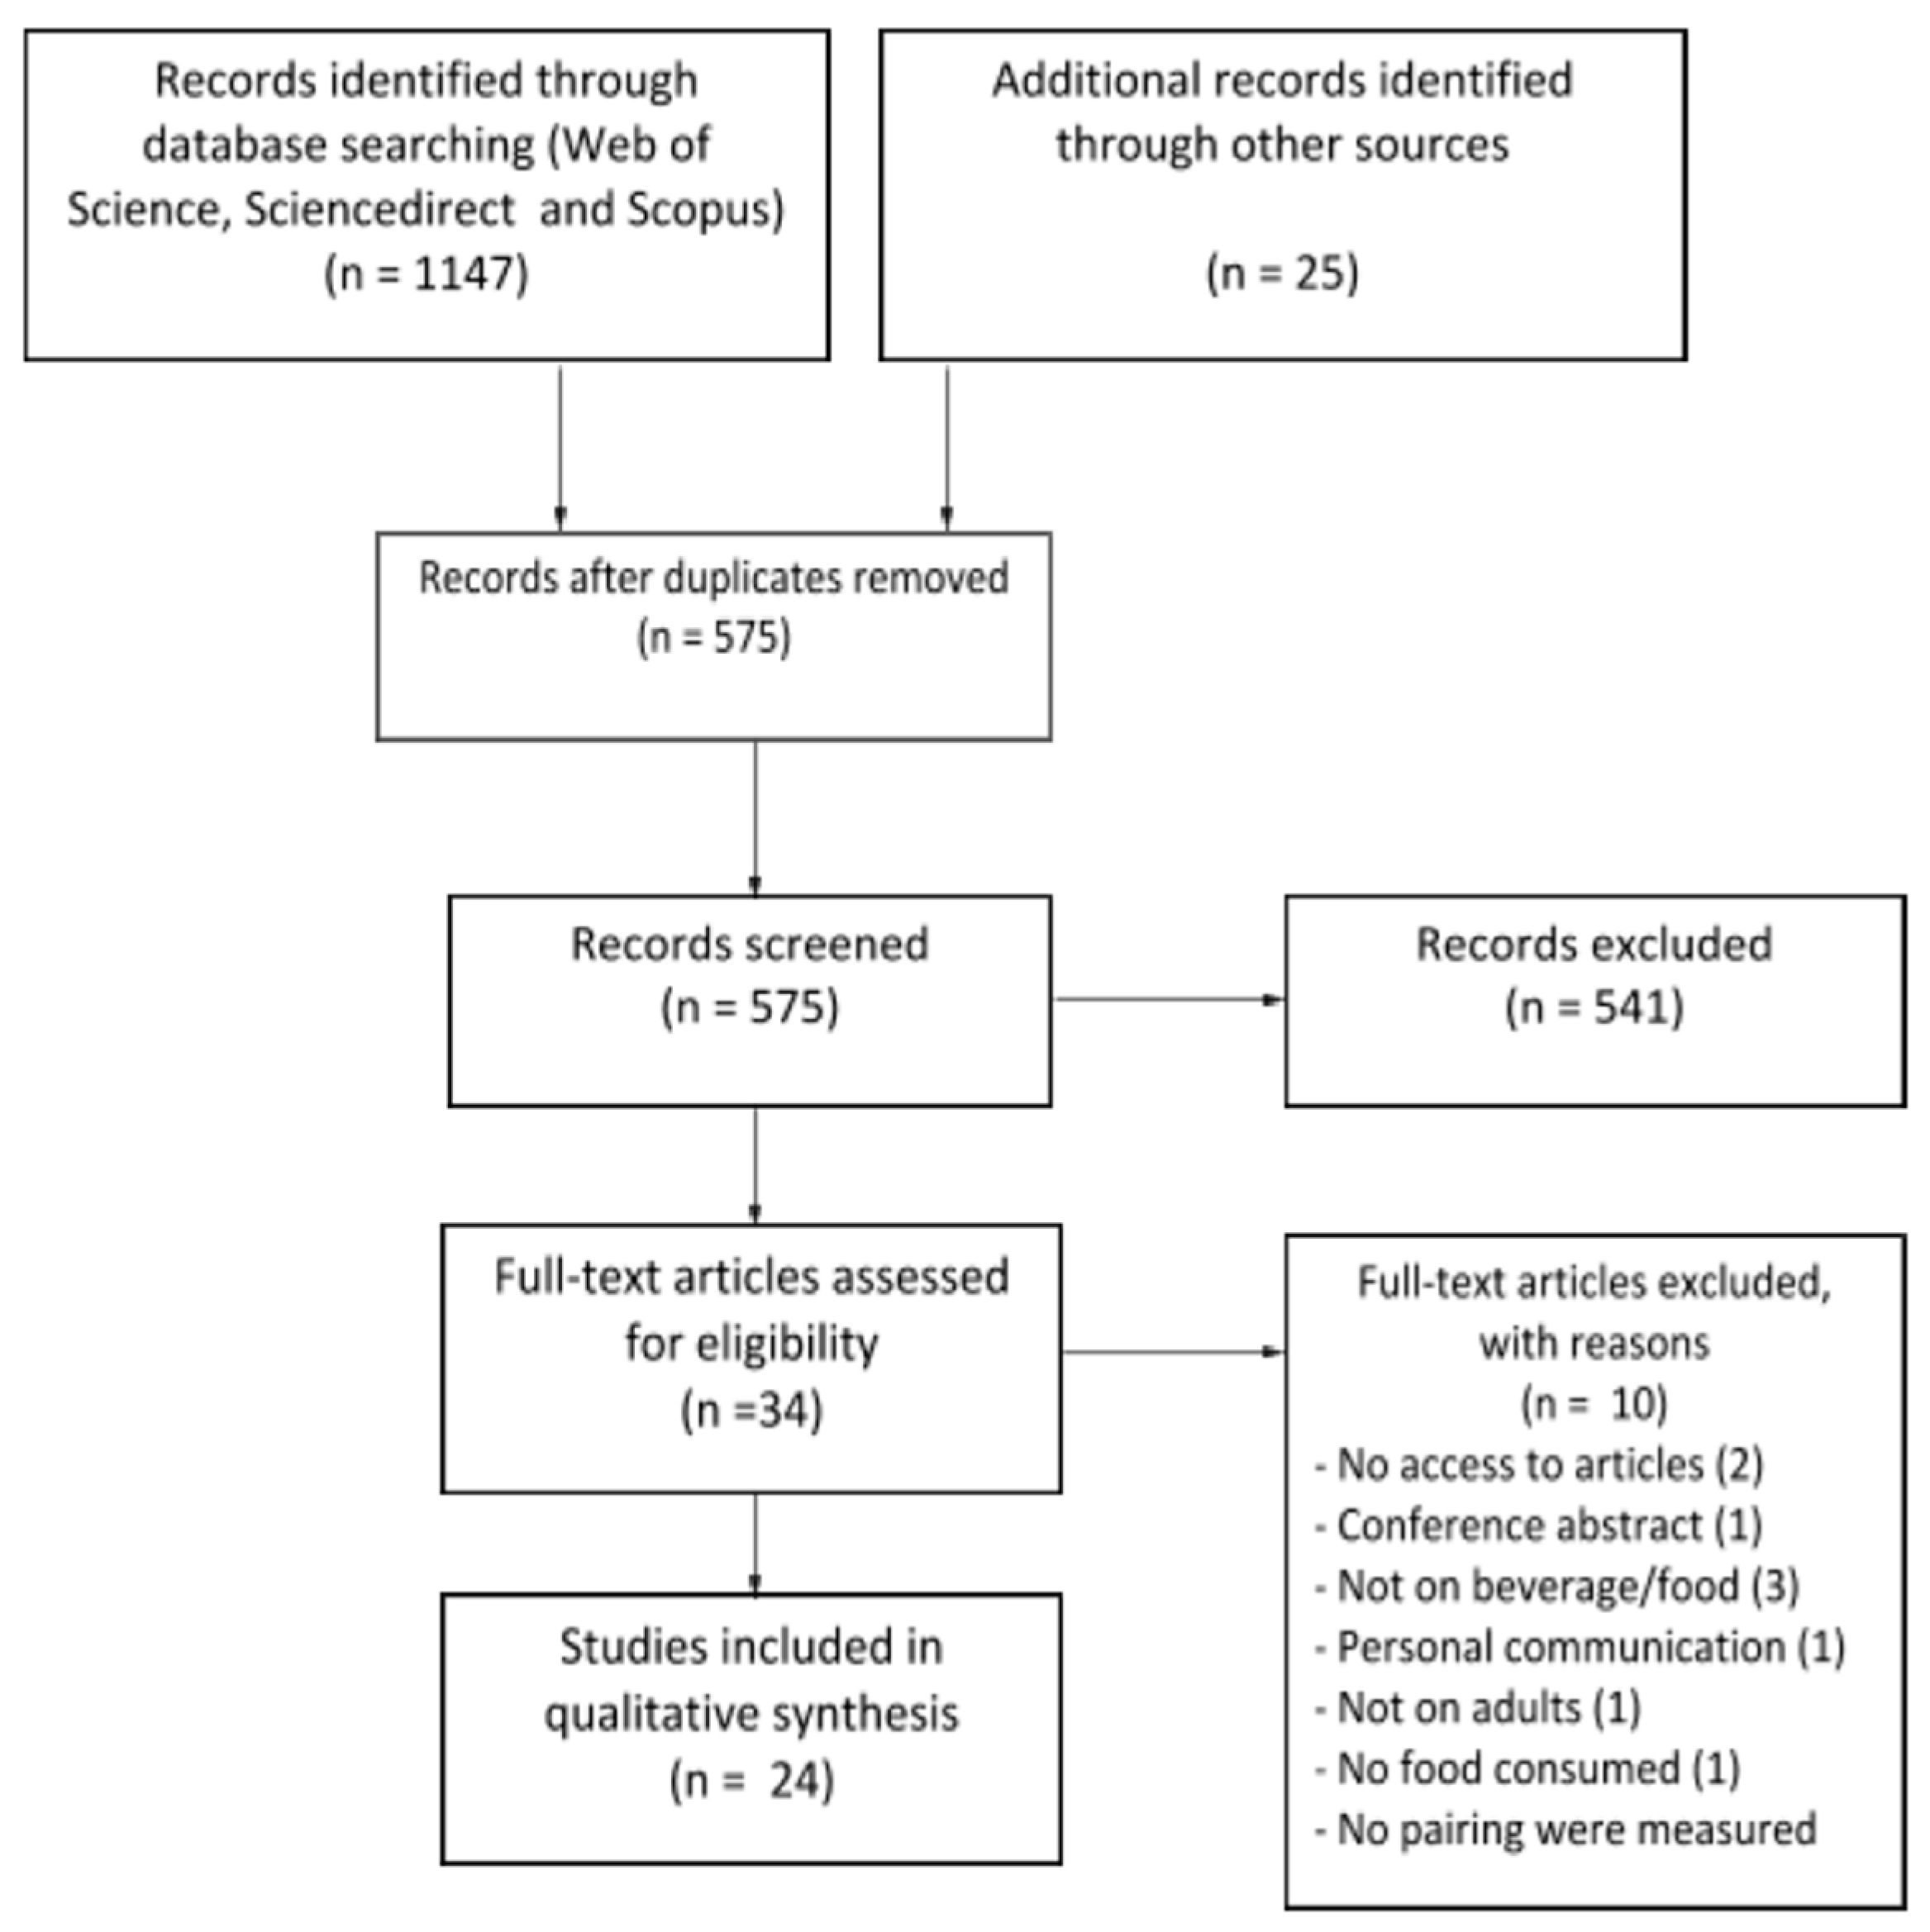
After the removal of duplicates, the remaining articles were screened, and titles that did not fulfil the inclusion criteria were removed. Further screening was conducted by reading the abstract of the remaining articles, and again, articles that did not satisfy the inclusion criteria were removed. Finally, the last screening was conducted by reading each full-text article with a focus on the inclusion criteria. This can be found in Figure 1.
2.4. Data Extraction
In order to extract the relevant information of the selected articles, we created a predetermined extraction grid. The fields were as follows: author, publication year, food and beverage, “why” and selection criteria (“why this study and why this food and beverage”), the number of consumers and/or assessors, tasting method, method, scale use, and main outcome. Furthermore, the table was divided into beverages used in the pairings: coffee, wine, or beer. These data are presented in Table 2.
3. Results
3.1. Selection of Articles and Studies
A total of 1147 articles were obtained. After removing 572 duplicates, we screened 575 article titles for relevant content, providing 77 articles that were further screened on the abstract. Thirty-four full-text articles were read, and 24 of those were included in the systematic review. The screening process can be seen in Figure 1.
3.2. The Findings in the Articles
The majority of the 24 studies wanted to find good food and beverage pairings; however, each had different approaches to achieve their goal. Most of the studies simply looked at finding an ideal match of the tested pairings [7,21,22,24,25,27,28,31,32]. Three studies looked at consumer liking [33,34,35], and two studies wanted to generate general recommendations [15,16]. Four studies looked at the effect of the food on the beverage [19,23,26,29], while two studies looked at the effect of the beverage on the food [20,30]. One study looked at both the impact of food on the beverage and the impact of the beverage on the food [18]. Two studies looked at many different parameters, i.e., liking, harmony, complexity, homogeneity, familiarity, and balance, in order to investigate ideal match [36,37]. Finally, one study looked at the enhancement of koku (thickness, continuity, mouthfulness, and umami) within the food, as well as the dominant attribute of the food after the influence of the beverage [17].
3.3. Food and Beverage Selection Criteria
All 24 studies introduced their articles by mentioning that most of the pairing information was provided by food writers, sommeliers, chefs, and other culinary experts. This information can be found in the popular press, websites, and culinary magazines about the appropriate beverage and food pairings, and all were based on experience and tacit knowledge. Most of the studies also mentioned how very little scientific work could be found in controlled settings about ideal beverage and food pairings or consumer preference affected the liking of a pairing. All studies wanted to fill the gap between the two worlds of experience and science. All studies had different food and beverage selection criteria for their scientific study. Five studies based the pairings on recommendations of wine experts or other so-called classical paintings [21,24,26,27,31]. In close relation to this, two studies wanted to test unusual pairings [19,20], while another two based their beverage selection on what a focus group found suitable [15,16]. Three studies based their pairings on popular or the most sold/common or commercial food and beverages in the area/country [33,34,35]. In addition, seven studies based their pairings by testing products with different levels of content or compounds and different levels of variety or quality [7,18,22,23,28,29,30]. One study based the pairings on finding the ideal match to one cheese with 10 other same-grape-type wine [25]. One study based its pairing on locally grown products sharing the same terroir [32]. One study based the pairings on aromatic similarity [37]. One study based its pairings on basic taste in a soup as an experimental factor [36]. Finally, one study based its pairings on the hypothesis that the beverage would enhance a particular sensation (koku) [17].
3.4. The Evaluation Methods
3.4.1. Panel and/or Consumers to Evaluate the Beverage–Food Pairings
Of the 24 studies, 8 first used a sensory panel to perform a descriptive analysis (DA) on the selected products; consumers then evaluated the products and their pairings [15,16,25,31,33,34,35,36]. Eight of the studies only used a trained panel to perform a DA [7,17,18,19,20,22,23,26]. Eight studies only used consumers to evaluate their pairings [21,24,27,28,29,30,32,37].
3.4.2. Measurements and Scale Use
All studies used different forms of scales to measure the panels and/or consumer’s evaluations, which can also be found in Table 2. Most studies had their panel use some sort of continuous line scale to measure the study relevant describing terms. The attribute intensity was measured using a 9-point anchored scale [15,16,33,34,35], a 100-point scale, [18,19,20], a 10 cm line scale [17,23], and a 15 cm unstructured line scale [25]. The level of the match and ideal match was measured using a 9-point scale [7] and on a 12 cm just about right (JAR) line scale [26]. Other scales were also used to measure more study-specific questions, and these were the measurements of colour, taste, texture, and other key components using a 6.7 continuous line scale [7,22]. Mixed body deviation from the match was measured on a modified JAR scale, ranked from +4 to −4 [22], and temporal dominance of sensations (TDS) to measure dynamic response [17,31]. The consumers were also presented with different scales to measure the liking, ideal match, and more. Consumer liking was measured using a 15 cm [25], a 7-point [31], a 9-point [27,32,34,35,36], and a 15-point [25] Likert scale. Consumer liking was also measured using TDS in mono- and multi-intake [29,32] and TDS in combination with TDL (temporal drivers of liking) [30]. Ideal pairing matches were measured using a 12 cm JAR line scale [21,24,25,26], a modified JAR [31], and a 10 cm line scale [28]. Pair appropriateness was measured using a 9-point Likert scale [33]. The JAR scale was also used to determine which flavour lingered the most [34]. The balance in the pairings was measured using a just about balanced scale (JAB) [36] and on a modified +3 to −3 scale and a +5 to −5 scale [37]. Complexity, harmony, homogeneity, and familiarity were measured using a 9-point scale [36] and a 10-point scale [37].
3.5. The Tasting Methods
Three different tasting methods were used in the 24 studies: mixed, sequential, or TDS in either mono- or multi-intake. Some studies used one of the three tasting methods, while others used two different tasting methods. More information can be found in Table 2 under the tasting method. The mixed tasting method is an assessment with the beverage and food tasted simultaneously, and the sequential tasting method is an assessment when the beverage or food is tasted separately [38]. The TDS method is a multidimensional method that makes it possible to collect temporal data with up to 10 attributes in a complex food during evaluation. All descriptors are presented on the screen the whole time, and the assessor has to evaluate the most dominant sensory perception and then score the intensity of the corresponding attribute. Every time a sensory aspect changes, they have to select it and score the attribute [39].
3.6. Sum of the Main Outcome
The studies showed that liking the individual beverage or food does not necessarily translate into a liked pair. Moreover, a balance between both should be present without one dominating.
Three studies found that the individual liking of the food had an influence on the liking of the pairing [18,27,35], while seven studies found that the individual liking of a beverage influenced the pair liking [15,25,29,30,32,34,36]. A few studies found that the intensity decreased for most attributes and increased for a very few [19,23]. Harrington and Hammond [7] found that the beverage sweetness affected the match, while Koone et al. [28] further found that beverage (wine) sweetness, acidity, and tannin levels all significantly impacted the level of the match with certain food items. Harrington et al. [26] and Eschevins et al. [37] both agreed that the complexity increased the sensation of the match. This lines up with the findings of King and Cliff [21], who found that flavourful food needs a flavourful beverage (wine), as well as the finding of the body-to-body match from Harrington and Hammond [22]. Bastian et al. [24] found that consumers agreed to some extent with the expert’s pairings. Finally, Sato and Kinugasa [17] found that green tea enhanced the sensation of koku (thickness, continuity, mouthfulness, and umami).
4. Discussion in Relevance to Further Studies
Of the 24 studies, only 2 studies involved pairings with coffee [15,16], where the first was a preliminary study of the latter. Having only two papers identified on coffee–food pairing reveals the urgent need for more research on food and beverage pairings with coffee as the beverage focal point. The two studies used one regular coffee and two flavoured coffees (chocolate and vanilla), finding that the pair liking depended more on the coffee liking than the chocolate liking. Food or beverage liking dominated the liking of the pairing, as has been reported elsewhere [15,18,25,27,29,30,32,34,35,36]. Without further explanation other than the pair was well balanced, these studies failed to further explain the why. These findings also indicated that only asking the liking or preference of the pairing alone is insufficient to find an explanation. Further, if the pair is evaluated to be well balanced, it only indicates that one product is not overpowered by the other, indicating that the is a synergistic interaction between the two food samples.
Many of the studies used descriptive analysis to find how the food and beverages affected each other. Those studies did come closer as to why the pairing worked by explaining how the two samples affected each other. Another important finding is that even though the food and beverage sample affected each other, there was no perfect match. Both Bastian et al. [25] and Donadini et al. [34] found that cheese decreased some undesired wine attributes and increased desired attributes, indicating that there might not be perfectly paired specific food and beverages, in this case, cheese and wine, but generalising between the categories would not be possible; the same cheese does not have the same effect on other wines.
Consequently, the experimental designs, evaluation methods, and scales across the studies varied extensively, and the problem encountered was that the studies simply were not comparable at the end.
In the end, the expectation of finding a clear and harmonised food and beverage selection method was not met because all studies used different approaches and performed their study-specific evaluations on what appears to be a random selection of food and beverages. Nine of the studies based their research on expert pairings or consumer-preferred pairings [15,16,21,24,26,27,31] or the opposite in unusual pairings [19,20], while 12 studies based their pairings on a random selection of food and beverages on either popularity, amount sold, local products, or products with different levels of modalities and different levels of variety or quality yet still being randomly selected [7,18,22,23,25,28,29,30,32,33,34,35]. Only three studies used experimental factors in the content of pairings based on aromatic similarity [37], pairings based on basic taste [36], and the enhancement of the sensation of koku [17]. We can conclude that there is no harmonised methodology to assess food and beverage pairings.
The concept of food pairing is gaining popularity and acceptance since Heston Blumenthal, chef of the Fat Duck, made the concept of food pairing known [40]; still, the concept is poorly defined. Food scientists have since then investigated this food pairing concept. All 24 studies tried to find ideal pairings, and all of them concluded that an ideal pairing was composed of a balance between the food and beverage, a good harmony, single product liking, same body, and same intensity. Some even discovered that one product would change the intensity of attributes in the other pairing product, and thus the pairing was either considered better or worse in the context of balance and liking [7,17,19,22,23,28]. The question remains as to what is causing the intensity chance of the attributes. Eschevins et al. [37] looked at the effect of similar aromas and found that aromatic similarity in food and beverage pairings modulates the levels of perceived harmony, homogeneity, and complexity of pairing. This concept is also known as a shared flavour network [2].
Further, in the study of flavour networks, not only did researchers find a chemical explanation in shared flavour components, but also a socio-cultural explanation. They discovered that Western cuisine, in contrast to East Asian cuisine, tends to use ingredients sharing many flavour components. This is very interesting because this means that the perception of a perfect match is both geographically and personally determined. Paulson et al. [36] looked at the effect of the basic tastes as responsible factors as to why perceived harmony, complexity, balance, and more would increase consumer liking. This taste–taste interaction is also a more scientific approach to finding the why. Keast and Breslin [41] previously looked into this concept and found that many aspects influenced the perception of taste, such as the taste quality, in the form of the five basic tastes, together with the intensity and time course of the intensity, playing a major role in the taste perception of foods. They further suggested that there are many possible interactions when two compounds are mixed, wherein one compound either enhances or suppresses the other. Finally, Sato and Kinugasa [17] were very innovative and looked at a Japanese sensation (koku) of enhancement of certain defining attributes. This is a very new approach, and further studies in this direction could provide interesting results.
Returning to coffee, the way in which to select the food items for a pairing is of concern. One approach is to select known food items that are traditionally consumed with coffee, such as cake and chocolate. Some countries consume foods other than sweets with their coffee—in Brazil with cheese buns (Pao de Queijo), and in Mexico with maize-based cookies. The question of interest is still why these foods go well with coffee.
From these findings, it appears that further studies should concentrate on finding the why, and not only the superfluous liking of random selected food and beverage samples. Food pairing using a more scientific approach such as flavour network [2], taste–taste [41], or aroma–taste [42] interactions could contribute a great deal, both in the field of food–food and food–beverage pairing.
5. Conclusions in Relevance to Further Studies
The systematic review resulted in 24 studies, wherein only 2 of them included coffee. No clear indication was given as to why they chose the food (mostly cheese) and beverages (mainly wine and beer). Most of the studies used a random selection of food, and a few based their pairings on experts (chefs, sommeliers, etc.) in making the pairing suggestions.
No single testing nor tasting method was primarily used, and a preferential scale of measurements was also not found. Most of these studies tested the ideal match of the pairings, and they all used different testing methods and evaluation scales.
The first product changes the experience of the subsequent product by changing the attribute intensity. Almost all studies found that both the beverage and the food affected the experience of each other. The causality of these changes is a question of interest; is it the aromas, textures, basic tastes, or even other factors.
In conclusion, the 24 articles used in this review did not provide a so-called “golden standard” of pairing methods. However, three articles provided a more scientifically based approached to investigate why a food and beverage pairing is perceived as a good match.
Author Contributions
Conceptualization, M.M. and C.J.B.R.; methodology, F.J.A.P.-C. and C.J.B.R.; formal analysis, C.J.B.R.; investigation, C.J.B.R.; writing—original draft preparation, C.J.B.R.; writing—review and editing, C.J.B.R. and M.M. and F.J.A.P.-C.; visualization, C.J.B.R.; supervision, F.J.A.P.-C. All authors have read and agreed to the published version of the manuscript.
Funding
The APC was funded by Coffee Mind.
Acknowledgments
This project was a part of a master’s thesis, performed in collaboration between the University of Copenhagen, Section of Design and Consumer and Behaviour, CoffeeMind Acadamy in Copenhagen, and VOL. 1 Roast lab in Kuwait. Special thanks to Nora Al Roumi, founder and CEO of VOL. 1 Roast Lab, who raised the question of coffee and food pairing.
Conflicts of Interest
The authors declare no conflict of interest.
References
- Lahne, J. Evaluation of Meals and Food Pairing. In Methods in Consumer Research; Ares, G., Varela, P., Eds.; Woodhead Publishing: Cambridge, UK, 2018; Volume 2, pp. 85–107. ISBN 9780081017432. [Google Scholar]
- Ahn, Y.-Y.; Ahnert, S.E.; Bagrow, J.P.; Barabási, A.-L. Flavor network and the principles of food pairing. Sci. Rep. 2011, 1, 196. [Google Scholar] [CrossRef] [PubMed]
- de Klepper, M. Food Pairing Theory: A European Fad. Gastronomica 2011, 11, 55–58. [Google Scholar] [CrossRef]
- Eschevins, A.; Giboreau, A.; Julien, P.; Dacremont, C. From expert knowledge and sensory science to a general model of food and beverage pairing with wine and beer. Int. J. Gastron. Food Sci. 2019, 17, 100144. [Google Scholar] [CrossRef]
- Spence, C. Food and beverage flavour pairing: A critical review of the literature. Food Res. Int. 2020, 133, 109124. [Google Scholar] [CrossRef] [PubMed]
- Terrier, L.; Jaquinet, A.-L. Food–Wine Pairing Suggestions as a Risk Reduction Strategy. Psychol. Rep. 2016, 119, 174–180. [Google Scholar] [CrossRef]
- Harrington, R.J.; Hammond, R. The Direct Effects of Wine and Cheese Characteristics on Perceived Match. J. Foodserv. Bus. Res. 2005, 8, 37–54. [Google Scholar] [CrossRef]
- Pettigrew, S.; Charters, S. Consumers’ expectations of food and alcohol pairing. Br. Food J. 2006, 108, 169–180. [Google Scholar] [CrossRef]
- Goodwin, L. How to Pair Coffee with Food. Available online: https://www.thespruceeats.com/pairing-coffee-and-food-765585 (accessed on 16 August 2019).
- Maxespresso Coffee and Dessert: The Perfect Pairing. Available online: http://www.maxespressocoffee.com/en/coffee-and-dessert-the-perfect-pairing/ (accessed on 16 August 2019).
- Jocelyn Girl Scout Cookies & Coffee Pairings. Available online: http://themodernbarista.com/index.php/2017/03/06/girl-scout-cookies-coffee-pairings/ (accessed on 16 August 2019).
- Coghlan, M. Pairings: Coffee and Cheese. Available online: https://www.freshcup.com/coffee-and-cheese/ (accessed on 16 August 2019).
- LeMay, S. Coffee Pairings. Available online: https://www.northstarroast.com/coffee-pairing/ (accessed on 16 August 2019).
- Shamseer, L.; Moher, D.; Clarke, M.; Ghersi, D.; Liberati, A.; Petticrew, M.; Shekelle, P.; Stewart, L.A. Preferred reporting items for systematic review and meta-analysis protocols (PRISMA-P) 2015: Elaboration and explanation. BMJ Br. Med. J. 2015, 349, g7647. [Google Scholar] [CrossRef] [Green Version]
- Donadini, G.; Fumi, M.D.; Lambri, M. The hedonic response to chocolate and beverage pairing: A preliminary study. Food Res. Int. 2012, 48, 703–711. [Google Scholar] [CrossRef]
- Donadini, G.; Fumi, M. An investigation on the appropriateness of chocolate to match tea and coffee. Food Res. Int. 2014, 63, 464–476. [Google Scholar] [CrossRef]
- Sato, K.; Kinugasa, H. Influence of Japanese green tea on the Koku attributes of bonito stock: Proposed basic rules of pairing Japanese green tea with Washoku. J. Sens. Stud. 2019, 34, 1–13. [Google Scholar] [CrossRef]
- Nygren, I.; Gustafsson, I.; Haglund, Å.; Johansson, L.; Noble, A. Flavor changes produced by wine and food interactions: Chardonnay wine and hollandaise sauce. J. Sens. Stud. 2001, 16, 461–470. [Google Scholar] [CrossRef]
- Nygren, I.T.; Gustafsson, I.-B.; Johansson, L. Perceived flavour changes in white wine after tasting blue mould cheese. Food Serv. Technol. 2002, 2, 163–171. [Google Scholar] [CrossRef]
- Nygren, I.T.; Gustafsson, I.-B.; Johansson, L. Perceived flavour changes in blue mould cheese after tasting white wine. Food Serv. Technol. 2003, 3, 143–150. [Google Scholar] [CrossRef]
- King, M.; Cliff, M. Evaluation of ideal wine and cheese pairs using a deviation-from-ideal scale with food and wine experts. J. Food Qual. 2005, 28, 245–256. [Google Scholar] [CrossRef]
- Harrington, R.J.; Hammond, R. Body Deviation-from-Match. J. Culin. Sci. Technol. 2006, 5, 51–69. [Google Scholar] [CrossRef]
- Madrigal-Galan, B.; Heymann, H. Sensory effects of consuming cheese prior to evaluating red wine flavor. Am. J. Enol. Vitic. 2006, 57, 12–22. [Google Scholar]
- Bastian, S.; Payne, C.; Perrenoud, B.; Joscelyne, V.; Johnson, T. Comparisons between Australian consumers’ and industry experts’ perceptions of ideal wine and cheese combinations. Aust. J. Grape Wine Res. 2009, 15, 175–184. [Google Scholar] [CrossRef]
- Bastian, S.E.; Collins, C.; Johnson, T.E. Understanding consumer preferences for Shiraz wine and Cheddar cheese pairings. Food Qual. Prefer. 2010, 21, 668–678. [Google Scholar] [CrossRef]
- Harrington, R.J.; McCarthy, M.; Gozzi, M. Perceived Match of Wine and Cheese and the Impact of Additional Food Elements: A Preliminary Study. J. Foodserv. Bus. Res. 2010, 13, 311–330. [Google Scholar] [CrossRef]
- Harrington, R.J.; Seo, H.-S. The Impact of Liking of Wine and Food Items on Perceptions of Wine–Food Pairing. J. Foodserv. Bus. Res. 2015, 18, 489–501. [Google Scholar] [CrossRef]
- Koone, R.; Harrington, R.J.; Gozzi, M.; McCarthy, M. The role of acidity, sweetness, tannin and consumer knowledge on wine and food match perceptions. J. Wine Res. 2014, 25, 158–174. [Google Scholar] [CrossRef]
- Galmarini, M.V.; Loiseau, A.-L.; Visalli, M.; Schlich, P. Use of Multi-Intake Temporal Dominance of Sensations (TDS) to Evaluate the Influence of Cheese on Wine Perception. J. Food Sci. 2016, 81, S2566–S2577. [Google Scholar] [CrossRef] [PubMed]
- Galmarini, M.V.; Debreyer, D.; Visalli, M.; Schlich, P.; Loiseau, A.-L. Use of Multi-Intake Temporal Dominance of Sensations (TDS) to Evaluate the Influence of Wine on Cheese Perception. J. Food Sci. 2017, 82, 2669–2678. [Google Scholar] [CrossRef] [PubMed]
- Nygren, T.; Nilsen, A.N.; Öström, Å. Dynamic changes of taste experiences in wine and cheese combinations. J. Wine Res. 2017, 28, 1–18. [Google Scholar] [CrossRef]
- Galmarini, M.V.; Dufau, L.; Loiseau, A.-L.; Visalli, M.; Schlich, P. Wine and Cheese: Two Products or One Association? A New Method for Assessing Wine-Cheese Pairing. Beverages 2018, 4, 13. [Google Scholar] [CrossRef] [Green Version]
- Donadini, G.; Spigno, G.; Fumi, M.D.; Pastori, R. Evaluation of Ideal Everyday Italian Food and Beer Pairings with Regular Consumers and Food and Beverage Experts. J. Inst. Brew. 2008, 114, 329–342. [Google Scholar] [CrossRef]
- Donadini, G.; Fumi, M.D.; Lambri, M. A preliminary study investigating consumer preference for cheese and beer pairings. Food Qual. Prefer. 2013, 30, 217–228. [Google Scholar] [CrossRef]
- Donadini, G.; Fumi, M.; Newby-Clark, I. An investigation of matches of bottom fermented red beers with cheeses. Food Res. Int. 2015, 67, 376–389. [Google Scholar] [CrossRef]
- Paulsen, M.T.; Rognså, G.H.; Hersleth, M. Consumer perception of food–beverage pairings: The influence of unity in variety and balance. Int. J. Gastron. Food Sci. 2015, 2, 83–92. [Google Scholar] [CrossRef] [Green Version]
- Eschevins, A.; Giboreau, A.; Allard, T.; Dacremont, C. The role of aromatic similarity in food and beverage pairing. Food Qual. Prefer. 2018, 65, 18–27. [Google Scholar] [CrossRef]
- Nygren, I.T.; Gustafsson, I.; Johansson, L. Effects of tasting technique–sequential tasting vs. mixed tasting–on perception of dry white wine and blue mould cheese. Food Serv. Technol. 2003, 3, 61–69. [Google Scholar] [CrossRef]
- Pineau, N.; Schlich, P.; Cordelle, S.; Mathonnière, C.; Issanchou, S.; Imbert, A.; Rogeaux, M.; Etiévant, P.; Köster, E. Temporal Dominance of Sensations: Construction of the TDS curves and comparison with time–intensity. Food Qual. Prefer. 2009, 20, 450–455. [Google Scholar] [CrossRef]
- Blumenthal, H. The Fat Duck Cookbock; Bloomsbury Puplishing Plc: London, UK, 2009. [Google Scholar]
- Keast, R.S.J.; Breslin, P.A.S. An overview of binary taste–taste interactions. Food Qual. Prefer. 2003, 14, 111–124. [Google Scholar] [CrossRef] [Green Version]
- Niimi, J.; Eddy, A.I.; Overington, A.R.; Heenan, S.P.; Silcock, P.; Bremer, P.J.; Delahunty, C.M. Aroma–taste interactions between a model cheese aroma and five basic tastes in solution. Food Qual. Prefer. 2014, 31, 1–9. [Google Scholar] [CrossRef]
Figure 1.
The PRISMA (Preferred Reporting Items for Systematic Reviews and Meta-Analyses) diagram showing the screening process (http://www.prisma-statement.org, accessed on 11 February 2019).
Figure 1.
The PRISMA (Preferred Reporting Items for Systematic Reviews and Meta-Analyses) diagram showing the screening process (http://www.prisma-statement.org, accessed on 11 February 2019).


Table 1.
Inclusion criteria used for eligibility.
| PICOS | Study Characteristics |
|---|---|
| Population: | Participants had to be performed on adults |
| Intervention: | The intervention had to apply a form of a pairing of a beverage and a food item |
| Comparison: | Not possible |
| Outcomes: | The outcomes were measured on a hedonic Likert scale, a line scale, a JAR or modified JAR scale, or other relevant scale measurement methods for the given attribute |
| Study design: | The intervention had to be based on an experimental design, a descriptive analysis (DA), or a consumer study |
Table 2.
Characteristics for the included studies.
| Authors | Food and Beverage | Why and Selection Criteria | Tasting Method | N Participants | Method and Scale Use | Main Outcome |
|---|---|---|---|---|---|---|
| COFFEE/TEA | ||||||
| [15] | 3 chocolate vs. 18 beverage | To create a general recommendation. Chocolate with differing cacao %. Focus group selected beverages. | mixed | n = 14 (experienced assessors) n = 80 (regular chocolate consumers) | Sensory: DA on chocolate and beverages. Intensity rating of attributes on 9-point anchored scales. Hedonic: Liking of chocolate and beverage individually rated on a 9-point hedonic Likert scale. Dominance or match on the pairings using a JAR 12 cm line-scale. | The chocolate/beverage pair liking depended more on the beverage liking than the chocolate liking and the level of the match. |
| [16] | 3 coffee, 4 tea vs. 3 chocolate | Coffee/tea match for chocolate. | mixed | n = 8 (experienced assessors) n = 80 (regular chocolate consumers) | Sensory: DA on chocolate and beverages. Intensity rating of attributes on 9-point anchored scales. Hedonic: Liking of chocolate and beverage individually rated on a 9-point hedonic Likert scale. Dominance or match on the pairings using a JAR 12 cm line-scale. | When chocolate/beverage pairing was balanceed, it was perferred by consumers. With one of the two dominating the pairing, there was a decrease in acceptance, and most when chocolate dominated. A liked chocolate and a liked beverage do not score high in pair liking. |
| [17] | 2 green tea vs. 1 soup (bonito stock) | The influence of green tea on the sensory perception of Japanese food. | sequential temporal dominance of sensations (TDS) | n = 16 (trained assessors) n = 12 (trained assessors) | Sensory: DA on the intensity of the koku attributes of the soup 10 cm line scale after the influence of the soup. TDS: Evacuation of the attribute dominance of the attributes found in the soup. | The green tea enhanced Koku attributes (thickness, continuity, mouthfulness, and umami intensity). However, it was suppressed when the tea was too astringent. Green tea changed the dominant perception of the soup attributes. |
| WINE | ||||||
| [18] | 2 hollandaise sauce vs. 3 chardonnay | Based on a previous study on the sauce. | sequential | n = 10 (students were trained) | Sensory: DA on wine and sauce. The intensity of the describing wine and sauce attributes were rated in triplicate to measure the effect of sauce on wine and wine on the sauce, using a 100-point scale | The effect of sauce on wine was more significant. |
| [19] | 5 dry white wines vs. 2 blue cheese | Unusual combination. The cheese was local, and wine was chosen from a dry wine assortment. | sequential | n = 9 (trained assessors) | Sensory: DA on wine and cheese. The intensity of the describing wine and cheese attributes were rated in triplicates to measure the effect of cheese on wine (wine–cheese–wine), using a 100-point scale. | Most of the attributes of the wines studied, such as apple, citrus, and oak flavors, and sour taste, decreased, whereas others remained unchanged. |
| [20] | 2 blue cheese vs. 5 dry white wines | Unusual combination. The cheese was local, and wine was chosen from a dry wine assortment. | sequential | n = 9 (trained assessors) | Sensory: DA on wine and cheese. The intensity of the describing wine and cheese attributes were rated in triplicates to measure the effect of wine on cheese (cheese–wine–cheese) using a 100 point scale. | Most of the pronounced characteristics of the two blue mold cheeses, such as the buttery, woolly, and basement-like flavors of one cheese and the sourness and saltiness of the other, scored lower after the tasting of dry white wine. |
| [21] | 9 cheeses vs. 18 wines (6 white, 6 red, and 6 specialty wines) | This paring dates back to 6000 BC. Award-winning cheese and wine selected by a wine expert. | mixed | n = 27 (8 restaurateurs and 19 wine industry personnel) | The judges evaluated the pairing to find a match or a domination wine/cheese using a JAR 12 cm line-scale. | Wine and cheese are comparable food pairings. A little better with white wine with the used cheeses. The stronger, more flavorful cheeses were more difficult to pair with the wines but were more likely to be a good match for the late harvest and ice wines than other milder cheeses. |
| [7] | 6 wines vs. 4 cheeses | Wine selection due to variety on quality and cheese represented different types. | sequential and mixed | n = 13 (trained panel of undergraduate students and faculty) | DA: characteristics: Wine: color, taste, texture, and other aspects. Cheese: level of the key components, texture, and flavors. This was measured individual on a 6.7 cm continuous scale. Then, the level of the match (mixed) was measured on a 9-point scale (1 = no match, 9 = synergistic match). | The overall level of sweetness in wine impacted the perceived match across all cheeses. Additional relationships varied by cheese. The impact of the food elements present in four cheese types and the match for the six wines were non-significant in the overall test. Significant relationships were shown for cheese sweetness level, spiciness level, and the overall body of the cheese. |
| [22] | 4 wines vs. 3 dishes (chicken, pork, beef) | Different levels of the match, body to body match. Wine: different levels of tannins and body. Food: different levels of fattiness and body. | sequential and mixed | n = 8 (members of a trained panel) | DA: Wines: level of tannin, alcohol, and body. Foods: level of fattiness and body. This was measured individual on a 6.7 cm line-scale. Level of the match ranked on a 9-point scale. Mixed body deviation from the match, ranked from +4 to −4 (+4 food and −4 wine dominated). Sequential body deviation from the match and food fattiness minus tannins were both measured on a 6.7 cm line scale. | Body to body match is a significant predictor of the overall predicted match. The sequential method was a significant predictor of the overall predicted match. |
| [23] | 8 wines vs. 8 cheeses | Wine flavor is influenced by a variety of cheeses. Wine: different varieties. Cheese: soft, medium, hard, and blue. | sequential | n = 11 (students—was trained) | DA: Describing terms of wine. Intensity measurements of the attributes using a 10 cm unstructured line scale unanchored. (wine–cheese–wine). | The cheese had a significant effect on red wine flavor. Astringency, bell pepper, and oak flavor decreased, and the butter flavor increased by cheese. |
| [24] | 7 wines vs. 8 chesses | Evaluation of wine and cheese combination, suggested by industry experts. | mixed | n = 46 (wine and cheese consumers) | The consumers evaluated the ideal pairing using a JAR 12 cm line scale using. | Consumers agreed with an expert on six out of eight pairings. |
| [25] | 10 shiraz vs. 1 cheddar cheese | To find the best shiraz match to one cheddar cheese. | mixed | n = 7 (assessors) n = 54 (wine and cheese consumers) n = 22 (wine experts) | DA: of the wine properties. Attributes were intensity rated on an unstructured 15 cm line scale. Consumer and experts: evaluated the hedonic liking of the wines on a 15 cm Likert scale. Then, the match on a 12 cm JAR scale. Experts: also rated the wines on a 20-point quality scale. | Wine domination of the cheese did not appear to drive the preference for wine and cheese pairs; instead, it seemed driven by an overall preference for the wine alone. The consumer most liked pairing contained expert top quality rated wines, and the least liked pairings contained expert low quality rated wine. |
| [26] | 5 cheeses vs. 6 wines + 3 food elements | To find the impact of additional food on wine–cheese match perception. Based on expert matches. | sequential and mixed | n = 14 (industry professionals) | The pairings were evaluated on a 12 cm deviation from the match scale (JAR) in order to find whether the cheese or wine dominated or had a match. Both on the cheese/wine pairings and on the cheese/food/wine pairings. | The addition of food items generally improved the sensation of the match, and only in one pairing was it statistically lower. |
| [27] | 2 wines vs. 2 food items (goat cheese and chocolate) | To find match level perceptions of classic food–wine pairings against non-classical food–wine pairings. | not described | n = 79 (students) | The wine, food, and pairings were evaluated on a 9-point Likert scale. | Three of the four wine–food combinations had positive direct relationships among wine liking, food liking, or both on the liking level of the wine–food combination when tasted together. |
| [28] | 4 wines vs. 4 foods (goat cheese, brie, salami, and milk chocolate) | To find matches of different wines and food on the basis of the impact of wine sweetness, acidity, and tannin. To find the match based on expertise. | mixed | n = 248 (consumers with different level of wine expertise) | Each questing on the ideal match was rated at a 10 cm long line scale. Wines were evaluated from light to heavy with all foods (no further details on this). Then, there was an evaluation on a mixed tasting and answering the perception of the match. | Wine sweetness, acidity, and tannin levels all significantly impacted the level of match with certain food items. |
| [29] | 4 cheeses vs. 4 wines | The perception of the wine before and after cheese. Using comitial wine and cheese. | TDS | n = 31 (wine and cheese consumers) | Evaluation of the wine alone over three consecutive sips. The evaluation of the wine with consumption of cheese between the three sips. | How wine perception evolved over sips. Cheese intake in between wine sips changed the dynamic characterisation of wines. None of the four cheeses included in this study had a negative impact on wine liking. Liking of wine was either improved or remained the same after cheese intake. |
| [30] | 4 cheeses vs. 4 wines | The perception of the cheese before and after wine. Using comitial wine and cheese. | TDS | n = 31 (wine and cheese consumers) | Evaluation of the cheese alone over three consecutive bites. The evaluation of the cheese with consumption of wine between the three bites. | The impact of wine on cheese perception did not translate into changes in liking. Cheeses changed less from wine to wine than wines did from cheese to cheese. This would reveal that the choice of wine would be more critical when pairing cheese and wine because it is wine perception that is more likely to be changed. |
| [31] | 5 wine vs. 2 cheese | Explore wine and cheese liking and find match or domination—understanding of liking and dynamic taste experience. | TDS and mixed | n = 8 (students and staff) n = 45 (wine consumers) | Panel: TDS was measured on the cheese, wine, and the pairing in replicates. Consumer: At a restaurant setting. The cheese was served before dessert, during a five-course meal. They rated dominance on the JAR scale (+3 to −3), then pair liking on a hedonic 7 point scale. | The TDS evaluation method makes it possible to obtain dynamic information about the process of eating a meal and to understand more of the relationship between consumer liking and dynamic taste experience. |
| [32] | 3 wines vs. 3 cheeses | Find dominating attributes of the dynamic liking of cheese, wine, and the pairing. Same terroir products. | TDS and temporal drivers of liking (TDL) | n = 60 (consumer) | Cheese and wine were individually evaluated using mono-intake TDS and with hedonic liking (discrete 9-point hedonic scale). Then the combination was evaluated by multi-bite and multi-sip TDS. | Changes in the dynamic perception had a larger impact on the liking of wine compared to cheese. It was observed that the dynamic sensory perception had a more important impact on liking in wine–cheese combinations than when consumed separately. |
| BEER | ||||||
| [33] | 18 beer vs. 9 dishes of Italian cuisine | Characteristics of beer and food harmonically complement each other. Beer: availability and variety. Food: popular Italian dishes. | mixed | n = 7 (trained assessors) n = 51 (consumer) n = 7 (food experts) | DA: sensory profile of the beers and the dishes. Level of the match using a 9-point Likert scale of appropriateness. | Most of the dishes were poor complements to the beers selected for this study, but some interesting pairings were found. There was an ideal pair where the combination was more liked than the beer/food alone, and neither the beer nor food dominated. |
| [34] | 4 cheese vs. 4 beers | Hedonic response in natural consumption environment. Beer: different styles and most sold. Cheese: availability and different profiles. | mixed | n = 7 (trained assessors) n = 80 (beer and cheese consumers) | DA: sensory profile of cheese and bees alone and with one of the cheeses. Each beer and cheese and pair were scored on a 9-point hedonic scale. Each pairing was rated on a JAR to determine which flavor (beer/cheese) lingered the most. | Cheese/beer pairing preference depended on beer preference more than on cheese preference, cheese-type, beer type, and flavor dominance. |
| [35] | 8 beers vs. 7 cheeses | Hedonic response to beer and cheese pairings in the social environment and the effect of cheese on beer. Beer: most sold. Cheese: most eaten. | mixed | n = 8 (trained assessors) n = 96 (cheese and beer consumers) | DA: Beers: attributes were rated on a 9-point horizontal line. Cheese: attributes were rated on a 9-point line (different anchor words). Hedonic: Liking of beer and cheese individually and liking of the pairs on a 9-point hedonic Likert scale. | Consumers did not simply enjoy a combination of their most preferred beer and cheese. They identified some flavors that harmonise better than do others. Moreover, significant correlations between mean liking scores and sensory characteristics of the 56 pairings were found. The beer flavor was primarily modified by prior cheese consumption. Pairing liking was found to depend on the type of cheese. |
| [36] | DA: 2 beer vs. 6 soups; hedonic: 2 beer and 3 soups | Consumer liking of harmony, complexity, and balance of pairings. Basic taste as experimental factors. | mixed | n = NS (trained panel) n = 80 (students) | DA: on the beers and the soup and the pairings. Hedonic: liking, harmony, and complexity on 9-point scales with different anchor words. Balanced on a modified 5-point JAB scale to find a match or dominance. First on the beer and soup individual, then on the pairings. | The results demonstrated that perceived balance and the concept of “unity in variety” play essential roles in the consumer perception of pairings. Results from the consumer study showed significant effects of beer type on liking. |
| [37] | Lemon syrup soft drink and flavored dairy product + beers and savory verrines | Investigate how aromatic similarity modulates consumer judgment of pairings. | mixed | n = 53 n = 47 (both volunteer consumers) | Pairings were evaluated by first taking a sip of the drink, then a spoonful food product, and finally another sip of the drink and a spoonful of food product before assessing the liking, harmony, homogeneity, familiarity, and complexity. Balance was scored on a +3 to −3 scale and a +5 to −5 scale. The rest was scored on a 10 point scale. | The results demonstrate that aromatic similarity in food and beverage pairings modulates the levels of perceived harmony, homogeneity, and complexity of pairing. The liking of the individual food seems to be an influential determinant of pairing choices. However, aromatic similarity, by enhancing the perceived harmony and modulating perceived complexity, also contributes to the hedonic judgment of the pairing. |
Publisher’s Note: MDPI stays neutral with regard to jurisdictional claims in published maps and institutional affiliations. |
© 2021 by the authors. Licensee MDPI, Basel, Switzerland. This article is an open access article distributed under the terms and conditions of the Creative Commons Attribution (CC BY) license (https://creativecommons.org/licenses/by/4.0/).
Share and Cite
MDPI and ACS Style
Rune, C.J.B.; Münchow, M.; Perez-Cueto, F.J.A. Systematic Review of Methods Used for Food Pairing with Coffee, Tea, Wine, and Beer. Beverages 2021, 7, 40. https://0-doi-org.brum.beds.ac.uk/10.3390/beverages7020040
AMA Style
Rune CJB, Münchow M, Perez-Cueto FJA. Systematic Review of Methods Used for Food Pairing with Coffee, Tea, Wine, and Beer. Beverages. 2021; 7(2):40. https://0-doi-org.brum.beds.ac.uk/10.3390/beverages7020040
Chicago/Turabian StyleRune, Christina J. Birke, Morten Münchow, and Federico J. A. Perez-Cueto. 2021. "Systematic Review of Methods Used for Food Pairing with Coffee, Tea, Wine, and Beer" Beverages 7, no. 2: 40. https://0-doi-org.brum.beds.ac.uk/10.3390/beverages7020040
Note that from the first issue of 2016, this journal uses article numbers instead of page numbers. See further details here.