
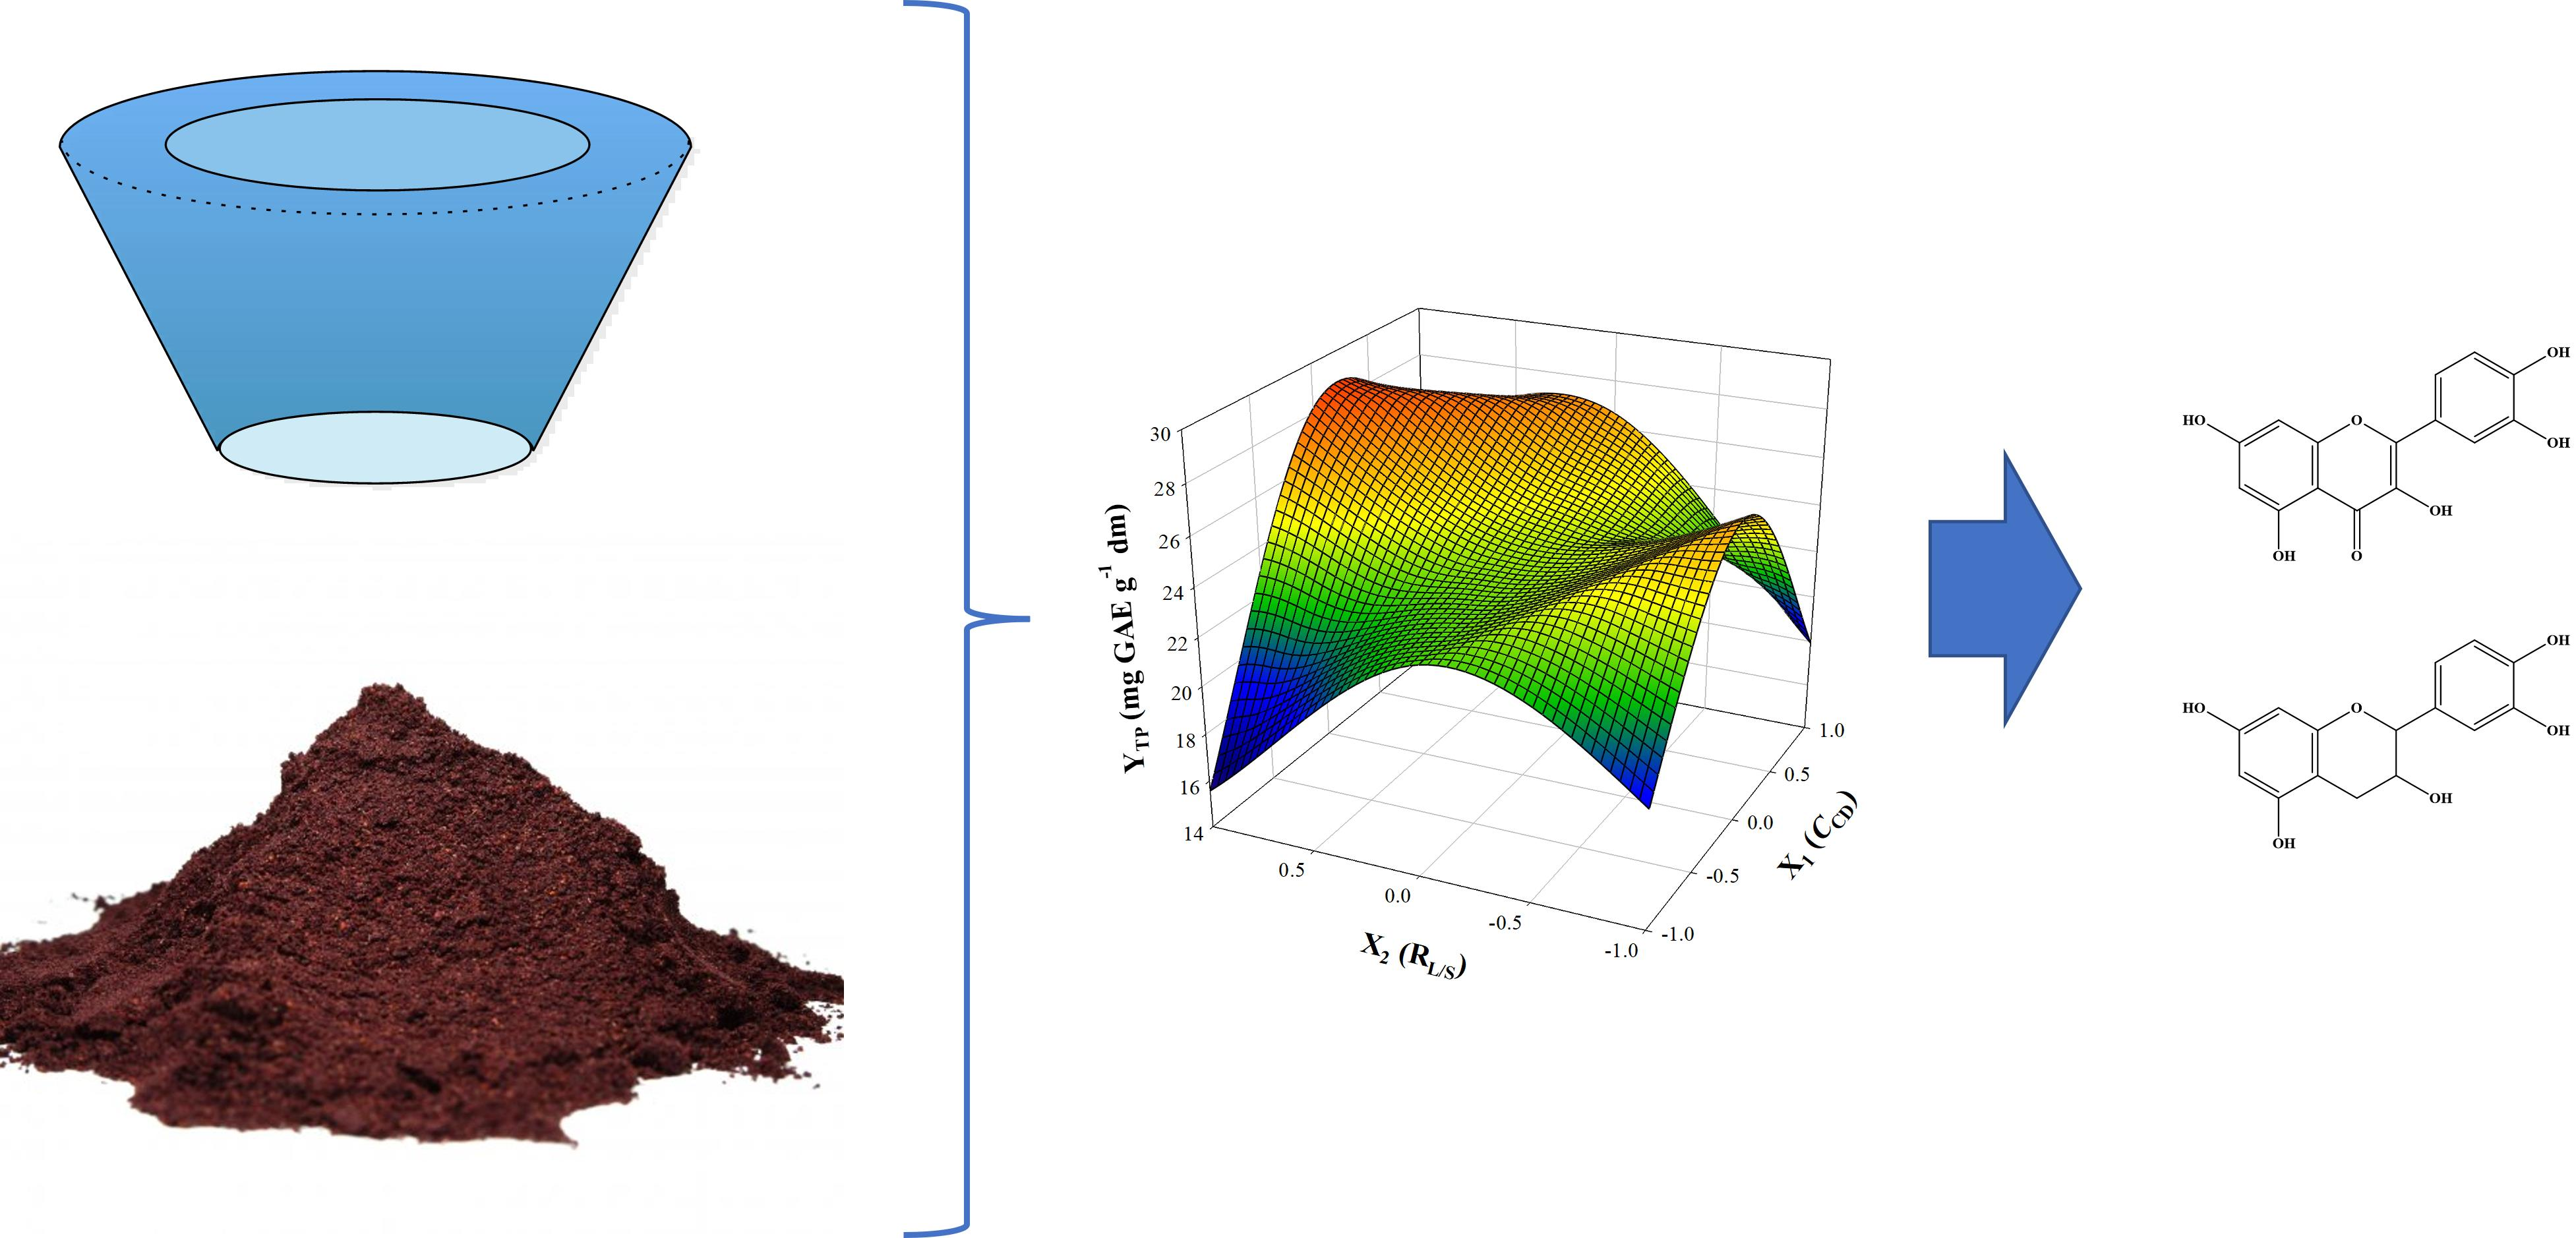
Integrated Green Process for the Extraction of Red Grape Pomace Antioxidant Polyphenols Using Ultrasound-Assisted Pretreatment and β-Cyclodextrin

 ,
,  and
and
Abstract
:
1. Introduction
2. Materials and Methods
2.1. Chemicals and Reagents
2.2. Red Grape Pomace (RGP)
2.3. Extraction of RGP
2.4. Experimental Design—Response Surface Methodology
2.5. Kinetics and Temperature Effect
2.6. Total Polyphenol (TP) Determination
2.7. Antioxidant Activity
2.8. High-Performance Liquid Chromatography (HPLC) Analysis
2.9. Liquid Chromatography—Mass Spectrometry
2.10. Statistical Analyses
3. Results and Discussion
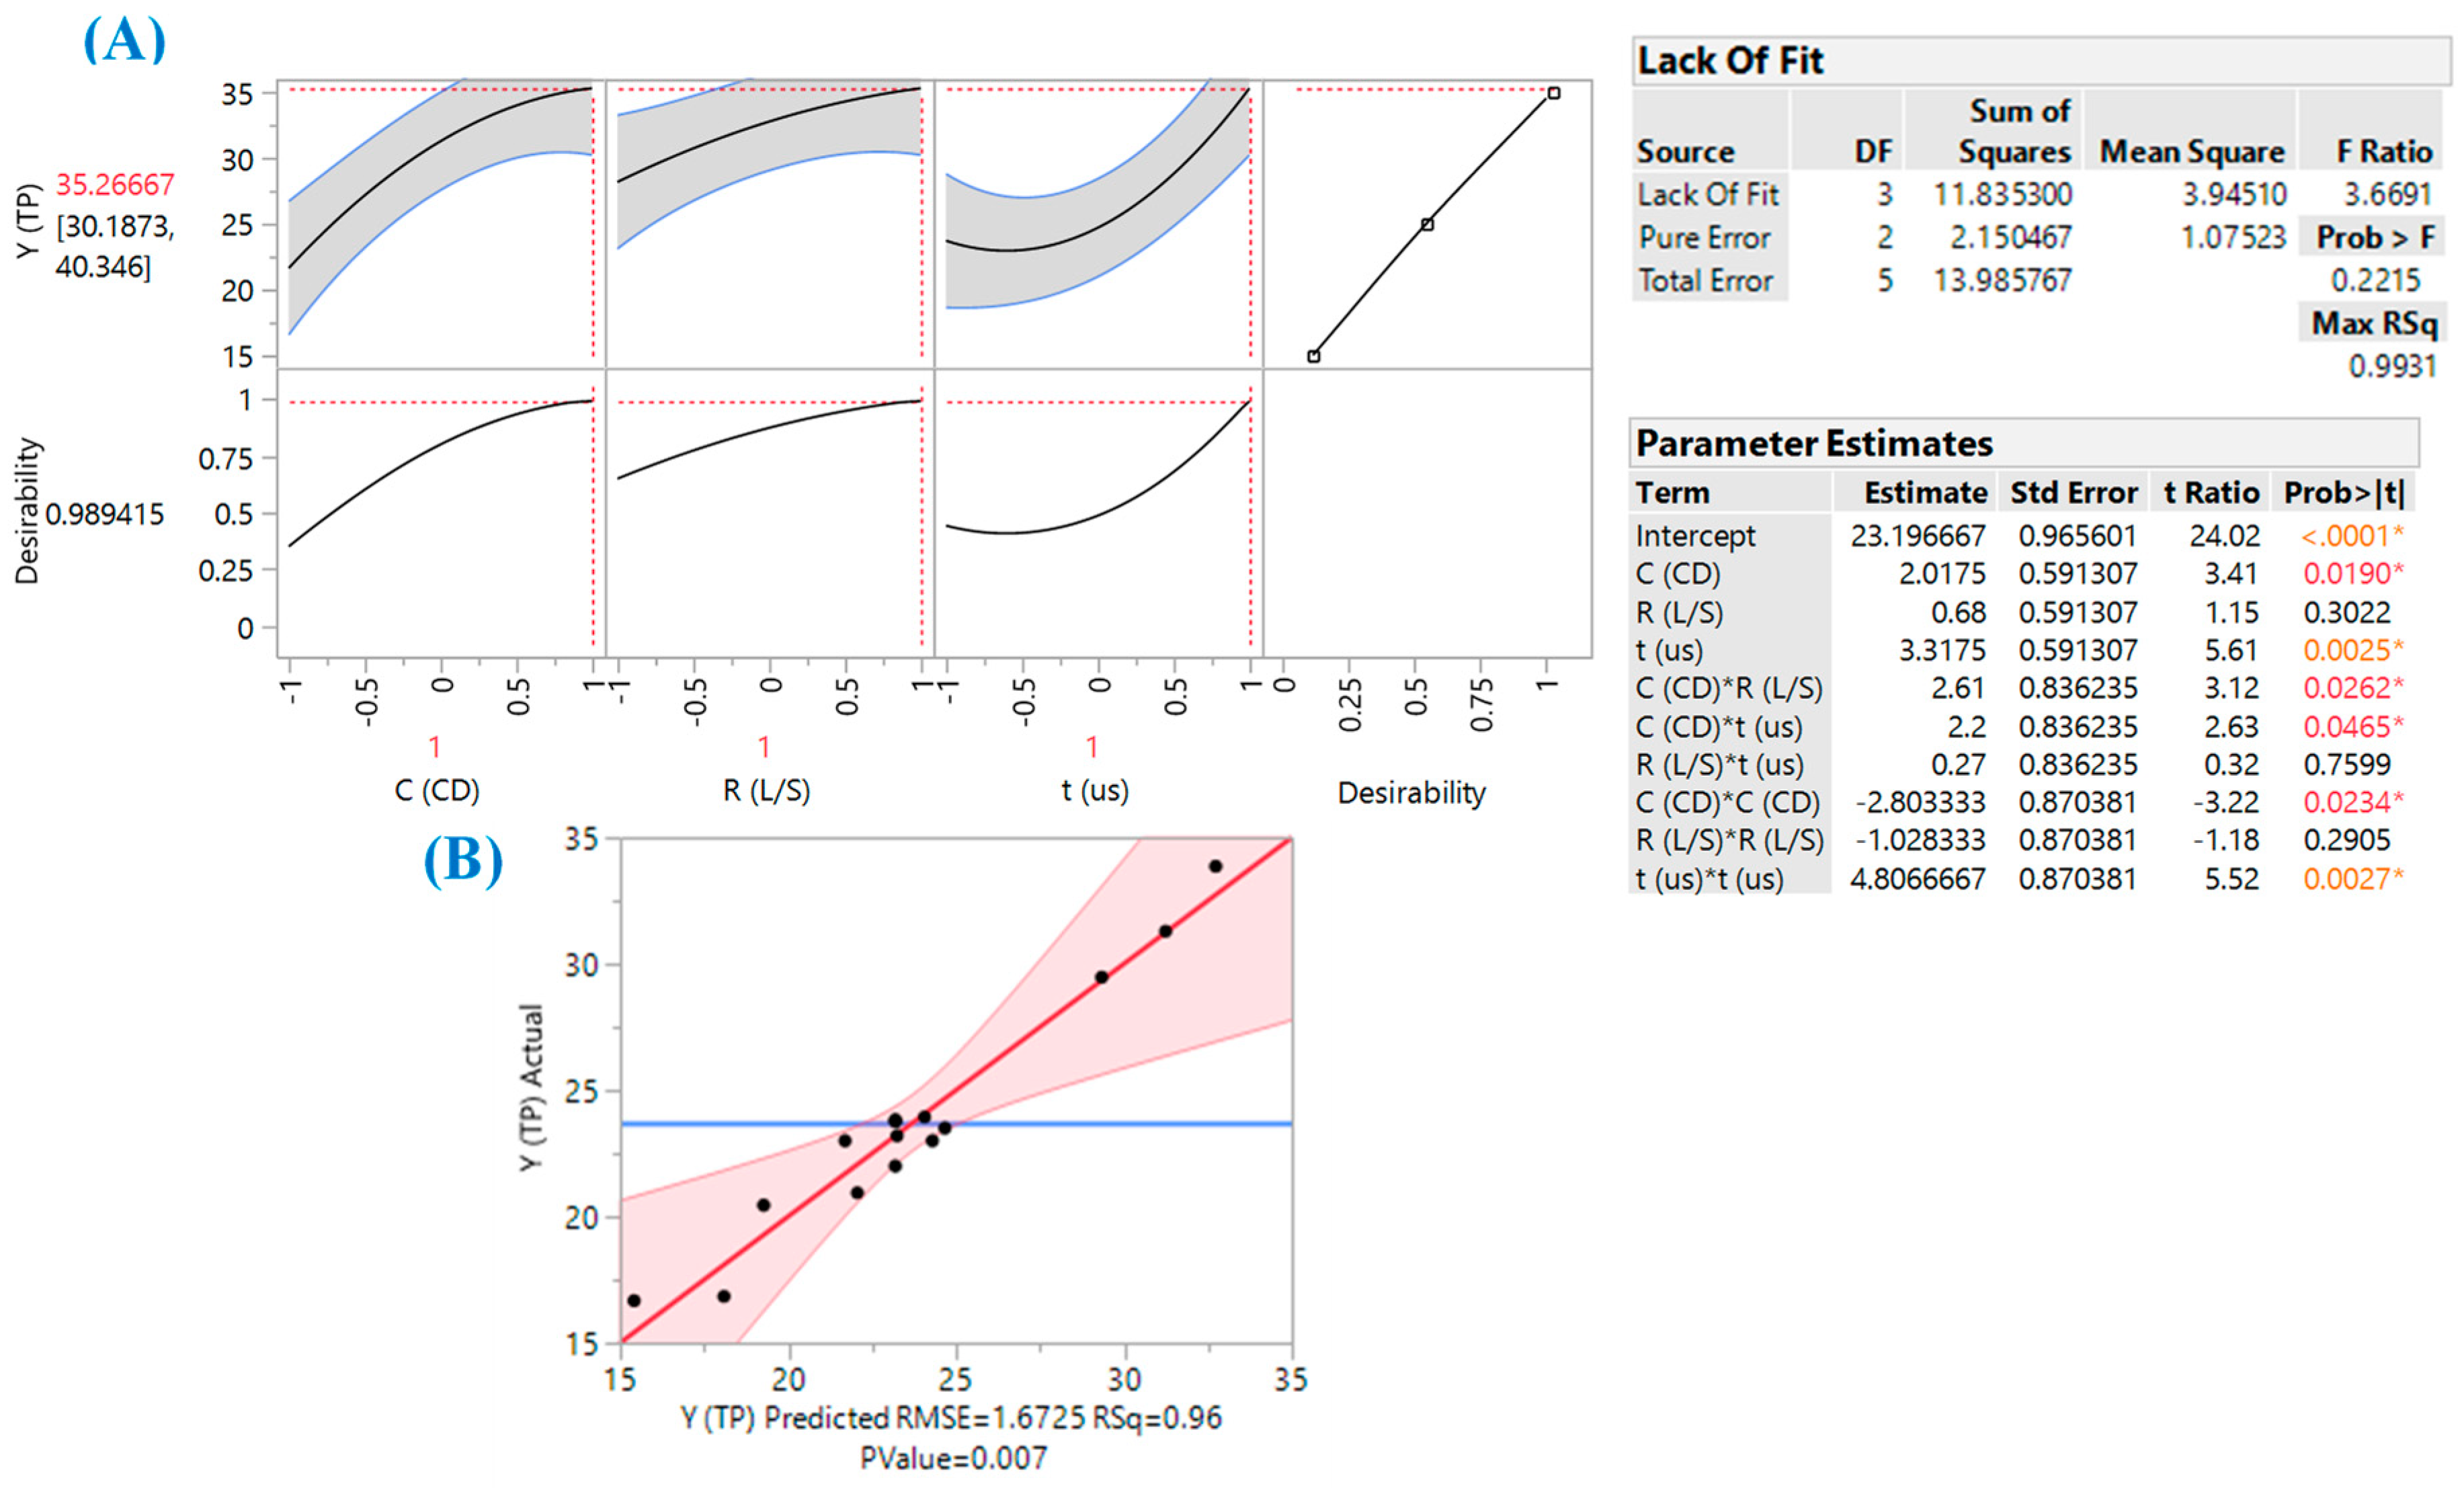
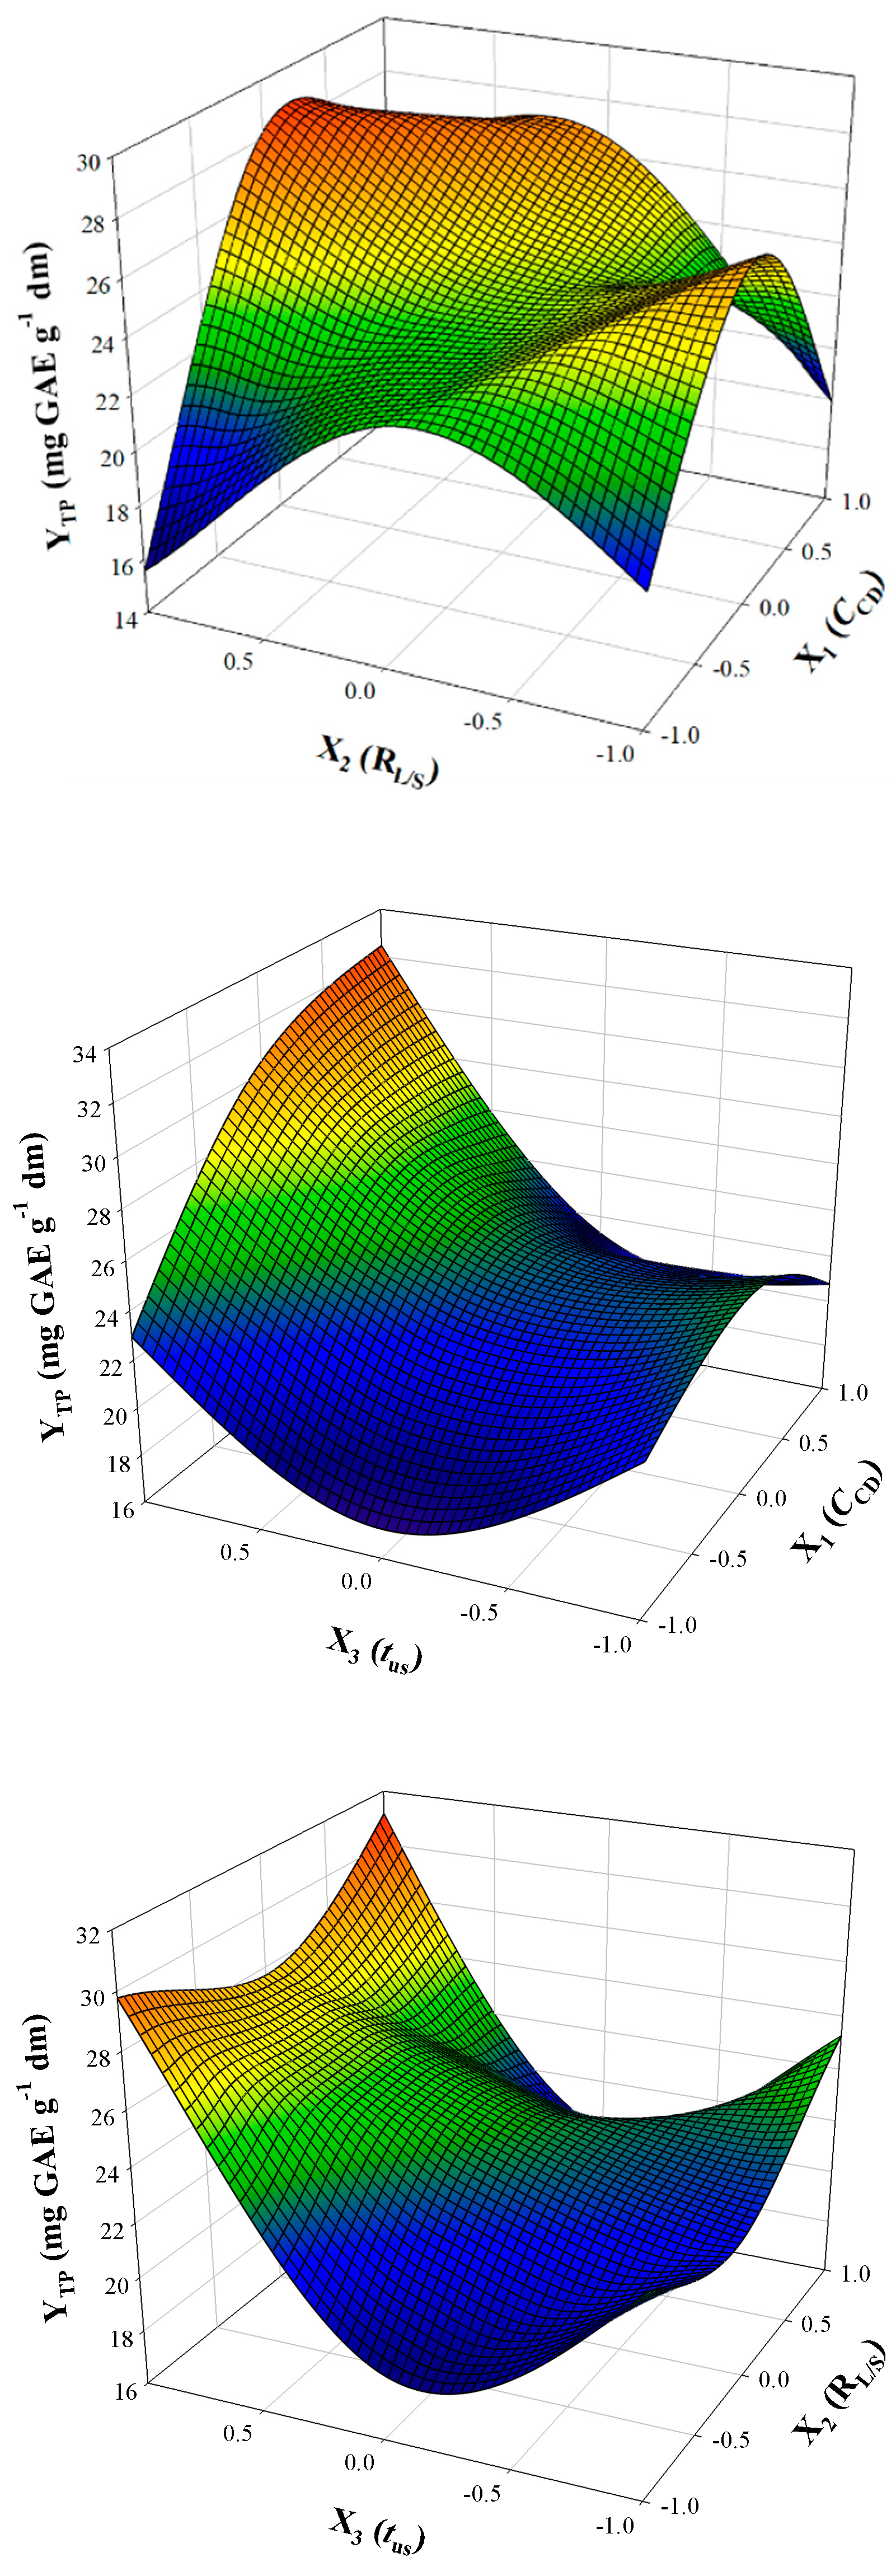
3.1. Process (Extraction) Optimization
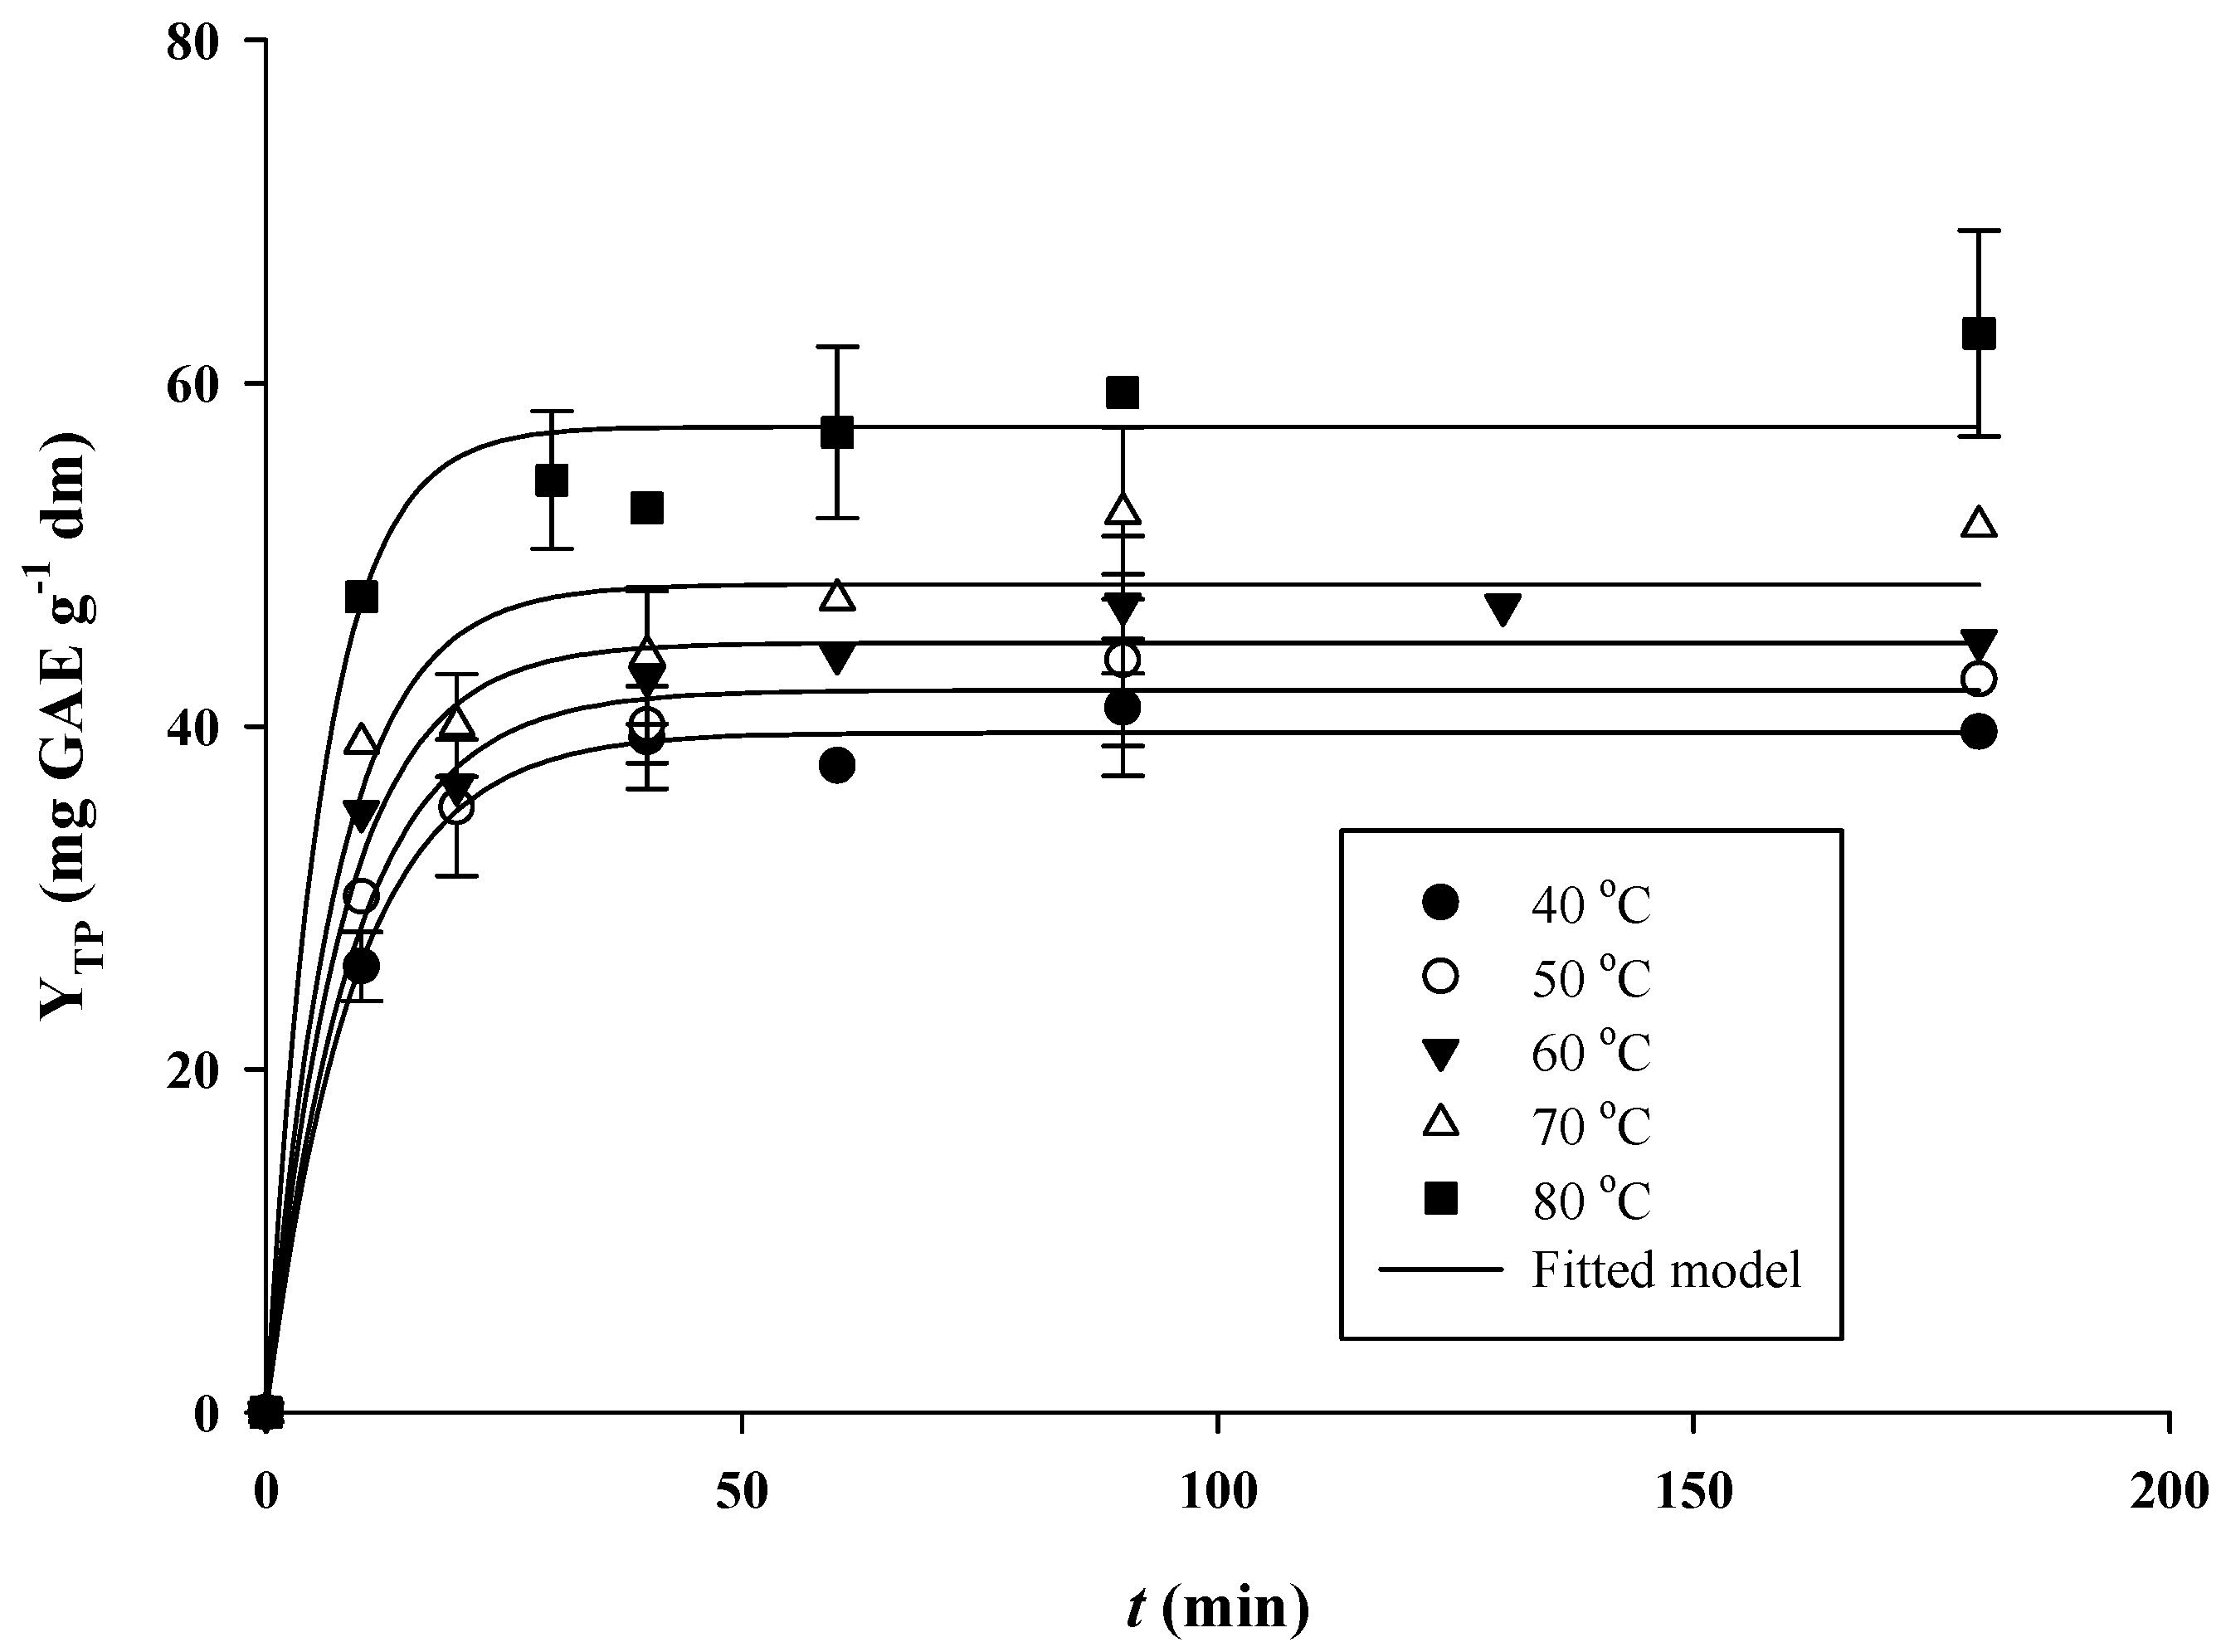
3.2. Extraction Kinetics and the Effect of Temperature
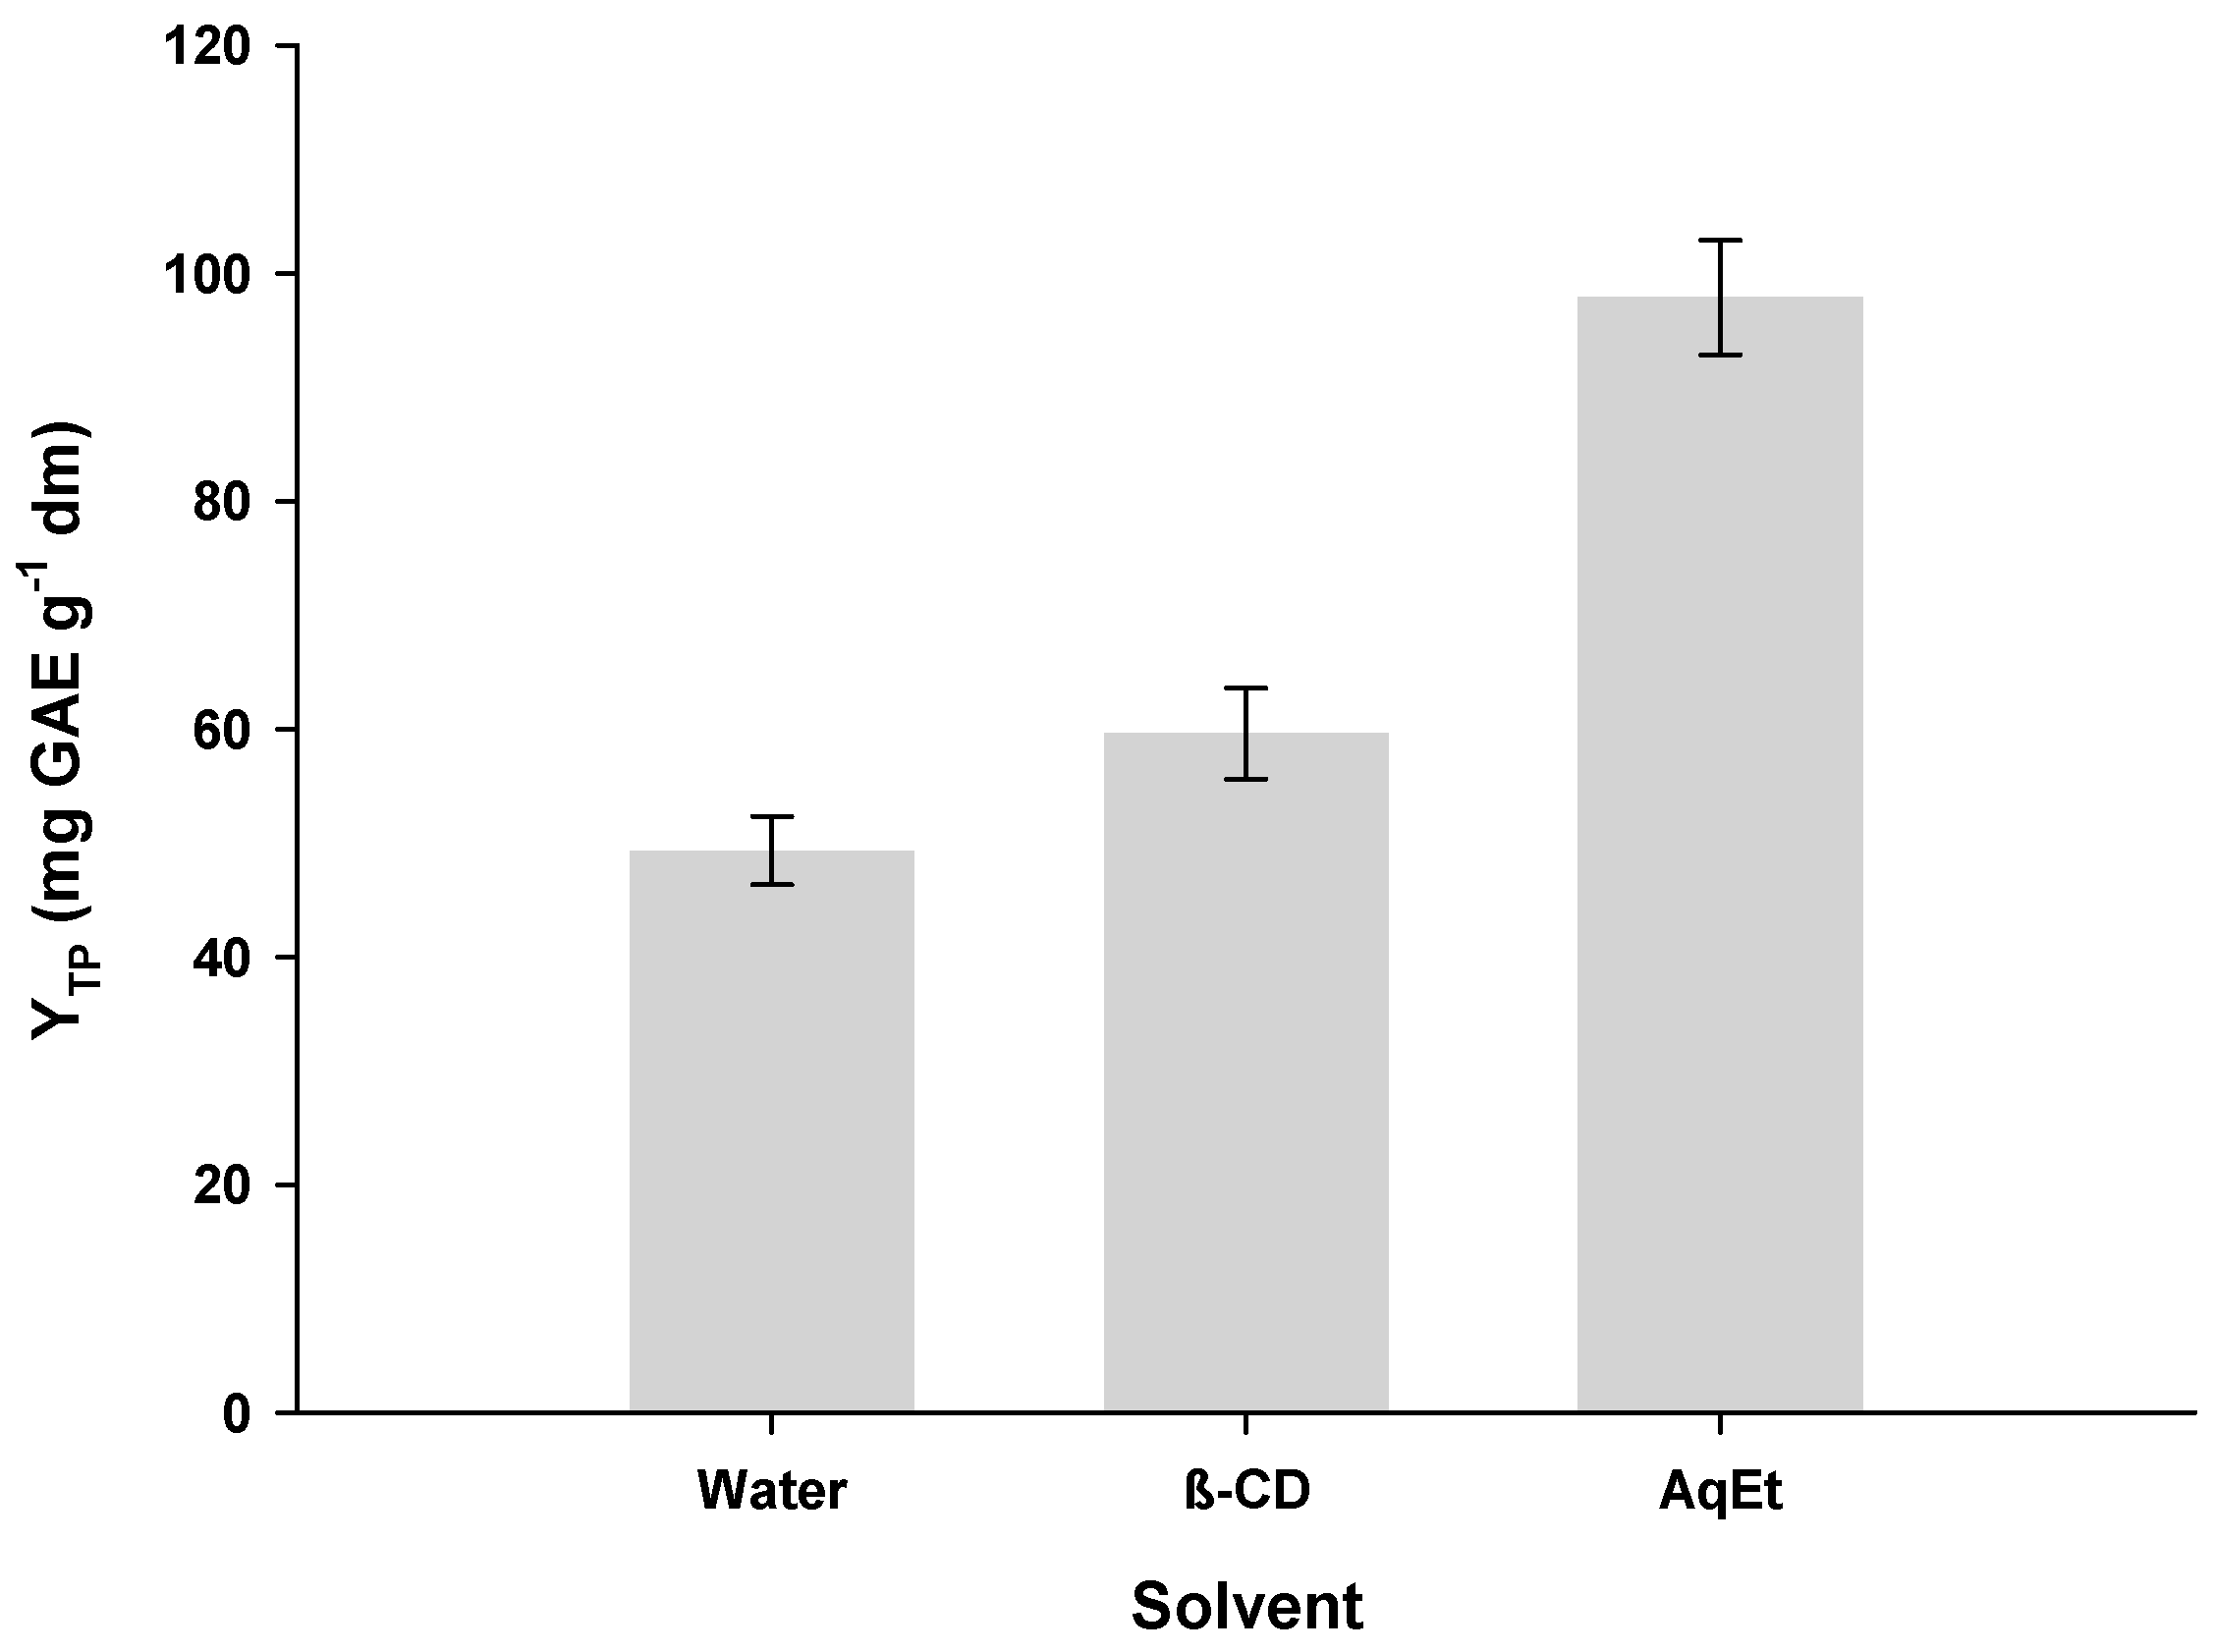
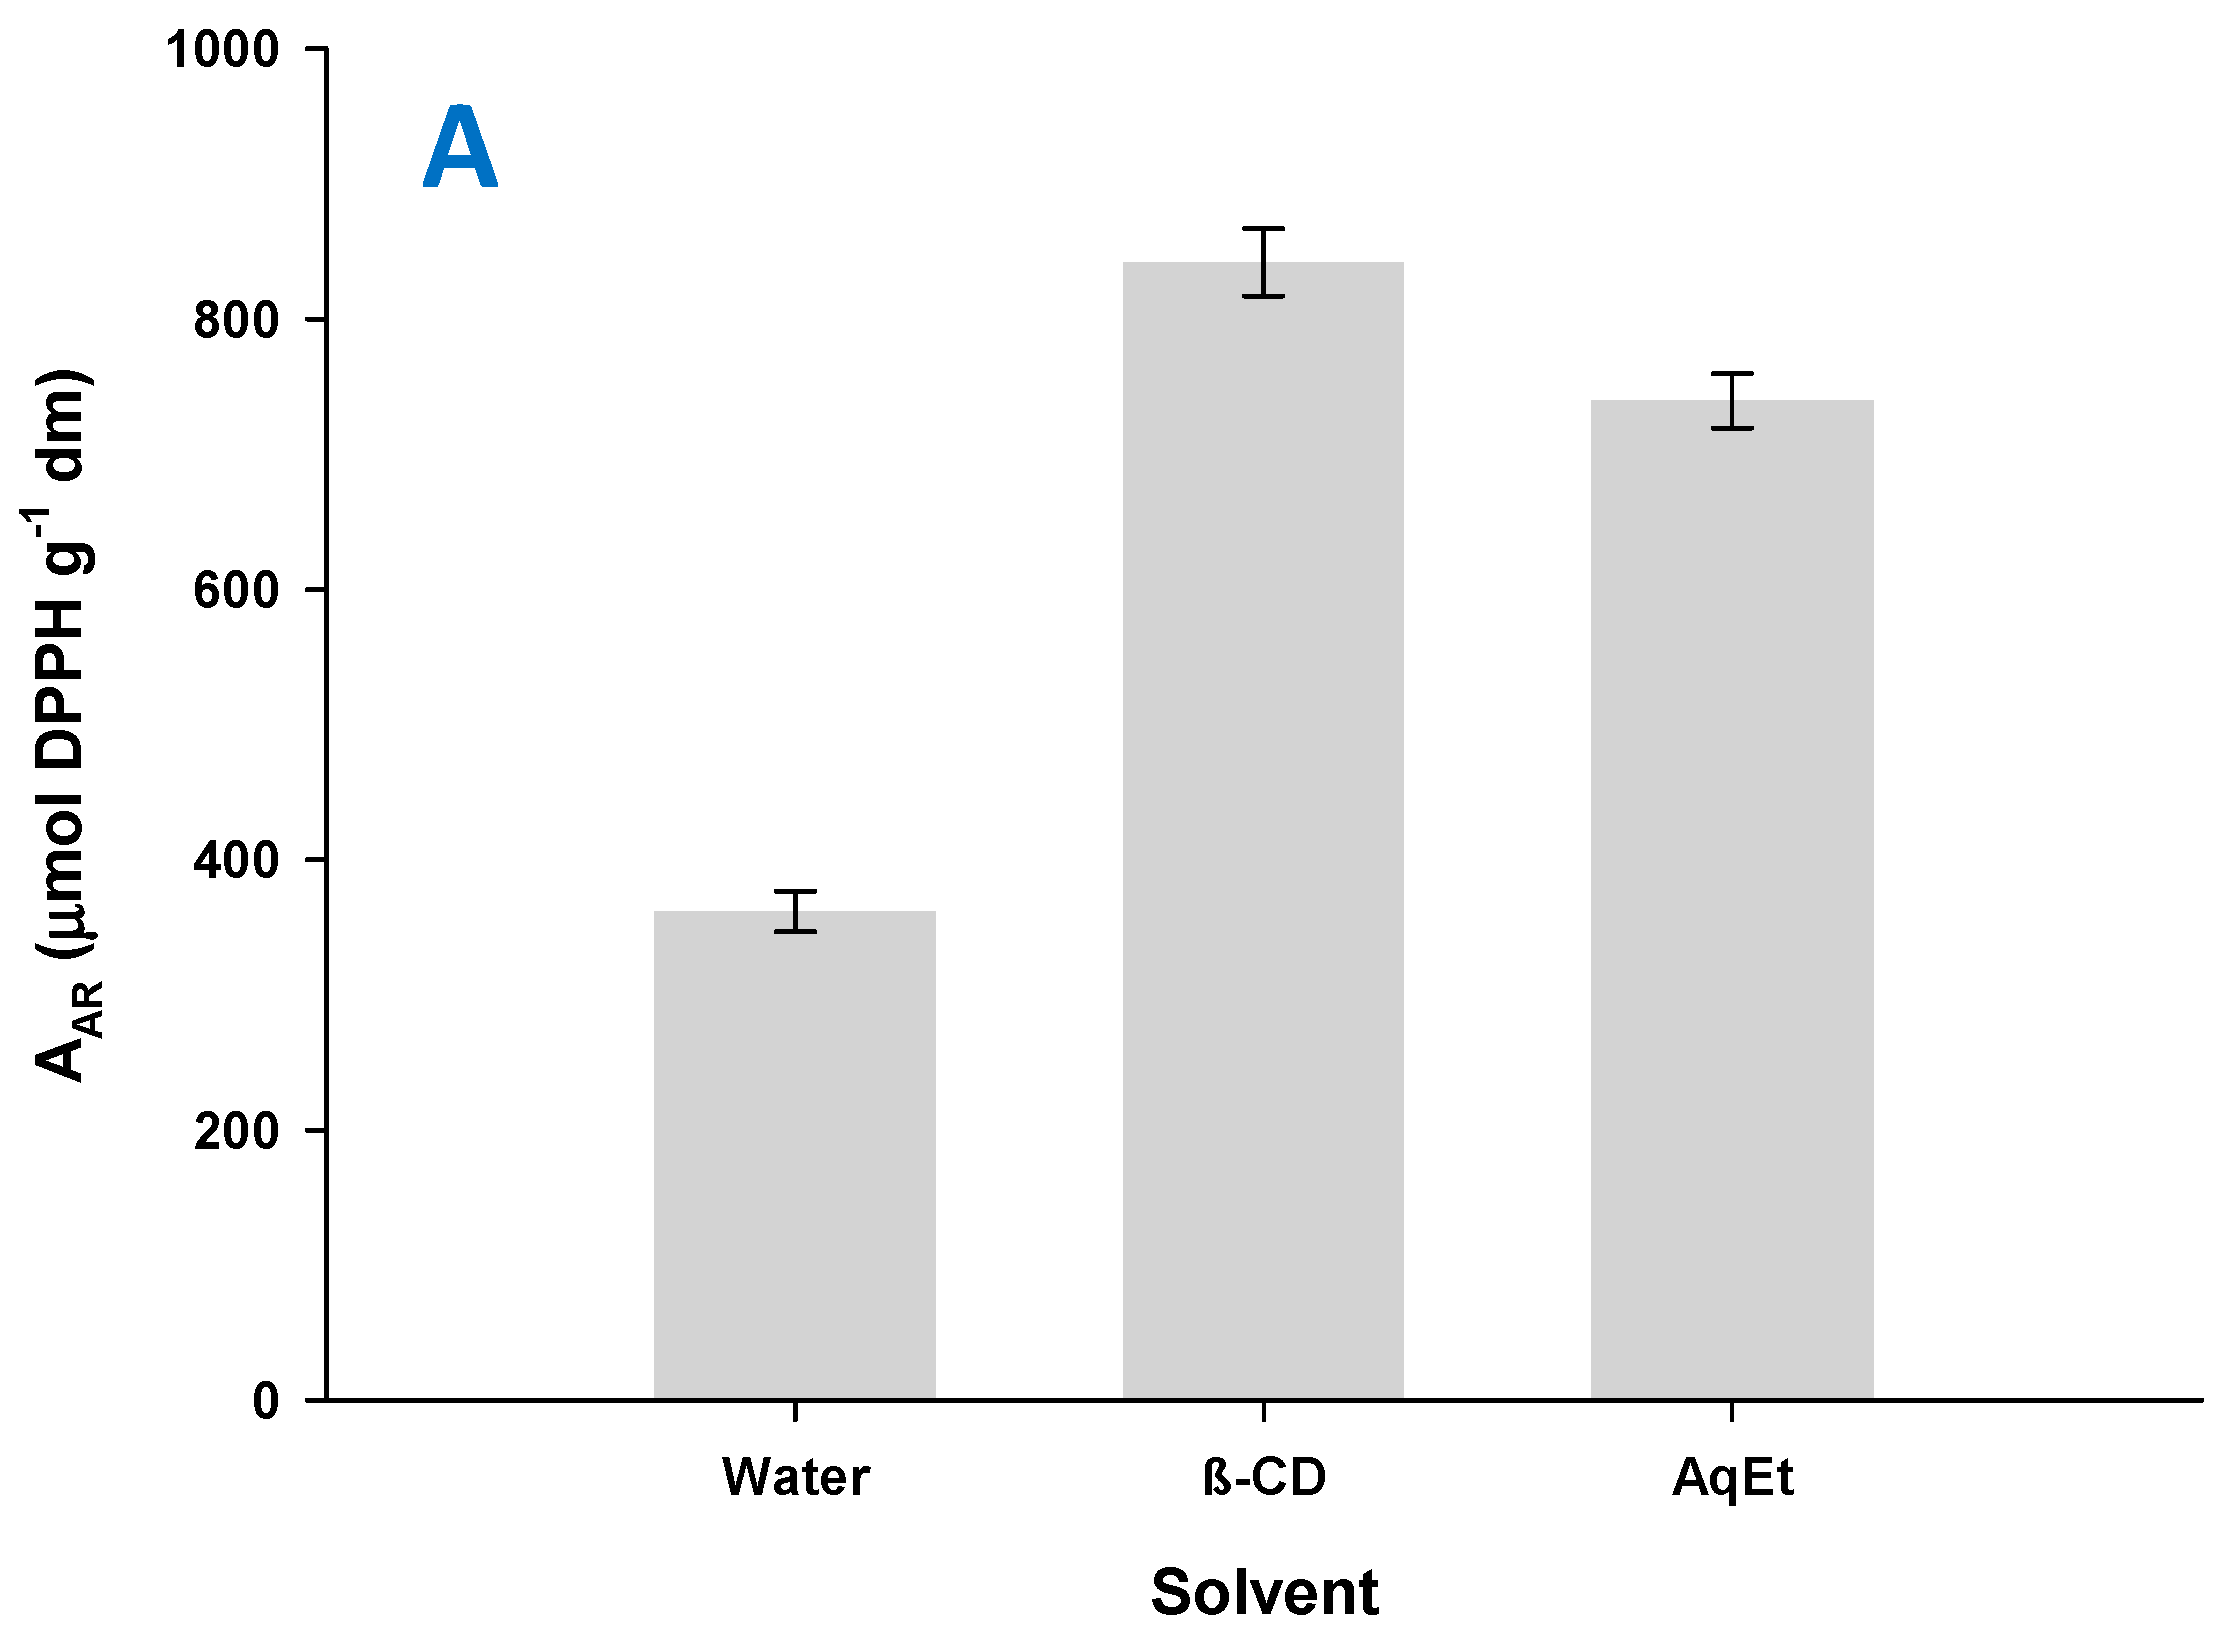
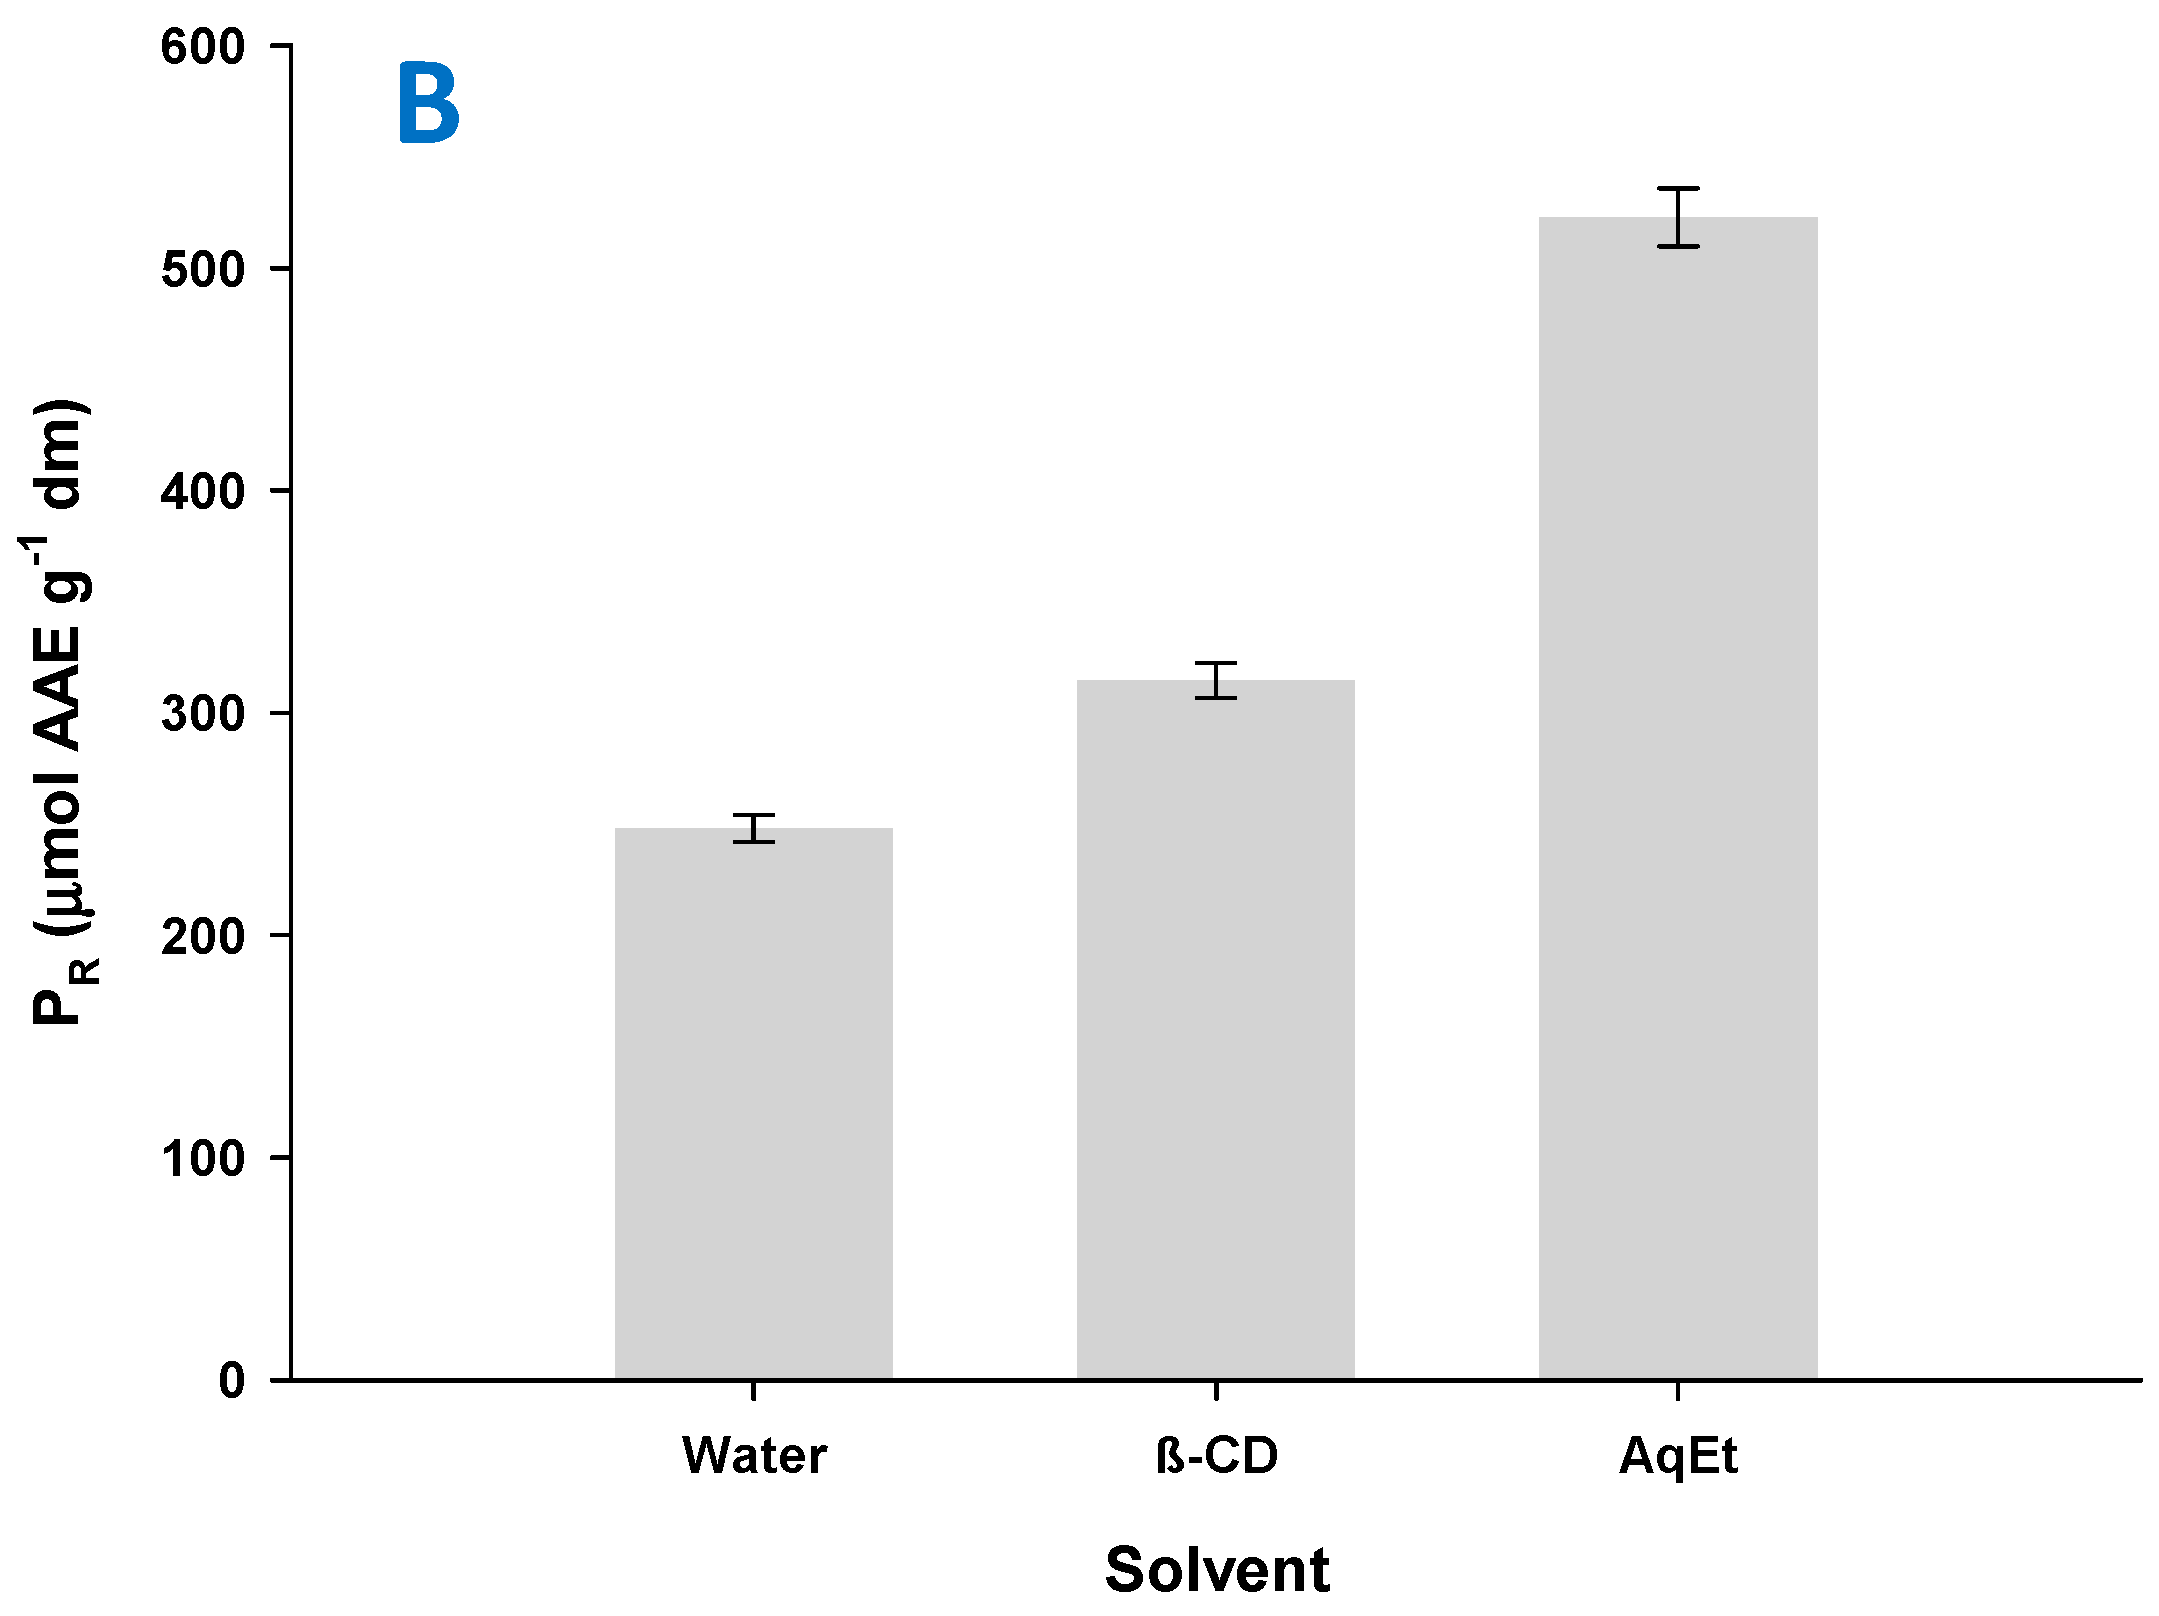
3.3. Comparative Evaluation of Extracts
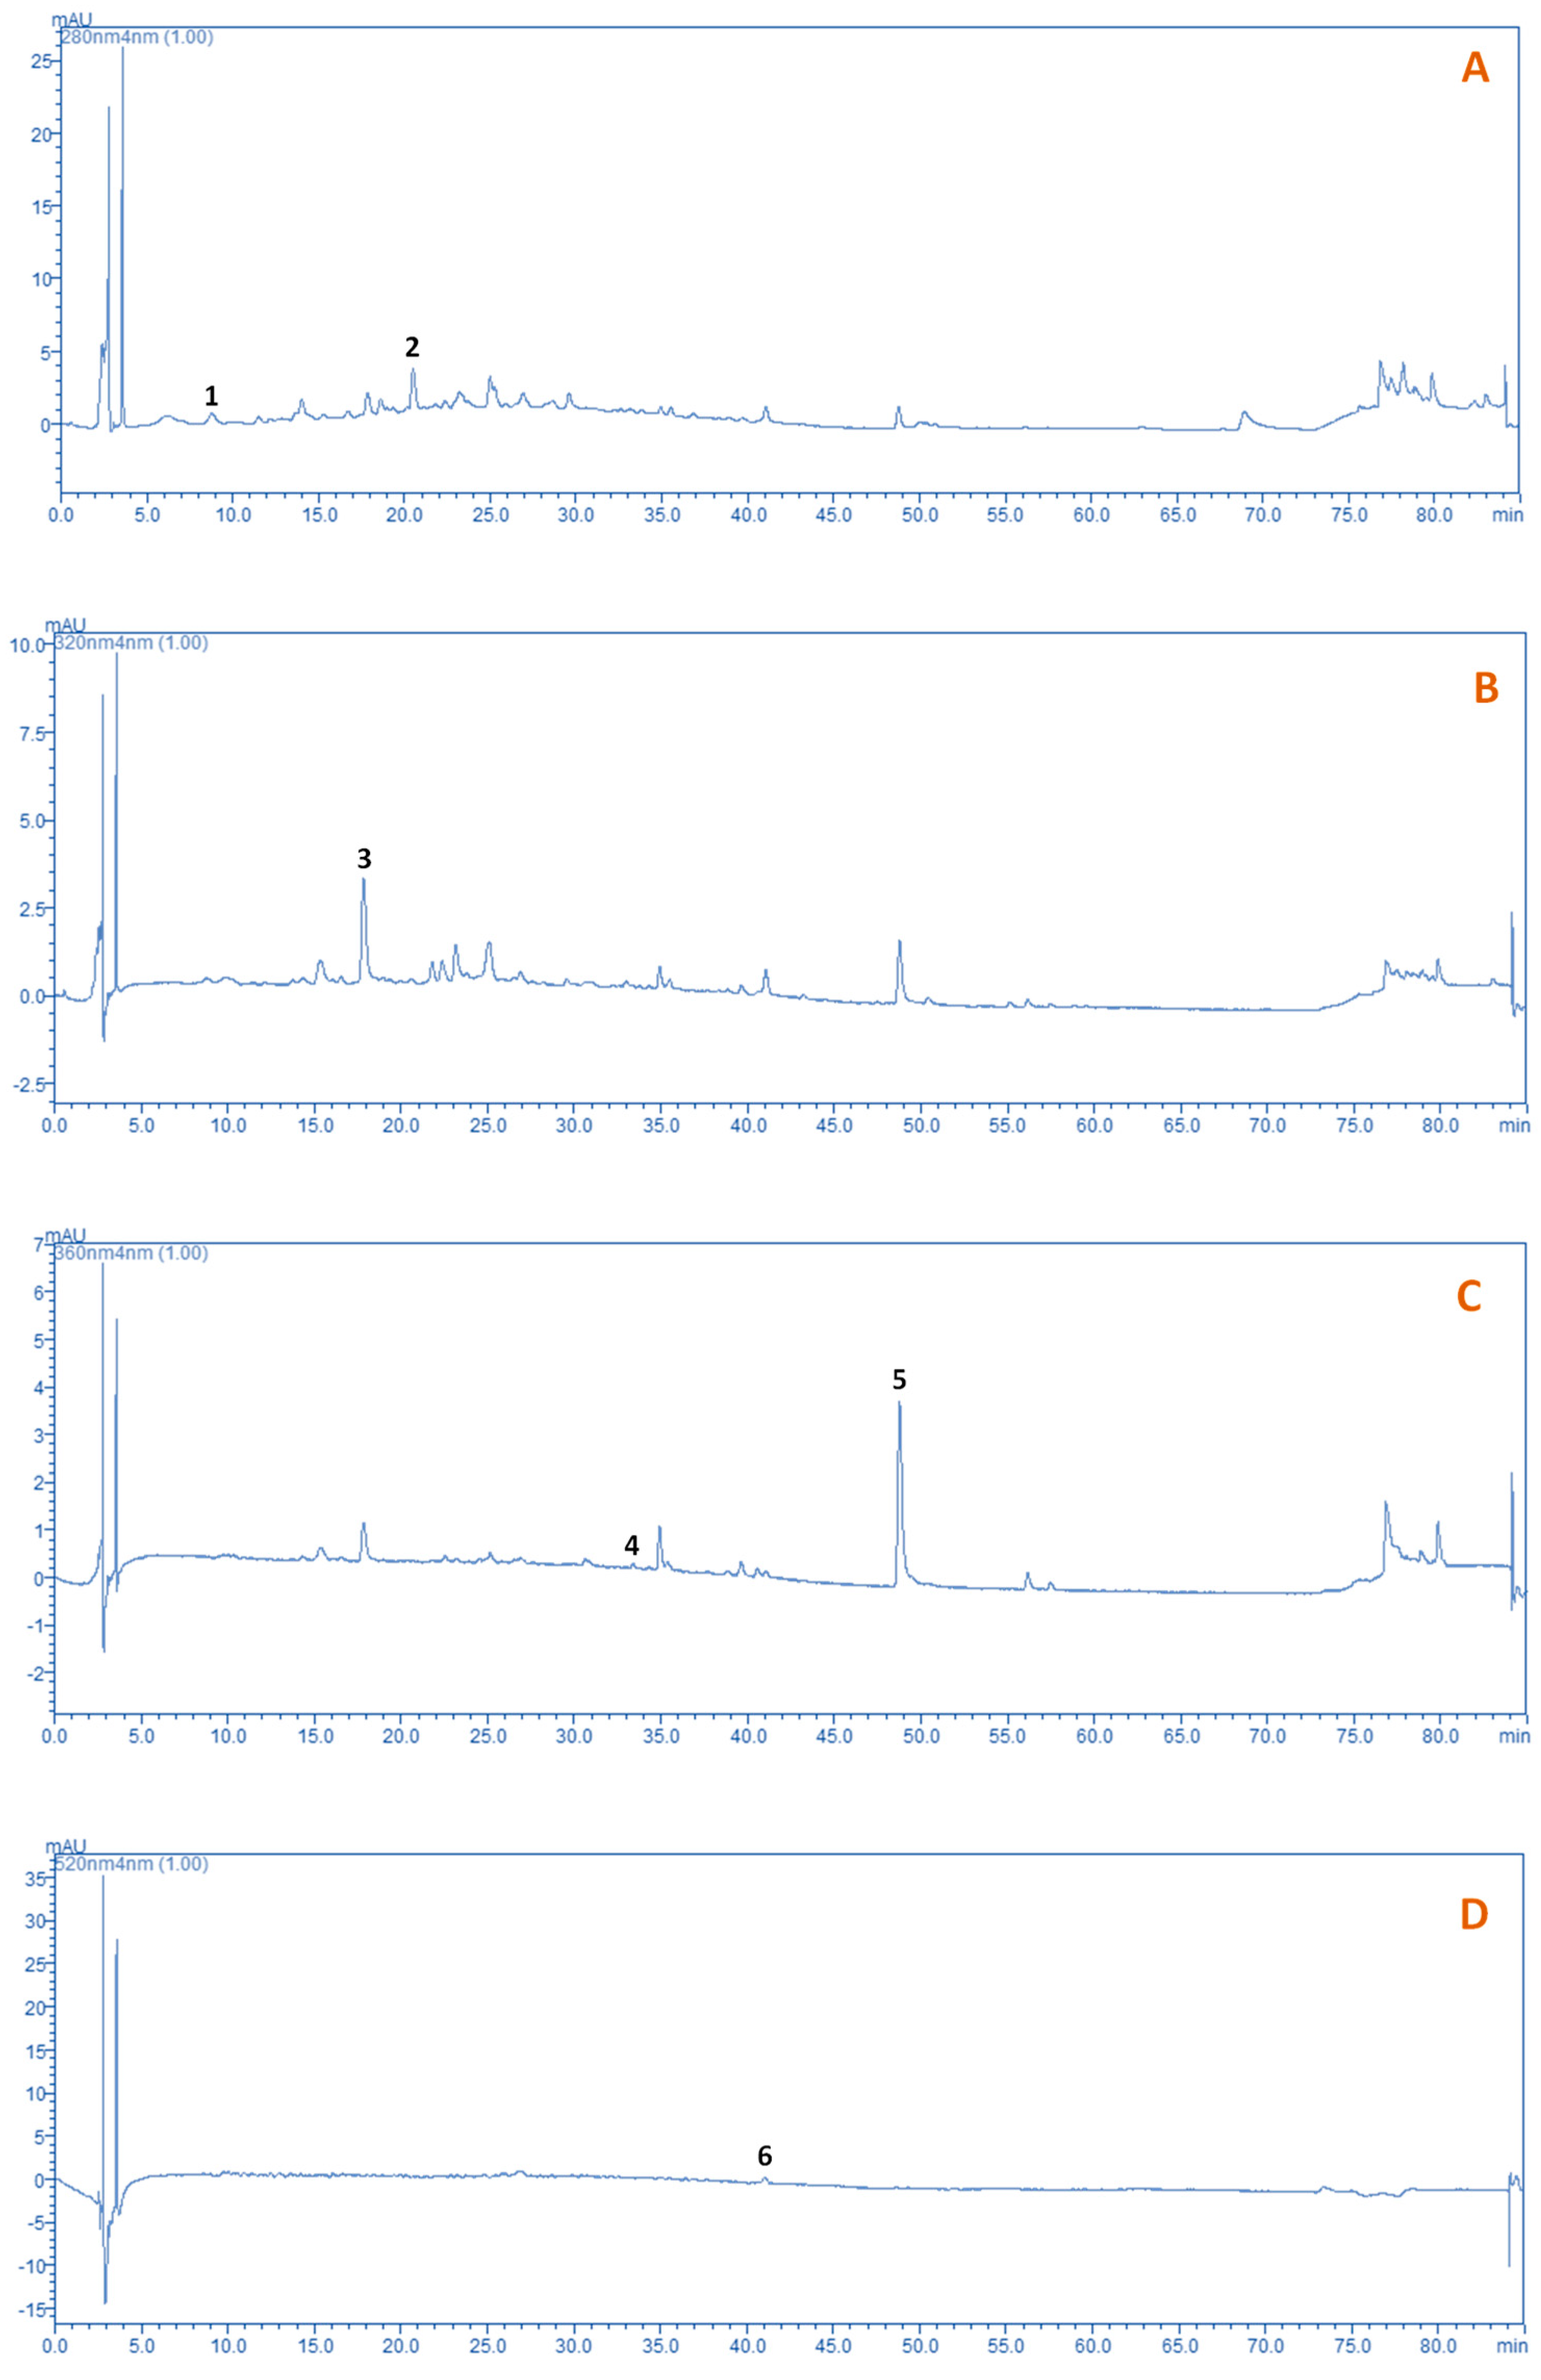
3.4. Polyphenolic Profile
4. Conclusions
- Optimization through response surface methodology demonstrated that incorporation of β-cyclodextrin in an aqueous medium at a level of 1.5% and ultrasonication pretreatment for 30 min may significantly increase the extraction yield in total polyphenols.
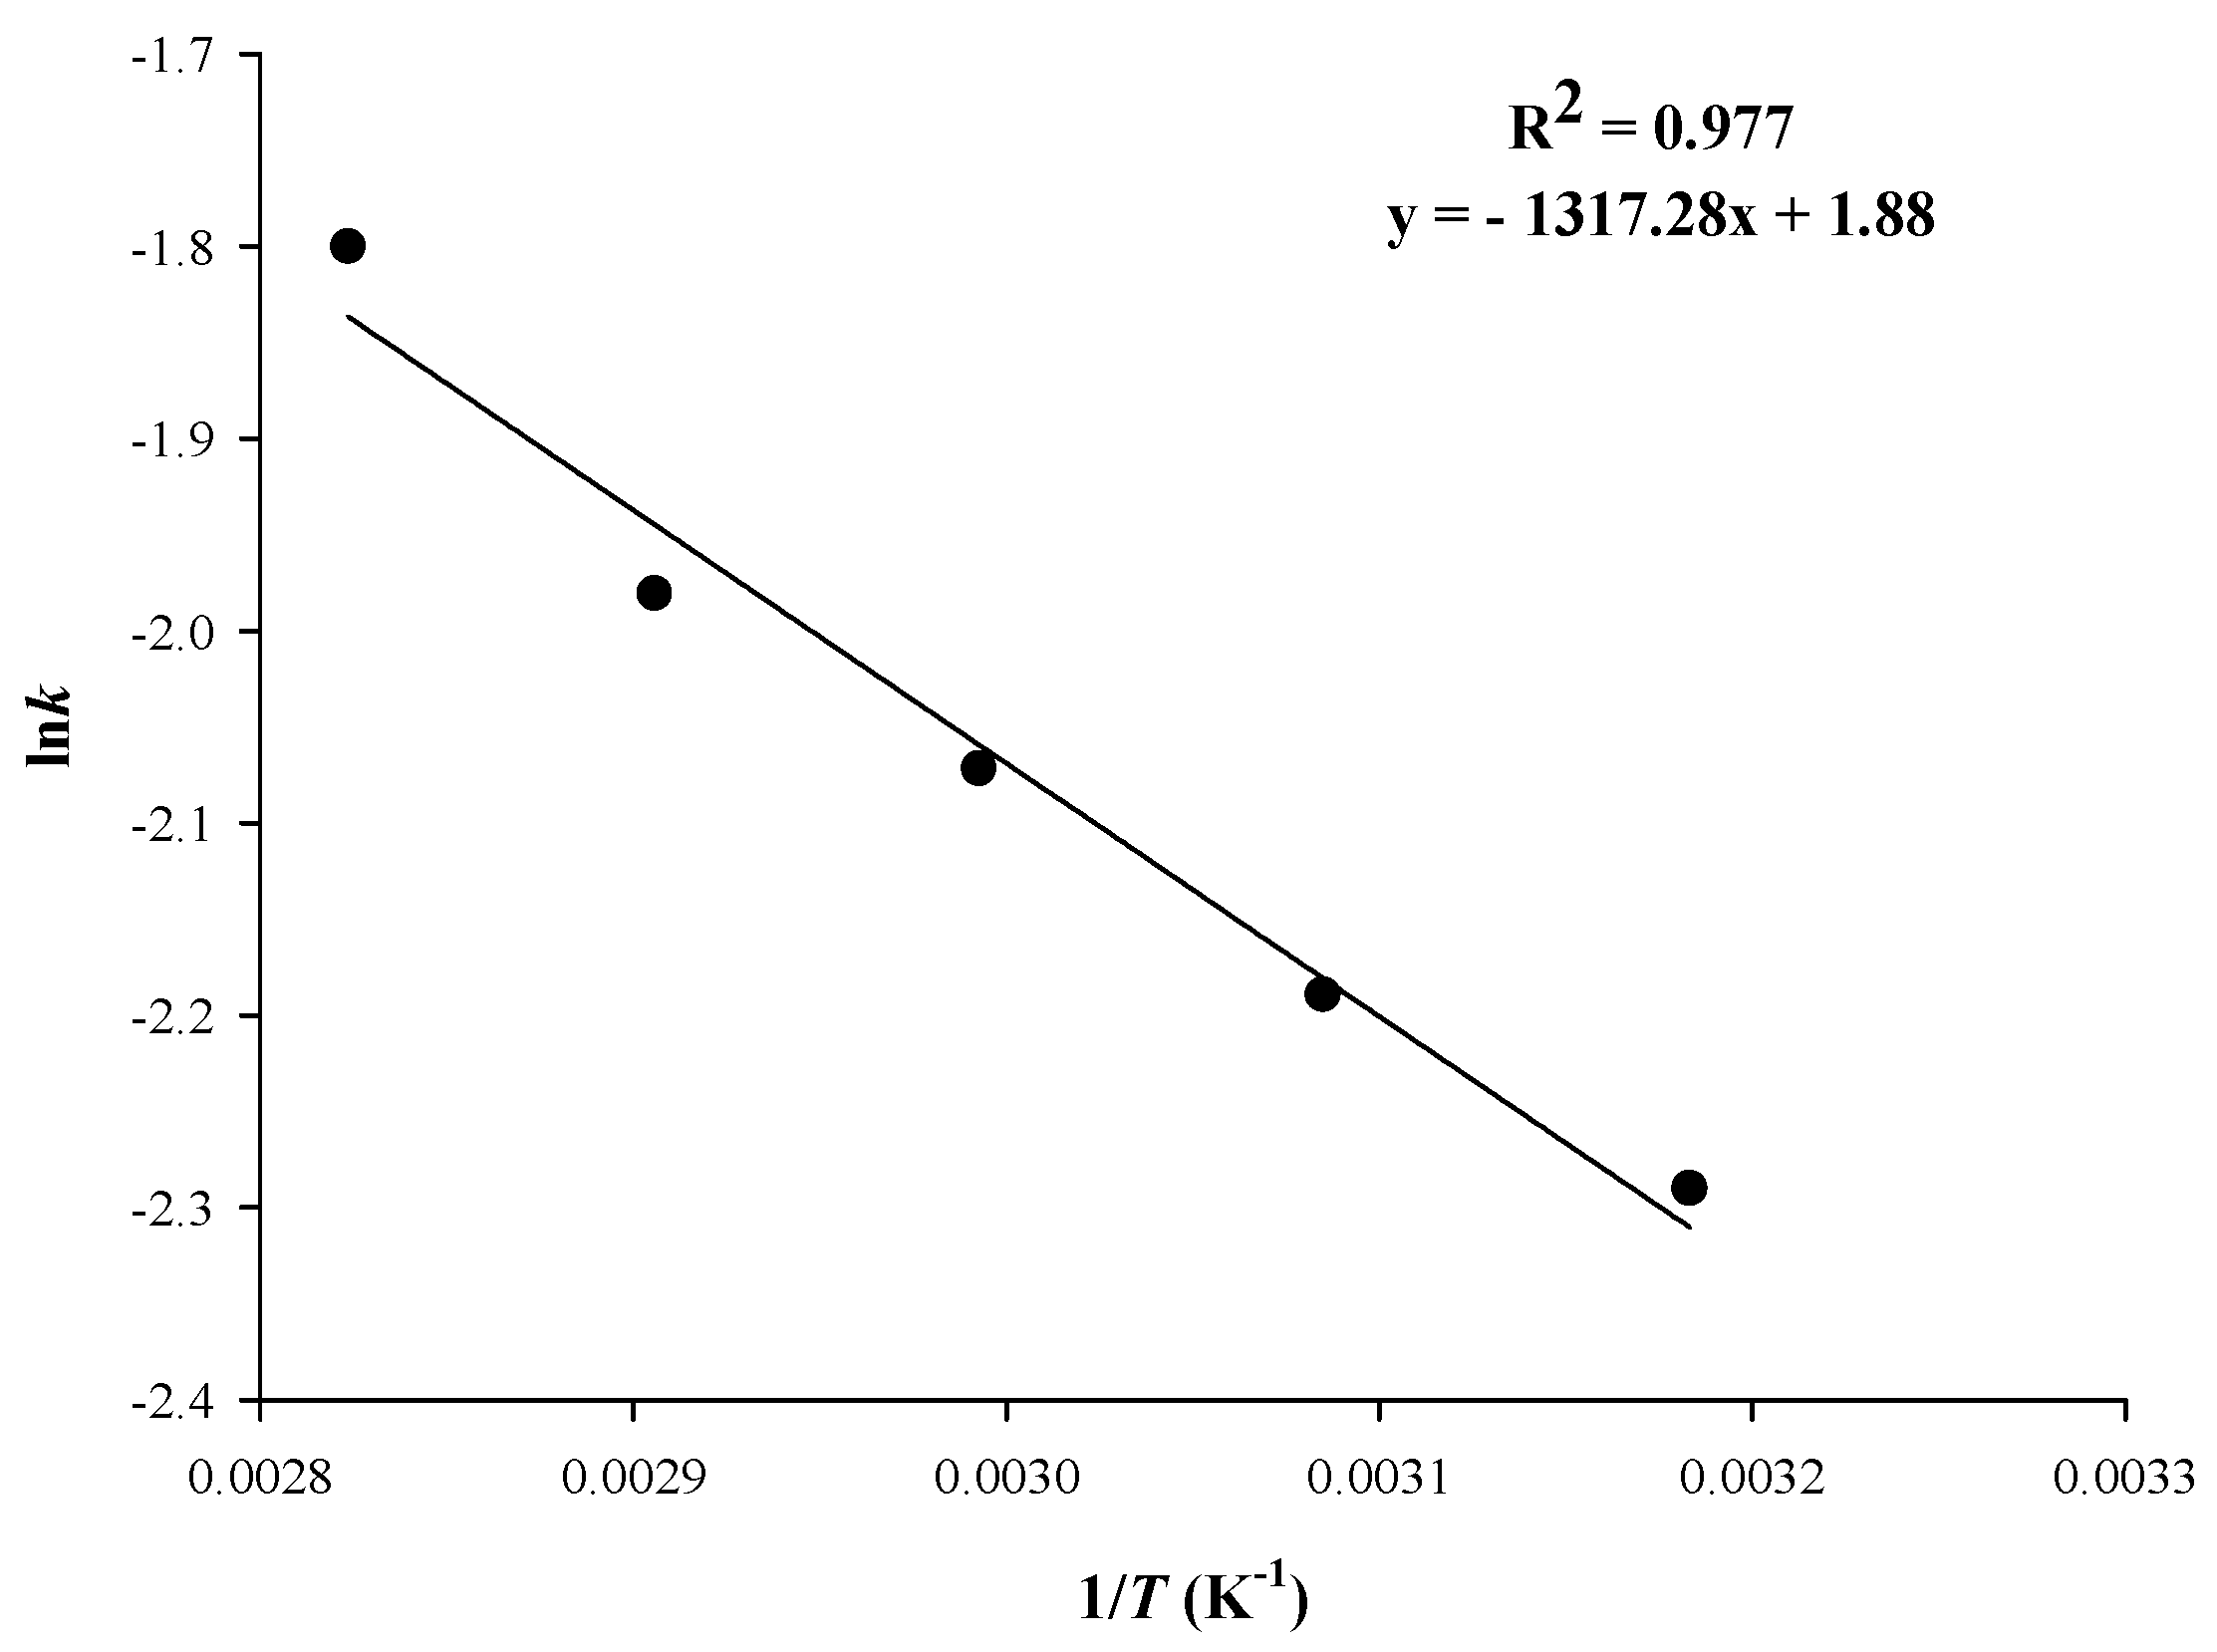
- The maximum yield, after carrying out a temperature assay, was 57.47 mg GAE g−1 dm, at 80 °C. Taking into consideration the bibliographic data from previous studies, but also the relatively low activation energy determined, the process developed is effective, green, with low energy demands.
- The extracts obtained were characterized by high (506.54 μg g−1 dm) and quercetin (151.17 μg g−1 dm) content and relatively high antiradical activity. This outcome may be important for the production of extracts fortified in selected polyphenolic phytochemicals and enable task-specific extractions.
Supplementary Materials
Author Contributions
Funding
Institutional Review Board Statement
Informed Consent Statement
Data Availability Statement
Conflicts of Interest
Nomenclature
| AAR | antiradical activity (μmol DPPH g−1) |
| AED | acoustic energy density (W L−1) |
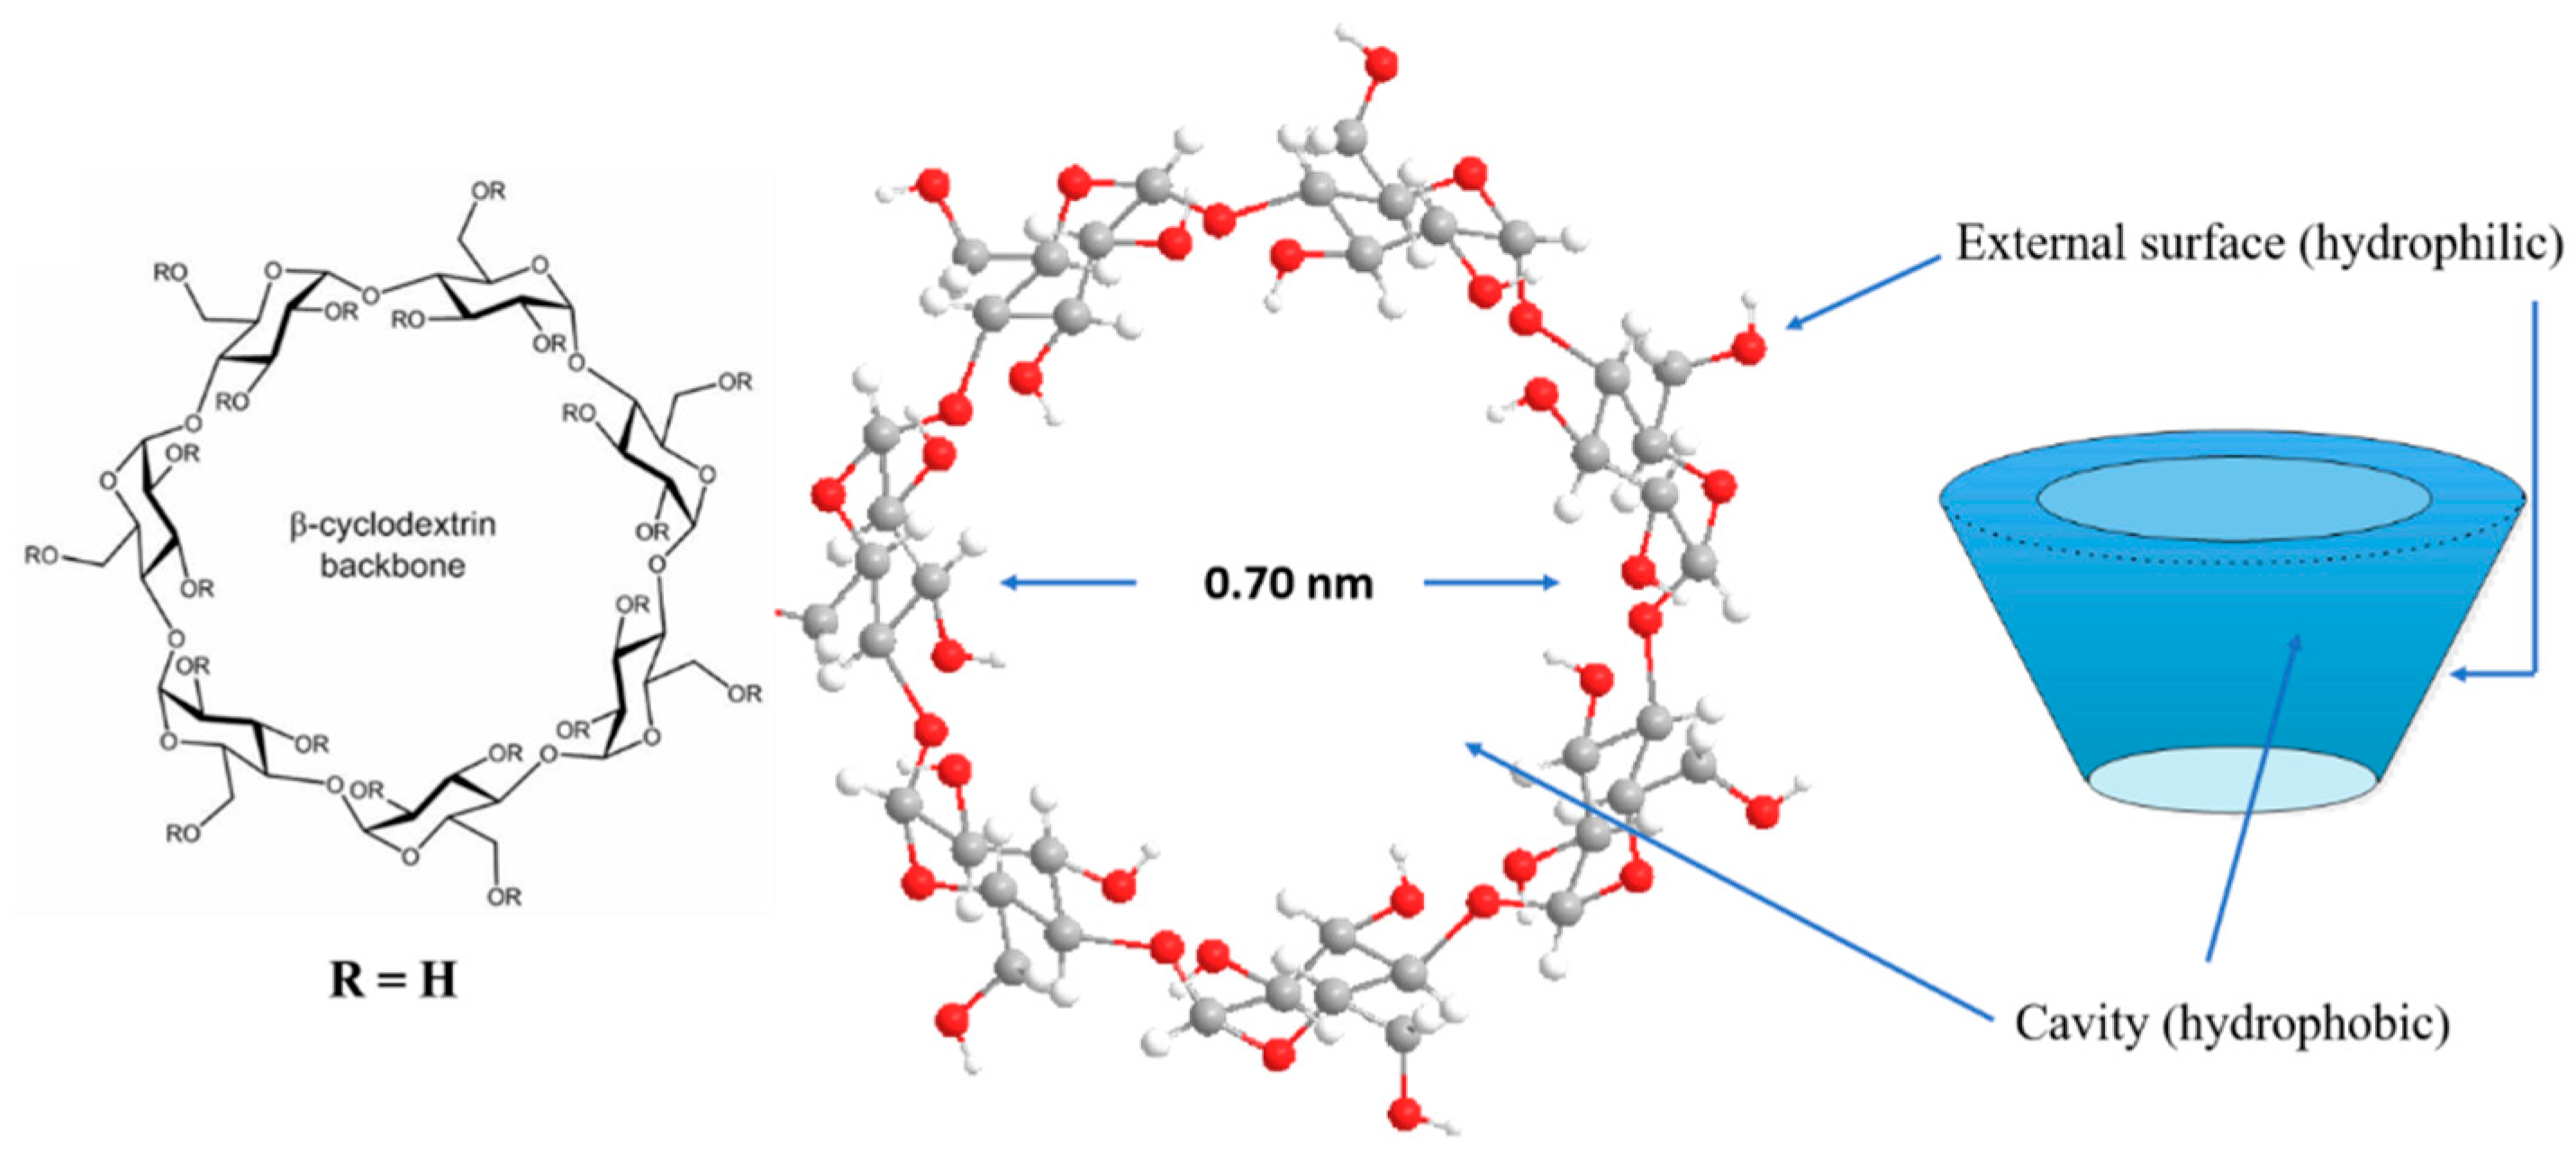
| CCD | β-cyclodextrin concentration (% w/v) |
| Cp | specific heat capacity of water (4.2 J g−1 K−1) |
| m | mass (g) |
| P | ultrasonication power (W) |
| PR | ferric-reducing power (μmol AAE g−1) |
| RL/S | liquid-to-solid ratio (mL g−1) |
| tus | ultrasonication time (min) |
| T | temperature (°C) |
| YTP | yield in total polyphenols (mg GAE g−1) |
| YTP(s) | yield in total polyphenols at saturation (equilibrium) (mg GAE g−1) |
References
- Strategic Work of FAO for Sustainable Food and Agriculture. Available online: http://www.fao.org/3/a-i6488e.pdf (accessed on 25 July 2021).
- Lizárraga-Velázquez, C.E.; Leyva-López, N.; Hernández, C.; Gutiérrez-Grijalva, E.P.; Salazar-Leyva, J.A.; Osuna-Ruíz, I.; Martínez-Montaño, E.; Arrizon, J.; Guerrero, A.; Benitez-Hernández, A. Antioxidant molecules from plant waste: Extraction techniques and biological properties. Processes 2020, 8, 1566. [Google Scholar] [CrossRef]
- Burlini, I.; Sacchetti, G. Secondary bioactive metabolites from plant-derived food byproducts through ecopharmacognostic approaches: A bound phenolic case study. Plants 2020, 9, 1060. [Google Scholar] [CrossRef] [PubMed]
- Gómez-Brandón, M.; Lores, M.; Insam, H.; Domínguez, J. Strategies for recycling and valorization of grape marc. Crit. Rev. Biotech. 2019, 39, 437–450. [Google Scholar] [CrossRef] [PubMed]
- Ahmad, B.; Yadav, V.; Yadav, A.; Rahman, M.U.; Yuan, W.Z.; Li, Z.; Wang, X. Integrated biorefinery approach to valorize winery waste: A review from waste to energy perspectives. Sci. Total Environ. 2020, 719, 137315. [Google Scholar] [CrossRef] [PubMed]
- Chowdhary, P.; Gupta, A.; Gnansounou, E.; Pandey, A.; Chaturvedi, P. Current trends and possibilities for exploitation of grape pomace as a potential source for value addition. Environ. Pol. 2021, 278, 116796. [Google Scholar] [CrossRef] [PubMed]
- Yammine, S.; Brianceau, S.; Manteau, S.; Turk, M.; Ghidossi, R.; Vorobiev, E.; Mietton-Peuchot, M. Extraction and purification of high added value compounds from by-products of the winemaking chain using alternative/nonconventional processes/technologies. Crit. Rev. Food Sci. Nutr. 2018, 58, 1375–1390. [Google Scholar] [CrossRef] [PubMed]
- Chemat, F.; Vian, M.A.; Fabiano-Tixier, A.-S.; Nutrizio, M.; Jambrak, A.R.; Munekata, P.E.; Lorenzo, J.M.; Barba, F.J.; Binello, A.; Cravotto, G. A review of sustainable and intensified techniques for extraction of food and natural products. Green Chem. 2020, 22, 2325–2353. [Google Scholar] [CrossRef] [Green Version]
- Jansook, P.; Ogawa, N.; Loftsson, T. Cyclodextrins: Structure, physicochemical properties and pharmaceutical applications. Int. J. Pharm. 2018, 535, 272–284. [Google Scholar] [CrossRef]
- Ratnasooriya, C.C.; Rupasinghe, H.V. Extraction of phenolic compounds from grapes and their pomace using β-cyclodextrin. Food Chem. 2012, 134, 625–631. [Google Scholar] [CrossRef]
- Rajha, H.N.; Chacar, S.; Afif, C.; Vorobiev, E.; Louka, N.; Maroun, R.G. β-Cyclodextrin-assisted extraction of polyphenols from vine shoot cultivars. J. Agric. Food Chem. 2015, 63, 3387–3393. [Google Scholar] [CrossRef]
- López-Miranda, S.; Serrano-Martínez, A.; Hernández-Sánchez, P.; Guardiola, L.; Pérez-Sánchez, H.; Fortea, I.; Gabaldón, J.A.; Núñez-Delicado, E. Use of cyclodextrins to recover catechin and epicatechin from red grape pomace. Food Chem. 2016, 203, 379–385. [Google Scholar] [CrossRef]
- Grigorakis, S.; Benchennouf, A.; Halahlah, A.; Makris, D.P. High-performance green extraction of polyphenolic antioxidants from Salvia fruticosa using cyclodextrins: Optimization, kinetics, and composition. Appl. Sci. 2020, 10, 3447. [Google Scholar] [CrossRef]
- Lakka, A.; Lalas, S.; Makris, D.P. Development of a low-temperature and high-performance green extraction process for the recovery of polyphenolic phytochemicals from waste potato peels using hydroxypropyl β-cyclodextrin. Appl. Sci. 2020, 10, 3611. [Google Scholar] [CrossRef]
- Lakka, A.; Lalas, S.; Makris, D.P. Hydroxypropyl-β-cyclodextrin as a green co-solvent in the aqueous extraction of polyphenols from waste orange peels. Beverages 2020, 6, 50. [Google Scholar] [CrossRef]
- Kaltsa, O.; Lakka, A.; Grigorakis, S.; Karageorgou, I.; Batra, G.; Bozinou, E.; Lalas, S.; Makris, D.P. A green extraction process for polyphenols from elderberry (Sambucus nigra) flowers using deep eutectic solvent and ultrasound-assisted pretreatment. Molecules 2020, 25, 921. [Google Scholar] [CrossRef] [PubMed] [Green Version]
- Kimura, T.; Sakamoto, T.; Leveque, J.-M.; Sohmiya, H.; Fujita, M.; Ikeda, S.; Ando, T. Standardization of ultrasonic power for sonochemical reaction. Ultrason. Sonochem. 1996, 3, 157–161. [Google Scholar] [CrossRef]
- Trasanidou, D.; Apostolakis, A.; Makris, D.P. Development of a green process for the preparation of antioxidant and pigment-enriched extracts from winery solid wastes using response surface methodology and kinetics. Chem. Eng. Com. 2016, 203, 1317–1325. [Google Scholar] [CrossRef]
- Cicco, N.; Lanorte, M.T.; Paraggio, M.; Viggiano, M.; Lattanzio, V. A reproducible, rapid and inexpensive Folin–Ciocalteu micro-method in determining phenolics of plant methanol extracts. Microchem. J. 2009, 91, 107–110. [Google Scholar] [CrossRef]
- Lakka, A.; Grigorakis, S.; Karageorgou, I.; Batra, G.; Kaltsa, O.; Bozinou, E.; Lalas, S.; Makris, D.P. Saffron processing wastes as a bioresource of high-value added compounds: Development of a green extraction process for polyphenol recovery using a natural deep eutectic solvent. Antioxidants 2019, 8, 586. [Google Scholar] [CrossRef] [PubMed] [Green Version]
- Makris, D.; Kefalas, P. Characterization of polyphenolic phytochemicals in red grape pomace. Int. J. Waste Res. 2013, 126. [Google Scholar] [CrossRef] [Green Version]
- Saokham, P.; Muankaew, C.; Jansook, P.; Loftsson, T. Solubility of cyclodextrins and drug/cyclodextrin complexes. Molecules 2018, 23, 1161. [Google Scholar] [CrossRef] [PubMed] [Green Version]
- Loukri, A.; Tsitlakidou, P.; Goula, A.; Assimopoulou, A.N.; Kontogiannopoulos, K.N.; Mourtzinos, I. Green extracts from coffee pulp and their application in the development of innovative brews. Appl. Sci. 2020, 10, 6982. [Google Scholar] [CrossRef]
- Rakotondramasy-Rabesiaka, L.; Havet, J.-L.; Porte, C.; Fauduet, H. Estimation of effective diffusion and transfer rate during the protopine extraction process from Fumaria officinalis L. Separ. Purif. Technol. 2010, 76, 126–131. [Google Scholar] [CrossRef]
- Nayak, A.; Bhushan, B.; Rosales, A.; Turienzo, L.R.; Cortina, J. Valorisation potential of Cabernet grape pomace for the recovery of polyphenols: Process intensification, optimisation and study of kinetics. Food Bioprod. Proc. 2018, 109, 74–85. [Google Scholar] [CrossRef]
- Elmi Kashtiban, A.; Esmaiili, M. Extraction of phenolic compounds from Siah-Sardasht grape skin using subcritical water and ultrasound pretreatment. J. Food Proc. Preserv. 2019, 43, 14071. [Google Scholar] [CrossRef]
- Alexandru, L.; Binello, A.; Mantegna, S.; Boffa, L.; Chemat, F.; Cravotto, G. Efficient green extraction of polyphenols from post-harvested agro-industry vegetal sources in Piedmont. Compt. Rendus Chim. 2014, 17, 212–217. [Google Scholar] [CrossRef]
- Mantegna, S.; Binello, A.; Boffa, L.; Giorgis, M.; Cena, C.; Cravotto, G. A one-pot ultrasound-assisted water extraction/cyclodextrin encapsulation of resveratrol from Polygonum cuspidatum. Food Chem. 2012, 130, 746–750. [Google Scholar] [CrossRef] [Green Version]
- Albahari, P.; Jug, M.; Radić, K.; Jurmanović, S.; Brnčić, M.; Brnčić, S.R.; Čepo, D.V. Characterization of olive pomace extract obtained by cyclodextrin-enhanced pulsed ultrasound assisted extraction. LWT 2018, 92, 22–31. [Google Scholar] [CrossRef]
- Tutunchi, P.; Roufegarinejad, L.; Hamishehkar, H.; Alizadeh, A. Extraction of red beet extract with β-cyclodextrin-enhanced ultrasound assisted extraction: A strategy for enhancing the extraction efficacy of bioactive compounds and their stability in food models. Food Chem. 2019, 297, 124994. [Google Scholar] [CrossRef]
- Chemat, F.; Rombaut, N.; Sicaire, A.-G.; Meullemiestre, A.; Fabiano-Tixier, A.-S.; Abert-Vian, M. Ultrasound assisted extraction of food and natural products. Mechanisms, techniques, combinations, protocols and applications. A review. Ultrason. Sonochem. 2017, 34, 540–560. [Google Scholar] [CrossRef]
- Wang, P.; Cheng, C.; Ma, Y.; Jia, M. Degradation behavior of polyphenols in model aqueous extraction system based on mechanical and sonochemical effects induced by ultrasound. Separ. Purif. Technol. 2020, 247, 116967. [Google Scholar] [CrossRef]
- Atanassova, D.; Kefalas, P.; Petrakis, C.; Mantzavinos, D.; Kalogerakis, N.; Psillakis, E. Sonochemical reduction of the antioxidant activity of olive mill wastewater. Environ. Int. 2005, 31, 281–287. [Google Scholar] [CrossRef]
- Brahim, M.; Gambier, F.; Brosse, N. Optimization of polyphenols extraction from grape residues in water medium. Ind. Crops Prod. 2014, 52, 18–22. [Google Scholar] [CrossRef]
- Galanakis, C.; Goulas, V.; Tsakona, S.; Manganaris, G.; Gekas, V. A knowledge base for the recovery of natural phenols with different solvents. Int. J. Food Prop. 2013, 16, 382–396. [Google Scholar] [CrossRef] [Green Version]
- Monrad, J.K.; Howard, L.R.; King, J.W.; Srinivas, K.; Mauromoustakos, A. Subcritical solvent extraction of anthocyanins from dried red grape pomace. J. Agric. Food Chem. 2010, 58, 2862–2868. [Google Scholar] [CrossRef] [PubMed]
- Rajha, H.N.; El Darra, N.; Hobaika, Z.; Boussetta, N.; Vorobiev, E.; Maroun, R.G.; Louka, N. Extraction of total phenolic compounds, flavonoids, anthocyanins and tannins from grape byproducts by response surface methodology. Influence of solid-liquid ratio, particle size, time, temperature and solvent mixtures on the optimization process. Food Nutr. Sci. 2014, 2014. [Google Scholar] [CrossRef] [Green Version]
- González-Centeno, M.; Comas-Serra, F.; Femenia, A.; Rosselló, C.; Simal, S. Effect of power ultrasound application on aqueous extraction of phenolic compounds and antioxidant capacity from grape pomace (Vitis vinifera L.): Experimental kinetics and modeling. Ultrason. Sonochem. 2015, 22, 506–514. [Google Scholar] [CrossRef] [PubMed] [Green Version]
- Pintać, D.; Majkić, T.; Torović, L.; Orčić, D.; Beara, I.; Simin, N.; Mimica–Dukić, N.; Lesjak, M. Solvent selection for efficient extraction of bioactive compounds from grape pomace. Ind. Crops Prod. 2018, 111, 379–390. [Google Scholar] [CrossRef]
- Sant’Anna, V.; Brandelli, A.; Marczak, L.D.F.; Tessaro, I.C. Kinetic modeling of total polyphenol extraction from grape marc and characterization of the extracts. Separ. Purif. Technol. 2012, 100, 82–87. [Google Scholar] [CrossRef]
- Duba, K.S.; Casazza, A.A.; Mohamed, H.B.; Perego, P.; Fiori, L. Extraction of polyphenols from grape skins and defatted grape seeds using subcritical water: Experiments and modeling. Food Bioprod. Proc. 2015, 94, 29–38. [Google Scholar] [CrossRef]
- Budryn, G.; Nebesny, E.; Pałecz, B.; Rachwał-Rosiak, D.; Hodurek, P.; Miśkiewicz, K.; Oracz, J.; Żyżelewicz, D. Inclusion complexes of β-cyclodextrin with chlorogenic acids (CHAs) from crude and purified aqueous extracts of green Robusta coffee beans (Coffea canephora L.). Food Res. Int. 2014, 61, 202–213. [Google Scholar] [CrossRef]
- Athanasiadis, V.; Lalas, S.; Makris, D.P. Effect of methyl β-cyclodextrin on radical scavenging kinetics of olive leaf extracts and interactions with ascorbic acid. ChemEngineering 2017, 1, 6. [Google Scholar] [CrossRef] [Green Version]
- Celik, S.E.; Özyürek, M.; Güçlü, K.; Apak, R. Antioxidant capacity of quercetin and its glycosides in the presence of β-cyclodextrins: Influence of glycosylation on inclusion complexation. J. Inclus. Phenom. Macr. Chem. 2015, 83, 309–319. [Google Scholar] [CrossRef]
- Shao, P.; Zhang, J.; Fang, Z.; Sun, P. Complexing of chlorogenic acid with β-cyclodextrins: Inclusion effects, antioxidative properties and potential application in grape juice. Food Hydrocol. 2014, 41, 132–139. [Google Scholar] [CrossRef]
- Medronho, B.; Valente, A.J.; Costa, P.; Romano, A. Inclusion complexes of rosmarinic acid and cyclodextrins: Stoichiometry, association constants, and antioxidant potential. Colloid Polym. Sci. 2014, 292, 885–894. [Google Scholar] [CrossRef]
- Çelik, S.E.; Özyürek, M.; Tufan, A.N.; Güçlü, K.; Apak, R. Spectroscopic study and antioxidant properties of the inclusion complexes of rosmarinic acid with natural and derivative cyclodextrins. Spectrochim. Acta A Mol. Biomol. Spectr. 2011, 78, 1615–1624. [Google Scholar] [CrossRef]
- Makris, D.P.; Psarra, E.; Kallithraka, S.; Kefalas, P. The effect of polyphenolic composition as related to antioxidant capacity in white wines. Food Res. Inter. 2003, 36, 805–814. [Google Scholar] [CrossRef]
- Kefalas, P.; Makris, D. Liquid chromatography-mass spectrometry techniques in flavonoid analysis: Recent advances. In Natural Antioxidant Phenols: Sources, Structure-Activity Relationship, Current Trends in Analysis and Characterisation; Boskou, D., Gerothanassis, I.P., Kefalas, P., Eds.; Research Signpost: Kerala, India, 2006; pp. 69–123. [Google Scholar]
- Villaño, D.; Fernández-Pachón, M.; Moyá, M.L.; Troncoso, A.; García-Parrilla, M. Radical scavenging ability of polyphenolic compounds towards DPPH free radical. Talanta 2007, 71, 230–235. [Google Scholar] [CrossRef] [PubMed]


| Independent Variables | Code Units | Coded Variable Level | ||
|---|---|---|---|---|
| −1 | 0 | 1 | ||
| RL/S (mL g−1) | X1 | 10 | 50 | 90 |
| CCD (%, w/w) | X2 | 0 | 0.75 | 1.50 |
| tUS (min) | X3 | 0 | 15 | 30 |
| Design Point | Independent Variables | Response | |||
|---|---|---|---|---|---|
| CCD (X1) | RL/S (X2) | tUS (X3) | YTP (mg GAE g−1 dm) | ||
| Measured | Predicted | ||||
| 1 | −1 | −1 | 0 | 20.45 | 18.91 |
| 2 | −1 | 1 | 0 | 16.67 | 15.58 |
| 3 | 1 | −1 | 0 | 16.84 | 17.93 |
| 4 | 1 | 1 | 0 | 23.00 | 24.54 |
| 5 | 0 | −1 | −1 | 23.20 | 23.34 |
| 6 | 0 | −1 | 1 | 29.47 | 29.78 |
| 7 | 0 | 1 | −1 | 25.56 | 25.25 |
| 8 | 0 | 1 | 1 | 31.29 | 31.15 |
| 9 | −1 | 0 | −1 | 20.89 | 22.29 |
| 10 | 1 | 0 | −1 | 22.00 | 20.77 |
| 11 | −1 | 0 | 1 | 21.71 | 22.94 |
| 12 | 1 | 0 | 1 | 33.86 | 32.46 |
| 13 | 0 | 0 | 0 | 23.69 | 23.76 |
| 14 | 0 | 0 | 0 | 23.76 | 23.76 |
| 15 | 0 | 0 | 0 | 23.83 | 23.76 |
| T (°C) | Kinetic Parameters and Activation Energy | ||
|---|---|---|---|
| k (min−1) | YTP(s) (mg GAE g−1) | Ea (kJ mol−1) | |
| 40 | 0.108 ± 0.010 | 39.64 ± 3.40 | 10.95 ± 1.11 |
| 50 | 0.112 ± 0.011 | 42.10 ± 3.92 | |
| 60 | 0.126 ± 0.010 | 44.86 ± 4.00 | |
| 70 | 0.138 ± 0.012 | 48.28 ± 3.93 | |
| 80 | 0.172 ± 0.014 | 57.47 ± 5.10 | |
| Compound | Yield (μg g−1 dm) | ||
|---|---|---|---|
| Water | β-CD | AqEt | |
| Gallic acid | 153.43 ± 3.84 | 103.37 ± 3.62 | 224.56 ± 9.66 |
| Caftaric acid | 157.09 ± 3.93 | 155.30 ± 5.44 | 158.98 ± 6.84 |
| Catechin | 163.12 ± 4.08 | 506.54 ± 17.73 | 265.34 ± 11.41 |
| Rutin | 27.74 ± 1.69 | 26.90 ± 1.94 | 58.18 ± 2.50 |
| Malvidin 3-O-glucoside p-coumarate | 148.56 ± 5.71 | 157.89 ± 5.53 | 713.39 ± 30.68 |
| Quercetin | 91.19 ± 2.34 | 151.17 ± 5.29 | 254.17 ± 10.93 |
| Sum | 972.22 | 1101.16 | 1674.62 |
Publisher’s Note: MDPI stays neutral with regard to jurisdictional claims in published maps and institutional affiliations. |
© 2021 by the authors. Licensee MDPI, Basel, Switzerland. This article is an open access article distributed under the terms and conditions of the Creative Commons Attribution (CC BY) license (https://creativecommons.org/licenses/by/4.0/).
Share and Cite
Alibante, A.; Lakka, A.; Bozinou, E.; Chatzilazarou, A.; Lalas, S.; Makris, D.P. Integrated Green Process for the Extraction of Red Grape Pomace Antioxidant Polyphenols Using Ultrasound-Assisted Pretreatment and β-Cyclodextrin. Beverages 2021, 7, 59. https://0-doi-org.brum.beds.ac.uk/10.3390/beverages7030059
Alibante A, Lakka A, Bozinou E, Chatzilazarou A, Lalas S, Makris DP. Integrated Green Process for the Extraction of Red Grape Pomace Antioxidant Polyphenols Using Ultrasound-Assisted Pretreatment and β-Cyclodextrin. Beverages. 2021; 7(3):59. https://0-doi-org.brum.beds.ac.uk/10.3390/beverages7030059
Chicago/Turabian StyleAlibante, Aggeliki, Achillia Lakka, Eleni Bozinou, Arhontoula Chatzilazarou, Stavros Lalas, and Dimitris P. Makris. 2021. "Integrated Green Process for the Extraction of Red Grape Pomace Antioxidant Polyphenols Using Ultrasound-Assisted Pretreatment and β-Cyclodextrin" Beverages 7, no. 3: 59. https://0-doi-org.brum.beds.ac.uk/10.3390/beverages7030059