
Consumer Perception of Milk and Plant-Based Alternatives Added to Coffee
by
 ,
,
Mackenzie Gorman
 ,
,
Sophie Knowles
,
Anika Falkeisen
,
Sophie Barker
,
Rachael Moss
and
Matthew B. McSweeney
* School of Nutrition and Dietetics, Acadia University, Wolfville, NS B4P 2R6, Canada
*
Author to whom correspondence should be addressed.
Beverages 2021, 7(4), 80; https://0-doi-org.brum.beds.ac.uk/10.3390/beverages7040080
Submission received: 12 November 2021
/
Revised: 15 December 2021
/
Accepted: 16 December 2021
/
Published: 20 December 2021
(This article belongs to the Special Issue Plant-Based Beverages: Consumer Perception, Motivation and Demand in a Fast-Rising Market)
Abstract
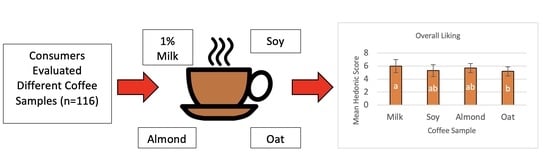
:Consumers have begun to use plant-based alternatives (PBAs) in their coffee instead of dairy products. PBAs can include soy milk, rice milk, coconut milk, almond milk, oat milk, and hemp milk. The objective of this study was to investigate consumer acceptability and sensory perception of coffee with added dairy milk and added oat, soy, and almond PBAs. Consumers (n = 116) that frequently add milk to their coffee (n = 58) and consumers that usually use PBAs (n = 58) were recruited to participate in the study. They evaluated four different coffee samples with the addition of dairy milk as well as soy, almond, and oat PBAs. Overall, the consumers liking increased when they perceived sweetness in their coffee. The plant consumers (usually added PBAs to their coffee) liked the milk addition significantly less than the dairy consumers (usually added dairy to their coffee). In addition, the plant consumers were able to differentiate between the almond and soy PBAs, while the dairy consumers grouped them together. More studies need to be completed to investigate a wider range of PBAs, dairy products, and varieties of coffee.
1. Introduction
Coffee is a beverage prepared from the extract of roasted coffee beans that is widely consumed around the world [1]. There are many different extraction and brewing methods used to produce coffee, which are based on cultural, social, and geographical contexts [2]. It is important to recognise that coffee is one of the most popular beverages in the world [3] and is grown in many tropical countries [4]. The sensory properties of coffee have been well studied [5,6,7,8,9] and the overall characteristics of coffee have been identified as fragrance and aroma, acidity, body, flavour, aftertaste, and balance [3]. Furthermore, coffee can be evaluated using a cupping procedure or using trained panellists [6]. Many studies have investigated the consumer acceptability of different coffees [10,11,12,13]. To enhance sweetness, consumers also add milk or cream to their coffee [14]. As many different plant-based alternatives are becoming more popular [15], consumers have begun to use plant-based or non-dairy alternatives in their coffee.
Plant-based milk alternatives (PBAs) are the fastest-growing segment in the food product development category of functional and specialty beverages [16]. Consumer uptake in PBAs may be due to allergies to dairy or being lactose intolerant. It could also be due to calorie counting, hypercholesterolemia prevalence, vegan diets, as well as concerns about sustainability [15,16,17,18]. PBAs can include soy milk, rice milk, coconut milk, almond milk, oat milk, and hemp milk [19]. However, more studies need to be done to create PBAs that are comparable to dairy milk in terms of sensory properties and functionality [16].
The soybean has been a staple of the human diet in Asia, especially in soy milk or tofu [20]. Soy protein is an inexpensive source of high-nutritional protein and is the predominant commercially available vegetable protein around the world [21]. Although soy milk is a popular alternative to dairy and is a nutrient-rich beverage [21], Western world consumers have identified off-flavours in soy milk including a beany flavour, along with a bitter taste [22,23]. In addition to soy milk, other PBAs have been developed, including almond milk [24] and oat milk [25]. Almond milk is derived from almonds, which are nutrient-dense as well as an excellent source of vitamin E and protein [26]. Although nutritionally dense, almond milk is associated with some unacceptable sensory properties [27]. Oat milk is another PBA that has been associated with many health benefits, including dietary fibre, phytochemicals, and its overall nutritive value [19]. Oats are also known to reduce blood cholesterol levels as well as insulin and glucose responses [28]. For products to be successful, they need to be functional and acceptable to consumers.
For PBAs to be successful on the market, the products first need to be acceptable to consumers. To determine the acceptability of food items, nine-point hedonic scales are usually used [29]. Overall liking or acceptability is ultimately driven by the food item’s sensory properties [29], and the sensory properties consumers perceive should be investigated. As stated above, the main sensory characteristics of coffee are fragrance and aroma, acidity, body, flavour, aftertaste, and balance [3]. Consumers add milk or cream to increase the sweetness of the coffee [14]. However, if consumers are using PBAs in their coffee, this can also introduce new flavours including beany, earthy, grassy and other off-flavours, which may detract from consumers’ liking of the coffee. As such, check-all-that-apply (CATA) will be used in this study to evaluate the consumers’ sensory perception. CATA and hedonic scales can effectively evaluate consumers’ perception and acceptability of food products [30]. The CATA method presents participants with samples and a list of descriptors to describe the samples [31]. Then, the participants try the sample and select all the descriptors they think are applicable to the product [31]. CATA is combined with hedonic scales to help with product optimisation [32]. This methodology is easy and intuitive for untrained participants or consumers, [30] and the CATA question does not influence the consumers’ hedonic responses [32]. Penalty analysis can also be applied to the results of hedonic scales and a CATA question to guide product improvement [33].
Past research has identified the sensory properties of different PBAs; this study aims to build on this research by evaluating PBAs addition to coffee and the resulting sensory properties. In addition, this study aims to evaluate how consumers who are familiar with PBAs differ from those consumers who usually consume dairy products. In this context, consumers used CATA and hedonic scales to evaluate the acceptability of PBAs and milk addition to coffee.
2. Materials and Methods
2.1. Participants
Approval for the study was received from the Acadia University Research Ethics Board (REB 13–72). The participants were recruited from the Wolfville, Nova Scotia community. All participants self-identified as frequent consumers of coffee and did not work in the coffee industry. All participants regularly added dairy products or PBAs to their coffee. Half (50%) of participants regularly used dairy milk, while the other 50% regularly used a PBA in their coffee. The demographics of the participants are presented in Table 1. In total, 116 coffee consumers participated in the consumer acceptability trial. The study design was created based on the recommendations by Hough et al. [34]. All the participants were renumerated with a $10 dollar gift card for their participation in the study.
2.2. Testing Environment
All testing was completed at the Centre for the Sensory Research of Food at Acadia University. The trials took place in individual sensory booths under white fluorescent light and at a temperature of 25 °C. The testing took place over three consecutive days.
2.3. Samples and Sample Presentation
The milk and PBAs were purchased from local grocery stores and were stored in the fridge (4 °C) until ten minutes before testing. The ingredients are listed in Table 2. A commercially available coffee was purchased from a local grocery store and was brewed using a flat-bottom basket in a brewing machine. All coffee was brewed and served fresh for each session of sensory testing. Coffee was prepared in a brewing machine using 1200 g of water and 66 g of coffee in a brew basket [10]. Then, the coffee was served in a 200 mL ceramic mug (8 cm height, 7.5 cm opening diameter, and 5.5 bottom diameter) and was preheated following the procedure by Frost et al. [10]. Approximately 100 g of coffee was poured into the cup, and the milk or PBA (10 g) was added to the coffee. The coffee temperature was monitored by a research assistant using a handheld thermocouple and was served at approximately 65 °C [10]. As suggested by Frost et al. [10], coffee was presented in a sequential, monadic order. The four coffee samples were labelled with random three-digit codes identified on the mug and a placemat. Each participant was also provided with a glass of distilled water to cleanse their palate.
2.4. Procedure
The participants first completed an informed consent form and were then presented with the different coffee samples as described in the sample presentation above. First, the participants evaluated the different samples for their liking of the appearance, flavour, mouthfeel, and overall liking using nine-point hedonic scales (1 = Dislike Extremely, 5 = Neither Like nor Dislike, 9 = Like Extremely). After the hedonic scales, the participants were presented with a CATA question. Following the method by Ares et al. [35], the sensory properties listed in the CATA question were randomised. The CATA question focused on the flavour attributes of the samples and included sweet, aftertaste, bitter, fruity, roasted, creamy, beany, vegetative, floral, acidic, grassy, vanilla, earthy, nutty, burnt, caramel, chemical, metallic, strong aftertaste, no aftertaste, sour, astringent, smoky, pungent, chocolate, and musty. The sensory properties included were based on a literature review [6,10,21,22,24,25,36,37,38,39] and evaluations by research associates experienced in sensory analysis. The participants were asked to select all terms listed in the CATA question they perceived in the sample using the Compusense Cloud software (Guelph, Ontario, Canada). The participants also answered demographic questions.
2.5. Statistical Analysis
The results from the hedonic scales were assessed using a two-way random factor ANOVA and Tukey’s HSD test. The results of the CATA question were assessed using a contingency table and Cochran’s Q test. If there was a significant difference among the attributes, then post hoc multiple pairwise comparisons were conducted using McNemar’s test with Bonferroni alpha adjustment. Correspondence analysis (CA) was performed on the total frequency count of the sensory properties. CA is used to visualise a contingency table and is considered a generalisation of principal component analysis for ordinary data [40]. The CA projects the data into orthogonal components to maximise the representation of the variation in the data. Usually, only the first two components are displayed [40]. A penalty analysis was conducted using the overall liking scores and results from the CATA question. The participants were segmented into two groups based on their regular addition of milk or PBAs to their coffee in their daily life (Table 1). Those that usually add a dairy product (1% milk, 2% milk, skim milk, half-and-half, cream) to their coffee were placed in the “dairy consumers” group, and those that use PBAs (soy, almond, oat, other PBA) were placed in the “plant consumers” group. To determine any significant differences in liking between the two participant segments, t-tests (p = 0.05) were performed. Statistical analysis of the responses to the CATA question from each participant segment was performed. All analyses were completed using XLSTAT software (Version, 2021.2, New York, NY, USA) in Microsoft ExcelTM.
3. Results and Discussion
The mean hedonic scores are listed in Table 3. There was not a significant difference in the mouthfeel of the different coffee samples (p < 0.05). However, the addition of the oat PBA significantly impacted the consumers’ liking of the appearance, the flavour of the coffee samples, and their overall liking. Their overall liking of the oat sample was significantly less than the coffee with the milk addition (p < 0.05). However, the oat sample was not significantly different from the coffee with almond and soy alternatives. Oat PBA is the most recent addition to the market in this study, and as seen in Table 1, only 11% of the participants regularly consumed the oat-based PBA. This lack of familiarity may have contributed to participants disliking, as familiarity has been found to increase consumer acceptability [41,42]. Though soy and almond milk have been associated with beany or off-flavours in past studies [16,23,43], they were not significantly different from the dairy milk in the participants’ liking of flavour, mouthfeel, and overall liking (p < 0.05). Since these PBAs were added to coffee, it may have minimised the off-flavours the consumers perceived. Additionally, the consumers may be more familiar with soy and almond milk (Table 1), and therefore, the off-flavours did not impact their hedonic scores.
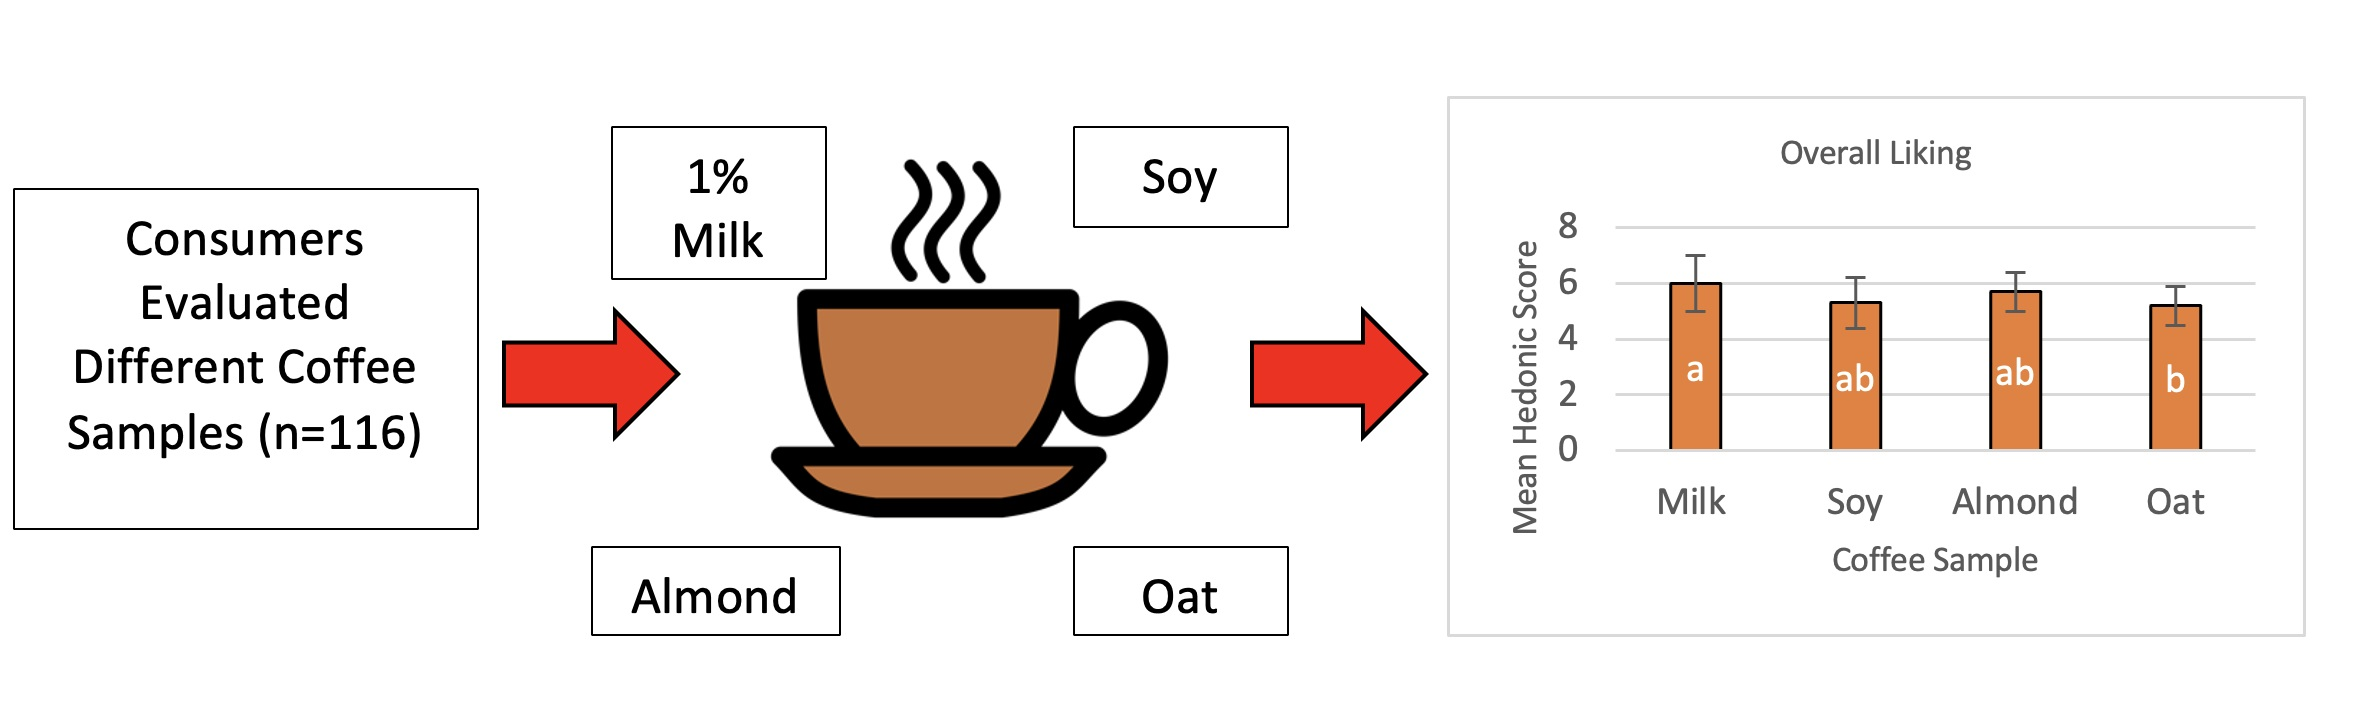
The results of the CATA question were interpreted using correspondence analysis (CA), as seen in Figure 1A. The first two dimensions of the CA explained 86.6% of the variation, with 49.2% on the first dimension and 37.4% on the second dimension. The first dimension separated the milk from the oat, almond, and soy PBAs. The milk–coffee sample was associated with chocolate, sweet, vanilla, aftertaste, floral, roasted and astringent. The second dimension separated the oat PBA from the almond and soy PBAs. The oat PBA was associated with acid, musty, burnt, smoky, caramel, creamy, nutty and no aftertaste. The almond and soy PBAs were associated with a strong aftertaste, pungent, bitter, sour, vegetative, grassy, and metallic attributes. Overall, the first dimension separated the samples based on their sweetness or sourness. The second dimension was driven by the nutty and smoky attributes on the positive side of the dimension, and bitter, pungent, and fruity on the negative side. The PBAs also contributed to flavours that have been commonly associated with these products and that are not well-liked by consumers in coffee, such as grassy, vegetative, burnt, chemical, and earthy [44,45,46,47].
The results of the CATA question were combined with overall liking scores to conduct a penalty lift analysis (Figure 1B). The sweet attribute drove consumer liking of the coffee samples, while pungent, grassy, earthy, beany, and sour all drove disliking of the samples. The coffee with the milk addition was associated with the sweet attribute (Figure 1A) and had the highest overall liking scores (Table 3). Sweetness increases consumers’ liking of many food products [48,49], including coffee and coffee-flavoured dairy beverages [10,50,51]. All the sensory properties that detracted from consumer liking were associated with the PBAs (Figure 1A).
The participants were segmented into two different consumer groups (dairy consumers and plant consumers) based on if they regularly add dairy products or PBAs to their coffee. As stated above, familiarity affects consumer liking, and this segmentation was used to investigate how frequent and non-frequent PBA consumers evaluate the PBA addition to coffee. The consumer liking scores for the two different consumer groups are shown in Table 4, and both consumers groups included 58 participants. The dairy consumers significantly liked the dairy milk and almond PBA more than the soy and oat PBAs (p < 0.05). They also liked the flavour of the dairy milk significantly more than the soy and oat alternatives (p < 0.05). Lastly, the dairy consumers liked the appearance and mouthfeel of the coffee with the oat alternative significantly less than the dairy milk (p < 0.05).
The consumers that frequently used PBAs or plant consumers as identified in Table 4 did not identify any significant differences in any of the coffee samples for their liking of the appearance, flavour, mouthfeel, or overall liking (p < 0.05). However, when the scores were compared between the two consumer groups, the plant consumers liked the flavour and mouthfeel of the dairy milk sample less than the dairy consumers (p < 0.05). Furthermore, their overall liking of the milk sample was significantly less than dairy consumers (p < 0.05). Consumers who regularly consume PBAs have different motives for their consumption of PBAs [17]. This may have affected their sensory perception of the samples, as familiarity has been shown to lead to increased consumer acceptability [41,42]. Therefore, this may have increased their liking scores of the samples with the PBAs. A limitation of this study is that consumers who avoid dairy for different reasons (e.g., beliefs, lactose intolerance) were not included in this study, as the participants were asked to consume milk as well as PBAs. If participants who avoided dairy were included, the hedonic scores for the PBAs may have differed.
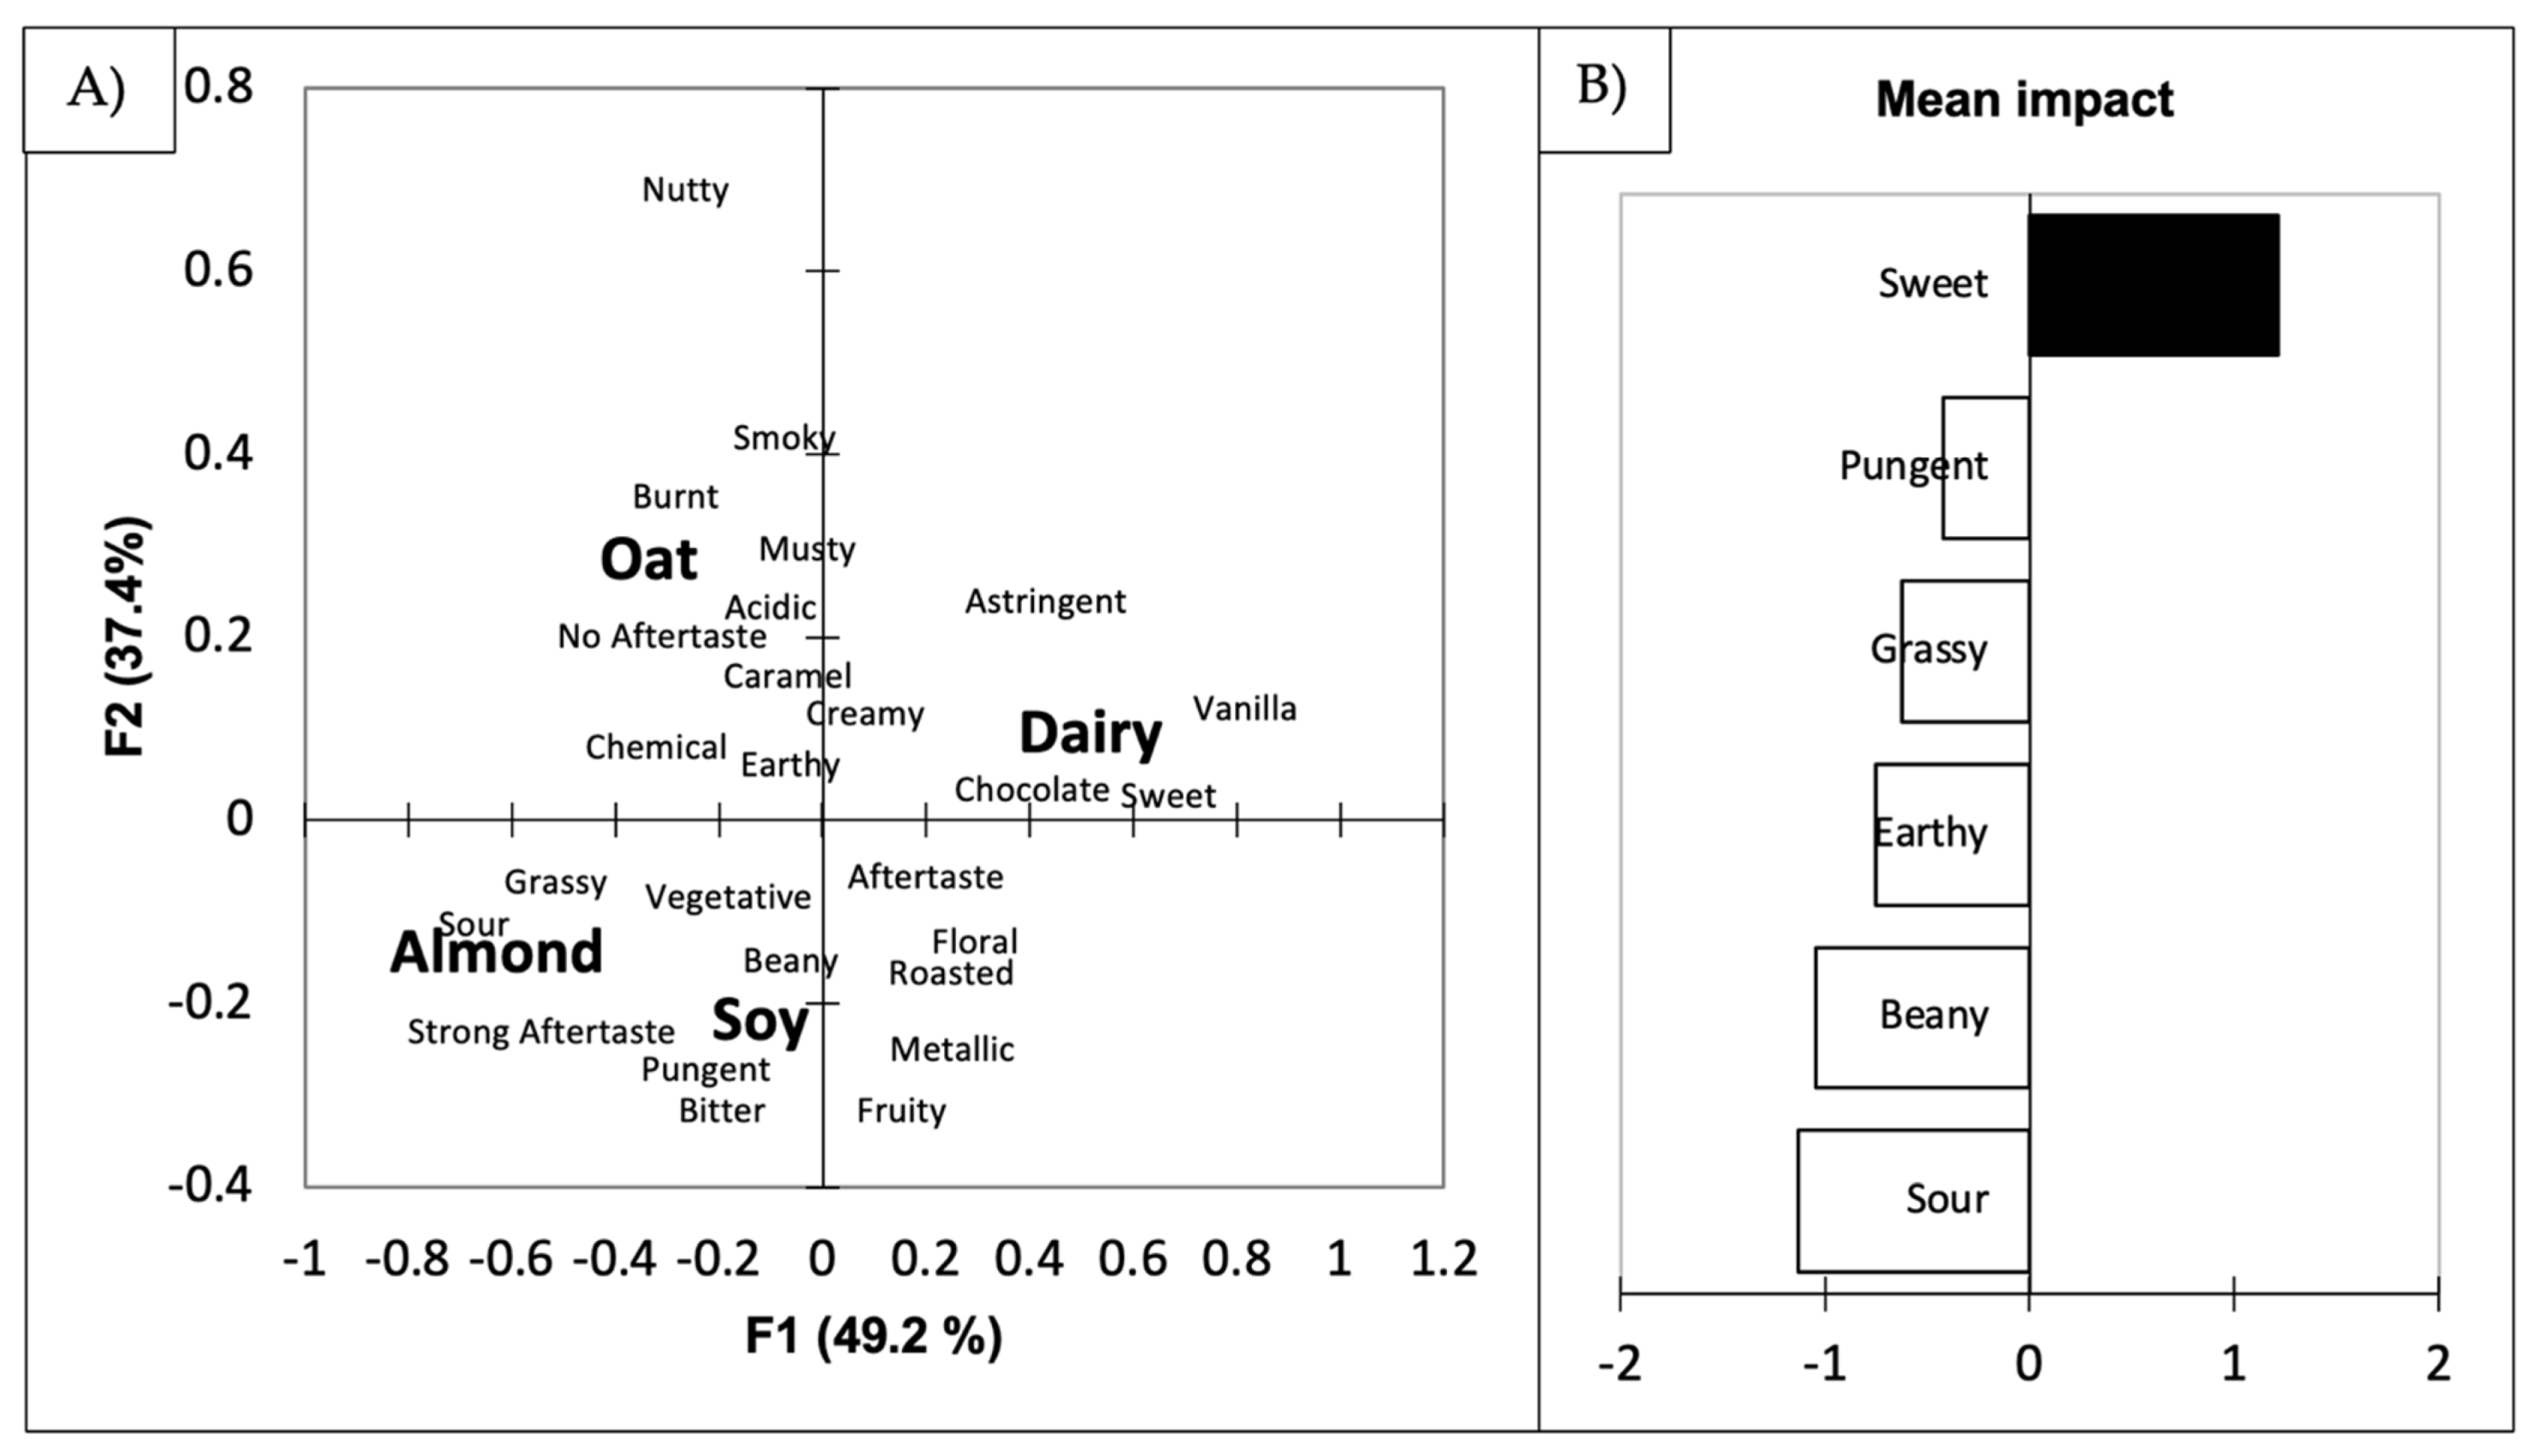
The responses from each consumer group (plant and dairy) were evaluated using correspondence analysis and penalty lift analysis (Figure 2 and Figure 3). The dairy consumers’ CA explained 84.3% of the variation (50.1% on the first dimension and 34.2% on the second dimension). The dairy consumers separated the milk from the PBAs and the oat PBA from the almond and milk (Figure 2A). The milk was associated with chocolate, vanilla, floral, sweet, and astringent attributes, while the oat PBA was associated with the burnt, nutty, caramel, musty, and chemical attributes. The soy and almond PBA were grouped and associated with beany, grassy, vegetative, sour, bitter, pungent, and strong aftertaste. In agreement with this study, soy and almond products have been identified as having an aftertaste [22,23,52]. The results of the CATA question were also used to conduct a penalty lift analysis (Figure 2B). The attribute that the dairy consumers associated with the milk added to the coffee sample (sweet, vanilla, and floral) drove their liking of the samples and grassy, sour, and beany all detracted from their liking—these attributes were associated with the almond and soy PBAs (Figure 2B).
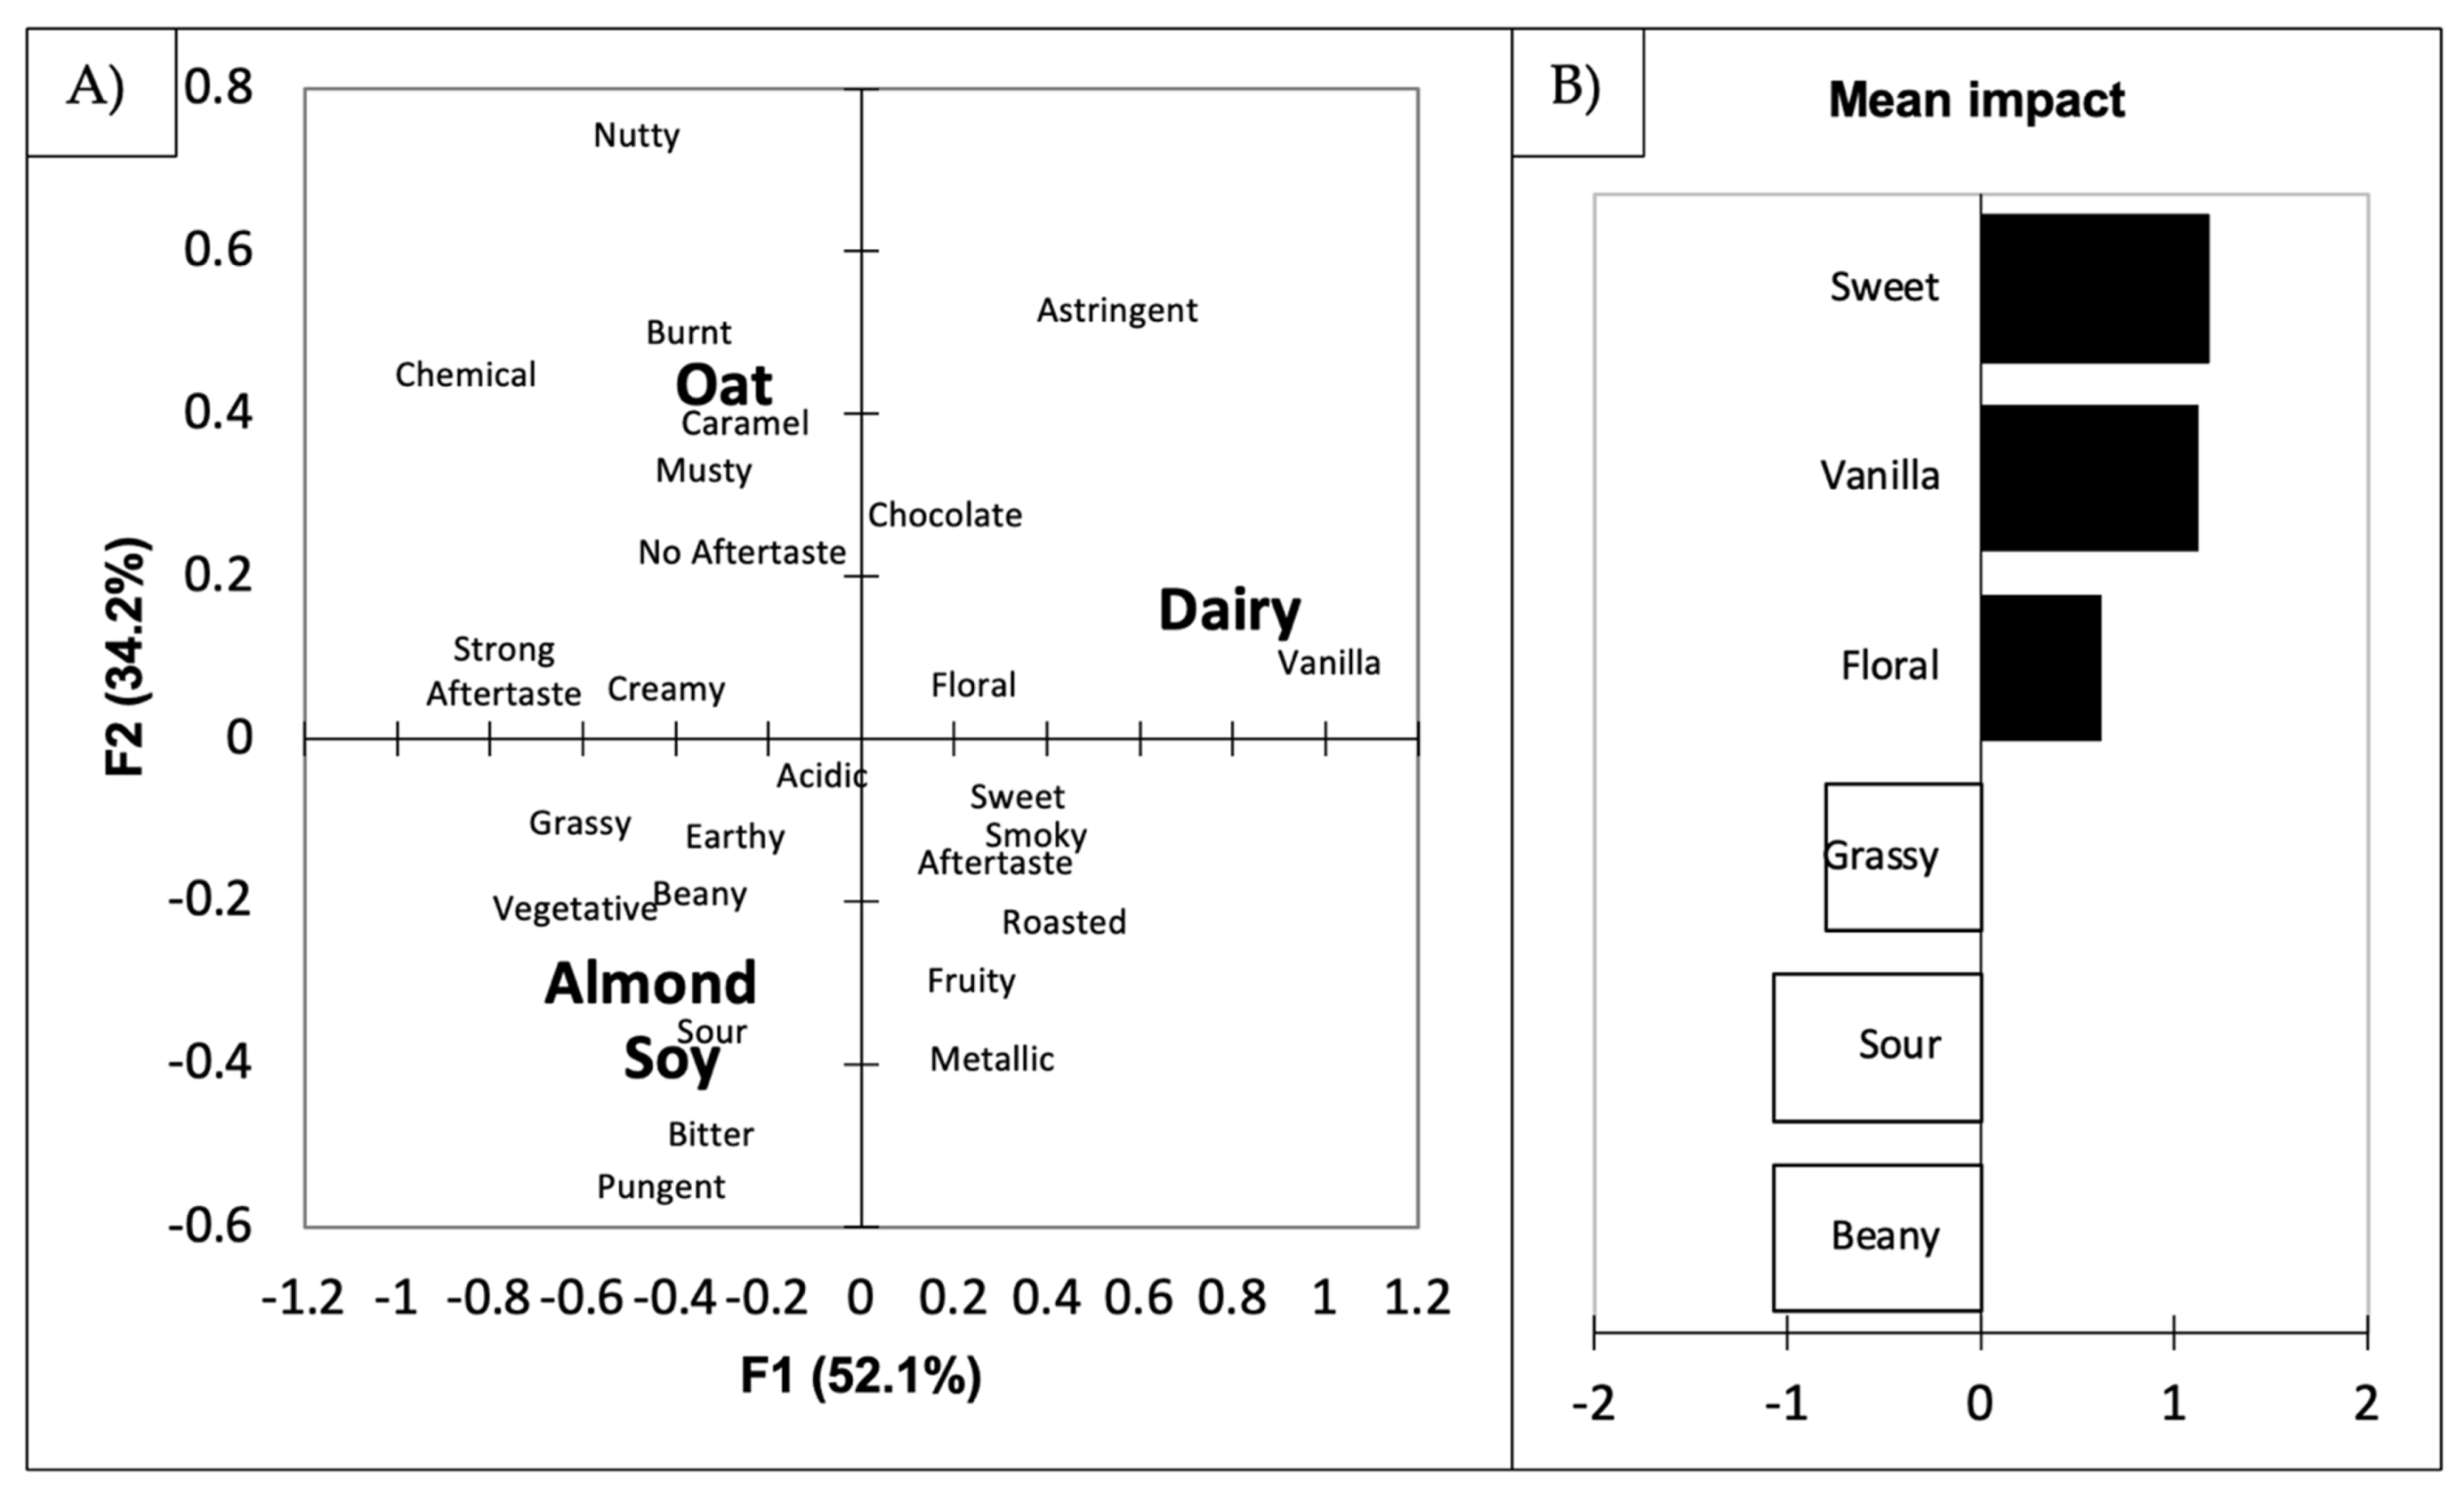
The responses from the plant consumers were assessed using correspondence analysis and penalty lift analysis (Figure 3). The CA explained 86.5% of the variation on the first two dimensions of the biplot. The milk and oat PBA were separated from the soy and almond PBAs. However, the plant consumers also separated the soy and almond PBA from each other. The soy PBA was associated with a strong aftertaste, pungent, bitter, grassy, fruity, caramel, and roasted attributes, while the almond PBA was associated with nutty, chocolate, floral, and beany attributes. This result was probably due to the consumers’ familiarity with the PBAs, as they were able to discriminate between the different products. This result has previously been found in a consumer perception study with red wine, as product familiarity allowed the participants to effectively differentiate the wine samples [53].
The penalty lift analysis also identified that sweetness drove consumer liking, as was seen with the dairy consumers. However, the other attributes that drove liking that differed from the dairy consumers were roasted, chocolate, nutty, and vegetative, which drove the liking of the coffee samples. Roasted, chocolate, and nutty attributes have been liked by coffee consumers in previous studies [11,54]. Vegetal has been found in other studies of coffee [36,55], but it is not usually found to improve consumer acceptability. Beany, earthy, sour, bitter, and aftertaste attributes were found to detract from liking. As discussed previously, beany and aftertaste are usually associated with soy products [37,43]. Sour is mainly disliked by coffee consumers; however, it has been identified to be liked by some consumers who are attracted to “extreme” sensory profiles [45]. Although these results are based on a small sample size (n = 58 for each consumer group), they identify exploratory results on how consumers (based on familiarity) differ in their evaluation of PBAs. Future studies should be completed to confirm these results.
Overall, the study was able to evaluate the consumer acceptability of milk and PBAs when they are added to coffee. However, there are some limitations to the study. All of the participants had to be willing to consume milk; therefore, the study did not include vegan consumers, who are a main user of PBAs. Additionally, the participants may not have known the definition of the attributes used in the CATA question. Future studies may want to provide definitions of the attributes in the CATA question or train the participants on the different terms. The same amount of milk and PBAs was added to each sample, but more or less dairy milk or PBA may have led to different results. The amount of milk or PBA added to the coffee was also controlled by the researchers. If the consumers were able to add their desired amount of dairy milk or PBA to the coffee, the results may have differed. Furthermore, the researchers could have identified how much milk or PBA consumers think is appropriate to add to coffee. Lastly, only one type of dairy and three types of PBAs were included in this study. There are many more dairy and PBA products that should be investigated for their sensory properties, as well as their addition to coffee, and their effect on the coffees’ sensory properties.
4. Conclusions
The coffee sample with the milk addition was liked more than the coffee with the oat alternative. For all consumers, the sweet attribute drove their liking of the coffee samples. Flavours such as pungent, grassy, earthy, beany, and sour detracted from the acceptability of the coffee samples. When the consumers were segmented based on their use of dairy products or PBAs in their coffee, the plant consumers liked the coffee with milk addition significantly less than dairy consumers; they also liked the mouthfeel and flavour of the samples less. The plant consumers were able to differentiate between the almond and soy PBAs when they were added to coffee, while the dairy consumers were unable to do so. These results indicate that consumers are seeking out PBAs (to put in their coffee) that have similar sensory properties to their dairy-based counterparts. To overcome some of the limitations listed above (small number of PBAs included, small sub sample groups), future research should include a wider range of PBAs, dairy products, and coffee varieties; it should also investigate the amount of PBA that is usually added to coffee compared to dairy milk. Future studies could also specifically investigate the aftertaste of the coffee after PBA or milk addition, as it was identified as important to consumers in this study. Lastly, future research should further investigate the difference in preferences between consumers of plant-based alternatives and dairy consumers. These findings are relevant to those creating new PBAs, as the results identify what sensory properties are important to consumers and indicate which properties may be detracting from consumer acceptability.
Author Contributions
Conceptualisation R.M. and M.B.M.; methodology, M.B.M.; software, M.B.M.; validation, R.M., S.B., M.G., A.F., S.K. and M.B.M.; formal analysis, R.M., S.B., M.G., A.F., S.K. and M.B.M.; investigation, R.M., S.B., M.G., A.F., S.K. and M.B.M.; resources, M.B.M.; data curation, M.B.M.; writing—original draft preparation, R.M., S.B., M.G., A.F. and S.K.; writing—review and editing, M.B.M.; visualisation, M.B.M.; supervision, M.B.M.; project administration, M.B.M.; funding acquisition, M.B.M. All authors have read and agreed to the published version of the manuscript.
Funding
This research was funded by the Centre for the Sensory Research of Food.
Institutional Review Board Statement
The study was conducted according to the guidelines of the Declaration of Helsinki and approved by the Acadia University Research Ethics Board (REB 13-72).
Informed Consent Statement
Informed consent was obtained from all subjects involved in the study.
Data Availability Statement
The data presented in this study are available on request from the corresponding author. The data are not publicly available to maintain the confidentiality of participants.
Acknowledgments
Thanks to all the volunteers who participated in this project.
Conflicts of Interest
The authors declare no conflict of interest.
References
- Gloess, A.N.; Schönbächler, B.; Klopprogge, B.; Lucio, D.; Chatelain, K.; Bongartz, A.; Strittmatter, A.; Rast, M.; Yeretzian, C. Comparison of nine common coffee extraction methods: Instrumental and sensory analysis. Eur. Food Res. Technol. 2013, 236, 607–627. [Google Scholar] [CrossRef] [Green Version]
- López-Galilea, I.; De Peña, M.P.; Cid, C. Correlation of Selected Constituents with the Total Antioxidant Capacity of Coffee Beverages: Influence of the Brewing Procedure. J. Agric. Food Chem. 2007, 55, 6110–6117. [Google Scholar] [CrossRef]
- Chambers, E.; Sanchez, K.; Phan, U.X.T.; Miller, R.; Civille, G.V.; Donfrancesco, B.D. Development of a “living” lexicon for descriptive sensory analysis of brewed coffee. J. Sens. Stud. 2016, 31, 465–680. [Google Scholar] [CrossRef]
- Carr, M.K.V. The water relations and irrigation requirements of coffee. Exp. Agric. 2001, 37, 1–36. [Google Scholar] [CrossRef]
- Thurston, R.W.; Morris, J.; Steiman, S. Coffee: A Comprehensive Guide to the Bean, the Beverage, and the Industry; Rowman & Littlefield Publishers: Washington, DC, USA, 2013; 433p. [Google Scholar]
- Di Donfrancesco, B.; Gutierrez Guzman, N.; Chambers IV, E. Comparison of Results from Cupping and Descriptive Sensory Analysis of Colombian Brewed Coffee. J. Sens. Stud. 2014, 29, 301–311. [Google Scholar] [CrossRef] [Green Version]
- Chapko, M.J.; Seo, H.-S. Characterizing product temperature-dependent sensory perception of brewed coffee beverages: Descriptive sensory analysis. Food Res. Int. 2019, 121, 612–621. [Google Scholar] [CrossRef] [PubMed]
- Ribeiro, J.S.; Ferreira, M.M.C.; Salva, T.J.G. Chemometric models for the quantitative descriptive sensory analysis of Arabica coffee beverages using near infrared spectroscopy. Talanta 2011, 83, 1352–1358. [Google Scholar] [CrossRef] [Green Version]
- Sanz, C.; Maeztu, L.; Zapelena, M.J.; Bello, J.; Cid, C. Profiles of volatile compounds and sensory analysis of three blends of coffee: Influence of different proportions of Arabica and Robusta and influence of roasting coffee with sugar. J. Sci. Food Agric. 2002, 82, 840–847. [Google Scholar] [CrossRef]
- Frost, S.C.; Ristenpart, W.D.; Guinard, J.-X. Effect of Basket Geometry on the Sensory Quality and Consumer Acceptance of Drip Brewed Coffee. J. Food Sci. 2019, 84, 2297–2312. [Google Scholar] [CrossRef]
- Geel, L.; Kinnear, M.; de Kock, H.L. Relating consumer preferences to sensory attributes of instant coffee. Food Qual. Prefer. 2005, 16, 237–244. [Google Scholar] [CrossRef] [Green Version]
- Hayakawa, F.; Kazami, Y.; Wakayama, H.; Oboshi, R.; Tanaka, H.; Maeda, G.; Hoshino, C.; Iwawaki, H.; Miyabayashi, T. Sensory Lexicon of Brewed Coffee for Japanese Consumers, Untrained Coffee Professionals and Trained Coffee Tasters. J. Sens. Stud. 2010, 25, 917–939. [Google Scholar] [CrossRef]
- Giacalone, D.; Degn, T.K.; Yang, N.; Liu, C.; Fisk, I.; Münchow, M. Common roasting defects in coffee: Aroma composition, sensory characterization and consumer perception. Food Qual. Prefer. 2019, 71, 463–474. [Google Scholar] [CrossRef] [Green Version]
- Lee, H.S.; O’Mahony, M. At What Temperatures Do Consumers Like to Drink Coffee?: Mixing Methods. J. Food Sci. 2002, 67, 2774–2777. [Google Scholar] [CrossRef]
- McCarthy, K.S.; Parker, M.; Ameerally, A.; Drake, S.L.; Drake, M.A. Drivers of choice for fluid milk versus plant-based alternatives: What are consumer perceptions of fluid milk? J. Dairy Sci. 2017, 100, 6125–6138. [Google Scholar] [CrossRef]
- Sethi, S.; Tyagi, S.K.; Anurag, R.K. Plant-based milk alternatives an emerging segment of functional beverages: A review. J. Food Sci. Technol. 2016, 53, 3408–3423. [Google Scholar] [CrossRef]
- Haas, R.; Schnepps, A.; Pichler, A.; Meixner, O. Cow Milk versus Plant-Based Milk Substitutes: A Comparison of Product Image and Motivational Structure of Consumption. Sustainability 2019, 11, 5046. [Google Scholar] [CrossRef] [Green Version]
- Pimentel, D.; Pimentel, M. Sustainability of meat-based and plant-based diets and the environment. Am. J. Clin. Nutr. 2003, 78, 660S–663S. [Google Scholar] [CrossRef]
- Chalupa-Krebzdak, S.; Long, C.J.; Bohrer, B.M. Nutrient density and nutritional value of milk and plant-based milk alternatives. Int. Dairy J. 2018, 87, 84–92. [Google Scholar] [CrossRef]
- Liu, K. Chemistry and Nutritional Value of Soybean Components. In Soybeans: Chemistry, Technology, and Utilization [Internet]; Liu, K., Ed.; Springer: Boston, MA, USA, 1997. [Google Scholar]
- Ma, L.; Li, B.; Han, F.; Yan, S.; Wang, L.; Sun, J. Evaluation of the chemical quality traits of soybean seeds, as related to sensory attributes of soymilk. Food Chem. 2015, 173, 694–701. [Google Scholar] [CrossRef] [Green Version]
- Torres-Penaranda, A.V.; Reitmeier, C.A. Sensory Descriptive Analysis of Soymilk. J. Food Sci. 2001, 66, 352–356. [Google Scholar] [CrossRef]
- Torres-Penaranda, A.V.; Reitmeier, C.A.; Wilson, L.A.; Fehr, W.R.; Narvel, J.M. Sensory Characteristics of Soymilk and Tofu Made from Lipoxygenase-Free and Normal Soybeans. J. Food Sci. 1998, 63, 1084–1087. [Google Scholar] [CrossRef]
- Maghsoudlou, Y.; Alami, M.; Mashkour, M.; Shahraki, M.H. Optimization of Ultrasound-Assisted Stabilization and Formulation of Almond Milk. J. Food Process. Preserv. 2016, 40, 828–839. [Google Scholar] [CrossRef]
- Demir, H.; Simsek, M.; Yıldırım, G. Effect of oat milk pasteurization type on the characteristics of yogurt. LWT 2021, 135, 110271. [Google Scholar] [CrossRef]
- Chen, C.-Y.; Lapsley, K.; Blumberg, J. A nutrition and health perspective on almonds. J. Sci. Food Agric. 2006, 86, 2245–2250. [Google Scholar] [CrossRef]
- Tangyu, M.; Muller, J.; Bolten, C.J.; Wittmann, C. Fermentation of plant-based milk alternatives for improved flavour and nutritional value. Appl. Microbiol. Biotechnol. 2019, 103, 9263–9275. [Google Scholar] [CrossRef] [PubMed] [Green Version]
- Deswal, A.; Deora, N.S.; Mishra, H.N. Optimization of Enzymatic Production Process of Oat Milk Using Response Surface Methodology. Food Bioprocess. Technol. 2014, 7, 610–618. [Google Scholar] [CrossRef]
- Villanueva, N.D.M.; Da Silva, M.A.A.P. Comparative performance of the nine-point hedonic, hybrid and self-adjusting scales in the generation of internal preference maps. Food Qual. Pref. 2009, 20, 1–12. [Google Scholar] [CrossRef]
- Heo, J.; Choi, K.S.; Wang, S.; Adhikari, K.; Lee, J. Cold Brew Coffee: Consumer Acceptability and Characterization Using the Check-All-That-Apply [CATA] Method. Foods 2019, 8, 344. [Google Scholar] [CrossRef] [Green Version]
- Ares, G.; Tárrega, A.; Izquierdo, L.; Jaeger, S.R. Investigation of the number of consumers necessary to obtain stable sample and descriptor configurations from check-all-that-apply [CATA] questions. Food Qual. Prefer. 2014, 31, 135–141. [Google Scholar] [CrossRef]
- Ares, G.; de Andrade, J.C.; Antúnez, L.; Alcaire, F.; Swaney-Stueve, M.; Gordon, S.; Jaeger, S.R. Hedonic product optimisation: CATA questions as alternatives to JAR scales. Food Qual. Prefer. 2017, 55, 67–78. [Google Scholar] [CrossRef]
- Ares, G.; Dauber, C.; Fernandez, E.; Gimenez, A.; Varela, P. Penalty analysis based on CATA questions to identify drivers of liking and directions for product reformulation. Food Qual. Pref. 2014, 32A, 65–76. [Google Scholar] [CrossRef]
- Hough, G.; Wakeling, I.; Mucci, A.; Chambers IV, E.; Gallardo, I.M.; Alves, L.R. Number of consumers necessary for sensory acceptability tests. Food Qual. Pref. 2006, 17, 522–526. [Google Scholar] [CrossRef]
- Ares, G.; Antúnez, L.; Bruzzone, F.; Vidal, L.; Giménez, A.; Pineau, B.; Beresford, M.K.; Jin, D.; Paisley, A.G.; Chheang, S.L.; et al. Comparison of sensory product profiles generated by trained assessors and consumers using CATA questions: Four case studies with complex and/or similar samples. Food Qual. Prefer. 2015, 45, 75–86. [Google Scholar] [CrossRef]
- Frost, S.C.; Ristenpart, W.D.; Guinard, J.-X. Effects of brew strength, brew yield, and roast on the sensory quality of drip brewed coffee. J. Food Sci. 2020, 85, 2530–2543. [Google Scholar] [CrossRef]
- Kundu, P.; Dhankhar, J.; Sharma, A. Development of Non Dairy Milk Alternative Using Soymilk and Almond Milk. Curr. Res. Nutr. Food Sci. J. 2018, 6, 203–210. [Google Scholar] [CrossRef]
- Lozano, P.R.; Drake, M.; Benitez, D.; Cadwallader, K.R. Instrumental and Sensory Characterization of Heat-Induced Odorants in Aseptically Packaged Soy Milk. J. Agric. Food Chem. 2007, 55, 3018–3026. [Google Scholar] [CrossRef]
- Spencer, M.; Sage, E.; Velez, M.; Guinard, J.-X. Using Single Free Sorting and Multivariate Exploratory Methods to Design a New Coffee Taster’s Flavor Wheel. J. Food Sci. 2016, 81, S2997–S3005. [Google Scholar] [CrossRef] [Green Version]
- Meyners, M.; Casture, J.C.; Carr, B.T. Existing and new approaches for the analysis of CATA data. Food Qual. Prefer. 2013, 30, 309–319. [Google Scholar] [CrossRef]
- Torrico, D.D.; Fuentes, S.; Gonzalez Viejo, C.; Ashman, H.; Dunshea, F.R. Cross-cultural effects of food product familiarity on sensory acceptability and non-invasive physiological responses of consumers. Food Res. Int. 2019, 115, 439–450. [Google Scholar] [CrossRef]
- Tan, H.S.G.; van den Berg, E.; Stieger, M. The influence of product preparation, familiarity and individual traits on the consumer acceptance of insects as food. Food Qual. Prefer. 2016, 52, 222–231. [Google Scholar] [CrossRef]
- Zhang, Y.; Guo, S.; Liu, Z.; Chang, S.K.C. Off-Flavor Related Volatiles in Soymilk As Affected by Soybean Variety, Grinding, and Heat-Processing Methods. J. Agric. Food Chem. 2012, 60, 7457–7462. [Google Scholar] [CrossRef]
- Pramudya, R.C.; Seo, H.-S. Influences of Product Temperature on Emotional Responses to, and Sensory Attributes of, Coffee and Green Tea Beverages. Front. Psychol. 2018, 8, 2264. [Google Scholar] [CrossRef] [Green Version]
- Cotter, A.R.; Batali, M.E.; Ristenpart, W.D.; Guinard, J.-X. Consumer preferences for black coffee are spread over a wide range of brew strengths and extraction yields. J. Food Sci. 2021, 86, 194–205. [Google Scholar] [CrossRef] [PubMed]
- Seninde, D.R.; Chambers, E. Coffee Flavor: A Review. Beverages 2020, 6, 44. [Google Scholar] [CrossRef]
- Lawrence, S.E.; Lopetcharat, K.; Drake, M.A. Preference Mapping of Soymilk with Different U.S. Consumers. J. Food Sci. 2016, 81, S463–S476. [Google Scholar] [CrossRef] [PubMed]
- Fan, Z.; Hasing, T.; Johnson, T.S.; Garner, D.M.; Schwieterman, M.L.; Barbey, C.R.; Colquhoun, T.A.; Sims, C.A.; Resende, M.F.; Whitaker, V.M. Strawberry sweetness and consumer preference are enhanced by specific volatile compounds. Hortic. Res. 2021, 8, 1–15. [Google Scholar]
- Barnes, D.L.; Harper, S.J.; Bodyfelt, F.W.; McDaniel, M.R. Prediction of Consumer Acceptability of Yogurt by Sensory and Analytical Measures of Sweetness and Sourness1. J. Dairy Sci. 1991, 74, 3746–3754. [Google Scholar] [CrossRef]
- Li, B.; Hayes, J.E.; Ziegler, G.R. Interpreting consumer preferences: Physicohedonic and psychohedonic models yield different information in a coffee-flavored dairy beverage. Food Qual. Prefer. 2014, 36, 27–32. [Google Scholar] [CrossRef] [Green Version]
- Mahmud, M.M.C.; Shellie, R.A.; Mohebbi, M.; Mahato, D.K.; Keast, R. The effect of fat and coffee concentration on the consumer acceptance of iced-coffee beverages. J. Food Sci. 2021, in press. [Google Scholar] [CrossRef]
- Lipan, L.; Rusu, B.; Simon, E.L.; Sendra, E.; Hernández, F.; Vodnar, D.C.; Corell, M.; Carbonell-Barrachina, Á. Chemical and sensorial characterization of spray dried hydroSOStainable almond milk. J. Sci. Food Agric. 2021, 101, 1372–1381. [Google Scholar] [CrossRef]
- Yang, J.; Lee, J. Consumer Perception of Red Wine by the Degree of Familiarity Using Consumer-Based Methodology. Foods 2021, 10, 749. [Google Scholar] [CrossRef] [PubMed]
- Harwood, W.S.; McLean, K.G.; Ennis, J.M.; Ennis, D.M.; Drake, M. Comparison of preference mapping with projective mapping for characterizing consumer perception of brewed black coffees. J. Sens. Stud. 2020, 35, e12563. [Google Scholar] [CrossRef]
- Narain, C.; Paterson, A.; Reid, E. Free choice and conventional profiling of commercial black filter coffees to explore consumer perceptions of character. Food Qual. Prefer. 2004, 15, 31–41. [Google Scholar] [CrossRef]
Figure 1.
(A) Biplot representation of the sensory properties and the different coffee samples on the first two dimensions of the correspondence analysis for the overall population. (B) Penalty analysis based on the responses to the CATA question and the participants’ overall liking scores.
Figure 1.
(A) Biplot representation of the sensory properties and the different coffee samples on the first two dimensions of the correspondence analysis for the overall population. (B) Penalty analysis based on the responses to the CATA question and the participants’ overall liking scores.

Figure 2.
(A) Biplot representation of the sensory properties and the different coffee samples on the first two dimensions of the correspondence analysis for the dairy consumers. (B) Penalty analysis based on the responses to the CATA question and the dairy consumers’ overall liking scores.
Figure 2.
(A) Biplot representation of the sensory properties and the different coffee samples on the first two dimensions of the correspondence analysis for the dairy consumers. (B) Penalty analysis based on the responses to the CATA question and the dairy consumers’ overall liking scores.

Figure 3.
(A) Biplot representation of the sensory properties and the different coffee samples on the first two dimensions of the correspondence analysis for the plant consumers. (B) Penalty analysis based on the responses to the CATA question and the plant consumers’ overall liking scores.
Figure 3.
(A) Biplot representation of the sensory properties and the different coffee samples on the first two dimensions of the correspondence analysis for the plant consumers. (B) Penalty analysis based on the responses to the CATA question and the plant consumers’ overall liking scores.


Table 1.
Demographic details for the participants (n = 116).
| Characteristics | Population |
|---|---|
| Age | |
| 18–20 | 6.5% |
| 21–29 | 27.6% |
| 30–39 | 16.7% |
| 40–49 | 17.1% |
| 50–59 | 19.1% |
| 60–69 | 13.0% |
| Gender | |
| Male | 43.1% |
| Female | 56.9% |
| What kind of milk do you usually add to your coffee? | |
| 1% Milk | 14% |
| 2% Milk | 12% |
| Skim Milk | 8% |
| Half-and-Half | 8% |
| Cream | 9% |
| Soy | 21% |
| Almond | 14% |
| Oat | 11% |
| Other | 4% |
Table 2.
Description of the milk and plant-based alternatives added to the coffee.
| Product | Ingredients |
|---|---|
| 1% Milk | Partly Skimmed Milk, Vitamin A Palmitate, Vitamin D3. |
| Soy | Organic Soy Base (Filtered Water, Organic Soybeans), Gellan Gum, Sea Salt, Natural Flavour, Sodium Bicarbonate. Vitamins and Minerals: Calcium Carbonate, Zinc Gluconate, Vitamin A Palmitate, Vitamin D2, Riboflavin (b2), Vitamin B12. |
| Almond | Almond Base (Filtered Water, Almonds), Vitamin and Mineral Blend (Calcium Carbonate, Zinc Gluconate, Vitamin A Palmitate, Riboflavin (b2), Vitamin D2, Vitamin B12), Dipotassium Phosphate, Sea Salt, Locust Bean Gum, Gellan Gum, Ascorbic Acid, Natural Flavour. |
| Oat | Oat Base (Filtered Water, Oats) Canola Oil, Tricalcium Phosphate, Gellan Gum, Sea Salt, Natural Flavour, Zinc Gluconate, Vitamin A Palmitate, Vitamin D2, Riboflavin, Vitamin B12, Amylase. Natural Sugar from Oats. |
Table 3.
Consumer (n = 116) mean liking scores (+/− standard deviation) for the different coffee samples.
Table 3.
Consumer (n = 116) mean liking scores (+/− standard deviation) for the different coffee samples.
| Appearance | Flavour | Mouthfeel | Overall Liking | |
|---|---|---|---|---|
| Milk | 6.9a 1,2 +/− 0.9 | 6.0a +/− 1.0 | 6.2a +/− 1.0 | 6.0a +/− 1.0 |
| Soy | 6.4ab +/− 1.1 | 5.5ab +/− 0.7 | 5.6a +/− 1.0 | 5.3ab +/− 0.9 |
| Almond | 6.2b +/− 0.8 | 5.7ab +/− 0.8 | 5.8a +/− 0.9 | 5.7ab +/− 0.7 |
| Oat | 6.1b +/− 1.0 | 5.1b +/− 0.9 | 5.5a +/− 1.1 | 5.2b +/− 0.7 |
1 Data input on a 9-point hedonic scale where 1 = Dislike Extremely and 9 = Like Extremely.2 Means in the same column with the same letter are not significantly different (p < 0.05).
Table 4.
Consumer mean liking scores (+/− standard deviation) for the different coffee samples separated into different consumption groups.
Table 4.
Consumer mean liking scores (+/− standard deviation) for the different coffee samples separated into different consumption groups.
| Appearance | Flavour | Mouthfeel | Overall Liking | |||||
|---|---|---|---|---|---|---|---|---|
| Dairy (n = 58) | Plant (n = 58) | Dairy (n = 58) | Plant (n = 58) | Dairy (n = 58) | Plant (n = 58) | Dairy (n = 58) | Plant (n = 58) | |
| Milk | 7.4a *,1,2 +/− 0.9 | 6.9a +/− 1.1 | 6.5a * +/− 0.9 | 5.4a * +/− 1.1 | 6.7a * +/− 0.9 | 5.7a * +/− 1.1 | 6.5a * +/− 1.1 | 5.4a * +/− 1.1 |
| Soy | 6.6ab +/− 0.8 | 6.2a +/− 1.2 | 5.5b +/− 1.0 | 5.5a +/− 1.1 | 5.9ab +/− 0.8 | 5.3a +/− 1.0 | 5.5bc +/− 1.1 | 5.2a +/− 0.8 |
| Almond | 6.3bc +/− 1.1 | 6.1a +/− 0.6 | 5.8ab +/− 1.1 | 5.6a +/− 0.8 | 6.1ab +/− 0.8 | 5.6a +/− 1.0 | 5.9ab +/− 1.0 | 5.5a +/− 0.8 |
| Oat | 5.9c +/− 1.0 | 6.4a +/− 0.6 | 4.9b +/− 1.0 | 5.3a +/− 0.9 | 5.5b +/− 0.8 | 5.5a +/− 0.8 | 4.9c +/− 1.2 | 5.4a +/− 0.9 |
1 Data input on a 9-point hedonic scale where 1 = Dislike Extremely and 9 = Like Extremely. 2 Means in the same column with the same letter are not significantly different (p < 0.05). * Means between the two consumer groups [dairy consumers and plant consumers] differed based on a t-test.
Publisher’s Note: MDPI stays neutral with regard to jurisdictional claims in published maps and institutional affiliations. |
© 2021 by the authors. Licensee MDPI, Basel, Switzerland. This article is an open access article distributed under the terms and conditions of the Creative Commons Attribution (CC BY) license (https://creativecommons.org/licenses/by/4.0/).
Share and Cite
MDPI and ACS Style
Gorman, M.; Knowles, S.; Falkeisen, A.; Barker, S.; Moss, R.; McSweeney, M.B. Consumer Perception of Milk and Plant-Based Alternatives Added to Coffee. Beverages 2021, 7, 80. https://0-doi-org.brum.beds.ac.uk/10.3390/beverages7040080
AMA Style
Gorman M, Knowles S, Falkeisen A, Barker S, Moss R, McSweeney MB. Consumer Perception of Milk and Plant-Based Alternatives Added to Coffee. Beverages. 2021; 7(4):80. https://0-doi-org.brum.beds.ac.uk/10.3390/beverages7040080
Chicago/Turabian StyleGorman, Mackenzie, Sophie Knowles, Anika Falkeisen, Sophie Barker, Rachael Moss, and Matthew B. McSweeney. 2021. "Consumer Perception of Milk and Plant-Based Alternatives Added to Coffee" Beverages 7, no. 4: 80. https://0-doi-org.brum.beds.ac.uk/10.3390/beverages7040080
Note that from the first issue of 2016, this journal uses article numbers instead of page numbers. See further details here.