Article

Selection of Microbial Targets for Treatments to Preserve Fresh Carrot Juice

by
Charlène Leneveu-Jenvrin
1,2,†,
Baptiste Quentin
1,2,‡,
Fatima-Ezzahra Messaaf
1,2,
Mathilde Hoarau
1,3,
Marc Lebrun
1,4 and
Fabienne Remize
1,2,*,§
1
QualiSud, CIRAD, Université Montpellier, Montpellier SupAgro, Université d’Avignon, Université La Réunion, F-34000 Montpellier, France
2
Université de La Réunion, 7 Chemin de l’Irat, F-97410 Saint Pierre, France
3
CIRAD, 7 Chemin de l’Irat, F-97410 Saint Pierre, France
4
CIRAD, Avenue Agropolis, F-34398 Montpellier, France
*
Author to whom correspondence should be addressed.
Current address: ADIV, 10 Rue Jacqueline Auriol, F-63100 Clermont-Ferrand, France.
Current address: PROSE, INRAE, 1 Rue Pierre-Gilles de Gennes, CS 10030, Antony, F-92761 Paris, France.
§
Current address: SPO, Université La Reunion, Université Montpellier, INRAE, Institut Agro Montpellier SupAgro, 2 Place Viala, F-34000 Montpellier, France.
Submission received: 23 January 2022 / Revised: 14 March 2022 / Accepted: 17 March 2022 / Published: 21 March 2022
(This article belongs to the Section Beverage Technology Fermentation and Microbiology)

Abstract

:
Fresh carrot juice presents nutritional and organoleptic qualities which have to be preserved. However, it is a fast perishable beverage, and its low-acidic pH promotes the development of foodborne pathogens and spoilage microorganisms. This study aims to assess the modification and variability of physicochemical and microbial indicators during storage of carrot juice, and to isolate and select microorganisms to be used as promoters of spoilage to quantify the effect of preservation treatments. To achieve that, 10 batches of carrot Daucus carota cv. Maestro juice were prepared independently, stored up to 14 days at 4 °C and analyzed. Volatile compound composition differed mainly according to the analyzed batch. During storage, an increase of the content of ethanol, ethyl acetate or 2-methoxyphenol, which are produced by different microorganisms, was noticed. Isolation of bacteria revealed Pseudomonas, lactic acid bacteria, and enterobacteria, some of them provoking odor modification of carrot juice at 4 °C. Assays in carrot juice with isolated yeasts and molds showed the ability of Meyerozyma guillermondii to induce texture modification and some isolates, e.g., Pichia guillermondii, resulted in gas production. Selected isolates able to induce spoilage are useful to test preservative treatments of fresh carrot juice under controlled conditions.

Graphical Abstract

1. Introduction

Carrot (Daucus carota) exhibits many nutritional advantages which are retained in fresh juice. Carrots are rich in carotenoids (6 to 54.8 mg/100 g) and do not contain many sugar (6.6 to 7.7 g/100 g of soluble carbohydrates) compared to fruits [1]. However, fresh juice is highly perishable, typically with a shelf life of 1–5 days at refrigerated temperatures [2,3,4], but up to 10 days in other studies [5,6]. As previously reported, spoilage is observed from pH decrease or acidity increase, total soluble solids (TSS) or sugar content decrease, viscosity change, loss of cloud stability, modification of color, odor or taste, and for longer storage durations, total carotenoid content decrease. These effects result from the metabolic activity of microbial contaminants, which grow in carrot juice.
Microbial contaminants of carrots originate from soil, water, transportation, and handling when processing. Depending on the study, the microbiological analyses target total mesophilic bacteria, lactic acid bacteria, enterobacteria or coliforms, psychrotrophic bacteria or yeasts, and molds [2,3,5,6]. Total aerobic mesophilic bacteria typically range between 4.4 and 5.9 log colony forming unit (CFU)/mL the day of processing whereas lactic acid bacteria and yeasts and molds represent 2.8 to 4.8 log CFU/mL and 1.9 to 4.6 log CFU/mL respectively [2,3,5]. The pH of carrot juice is not restrictive for most microorganisms, with values in the range 5.8–6.8 [3,5,6,7,8]. Hence, whatever the study, the population of all microbial group analyzed increases during carrot juice storage, and no clear connection between a group and spoilage effects, as observed from physicochemical parameter changes, was established.
The studies on treatments to increase the shelf life of foods can be classified in two groups: either a global assessment of quality is performed, considering several microbial groups, physicochemical parameters, and sensory quality, either the study is focused on foodborne pathogens, which can grow in the food and hence result in safety issues. Typically for carrot-based foods, the effects of treatments to control reference strains of Escherichia coli, Salmonella Typhimurium, or Listeria monocytogenes are reported [9,10,11,12]. In all those studies, carrot food is initially sterilized or decontaminated then inoculated with the microbial target before application of the treatment of interest. This approach allows to focus on the behavior of a specific target under food conditions and reduces the variability resulting from different batches of raw material, which harbor different levels and species of microorganisms. We found few studies investigating the preservation of carrot-based foods regarding specifically spoilage microorganisms, and all focused on Bacillus amyloliquefaciens or Bacillus licheniformis spores, which can resist heat treatments and can be further recovered in foods [13,14]. Hence, there is a lack for selected microorganisms, which cause naturally carrot-based food spoilage and which could be used to mimic carrot-based food spoilage under controlled conditions. Those selected microorganisms would be very useful to investigate the potential of treatments to increase carrot-based food shelf-life.
Hence, the present study aimed at characterizing the changes occurring during storage of fresh carrot juice, as well for physicochemical parameters, biochemical indicators of quality and microbial groups, search for correlations between those, and isolate and select microorganisms to be used as inducers of spoilage for further studies on carrot-based food shelf life.

2. Materials and Methods

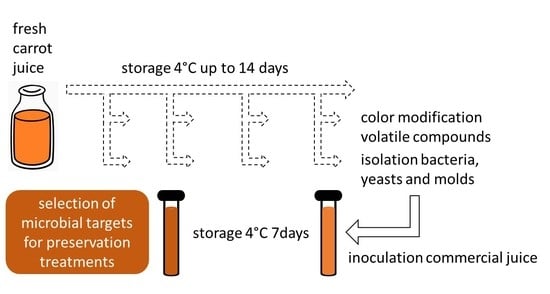
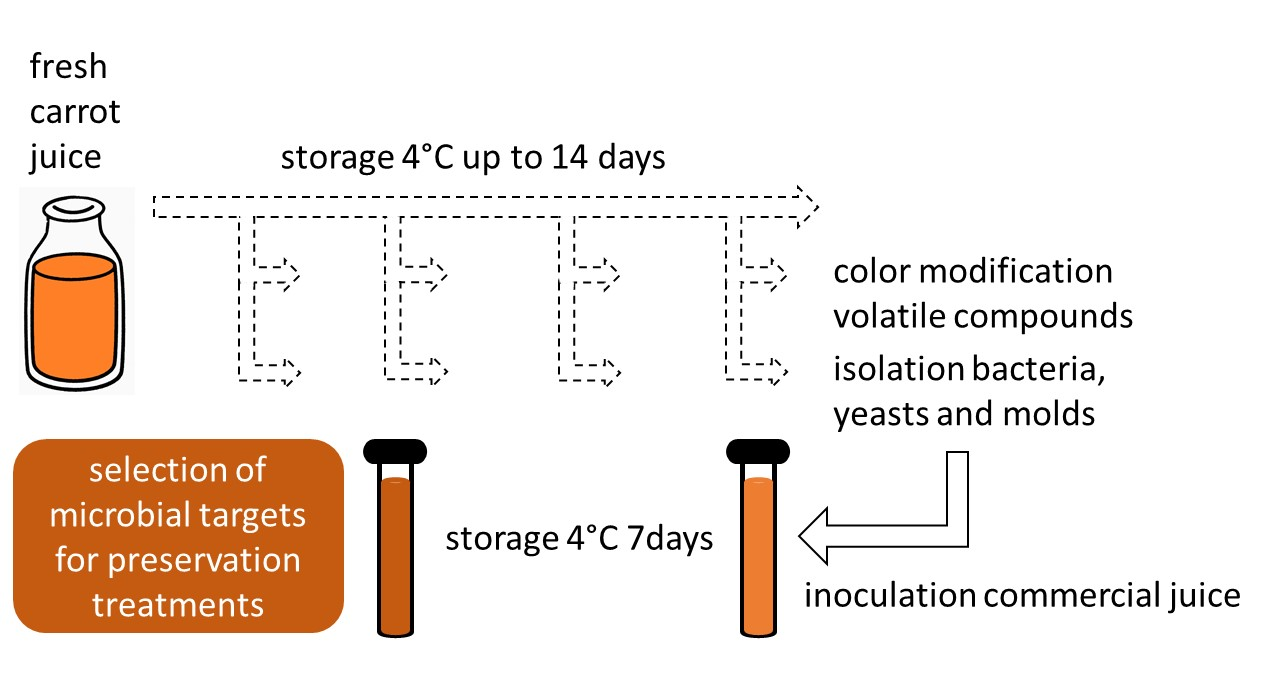
2.1. Carrot Sampling and Processing

Seven independent batches of carrots (Daucus carota cv. Maestro) were collected from local markets. The production area was Reunion island (latitude: −21.1°, longitude: 55.4°). Carrots were washed twice in water, manually brushed and juice was extracted (Wismer EW-01, AudioPlus, Saint Pierre, France). The resulting juices were labelled “lab-made”. Those batches were labelled L1, L2, L3, L4, L5, L6, and L7. Additionally, three batches of shredded carrots, whose local origin was not certified, were collected from a company and juice was directly extracted with the same protocol as mentioned above, and labelled “company”. Those batches were labelled C1, C2, and C3.
The 10 carrot juice Batches were distributed in sterile glass flasks (100 mL per flask) and stored at 4 °C. One flask was used for each time point of analysis. In case of obvious detrimental odor or aspect, the batch was discarded.

2.2. Physicochemical Analyses

The pH value was measured by a pH meter (5231 Crison, and pH-meter Model GLP22, Crison Instruments S.A. Barcelona, Spain), and the titratable acidity (TA) was determined by titration with 0.05 M NaOH (TitroLine easy, Schott, Mainz, Germany). TA was expressed as citric acid equivalents in g/100 mL.
Carrot juice total soluble solids (TSS), expressed as °Brix, were determined with a hand refractometer (Atago, Tokyo, Japan) at room temperature.
Three color determinations were performed for each sample (12 mL) with a spectrophotometer CM 3500d (Minolta®, Carrières-sur-Seine, France). Measured color parameters were L*, a*, and b*. The color difference was calculated as:
Δ E = ( L * e L * c ) 2 + ( a * e a * c ) 2 + ( b * e b * c ) 2
In which L*e, a*e, and b*e refer to the assay condition and L*c, a*c, and b*c to the control condition. The control condition corresponded to freshly prepared shredded carrots.

2.3. Total Carotenoid Content

The total carotenoid content (TCC) was quantified according to an adapted method proposed by Lichtenthaler and Buschmann (2001) [15]. To that aim, 100 mL of carrot juice added at 1 mL of pure acetone was vortexed for 1 min. After shaking, samples were rested at 4 °C during 30 min and centrifuged at 13,000× g at 4 °C for 15 min. Then, 200 µL of the supernatant was deposed in a 96-well microplate and the absorbance was measured spectrophotometrically at 470 nm. The results of TC were expressed as µg of β-carotene/mL of carrot juice.

2.4. Analysis of Volatile Compounds

For the analysis of volatile compounds, headspace solid-phase dynamic extraction coupled with gas chromatography/tandem mass spectrometry was used. Samples of juice (0.5 g) were placed in headspace vials (10 mL) and 3 µL butanol (Sigma-Aldrich, Saint-Quentin-Fallavier, France) at 200 mg/100 mL of methanol was introduced as an internal standard for semi-quantification. Dynamic Headspace (DHS) was applied with the following parameters: incubation 50 °C for 10 min; trapping on Tenax TA sorbent tube at 30 °C with 300 mL nitrogen, flow rate 30 mL/min under stirring at 250 rpm; 500 mL drying phase at 30 °C. For Thermo Desorption Unit (TDU), a splitless injection at 30 °C up to 300 °C at 120 °C/min into Cool Injection System (CIS) at −40 °C for 5 min was performed, followed by splitless desorption of CIS at 12 °C/s up to 300 °C for 7 min. DHS, TDU, and CIS were from GERSTEL GmbH & Co. KG (Mülheim an der Ruhr, Germany).
Tandem gas chromatograph 7890B/MSD 5977 system (Agilent Technologies, Palo Alto, CA, USA) with a Gerstel Robotic and polar capillary column DB-WaxUI 60 m length, 0.25 mm I.D., 0.25 µm film thickness (J&W Scientific, Folsom, CA, USA) were used with hydrogen as carrier gas at a flow rate of 2.2 mL/min. Elution was realized with the following temperature program: isotherm 40 °C for 5 min, then 2 °C/min from 40 °C to 140 °C, then 10 °C/min up to 250 °C. Mass spectrum were recorded in EI+ mode at 70 eV within 40 to 350 Da. Analyzer and source temperatures were 150 °C and 250 °C respectively.
Data were analyzed with Masshunter version B. 08.00 (Agilent Technologies, Palo Alto, CA, USA). A semi quantitative method based on specific Quantifier and Qualifier ions, was created to extract data. Peaks identification was realized comparing mass spectra with those of the NIST 2014 (National Institute of Standard Technology) data base. Co-injection of alkanes series from C8 to C20 (Sigma-Aldrich, Saint-Quentin-Fallavier, France) was used for Kovats retention indices (RI) calculations and their comparison with those found in the literature, flavornet and pherobase websites and NIST.

2.5. Microbiological Counts

Serial decimal dilutions of carrot juice were performed in SPW (saline peptone water, Condalab, Torrejón de Ardoz, Madrid, Spain).
Enterobacteria were enumerated on Violet Red Bile Agar (VRBG) agar (Biokar diagnostic, Solabia, Allonne, France) after incubation for 48 h at 37 °C. Psychrotrophic bacteria were enumerated on nutrient agar (Merck, Darmstadt, Germany) with 10 mg/mL cycloheximide after incubation for 3 days at 12 °C. Yeast and mold (Y&M) enumeration was performed on Sabouraud glucose agar (SGA) with 100 mg/L chloramphenicol (Biokar diagnostic, Solabia, Allonne, France) after incubation at 30 °C for 5 days. Lactic acid bacteria (LAB) were enumerated on de Man, Rogosa & Sharpe (MRS) agar (Biokar diagnostic, Solabia, Allonne, France) after incubation for 72 h at 30 °C.

2.6. Isolation and Indentification of Isolates

2.6.1. Isolation of Bacteria and PCR

Bacteria were isolated from MRS (selective for LAB) or nutrient media (selective for psychrotopic bacteria) or VRBG (selective for enterobacteria) by subculturing colonies with different aspects. Isolates were stored at −80 °C in nutrient broth containing 20% glycerol.
DNA primers FD1 m (AGAGTTTGATCHTGGCTCAG) and RD1 m (GGMTACCTTGTTACGAYTTC) were used to amplify a region encoding 16S RNA [16,17]. PCR amplification reaction was performed in a final volume of 50 μL containing 0.1 μM of each primer, all the deoxyribonucleotide triphosphate (dNTPs) at 200 μM, 1.5 mM of MgCl2, 10 μL of 5× Taq reaction buffer (Promega), 1.5 U of Taq DNA polymerase (Promega), and 1 μL of glycerol stock isolates. PCR amplification reactions were carried out as follows: an initial denaturation at 95 °C for 2 min, 35 cycles at 95 °C for 15 s, 55 °C for 30 s and 72 °C for 30 s, and a final extension at 72 °C for 5 min. The PCR reactions were performed in a Thermocycler (Veriti, Applied Biosystems, Warrington, UK).

2.6.2. Isolation of Fungi and PCR

Y&M isolates were obtained from SGA colonies exhibiting morphological differences and were isolated by sub-culturing on the same medium. Isolates were stored in Sabouraud glucose broth containing 20% glycerol at −80 °C.
For Y&M identification, DNA primers ITS1F (CTTGGTCATTTAGAGGAAGTAA) and ITS4 (TCCTCCGCTTATTGATATGC) were used to amplify a region of the fungal ITS [18]. The PCR reactions were performed with the same conditions as for 16S RNA region but with 0.3 μM of each primer. PCR amplification reactions were carried out as follows: an initial denaturation at 95 °C for 2 min, 40 cycles at 95 °C for 15 s, 53 °C for 30 s and 72 °C for 45 s, and a final extension at 72 °C for 5 min.

2.6.3. Analysis of PCR Products

Aliquots (5 μL) of PCR products were analyzed by electrophoresis in 2% (w/v) agarose gel with 1× Tris-acetate-EDTA (TAE) buffer (40 mM Tris-HCl pH 7.4, 20 mM sodium acetate, 1.0 mM Na2-EDTA). After running at 100 V for 45 min, the gels were stained with ethidium bromide solution (50 μg/mL in TAE 1×) and quantified using a molecular weight marker (100 bp DNA ladder, Promega). The PCR products were sent to Macrogen (Amsterdam, The Netherlands) for sequencing. For each, purification was applied, and sequencing was carried out on PCR products using 338-F or 518R for bacteria and ITS1F or ITS4 primers for Y&M. The sequences obtained were analyzed by a BLAST similarity search.

2.7. Determination of Spoilage Capacity of Isolates

Sterile glass tubes were prepared with 10 mL of a commercial canned carrot juice (pure organic carrot juice, Carrefour Bio, Saint Pierre, France). Each tube was inoculated with 0.2 mL of each isolate, beforehand reactivated in nutritive broth for 48 h at 27 °C, and further stored at 4 °C for 7 days. Each isolate was assayed in triplicate. A control condition with non-inoculated commercial juice was used.
For each tube, the following indicators were determined: microbial population, pH value, visual observation of aspect modification including gas production (gas release upon opening the tube) and texture modification, and modification of odor. If indicated, color difference to the juice just after inoculation was determined.

2.8. Statistical Analysis

The XLSTAT software (Addinsoft, Paris, France) was used for statistical analyses. To compare data, one-way variance analysis (ANOVA) was performed and the Ryan, Einot, Gabriel, Welsh Studentized Range Q (REGWQ) was used for pair-wise comparisons. The REGWQ test uses a stepwise method: it is powerful and minimizes the family error rate error [19]. For search of correlations, Pearson test was used with a p-value < 0.005 and alpha coefficient of 5%. Principal component analysis (PCA) was applied to cluster batches and storage times according to volatile compound composition. For that, volatile compounds were used as variables and each batch/storage time was assigned to an observation.

3. Results and Discussion

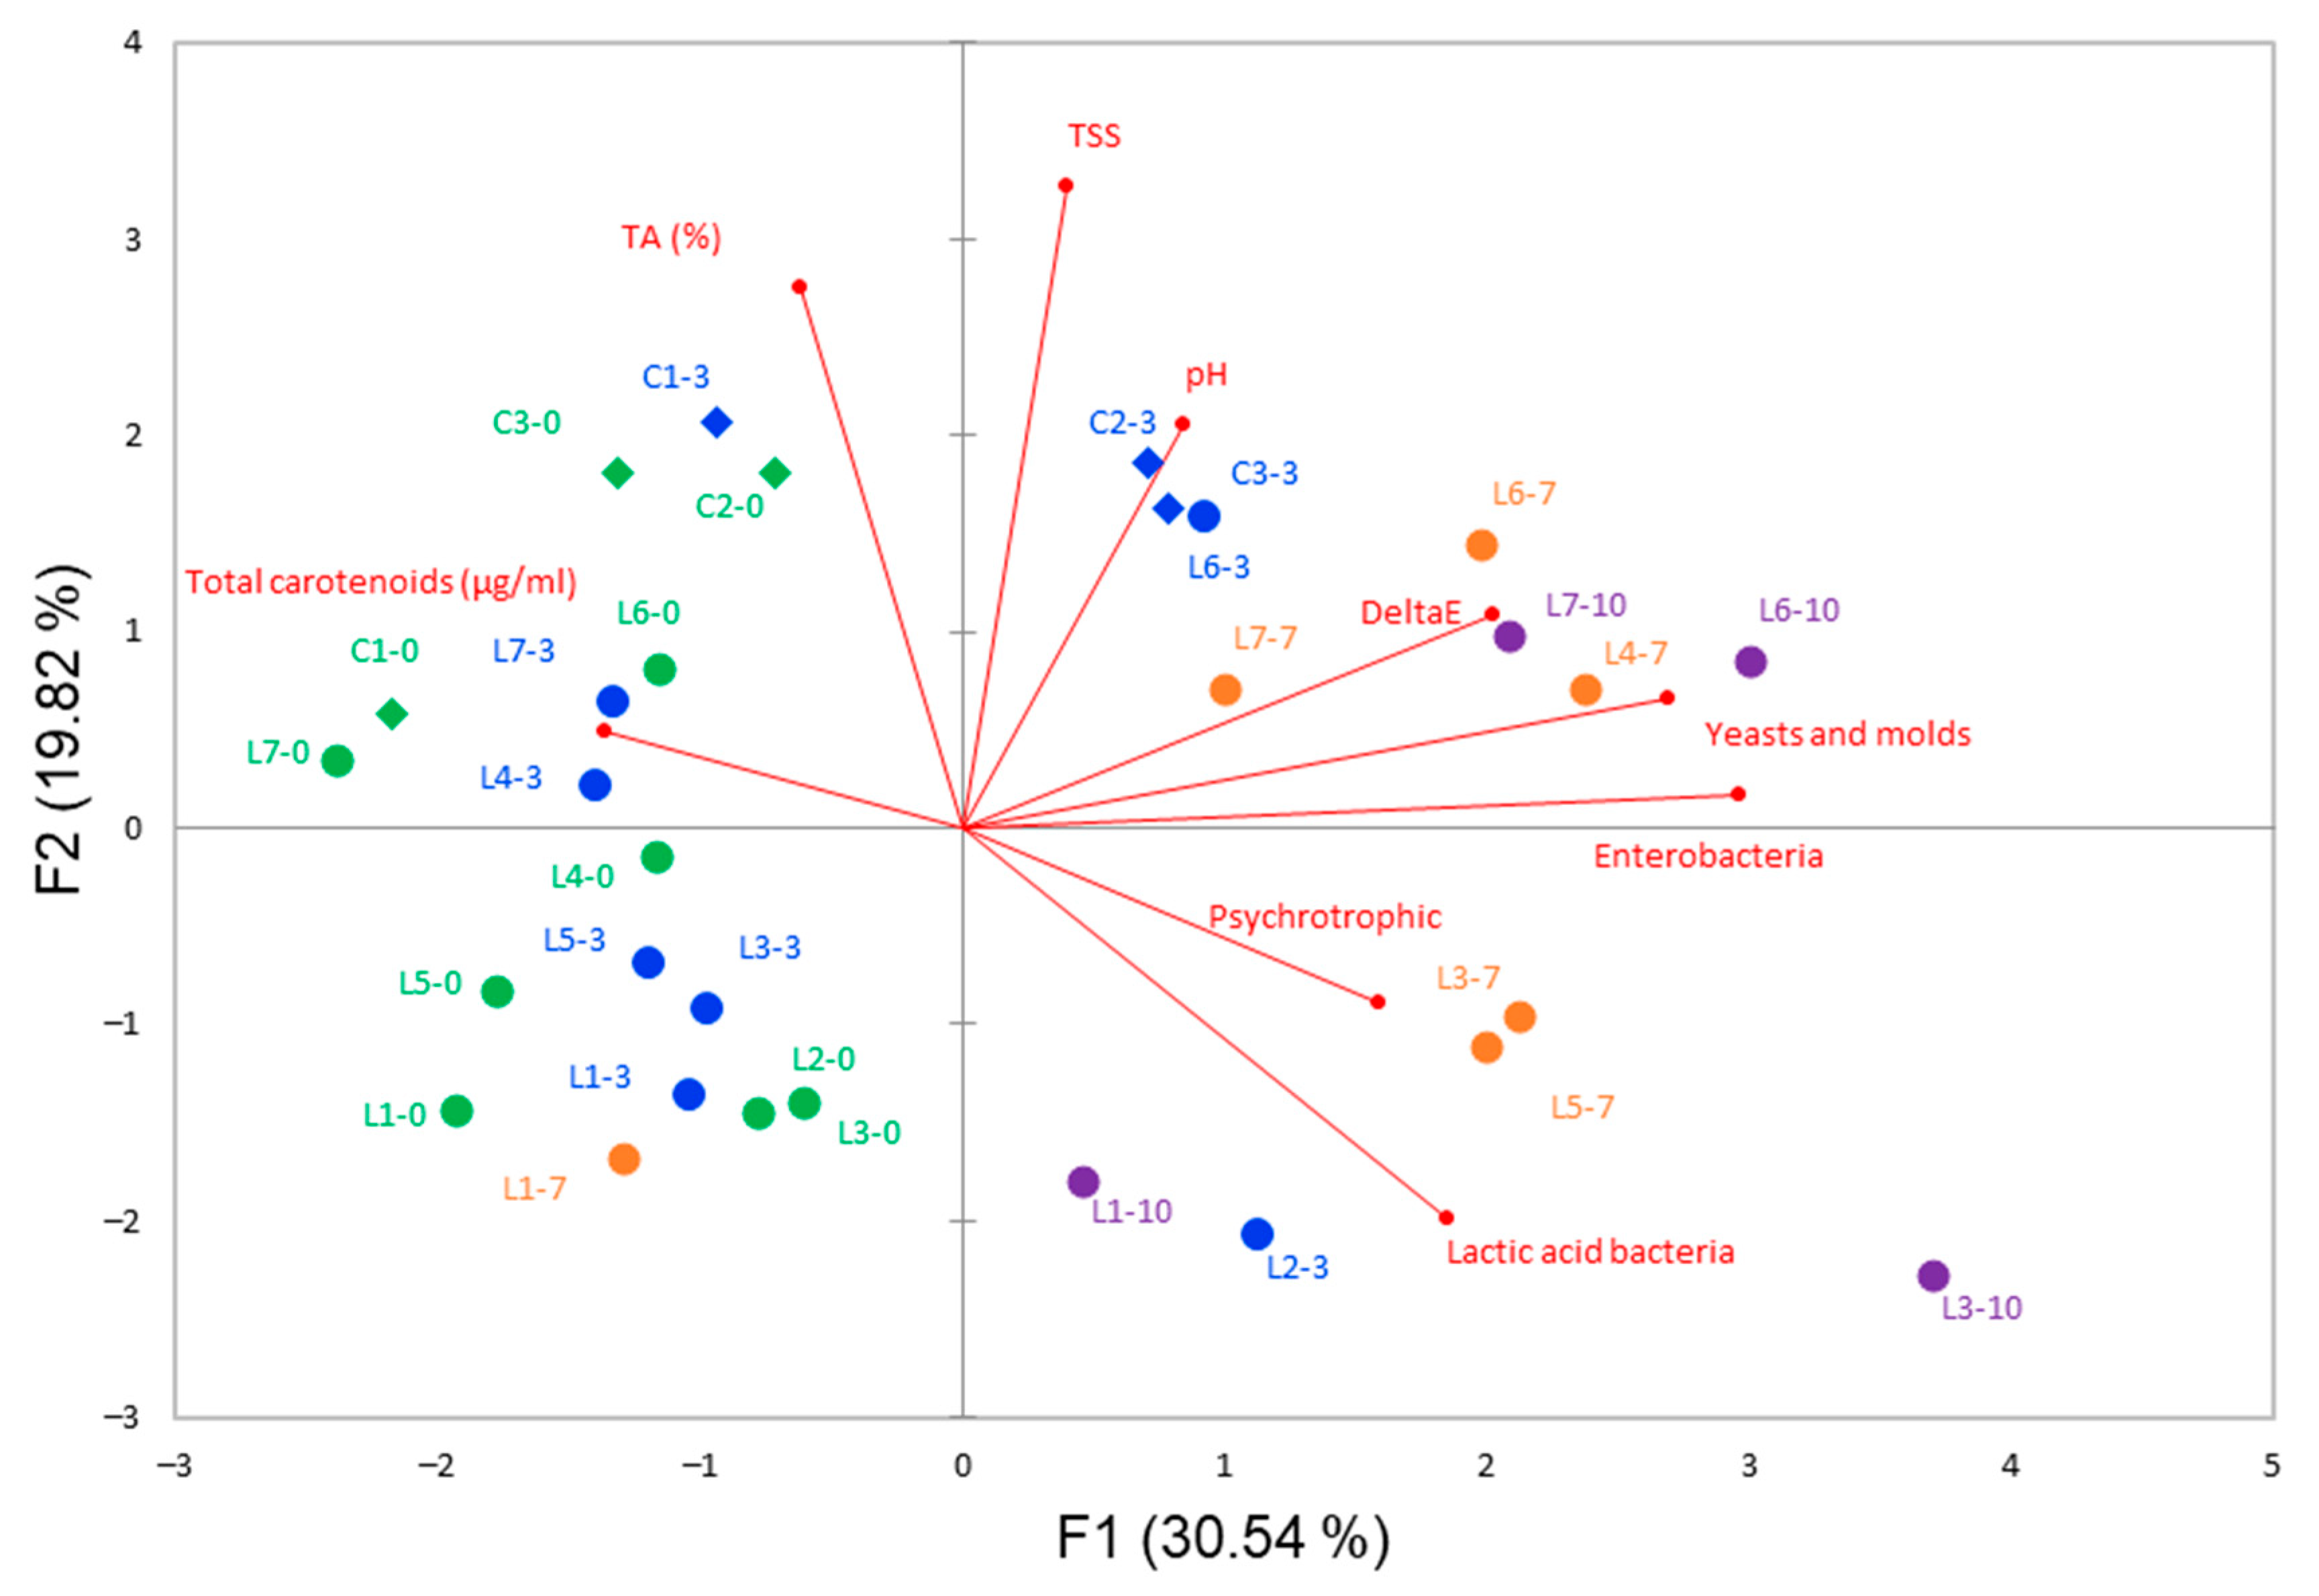
3.1. Initial Characteristics of Carrot Juices and Changes during Storage

Physicochemical and biochemical parameters of carrot juice were determined on the day of preparation and during refrigerated storage. They were compared between juices prepared from local carrots (lab-made) and juices prepared from commercial shredded carrots (company) (Table 1). The company juice batches were not analyzed after 7 days of storage and discarded because of obvious spoilage (rotting odor and heterogeneous aspect). The same occurred for two batches of lab-made juice after 10 days (L2 and L4), and one more after 14 days (L3).
Whatever the batch, the pH value was above 5.4 and below 6.6, which means a slightly acidic environment, suitable for the development of foodborne pathogens and known spoilage microorganisms, especially Y&M and LAB. The mean pH value did not differ according to the origin, lab-made or company, of carrot juice (Table 1). The pH value was in the usual range, but in the lower values of that observed for carrot juice [2,3,5,6,7,20]. In several studies, a decrease of pH was observed during storage of carrot juice [2,5,6,21], contrarily to our study. On the opposite, a significant difference (p < 0.001) was observed in TA and TSS between batches from different origin, i.e., company and lab-made. As previously reported, both TA and TSS greatly vary depending on carrot juice [3,5,6,22]. Hence, the observed differences could result from different crop conditions. The values in this study were in the low range for TA and high range of TSS, suggesting a high sweetness of juice. These two parameters did not change during storage.
Total carotenoid content (TCC) exhibited the same average value between juices of different origin at the initial time but a high variability of values was observed, with a variation coefficient of 35%. TCC decreased with duration of storage but the observed tendency was not significant, whereas a loss of carotenoids has been occasionally observed [2,6]. Similarly, color parameters L*, a*, and b* did not exhibit significant changes between batches and according to storage time, though a* slightly decreased and b* slightly increased during storage (Table 1). Variation coefficients were respectively of 25%, 18%, and 20% for L*, a*, and b* in juices at initial time. The calculation of color difference showed an increase, which reached the significant value of 5.5 and 5.8 after 3 days of storage, respectively for lab-made and company juices. A color difference of 5 can be assigned to two different colors [23]. Variation coefficient of color difference was above 83%, meaning a great variability of color modification according to storage time depending on the carrot juice batch. The color difference of company juices ranged between 4.2 and 6.7 after 3 days of storage, whereas it reached 9.9 for the L7 batch. After 7 days of storage, color difference for L4 was 19.1 and after 14 days of storage ranged between 11.5 and 15.9 (Figure S1). There was no direct correlation between the color change during storage for a single batch and the requirement to discard the batch due to odor. Hence, color difference varies with storage time but cannot be used as a spoilage indicator. The modification of carrot juice color during storage has been reported previously [3,21].
From our data, it appears thus that spoilage can be primarily detected by strong unpleasant odor and in a lesser extent by color change, but not by physicochemical indicators such as pH, TA, TSS, or TCC. Initial values cannot be used to predict spoilage.

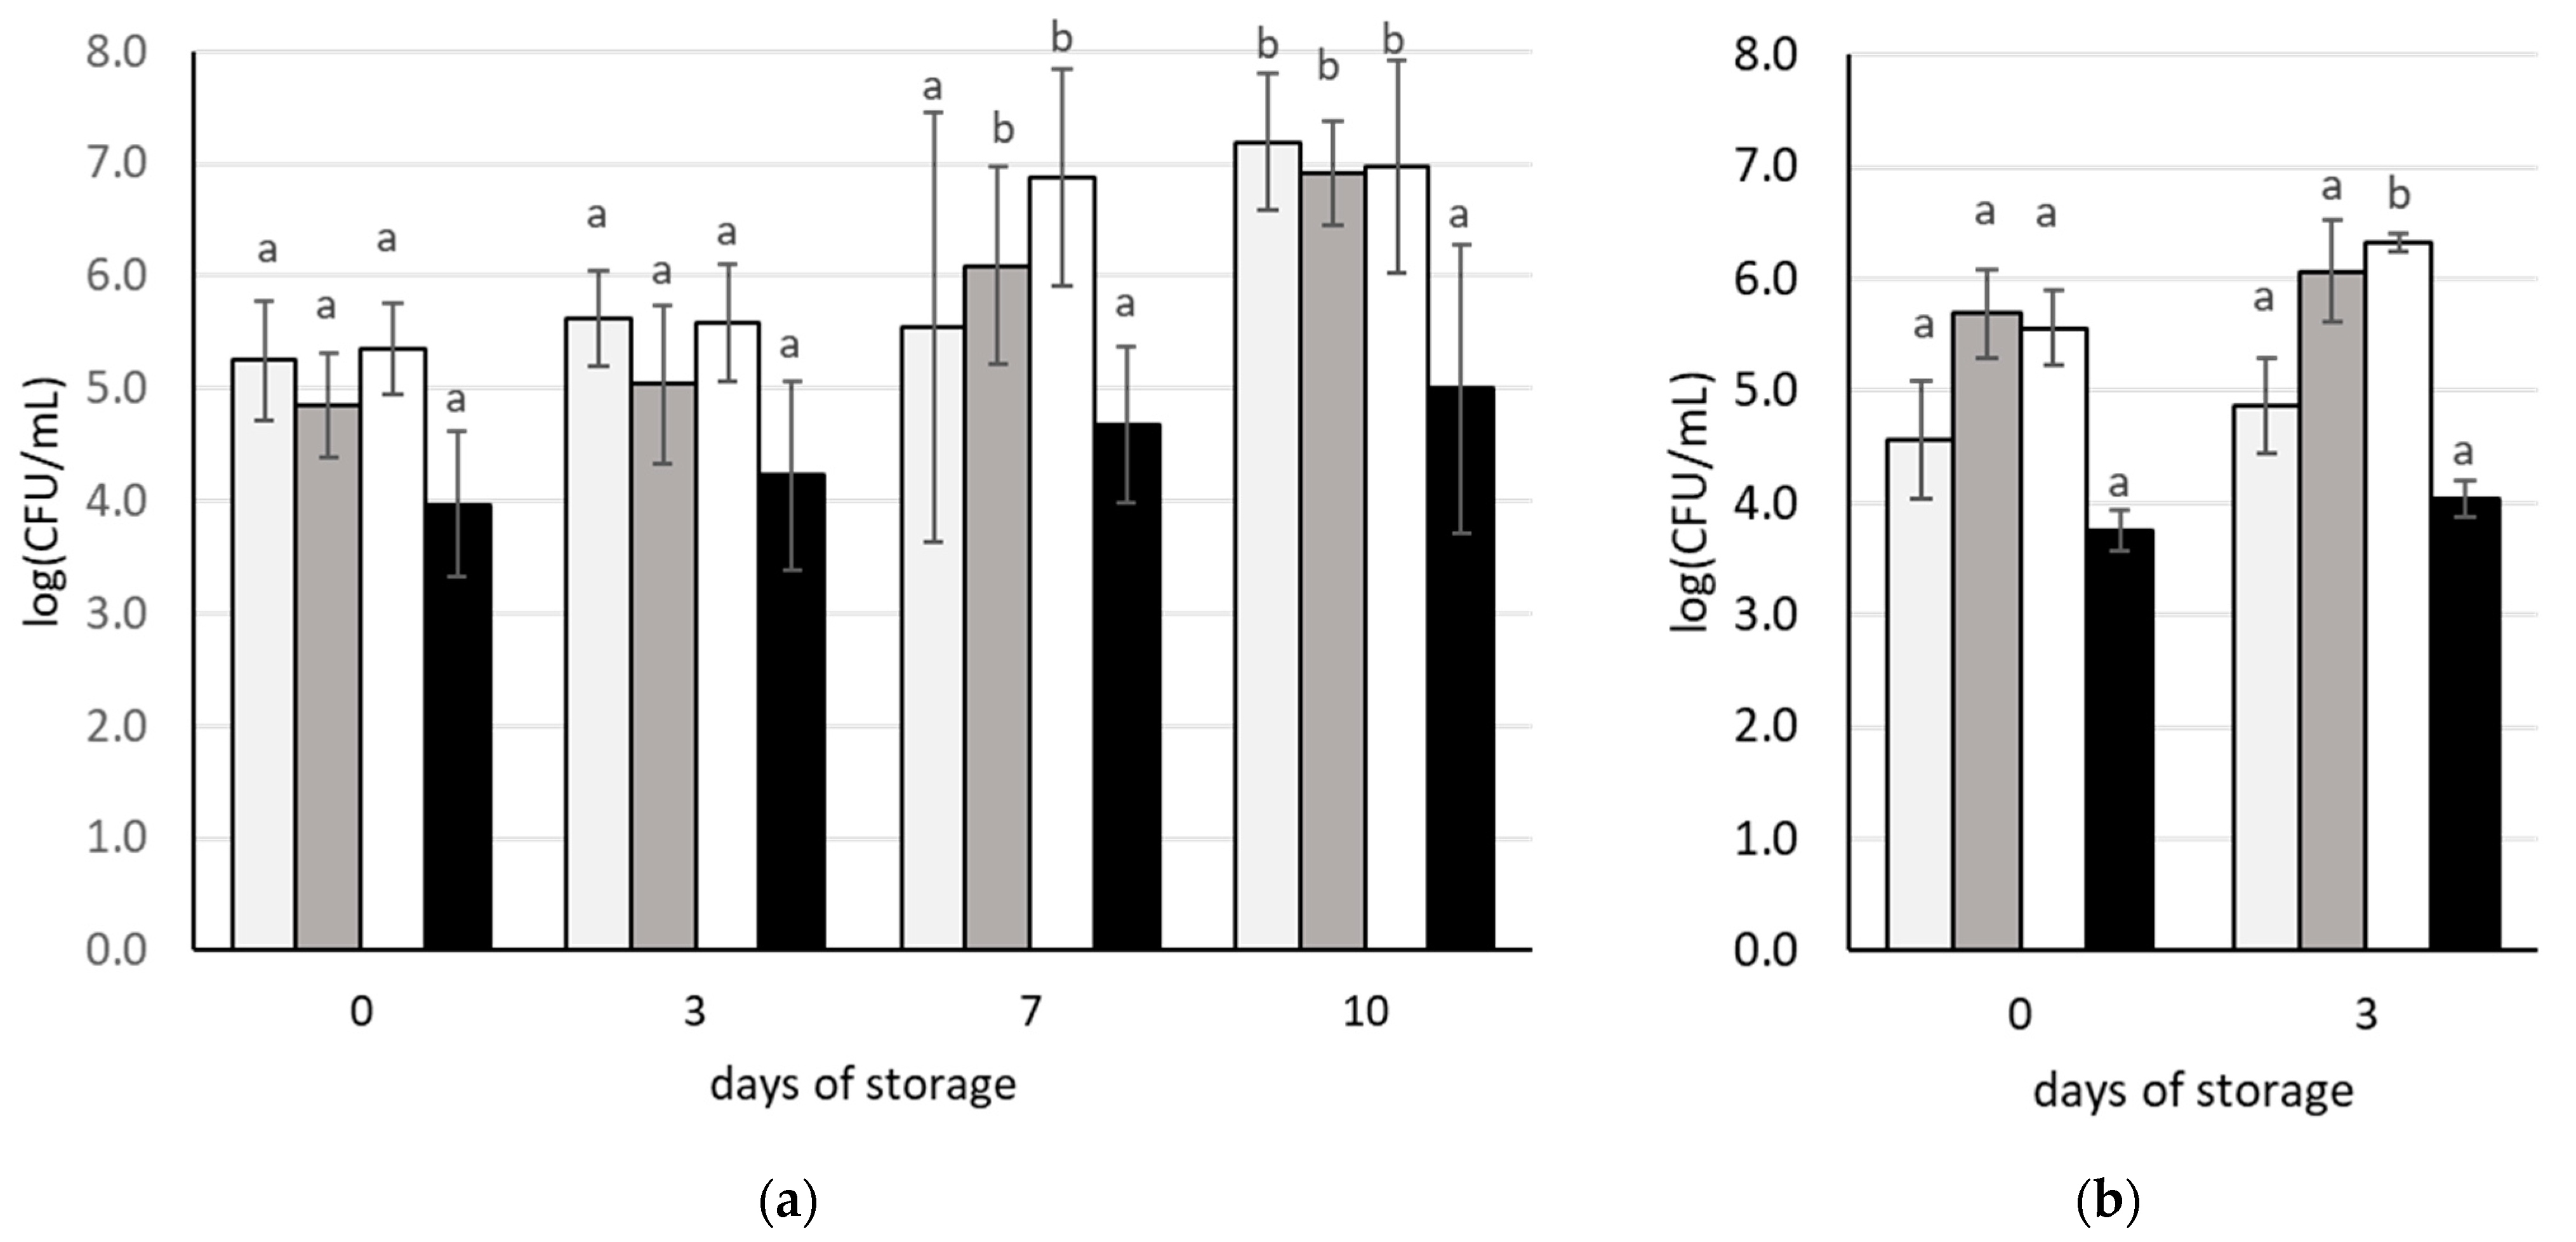
3.2. Changes in Microbial Populations during Storage of Carrot Juices

From a microbiological point of view, the batches from the two origins, lab-made and company, did not significantly differ in counts of psychrotrophic bacteria, enterobacteria, LAB, and Y&M, on the day of carrot juice preparation (Figure 1). In other studies, aerobic bacteria, enterobacteria, LAB, and Y&M in carrot juice ranged from 4.2–7.1 log CFU/mL, 2.7–5.1 log CFU/mL, 2.8–5.9 log CFU/mL, and 1.8–5.2 log CFU/mL respectively [2,3,5,24]. Although a large variability in microbial counts has been previously observed, data obtained in this study were in the same range.
The increase in microbial counts was mainly observed after 7 days of storage, as Y&M and enterobacterium counts became significantly higher from initial populations (Figure 1). The populations exceeded 6 log CFU/mL for enterobacteria and Y&M after 7 days, whatever the origin of juice.
A large variability of counts was observed for psychrotrophic bacteria after 7 days of storage, but after 10 days the mean population reached 7.2 log CFU/mL. The increase in LAB counts was moderate and corresponded to 1 log CFU/mL in 10 days of storage. This microbial group exhibited the lowest counts at any sampling time and counts did not exceed 5.2 log CFU/mL after 14 days of juice storage.
PCA was applied on physicochemical and microbiological data obtained for the carrot juice batches (Figure 2). The analysis indicated some correlations between color difference (ΔE), yeast and mold population, and enterobacterium population. This was confirmed with a Pearson correlation test: positive correlation between the populations of enterobacteria and Y&M (p < 0.0001 and r2 = 0.671), between color difference and enterobacterium counts (p = 0.004 and r2 = 0.251), and between color difference and Y&M counts (p = 0.003 and r2 = 0.251). The observations on the projected plan F1/F2 presented a global distribution of C (company) samples on the upper zone, which corresponds higher TA and TSS. Whatever the sample, a shift from left to right was observed when storage time increased, which represents the increase in microbial populations and color variation. From the analysis of previously published data and this study, no clear relationship between a microbial group, i.e., mesophilic bacteria, psychrotrophic bacteria, enterobacteria, LAB, or Y&M, and an observed spoilage indicator during storage, i.e., change of pH or TSS, increase of viscosity or sedimentation, color modification, could be assumed.

3.3. Changes in Volatile Compounds during Storage of Carrot Juices

Volatile compounds (n = 27) were analyzed for four lab-made batches, L1, L2, L3, and L4, during storage time. Those batches were chosen as they exhibited different behavior during storage: L2 was stopped after 7 days, L4 after 10 days, L3 exhibited a high color change after 14 days, whereas color change for L1 was not significant. The detected compounds belong to different chemical families: 16 terpenic compounds (α-pinene, o-cymene, β-pinene, sabinene, m-cymene, p-cymene, trans-γ-bisabolene, p-cymenene, β-myrcene, 1,3,8-p-menthatriene, 3-carene, isocaryophyllene, caryophyllene, 4-methyl-1-propan-2-ylbicyclo [3.1.0] hex-2-ene or β-thujene, cis-γ-bisabolene, α-phellandrene), and 11 compounds of other chemical families: acetic acid, ®-1-methyl-5-(1-methylethenyl)-cyclohexene, 2-methyl-1-(4-methylphenyl)propan-2-ol, 2-methoxyphenol or guaiacol, carveol, 6-methyl-5-heptene-2-one, hexanal, 2-butenal, ethanol, ethyl acetate, and tert-butyl-benzene.
PCA was applied with the 27 detected compounds as variables and for the five sampling times (days 0, 3, 7, 10, and 14) for each of the four batches. Projection of variables in the plan former by the axes F1 and F2 represented only 56.6% of data variability. It appears that data could not be gathered on the projection plan according to storage time, but some differences appeared between batches (Figure 3). In particular, batch L4 was the most separated, mainly projected in lower F2 values and higher F1 values.
The main volatile compounds in the samples were o-cymene and α-pinene, and in a lesser extent p-cymene (Table 2), as previously described as main components of carrot aroma [25,26]. Following those, β-pinene, trans-γ-bisabolene, m-cymene, β-myrcene, sabinene, cis-γ-bisabolene, caryophyllene pl®(R)-1-methyl-5-(1-methylvinyl)cyclohexene were the most abundant, consistently with the previous observation that mono and sesquiterpenes are the most abundant volatile compounds in carrot.
The number of compounds which content varied with storage time within batches were respectively 8, 7, 15, and 8 for batches L1, L2, L3, and L4 (Table 2). However, the observed changes of composition with time did not follow the same patterns for the different batches. An increase of 3-carene, ethanol, and ethyl acetate occurred when storage time increased for L1. L2 was characterized by an increase of α-pinene, β-pinene, 2-methoxyphenol, and ethyl acetate. An increase in carveol, isocaryophyllene, ethyl acetate, and 2-methoxyphenol was observed for batch L3 during carrot juice storage, whereas ethanol, α-pinene, β-pinene, isocaryophyllene, and 2-methoxyphenol increased for L4. Among those compounds, ethanol can be produced by yeasts and heterolactic acid bacteria, and ethyl acetate and 2-methoxyphenol can be produced by Pichia or Zygosaccharomyces yeasts, but also by Lactobacillus plantarum and Pediococcus pentosaceus [14,15]. Those compounds revealed a microbial development in carrot juice, but their levels were hardly detectable at the beginning of the storage and detected not before 7 days of storage. These compounds cannot be used as early indicators of spoilage. The increase in α-pinene and β-pinene in batches L2 and L4 is surprising. It was observed previously on dried and fresh-cut carrots [27,28]. Those compounds at high levels could cause a loss of quality because of harshness of odor and flavor.

3.4. Isolation, Identification and Characterization of Spoilage Potential of Bacteria and Fungi

Bacterial isolates were collected from carrot surface before washing (6 isolates), carrot juice at day 0 (24 isolates), carrot juice after 3 days of storage (17 isolates), after 7 days of storage (9 isolates), after 10 days of storage (3 isolates), or after 14 days of storage (3 isolates). They were individually assayed in carrot juice and gathered according to the modification of juice they induced (Table 3).
The identification of 30 isolates showed Pseudomonas spp. (15 isolates), Leuconostoc spp. (9 isolates), 5 isolates of enterobacteria, including one Erwinia sp. and one Leclercia sp., and one Weissella soli. This observation is consistent with the study from Patterson et al. (2012) [4], who investigated the dominant bacteria in carrot juice: they observed that Pseudomonas sp. was dominant on the day of preparation, followed by Pantoea/Erwinia. After 6 days of storage at 8 °C, they observed a decrease of Pseudomonas occurrence in favor of Pantoea/Erwinia, and with the presence of LAB in one batch, some identified as Leuconostoc kimchi.
All the isolates (n = 62), individually inoculated and stored in commercial carrot juice at 4 °C during 7 days, were able to grow, and exhibited 2.4 to 3.4 log CFU/mL of population increase. None of them modified the visual aspect of juice, nor the texture. None of them either modified pH significantly, the pH value of the juice before inoculation being 4.42, and comprised between 4.35 and 4.55 after storage (Table 3). On the opposite, all except six isolates resulted in rotten odor of juice (Table 3). The three identified isolates not leading to odor defect belonged to Pseudomonas genus. It could have been expected that the pH value decreased in the presence of LAB, but two factors might explain the observation: pH value of the juice was already low because lemon juice was present in the commercial product, and storage duration might have been too short to observe an effect on pH.
Interestingly, Leuconostoc spp. and Weissella spp. are heterolactic bacteria, which means that they produce from hexose a mix of lactic acid, ethanol and carbon dioxide, and ethanol has been detected as increasing in two batches after 7 or 14 days of storage. Some LAB can produce guaiacaol (2-methoxyphenol), but this has not been showed for Leuconostoc not Weissella [29]. Guaiacol exhibits a smoky or woody odor. However, the previous analysis of volatile compounds did not provide a hypothesis for the strong bad odor that some bacteria conferred to carrot juice.
Yeast and molds isolates were recovered from carrot juice at day 0 (6 isolates), carrot juice stored for 3 days (3 isolates), or for 7 days (10 isolates), after being obtained on SGA plates (Table 4). The ability of the 19 fungal isolates collected from shredded carrots and juices to grow in commercial carrot juice and to promote spoilage was assayed. As shown in Table 4, six isolates failed to grow or presented inconsistent growth: two of them were Didymella/Phoma sp. mold, known as a phytopathogen causing carrot fomosis, two were Debaryomyces hansenii yeasts, one was identified as Papiliotrema flavescens and the last yeast was Hanseniaspora uvarum. Those yeast species are commonly found on grape surface and other crops [30,31]. For five isolates which grew well, pH modification was lower than 0.2 units, and no change of texture or observation of gas production was noticed. Those isolates were molds, Talaromyces for two of them, Didymella/Phoma and Cladosporium, and one yeast Pichia fermentans. The absence of growth or the absence of detected spoilage when growth occurred within 7 days could be explained by the multiple stress related to the juice (acidic medium, low sugar quantity) and environment (low temperature, partial anoxia). In addition, most isolates which did not grow or did not induce spoilage were obtained from carrot juice stored between 0 and 3 days.
Lastly, eight isolates modified the properties of inoculated carrot juice during refrigerated storage (Table 4). One isolate, identified as Meyerozyma guilliermondii (36) resulted in a sticky juice and acidified the juice. The production of exopolysaccharides by Candida guilliermondii, the anamorph of M. guilliermondii has been described and could explain the texture modification [32]. Two isolates of the yeast Pichia fermentans (31C6, 39D1) were responsible for gas production and acidification of carrot juice. This was also the case for one isolate identified as Rhodotorula mucilaginosa (29C4). Two isolates from Penicillium sp. (35C10 and 37C11) produced gas. Eventually, one isolate identified as Candida sp. (33C8) and one isolate of Cladosporium sp. (32C7) acidified the carrot juice. The isolates Penicillium sp. 37C11 and Pichia fermentans 39D1 led to color modification of the juice during storage, and detrimental odors were noticed.
The formation of ethanol and carbon dioxide in stored fresh carrot juice can result from the metabolic activity of many species of yeasts and molds, including Pichia fermentans and Penicillium sp. [33]. In Crabtree-negative yeasts, such as Pichia fermentans, but also in Penicillium, ethyl acetate can be produced at high levels [34,35].
A combination of three isolates was selected to assess the ability of this mix to induce spoilage of carrot juice: Meyerozyma guilliermondii 36, Pichia fermentans 39D1 and Penicillium sp. 37C11. The mix of the three isolates resulted in acidification, gas production, and color (and odor) modification of carrot juice.

4. Conclusions

During refrigerated storage, fresh carrot juice is spoiled within a few days. In particular, the production of the volatile compounds ethanol, ethyl acetate, and 2-methoxyphenol was detected during storage. The investigation of efficacy of preservation treatments was facilitated and made more robust with the use of selected microbial targets. Leuconostoc spp., Pseudomonas spp., and enterobacterium strains, plus two yeasts and one mold isolated from fresh carrot juice showed to induce commercial carrot juice spoilage. Each of those microorganisms was used, alone or as a cocktail, in carrot juice to compare biological, chemical, or physical treatments aiming to increase the shelf-life.

Supplementary Materials

The following supporting information can be downloaded at https://0-www-mdpi-com.brum.beds.ac.uk/article/10.3390/beverages8010017/s1, Figure S1: Color difference for each carrot juice batch during storage time, as referred to day of preparation.

Author Contributions

Conceptualization, methodology, and supervision, C.L.-J., M.L. and F.R.; investigation, B.Q., F.-E.M. and M.H.; data curation, B.Q., M.H. and C.L.-J.; writing—original draft preparation, F.R.; writing—review and editing, all authors; project administration and funding acquisition, F.R. All authors have read and agreed to the published version of the manuscript.

Funding

This work was supported by European Union and Region Reunion through the FEDER program RE0002361.

Data Availability Statement

Data available upon request.

Conflicts of Interest

The authors declare no conflict of interest.

References

  1. Sharma, K.D.; Karki, S.; Thakur, N.S.; Attri, S. Chemical Composition, Functional Properties and Processing of Carrot—A Review. J. Food Sci. Technol. 2012, 49, 22–32. [Google Scholar] [CrossRef] [PubMed] [Green Version]
  2. Hammad, A.A.; Abd El-Khalek, H.H.; Youssef, K.A.; Abd El-Kader, R.M. Microbiological, Nutritional and Sensorial Changes in Fresh Carrot Juice Preserved by Irradiation. Hammad 2013, 11, 2224–6088. [Google Scholar]
  3. Riganakos, K.A.; Karabagias, I.K.; Gertzou, I.; Stahl, M. Comparison of UV-C and Thermal Treatments for the Preservation of Carrot Juice. Innov. Food Sci. Emerg. Technol. 2017, 42, 165–172. [Google Scholar] [CrossRef]
  4. Patterson, M.F.; McKay, A.M.; Connolly, M.; Linton, M. The Effect of High Hydrostatic Pressure on the Microbiological Quality and Safety of Carrot Juice during Refrigerated Storage. Food Microbiol. 2012, 30, 205–212. [Google Scholar] [CrossRef] [PubMed]
  5. Gouma, M.; Álvarez, I.; Condón, S.; Gayán, E. Pasteurization of Carrot Juice by Combining UV-C and Mild Heat: Impact on Shelf-Life and Quality Compared to Conventional Thermal Treatment. Innov. Food Sci. Emerg. Technol. 2020, 64, 102362. [Google Scholar] [CrossRef]
  6. Martínez-Flores, H.E.; Garnica-Romo, M.G.; Bermúdez-Aguirre, D.; Pokhrel, P.R.; Barbosa-Cánovas, G.V. Physico-Chemical Parameters, Bioactive Compounds and Microbial Quality of Thermo-Sonicated Carrot Juice during Storage. Food Chem. 2015, 172, 650–656. [Google Scholar] [CrossRef]
  7. Aneja, K.R.; Dhiman, R.; Aggarwal, N.K.; Kumar, V.; Kaur, M. Microbes Associated with Freshly Prepared Juices of Citrus and Carrots. Int. J. Food Sci. 2014, 2014, 408085. [Google Scholar] [CrossRef] [Green Version]
  8. García Carrillo, M.; Ferrario, M.; Guerrero, S. Study of the Inactivation of Some Microorganisms in Turbid Carrot-Orange Juice Blend Processed by Ultraviolet Light Assisted by Mild Heat Treatment. J. Food Eng. 2017, 212, 213–225. [Google Scholar] [CrossRef]
  9. Liu, Q.; Jin, X.; Feng, X.; Yang, H.; Fu, C. Inactivation Kinetics of Escherichia coli O157:H7 and Salmonella Typhimurium on Organic Carrot (Daucus carota L.) Treated with Low Concentration Electrolyzed Water Combined with Short-Time Heat Treatment. Food Control 2019, 106, 106702. [Google Scholar] [CrossRef]
  10. Zhu, Y.; Li, C.; Cui, H.; Lin, L. Antimicrobial Mechanism of Pulsed Light for the Control of Escherichia coli O157:H7 and Its Application in Carrot Juice. Food Control 2019, 106, 106751. [Google Scholar] [CrossRef]
  11. Xylia, P.; Chrysargyris, A.; Botsaris, G.; Tzortzakis, N. Mint and Pomegranate Extracts/Oils as Antibacterial Agents against Escherichia coli O157:H7 and Listeria monocytogenes on Shredded Carrots. J. Food Saf. 2018, 38, e12423. [Google Scholar] [CrossRef]
  12. Pokhrel, P.R.; Toniazzo, T.; Boulet, C.; Oner, M.E.; Sablani, S.S.; Tang, J.; Barbosa-Cánovas, G.V. Inactivation of Listeria innocua and Escherichia coli in Carrot Juice by Combining High Pressure Processing, Nisin, and Mild Thermal Treatments. Innov. Food Sci. Emerg. Technol. 2019, 54, 93–102. [Google Scholar] [CrossRef]
  13. Ratphitagsanti, W.; De Lamo-Castellvi, S.; Balasubramaniam, V.M.; Yousef, A.E. Efficacy of Pressure-Assisted Thermal Processing, in Combination with Organic Acids, against Bacillus amyloliquefaciens Spores Suspended in Deionized Water and Carrot Puree. J. Food Sci. 2010, 75, M46–M52. [Google Scholar] [CrossRef] [PubMed]
  14. Tola, Y.B.; Ramaswamy, H.S. Combined Effects of High Pressure, Moderate Heat and pH on the Inactivation Kinetics of Bacillus licheniformis Spores in Carrot Juice. Food Res. Int. 2014, 62, 50–58. [Google Scholar] [CrossRef]
  15. Lichtenthaler, H.K.; Buschmann, C. Chlorophylls and Carotenoids: Measurement and Characterization by UV-VIS Spectroscopy. Curr. Protoc. Food Anal. Chem. 2001, 1, F4.3.1–F4.3.8. [Google Scholar] [CrossRef]
  16. Weisburg, W.G.; Barns, S.M.; Pelletier, D.A.; Lane, D.J. 16S Ribosomal DNA Amplification for Phylogenetic Study. J. Bacteriol. 1991, 173, 697–703. [Google Scholar] [CrossRef] [Green Version]
  17. Fessard, A.; Bourdon, E.; Payet, B.; Remize, F. Identification, Stress Tolerance, and Antioxidant Activity of Lactic Acid Bacteria Isolated from Tropically Grown Fruits and Leaves. Can. J. Microbiol. 2016, 62, 550–561. [Google Scholar] [CrossRef]
  18. Gardes, M.; Bruns, T.D. ITS Primers with Enhanced Specificity for Basidiomycetes–Application to the Identification of Mycorrhizae and Rusts. Mol. Ecol. 1993, 2, 113–118. [Google Scholar] [CrossRef]
  19. Lee, S.; Lee, D.K. What is the Proper Way to Apply the Multiple Comparison Test? Korean J. Anesth. 2018, 71, 353–360. [Google Scholar] [CrossRef] [Green Version]
  20. Wuyts, S.; Van Beeck, W.; Oerlemans, E.F.M.; Wittouck, S.; Claes, I.J.J.; De Boeck, I.; Weckx, S.; Lievens, B.; De Vuyst, L.; Lebeer, S. Carrot Juice Fermentations as Man-Made Microbial Ecosystems Dominated by Lactic Acid Bacteria. Appl. Environ. Microbiol. 2018, 84, e00134-18. [Google Scholar] [CrossRef] [Green Version]
  21. Moreira, S.A.; Pintado, M.E.; Saraiva, J.A. Effect of a Winter Savory Leaf Extract Obtained Using High Hydrostatic Pressure on the Quality of Carrot Juice. J. Sci. Food Agric. 2021, 101, 74–81. [Google Scholar] [CrossRef] [PubMed]
  22. Demir, N.; Acar, J.; Bahceci, K.S. Effects of Storage on Quality of Carrot Juices Produced with Lactofermentation and Acidification. Eur. Food Res. Technol. 2004, 218, 465–468. [Google Scholar] [CrossRef]
  23. Mokrzycki, W.S.; Tatol, M. Colour Difference DELTA(E)—A Survey. MG&V 2011, 20, 383–411. [Google Scholar]
  24. Umair, M.; Jabbar, S.; Nasiru, M.M.; Senan, A.M.; Zhuang, H.; Zhang, J. Sequential Application of High-Voltage Electric Field Cold Plasma Treatment and Acid Blanching Improves the Quality of Fresh Carrot Juice (Daucus carota L.). J. Agric. Food Chem. 2020, 68, 15311–15318. [Google Scholar] [CrossRef]
  25. Kjeldsen, F.; Christensen, L.P.; Edelenbos, M. Quantitative Analysis of Aroma Compounds in Carrot (Daucus carota L.) Cultivars by Capillary Gas Chromatography Using Large-Volume Injection Technique. J. Agric. Food Chem. 2001, 49, 4342–4348. [Google Scholar] [CrossRef]
  26. Muchlinski, A.; Ibdah, M.; Ellison, S.; Yahyaa, M.; Nawade, B.; Laliberte, S.; Senalik, D.; Simon, P.; Whitehead, S.R.; Tholl, D. Diversity and Function of Terpene Synthases in the Production of Carrot Aroma and Flavor Compounds. Sci. Rep. 2020, 10, 9989. [Google Scholar] [CrossRef] [PubMed]
  27. Pu, H.; Hu, Q.; Wang, L.; Pei, F.; Mariga, A.M.; Yang, W. Exogenous Bacterial Composition Changes Dominate Flavor Deterioration of Dried Carrots during Storage. Food Chem. Toxicol. 2019, 134, 110833. [Google Scholar] [CrossRef]
  28. Guimarães, I.C.; dos Reis, K.C.; Menezes, E.G.T.; Borges, P.R.S.; Rodrigues, A.C.; Leal, R.; Hernandes, T.; de Carvalho, E.H.N.; Vilas Boas, E.V.D.B. Combined Effect of Starch/Montmorillonite Coating and Passive MAP in Antioxidant Activity, Total Phenolics, Organic Acids and Volatile of Fresh-Cut Carrots. Int. J. Food Sci. Nutr. 2016, 67, 141–152. [Google Scholar] [CrossRef] [PubMed]
  29. Nsogning Dongmo, S.; Sacher, B.; Kollmannsberger, H.; Becker, T. Key Volatile Aroma Compounds of Lactic Acid Fermented Malt Based Beverages–Impact of Lactic Acid Bacteria Strains. Food Chem. 2017, 229, 565–573. [Google Scholar] [CrossRef] [PubMed]
  30. Kachalkin, A.V.; Glushakova, A.M.; Venzhik, A.S. Presence of Clinically Significant Endophytic Yeasts in Agricultural Crops: Monitoring and Ecological Safety Assessment. IOP Conf. Ser. Earth Environ. Sci. 2021, 723, 042005. [Google Scholar] [CrossRef]
  31. Sumby, K.M.; Caliani, N.S.; Jiranek, V. Yeast Diversity in the Vineyard: How It Is Defined, Measured and Influenced by Fungicides. Aust. J. Grape Wine Res. 2021, 27, 169–193. [Google Scholar] [CrossRef]
  32. Gientka, I.; Bzducha-Wróbel, A.; Stasiak-Różańska, L.; Bednarska, A.A.; Błażejak, S. The Exopolysaccharides Biosynthesis by Candida Yeast Depends on Carbon Sources. Electron. J. Biotechnol. 2016, 22, 31–37. [Google Scholar] [CrossRef] [Green Version]
  33. Grijseels, S.; Nielsen, J.C.; Nielsen, J.; Larsen, T.O.; Frisvad, J.C.; Nielsen, K.F.; Frandsen, R.J.N.; Workman, M. Physiological Characterization of Secondary Metabolite Producing Penicillium Cell Factories. Fungal Biol. Biotechnol. 2017, 4, 8. [Google Scholar] [CrossRef] [PubMed] [Green Version]
  34. Ragaert, P.; Devlieghere, F.; Devuyst, E.; Dewulf, J.; Van Langenhove, H.; Debevere, J. Volatile Metabolite Production of Spoilage Micro-Organisms on a Mixed-Lettuce Agar during Storage at 7 °C in Air and Low Oxygen Atmosphere. Int. J. Food Microbiol. 2006, 112, 162–170. [Google Scholar] [CrossRef] [PubMed]
  35. Löser, C.; Urit, T.; Bley, T. Perspectives for the Biotechnological Production of Ethyl Acetate by Yeasts. Appl. Microbiol. Biotechnol. 2014, 98, 5397–5415. [Google Scholar] [CrossRef]
Figure 1. Microbial population during storage for lab-made (a) and commercial juice (b). Light grey bars: psychrotrophic bacteria, grey bars: yeasts and molds, white bars: enterobacteria, black bars: lactic acid bacteria. Bars represent means of values for batches L1 to L7 for lab-made juices, with the number of batches being 7, 7, 6, and 4 at days 0, 3, 7, and 10 days respectively, and for batches C1 to C3 for company juices. Error bars correspond to standard deviations and different letters indicate significant differences between days of storage for a group of microorganisms and a type of juice (lab-made or company).
Beverages 08 00017 g001
Figure 2. Principal component analysis of physicochemical and microbiological data collected from carrot juice of the batches L1 to L7 and C1 to C3 during refrigerated storage, after 0, 3, 7, and 10 days. Each vector in red corresponds to variables, and dots to samples. Samples were labelled as batch number-day of analysis.
Beverages 08 00017 g002
Figure 3. PCA of volatile compounds of the four analyzed batches at five different storage times (0, 3, 7, 10, and 14 days). L1, L2, L3, and L4 refer to batches, and the number after hyphen refers to storage time. A different color was assigned to different batches.
Beverages 08 00017 g003
Table 1. pH, titratable acidity (TA), total soluble solids (TSS), total carotenoid content (TCC) and color (L*, a*, b*, and color difference ΔE to the initial day) of lab-made (batches L1 to L7) and company juices (batches C1 to C3). The letter n indicates the number of analyzed independent batches. Values are the means ± standard deviation of three analytical replicates of the n batches. Different letters in the same column indicate significant differences detected with REGWQ test (p < 0.001).
BatchDaypHTA (%)TSS (°Brix)TCC (µg/mL)L*a*b*ΔE
Lab-made (n = 7)06.2 ± 0.4 a2.8 ± 0.2 b8.8 ± 0.7 b3.4 ± 1.2 a26.1 ± 7.5 a32.7 ± 5.3 a28.6 ± 6.2 a0 c
Company (n = 3)06.0 ± 0.4 a3.2 ± 0.1 a9.7 ± 0.1 a4.3 ± 1.3 a32.4 ± 3.7 a29.4 ± 7.7 a27.2 ± 5.3 a0 c
Lab-made (n = 7)36.1 ± 0.6 a2.8 ± 0.1 b9.0 ± 0.5 b3.8 ± 0.8 a26.0 ± 7.9 a31.8 ± 5.0 a31.6 ± 6.4 a5.5 ± 5.0 b
Company (n = 3)36.1 ± 0.1 a3.3 ± 0.1 a9.7 ± 0.1 a3.1 ± 3.0 a31.7 ± 2.0 a28.9 ± 6.8 a27.6 ± 4.9 a5.8 ± 1.4 ab
Lab-made (n = 7)76.2 ± 0.6 a2.8 ± 0.2 b8.9 ± 0.5 b3.2 ± 1.1 a27.2 ± 8.0 a29.4 ± 8.5 a29.1 ± 7.6 a7.1 ± 5.6 ab
Lab-made (n = 5)106.3 ± 0.3 a2.8 ± 0.2 b8.8 ± 0.6 b3.0 ± 1.1 a30.6 ± 10.4 a32.5 ± 2.9 a30.6 ± 1.7 a6.5 ± 2.8 ab
Lab-made (n = 4)146.2 ± 0.3 a2.8 ± 0.2 b8.9 ± 0.7 b2.8 ± 0.9 a25.2 ± 12.4 a29.1 ± 3.2 a31.2 ± 3.4 a11.5 ± 3.9 a
Table 2. Volatile compounds modifications during storage time for the four analyzed batches, L1, L2, L3 and L4, of carrot juice.
Volatile Compound (RI, CAS Number) *Batch L1Batch L2Batch L3Batch L4Flavor Description
o-cymene (1287, 527-84-4)H **HH 0.002 ▼ (−42%) D10H 0.012 ≈citrus
α-pinene (1033, 80-56-8)HH < 0.0001 ▲ (+58%) D10H 0.004 ▼ (−27%) D10H 0.001 ▲ (+81%) D10pine, turpentine
p-cymene (1269, 99-87-6)M 0.014 ≈H 0.027 ≈H 0.039 ≈H 0.002 ≈citrus, solvent
β-pinene (1101, 127-91-3)M 0.037 ≈M 0.0002 ▲ (+73%) D14M 0.003 ▼ (−34%) D10M 0.002 ▲ (+62%) D10pine, resin
(R)-1-methyl-5-(1-methylvinyl)cyclohexene (1193, 1461-27-4)MMMM-
trans-γ-bisabolene (1751, 53585-13-0)M 0.016 ≈MM 0.005 ≈M 0.09 ≈soap, spicy
m-cymene (1238, 535-77-3)M 0.003 ≈M 0.010 ≈M 0.003 ▼ (−29%) D10M 0.016 ≈-
β-myrcene (1150, 123-35-3)LLL 0.008 ▼(−36%) D10M 0.010 ≈spicy, plastic
sabinene (1123, 3387-41-5)M 0.024 ▼ (−93%) D14M 0.014 ≈L 0.009 ▼ (−45%) D14L 0.002 ≈pepper, turpentine
cis-γ-bisabolene (1743, 13062-00-5)LLLMfat, wood
caryophyllene (1653, 13877-93-5)L 0.036 ≈LLMspicy, clove
1,3,8-p-menthatriene (1457, 18368-95-1)LL < 0.0001 ▼ (−45%) D10L 0.007 ▼ (−47%) D10L 0.002 ▼ (−53%) D7turpentine, woody
β-thujene (1119, 28634-89-1)LLL 0.017 ≈L-
α-phellandrene (1165, 99-83-2)LL 0.048 ≈LLturpentine, mint
3-carene (1143, 13466-78-9)L 0.004 ▲ (+440%) D14LLLlemon, resin
carveol (1756, 99-48-9)L 0.039 ▼ (−73%) D14L 0.048 ≈L 0.032 ▲ (+140%) D7L 0.001 ≈fresh, spearmint
isocaryophyllene (1616, 118-65-0)LLL 0.022 ▲ (not detected at D0) D14L < 0.0001 ▲ (not detected at D0) D10wood
p-cymenene (1475, 100-42-5)L 0.042 ≈L < 0.0001 ▼ (−40%) D10L 0.018 ≈L 0.004 ≈balsamic, gasoline
tert-butyl benzene (1236, 98-06-6)LL 0.007 ≈L 0.0001 ▼ (−71%) D14L < 0.0001 ≈-
2-methoxyphenol (1885, 90-05-1)L < 0.0001 ≈L < 0.0001 ▲ (not detected D0) D7L < 0.0001 ▲ (+9152%) D10L < 0.0001 ▲ (+456%) D14smoke, medicine
ethanol (1006, 64-17-5)L < 0.001 ▲ (+162%) D14M < 0.0001 ▼ (−35%) D10LH < 0.0001 ▲ (+4057%) D7sweet
ethyl acetate (989, 141-78-6)L 0.004 ▲ (+92%) D10L < 0.0001 ▲ (+1600%) D7L < 0.0001 ▲ (+783%) D14Lpineapple, ether
acetic acid (1509, 64-19-7)L 0.020 ▼ (−99%) D7LL 0.005 ▼ (−65%) D7L 0.027 ▼ (−58%) D14sour
2-butenal (1051, 4170-30-3)L 0.001 ▼ (+72%) D14L < 0.0001 ≈L < 0.0001 ≈L 0.028 ≈-
hexanal (1089, 66-25-1)L 0.001 ≈L 0.025 ≈L < 0.0001▼ (−77%) D7L < 0.0001 ≈grass, tallow
6-methyl, 5-hepten-2-one (1359, 110-93-0)L 0.048 ≈L 0.027 ≈L 0.001 ▼ (−31%) D14L 0.041 ≈lemon, musty
α, α,4-trimethylbenzene methanol (1883, 1197-01-9)L 0.013 ▼ (−99%) D14L 0.030 ≈L 0.014 ≈L < 0.0001▲ (+277%) D10cherry, camphor
* RI: experimental retention index, CAS: Chemical Abstracts Service registry number; ** Range of signal: H means high content, 100–500 µg/100 g butanol equivalent, M means medium content 10–100 µg/100 g butanol equivalent, L means low content 0–10 µg/100 g butanol equivalent; data were analyzed with REGWQ test of mean comparison and significant differences were pointed with p-value, indicated if <0.05; change of content during carrot juice storage (indicated only if the difference was significant): ▲ means increase compared to day 0, ▼ means decrease and ≈ means constant, the number in parentheses indicates the percent of change, and Dx indicates with x the day at which significant difference to time 0 occurred.
Table 3. Modification of commercial carrot juice following inoculation with selected microbial isolates. Different colors were used for isolate identification to indicate the microbial group: green for Leuconostoc, orange for Pseudomonas, blue for Enterobacteriaceae, purple for Weissella, and black for non-identified isolates.
Number of Isolates with Same Source and Same Effects on JuiceIsolation Source (Carrot)Population Increase in Carrot Juice (log CFU/mL)pH ValueOdor
Modification
Isolate Reference and Bacterium Identification
N/AN/A *N/A4.42noN/A (control not inoculated)
6Surface before washing2.4–3.44.35–4.54yes49d04 Leuconostoc sp., 1a01 Pseudomonas sp., 2a02 Pseudomonas moraviensis, 52d07 Pseudomonas veronii, 25b10, 72e12 n.d. **
3Juice, day of preparation2.7–3.04.51–4.55no50d05 Pseudomonas putida, 4a04, 10a09 n.d.
21Juice, day of preparation2.6–3.44.35–4.54yes56d09 Enterobacteriaceae, 31c02 and 70e10 Leuconostoc citreum, 57d10 and 43c10 Leuconostoc mesenteroides, 30c01 Leuconostoc miyukkimchii, 37c07 Pseudomonas fluorescens, 7a07 Pseudomonas fragi, 46d02 and 3a03 P. moraviensis, 34c05 P. veronii, 35c06, 5a05, 6a06, 20b05, 73f01, 38c08, 32c03, 33c04, 26b11 and 15a12 n.d.
2Juice, stored for 3 days2.8–3.04.37–4.51no51d06 and 22b07 Pseudomonas sp.
15Juice, stored for 3 days2.4–3.44.35–4.51yes11a10 Enterobacteriaceae, 24b09 Erwinia sp., 74f02 L. citreum, 44c11 P. fluorescens, 42c09 Pseudomonas libanensis, 39c12 L. miyukkimchi, 45d01 Pseudomonas protegens, 65e05, 18b03, 71e11, 61e01, 19b04, 47d03, 62e02 and 21b06 n.d.
9Juice, stored for 7 days2.5–3.34.40–4.51yes63e03 Enterobacteriaceae, 55d08 Leclercia sp., 8a08, 16b01, 66e06, 38e08, 67e07, 13a11 and 27b12 n.d.
1Juice, stored for 10 days3.14.40no64e04 n.d.
2Juice, stored for 10 days3.0–3.14.42–4.46yes69e09 Weissella soli, 23b08 n.d.
3Juice, stored for 14 days3.0–3.44.40–4.45yes59d12 L. mesenteroides, 17b02 Pseudomonas sp., 58d11 n.d.
* N/A not applicable, ** n.d. not determined.
Table 4. Origin of fungal isolates, identification and effects on carrot juice after 7 days of storage at 4 °C.
Isolate Reference and IdentificationIsolation from Carrot Juice: Time after PreparationGrowth in Carrot Juice *pH ValueTexture ModificationGas ProductionColor Difference to Day 0
N/A ** (control not inoculated)N/AN/A4.6nono0.5
6A6 Debaryomyces hanseniiDay 0+/−4.4nonon.d. ***
26C1 Didymella sp./Phoma sp.Day 0+/−4.5nonon.d.
28C3 Didymella sp./Phoma sp.Day 0-4.5nonon.d.
30C5 Didymella sp./Phoma sp.Day 0+4.4nonon.d.
4A4 Talaromyces funiculosusDay 0+4.4nonon.d.
5A5 Talaromyces sp.Day 0+4.5nonon.d.
U Debaryomyces hanseniiDay 3+/−4.5nonon.d.
25B12 Papiliotrema flavescensDay 3-4.5nonon.d.
29C4 Rhodotorula mucilaginosaDay 3+4.3noyesn.d.
33C8 Candida sp.Day 7+4.3nonon.d.
32C7 Cladosporium sp.Day 7+4.3nonon.d.
34C9 Cladosporium sp.Day 7+4.5nonon.d.
37C11 Penicillium sp.Day 7+4.5noyes2.3
13B1 Hanseniasopra uvarumDay 7+/−4.5nonon.d.
36 Meyerozyma guillermondiiDay 7+4.3yesno0.3
35C10 Penicillium sp.Day 7+4.4noyesn.d.
31C6 Pichia fermentansDay 7+4.3noyesn.d.
39D1 P. fermentansDay 7+4.3noyes3.1
40D2 P. fermentansDay 7+4.4nonon.d.
Mix 36 + 37C11 + 39D1N/A+4.3n.d.yes1.9
* Growth in carrot juice: (−) no growth observed, (+/−) absence of growth in > 57% of assays, (+) growth in > 63% of assays. ** N/A: not applicable. *** n.d.: not determined.
Publisher’s Note: MDPI stays neutral with regard to jurisdictional claims in published maps and institutional affiliations.

