
Sensory Profiling and External Preference Mapping of Pre-Thickened Water Products for Dysphagia


1
Center for Sensory Analysis and Consumer Behavior, Kansas State University, Manhattan, KS 66502, USA
2
Communication Sciences & Disorders School of Family Studies & Human Services, Kansas State University, Manhattan, KS 66506, USA
*
Author to whom correspondence should be addressed.
Beverages 2022, 8(1), 2; https://0-doi-org.brum.beds.ac.uk/10.3390/beverages8010002
Submission received: 8 October 2021
/
Revised: 21 December 2021
/
Accepted: 23 December 2021
/
Published: 4 January 2022
(This article belongs to the Section Sensory Analysis of Beverages)
Abstract
:Dysphagia is a dysfunction of the swallowing system and thickened beverages are widely prescribed as a treatment. The objective of this study was to determine the sensory characteristics of pre-thickened water products and determine sensory drivers of liking for those types of products. Pre-thickened water products (two starch-based and two gum-based) were tested in both nectar and honey thick versions. Based on product availability, one product was neutral water, and the others were water with lemon flavoring added. The sensory characteristics of the products were evaluated with a highly trained descriptive panel, and the viscosity of the products was evaluated with both the Bostwick consistometer and the line spread test. Previously published consumer data was used to determine preference maps with the descriptive data. All lemon-flavored products had similar flavor characteristics, except the Thick & Easy Clear that had a less lemon-related flavor than the others. After excluding the lemon-related flavor characteristics, all pre-thickened products had similar “base flavor” notes, no matter whether the products were starch-based or gum-based. This contrasts with literature, which reports differences in flavor of thickened beverages prepared using thickening agents. The thickness of the products varied between nectar and honey thickness, but also varied among products that were stated to be at the same level of thickness. External preference mapping showed that both lemon-related flavor and a thinner beverage texture are potential drivers of consumers acceptance of the product, which was expected based on other studies. In conclusion, pre-thickened beverages are good alternatives for self-mixed thickening agents but a standard for thickness should be agreed on and used by manufacturers.

1. Introduction
Dysphagia is a dysfunction of the swallowing process which is a prevalent symptom in degenerative diseases such as stroke, dementia, and Parkinson’s disease [1]. It is estimated that 8% of the world’s population (—100 million people) has difficulty drinking beverages such as water and eating regular foods due to dysphagia (impaired swallowing) [2]. In the US, up to 60% of the elderly population in care situations have some degree of swallowing disorder [3]. Dysphagia can result in less-threatening conditions such as discomfort (e.g., chest pain) and psychological effects (such as embarrassment from coughing) or more severe conditions and illnesses such as choking, aspiration, aspiration pneumonia, dehydration, malnutrition, and even death [4].
Due to the difficulty of swallowing, it is challenging to ensure the patients have adequate nutritional intake and hydration from food and beverages [1]. When swallowing regular fluids, well-coordinated muscle control and accurate timing between the swallowing system and the breathing system is highly required [5]. Beverages generally are thickened to serve the purpose of reducing the flow speed to match the patients’ capability for swallowing [6]. They are widely prescribed for patients with dysphagia as the main source of hydration [7].
Patients with dysphagia are mostly prescribed liquids that have been thickened to levels of nectar-like and honey-like levels of modification [6]. It is important to provide patients with dysphagia an appropriate beverage consistency. If the beverage is too thin the fluid can flow too fast and result in fluid aspiration. If the liquid is too thick it contributes to post-swallow residue and an undesirable texture. Although Robbins et al. [8] showed the continued risk of aspiration when using thickened liquids for dysphagia management, various authors have discussed benefits in many patients. Those benefits include controlling liquid from entering the laryngeal vestibular area [9] and a decrease in aspiration [10,11,12].
Both pre-thickened (ready-to-serve) beverages, and instant powdered/gel thickening agents to be mixed with a beverage, are available. There are some disadvantages of using instant thickening agents compared to pre-thickened beverage products. First, instant thickening products require accurate mixing technique and accurate measurement to achieve the target consistency. A failure to use the correct amount of thickening agent can result in a modification that is either too thin or too thick texture which can increase the health risk of the patients [5]. Second, ready-to-serve beverages are more consistent in texture and simple to use [13]. Lastly, when labor costs of healthcare staff are considered, the cost of manually making thickened liquids is higher than commercially pre-thickened liquids [13]. However, that last benefit must be tempered by the understanding that many clinical settings may not consider the up-front costs of dietary treatments and choose the “least-cost” option or supplier for thickeners [14].
As a result of the addition of a thickening agent, the texture and flavor characteristics of beverages can be changed and disliked by the patients [15,16,17], which makes it difficult to achieve adequate hydration from drinking less. Therefore, studying the sensory characteristics of thickened beverages is necessary and can potentially help to reformulate the products to increase the patients’ acceptance of the products. Previous studies examined the sensory characteristics of beverages thickened with commercial thickening powder products [15,16,18] or potential alternative thickening agents [19] but little research was found about the sensory properties of pre-thickened beverages. Chambers, Jenkins and Garcia [20] studied the texture characteristics of one pre-thickened product in the process of developing a texture lexicon and determining an analysis of thickened liquids during ingestion [16]. A previous consumer study with commercially available pre-thickened beverage products discovered that healthy individual generally preferred thicker consistency [21].
The purposes of this study are (1) to compare the sensory profiles of various commercially available pre-thickened water products and determine the drivers of acceptance for these products and (2) determine the flow measurements as physical measures of thickness.
2. Materials and Methods
2.1. Panelists
The sensory properties of products were evaluated with a trained descriptive panel made up of six highly trained panelists from Center for Sensory Analysis and Consumer Behavior, Kansas State University (Manhattan, KS, USA). All panelists had completed over 120 h of descriptive sensory analysis training and had more than 1000 h of sensory testing experience which included a variety of beverages. Similar numbers of panelists have been shown to be able to appropriately describe and quantify sensory properties of products [22,23,24].
A consensus method [25,26] was applied to compile descriptive profiles for water products. Panelists first evaluated the sample individually. The panel leader then led a discussion about perceptions, which resulted in all panelists agreeing on the intensity of each attribute. The list of attributes, definitions and references is found in Table A1. A numeric scale from 0 to 15 (0-none, 15-extremly high) with 0.5 increments was used for evaluation and the texture attributes were adapted from the texture analysis for thickened beverage developed previously [20]. Other studies on various product types have used similar procedures to describe sensory properties of products [27,28,29,30,31,32,33]
2.2. Samples
Four pre-thickened water products (brands) commercially available in two consistencies (Nectar and Honey) were evaluated in this study. Both consistencies were tested for each product. All products are available for purchase in the United States. Thick & Easy Hydrolyte and ReadyCare were starch-based while Thick & Easy Clear and Thick-it AquaCare H2O were gum-based. The Thick-it AquaCare H2O was the only product that had no flavor added; the other three products were infused with lemon flavor. Thick&Easy Clear is stated to be “hint of lemon” instead of lemon flavor. All products were shelf stable. Detailed products information is available in Table 1
2.3. Procedure and Measurement
All products were stored under refrigerated temperature (1.6–4.4 °C) 24 h prior to the test and served between 7.2–11.6 °C in covered plastic cups (Veritiv Corporation, Atlanta, GA, USA) to align with previous consumer testing methods [21]. Approximately 90 mL of the product was portioned into 118 mL (4 oz) serving cups with lids. These were placed in a water bath to maintain the target temperature for evaluation.
The samples were evaluated in a randomized order, with 3-digit blinding codes on the sample. Panelists were seated at a round table; each panelist completed an individual evaluation with references on one sample at a time for flavor, texture, aftertaste, and mouthfeel. They recorded the intensity of each attribute and made texture measurements at four different stages and positions (texture from cup, texture in mouth, texture during swallowing, and texture after swallowing). Panelists reported results to the panel leader who then led a discussion with panel members to achieve a consensus agreement for each attribute. The consensus result represented an agreement that all panelists accepted. The attribute list with definitions and references is shown in Table A1.
For instrumental tests, the consistency of the sample was measured with the Bostwick consistometer and a line spread apparatus for samples between 7.2 and 11.6 Celsius to be consistent with the descriptive panel. Each sample was measured in triplicate and those mean values were used in the analysis.
The Bostwick test was performed using a calibrated Bostwick Consistometer on a leveled surface. After closing the gate of the Bostwick, samples were poured into the reservoir to the top of the gate and leveled with the straight edge of a spatula. Then, the product was released by pressing down the lever arm and the product was allowed to run along the slope for 30 s. The distance of the running liquid was recorded in centimeters (higher numbers typically reflect a less viscous fluid that flows further) [34].
For the line spread test (LST) [35], a Plexiglas board which was marked with concentric circles spaced 0.5 cm apart at a distance of between 2.5 and 7.5 cm from its center were placed on a level surface. The concentric circles were divided into 4 quadrants (90-degree intervals). The sample was held in an open-ended tube (of 3.8 cm height and 5 cm diameter) positioned at its center. The pre-thickened sample was poured into the cylinder placed in the center of the line-spread board. Once lifted, the sample spread for 60 s. The measurements from each quadrant were then averaged to represent the amount of spread (high numbers tend to reflect a less viscous beverage and low numbers tend to reflect a more viscous beverage with less spread) [36].
2.4. Data Analysis
Descriptive data from consensus profiles has no variance and cannot be analyzed by traditional univariate analysis such as analysis of variance [25,26]. As recommended in those references, a difference of 1.0 or greater on the scale was accepted as different.
To create external preference maps, the descriptive data was combined with the quantitative consumer acceptance data collected from a previous consumer study [21] and analyzed using XLStat version 1 March 2015 (Addinsoft, New York, NY, USA). The descriptive data was applied as the X-matrix) and consumers’ overall liking of the product was applied as the Y-matrix. One external preference map was created with consumers’ liking and flavor and aftertaste attributes while the other was created with texture attributes.
SAS® statistical software (SAS® version 9.3, SAS Institute Inc., Cary, NC, USA) was used to conduct a correlation analysis with all texture attributes, the LST result and the Bostwick test result.
3. Results
3.1. Descriptive Test of Flavor and Aftertaste Comparison
The flavor and aftertaste attributes and their intensities for each product are shown in Table 2. Overall, all flavor and aftertaste attributes were scored below 4.0. On a 15-point scale, an intensity of less than 4.0 is considered as low. The nectar-like and honey-like consistency of the same product had a similar flavor. In comparing levels of consistency of each product, intensity ratings varied by one point or less on a 15-point scales with the exception of piney flavor (1.5 difference for ReadyCare).
The flavor attributes were generally similar among the lemon-flavored products including ReadyCare, Thick&Easy Hydrolyte, and Thick&Easy Clear. Thick & Easy Hydrolyte, which was the product with the most intense fresh lemon flavor, also had the highest intensity on most attributes that related to lemon flavoring such as lemon ID, floral, and artificial sweetener. Previous consumer research [17] showed that the Thick&Easy Hydrolyte had the highest overall liking score and taste liking score in all samples. In addition, lemon flavor seemed to have a positive effect on consumers’ liking of the pre-thickened water product. Product label information for Thick & Easy Clear indicated a “hint of lemon”, which appeared consistent with relatively low panel scores for Lemon ID. The honey-like consistency of ReadyCare was the only product that had a piney flavor (1.5 point) detected. Piney flavor could possibly be a result of degradation of limonene from copper-catalyzed oxidation which can result in a mixture of limonene oxides, carvone and carveols [37].
Excluding all flavor attributes that could be attributed to lemon flavoring (lemon ID, fresh lemon, candy lemon, floral, piney, artificial sweetener, and sweet), the “base flavor” attributes were compared on all four samples in nectar-like and honey-like consistency. The base flavor notes (musty, starch, plastic, bitter, sour, metallic, and similar aftertaste attributes) are likely contributed by the thickening agents and these were fairly similar across all of the products. Starch and gum are the most commonly used thickening agents in the dysphagia diet, but starch-based thickening agents have been noted to give the thickened beverage a starchy flavor [15]. However, that was not noted in these product comparisons. In this study, even the gum-based pre-thickened water products had a slight starchy flavor detected by the panelists that reflected a similar intensity to the starch-based products. That could be the result of a logical error [38] simply based on the fact that the product was thicker than water.
As expected, the flavor and aftertaste characteristics of the two levels of water modification tended to be similar within a brand because of identical ingredients list. The results also suggested that the concentration of the thickening agents in pre-thickened products for water had a similar effect on flavor and aftertaste for both levels of modifications. That indicates that higher levels of added thickener (up to honey-like) may not produce large differences in sensory acceptance. That contrasts with prior work [16] showing that higher levels of thickness produced by adding higher levels of some instant thickeners produced higher levels of “starchy” flavor and suppressed some flavor aromatics. Different processing and differences in the properties of the thickening agents used in pre-thickened versus instant thickening products could result in this. Pre-thickened products use thickeners modified for thermal processing while those for instant thickening products typically use pre-gelatinized starches [39].
Without the lemon-related attributes, the “base note” of the pre-thickened water beverages reflected similarities when comparing starch and gum-thickened products, suggesting that pre-thickened products may be more similar than their instant thickened counterparts. All products had a slight starch-like flavor and a low intensity of bitter, metallic, astringent, and plastic flavors. This partly aligns with data on sensory characteristics of instant thickening agents mixed with water [15] with the only difference being that the intensities of starch flavor in pre-thickened water products were lower than instant thickening agent mixed with water. This again suggests some differences in the process modifications made to thickening agents used in the two types of products.
One issue when using pre-thickened products is that they are not customizable to multiple different thicknesses, which is not the case when using instant thickeners prepared on-site. Instead, pre-thickened products come in a limited array of thickness. Similarly, instant thickening agents can be mixed with multiple types of beverages, which gives patients more choices. The same flavor can make patients lose interests in consuming beverages reducing fluid and nutrient intake. Again, an array of choices is available for pre-thickened beverages, but they typically are limited to waters, some juices (especially apply and orange) and coffee. It would be interesting to know if the lower “off-flavors” found in pre-thickened beverages produces increased acceptance of the product, which in turn could lead to better compliance for consumption of thickened liquids.
3.2. Descriptive Test of Texture Comparison
The different viscosity for the nectar-like and honey-like consistency was clearly detectable to panelists; nectar-like products had lower sensory perceived viscosity than honey-like consistency products (Table 3). Additionally, there was a difference between the viscosity of products within the same thickness category (nectar-like or honey-like). The Thick&Easy Clear had the biggest difference between the nectar-like and honey-like consistency while Thick&Easy Hydrolyte and Thickit had the smallest. The honey-like consistency of the ReadyCare had the highest viscosity in all products when the nectar-like consistency of the Thick&Easy Clear had the lowest viscosity.
The viscosity evaluated by the descriptive panel correlated (r > 0.7, p < 0.05) with most of the other attributes except cohesiveness in throat, mass amount, slickness during swallow, chalky mouthcoating, residual in mouth, and residual on throat. This suggests that the higher the viscosity the easier it was to control the swallow because the flow speed typically was lower, the cohesiveness of the bolus was higher, and the effort to hold the liquid in the mouth was lower.
It is not surprising that many textural attributes were not highly related to either viscosity nor liking because most of the other attributes reflected little or no differences among the products (≤1 point difference). In addition, those attributes typically would not necessarily be thought of as viscosity related. The mass amount should be relatively consistent for all products because the volume of beverage should not change. Mouthcoating and residuals are related to the geometry and processing of the thickening products rather than the viscosity per se. The ReadyCare nectar-like consistency left slightly more residuals in the throat while Thick&Easy Clear nectar-like consistency had slightly less after swallowing than the other products. One panelist commented that the ReadyCare nectar-like product made her want to cough or clear her throat because of the residuals it left. When swallowing, the direction of flow into mouth was mostly straight except Thick & Easy Clear Nectar consistency, which flowed in multiple directions possibly because of lower cohesiveness.
The texture difference (viscosity) between the two consistencies of each product was detectable and, as expected, honey-consistency was thicker than the nectar-consistency (Figure 1). However, the texture differences were inconsistent from product to product. Even if the rheological viscosity test showed all products were within the range of the National Dysphagia Diet categorization except the nectar consistency of Thick&Easy Hydrolyte and Ready Care (both higher than 350 cP) [21], the sensory result from descriptive panelists showed obvious differences of viscosity between the two consistencies of the products. It seemed as if the standard of difference between the two consistencies should be agreed, changed, and monitored more by the manufactures. It is possible that the larger number of thickness categories in the International Dysphagia Diet Standardisation Initiative (IDDSI) [40] better tracks the sensory differences found in products, but such data is still lacking at this point with pre-thickened products. One issue with the IDDSI classifications for pre-thickened liquids is the larger number of products needed to meet various thickness targets. As can be seen from data in this study, it is already a problem for manufacturers in the United States to accurately meet the viscosity differences with fewer levels of the National Dysphagia Diet [41,42].
The previous consumer study [21] suggested that the consumer perception of viscosity of the product was affected by the type of thickening agent (starch or gum) used in the products. However, this study did not necessarily show that finding. Results from this study showing that Thick&Easy Hydrolyte tended to have low viscosity and from the prior consumer study showing it had the highest liking for texture suggests that a thinner consistency may have a positive impact on consumers’ liking. However, more testing clearly is needed.
Compared to instant thickening agents, pre-thickened products have a smoother more consistent texture. None of the products had any lumpiness or graininess detected by the panelists, which means the pre-thickened water products overcame a shortcoming of instant thickeners, especially starch-based, which can easily give the mixed products a grainy texture [15].
3.3. External Preference Mapping
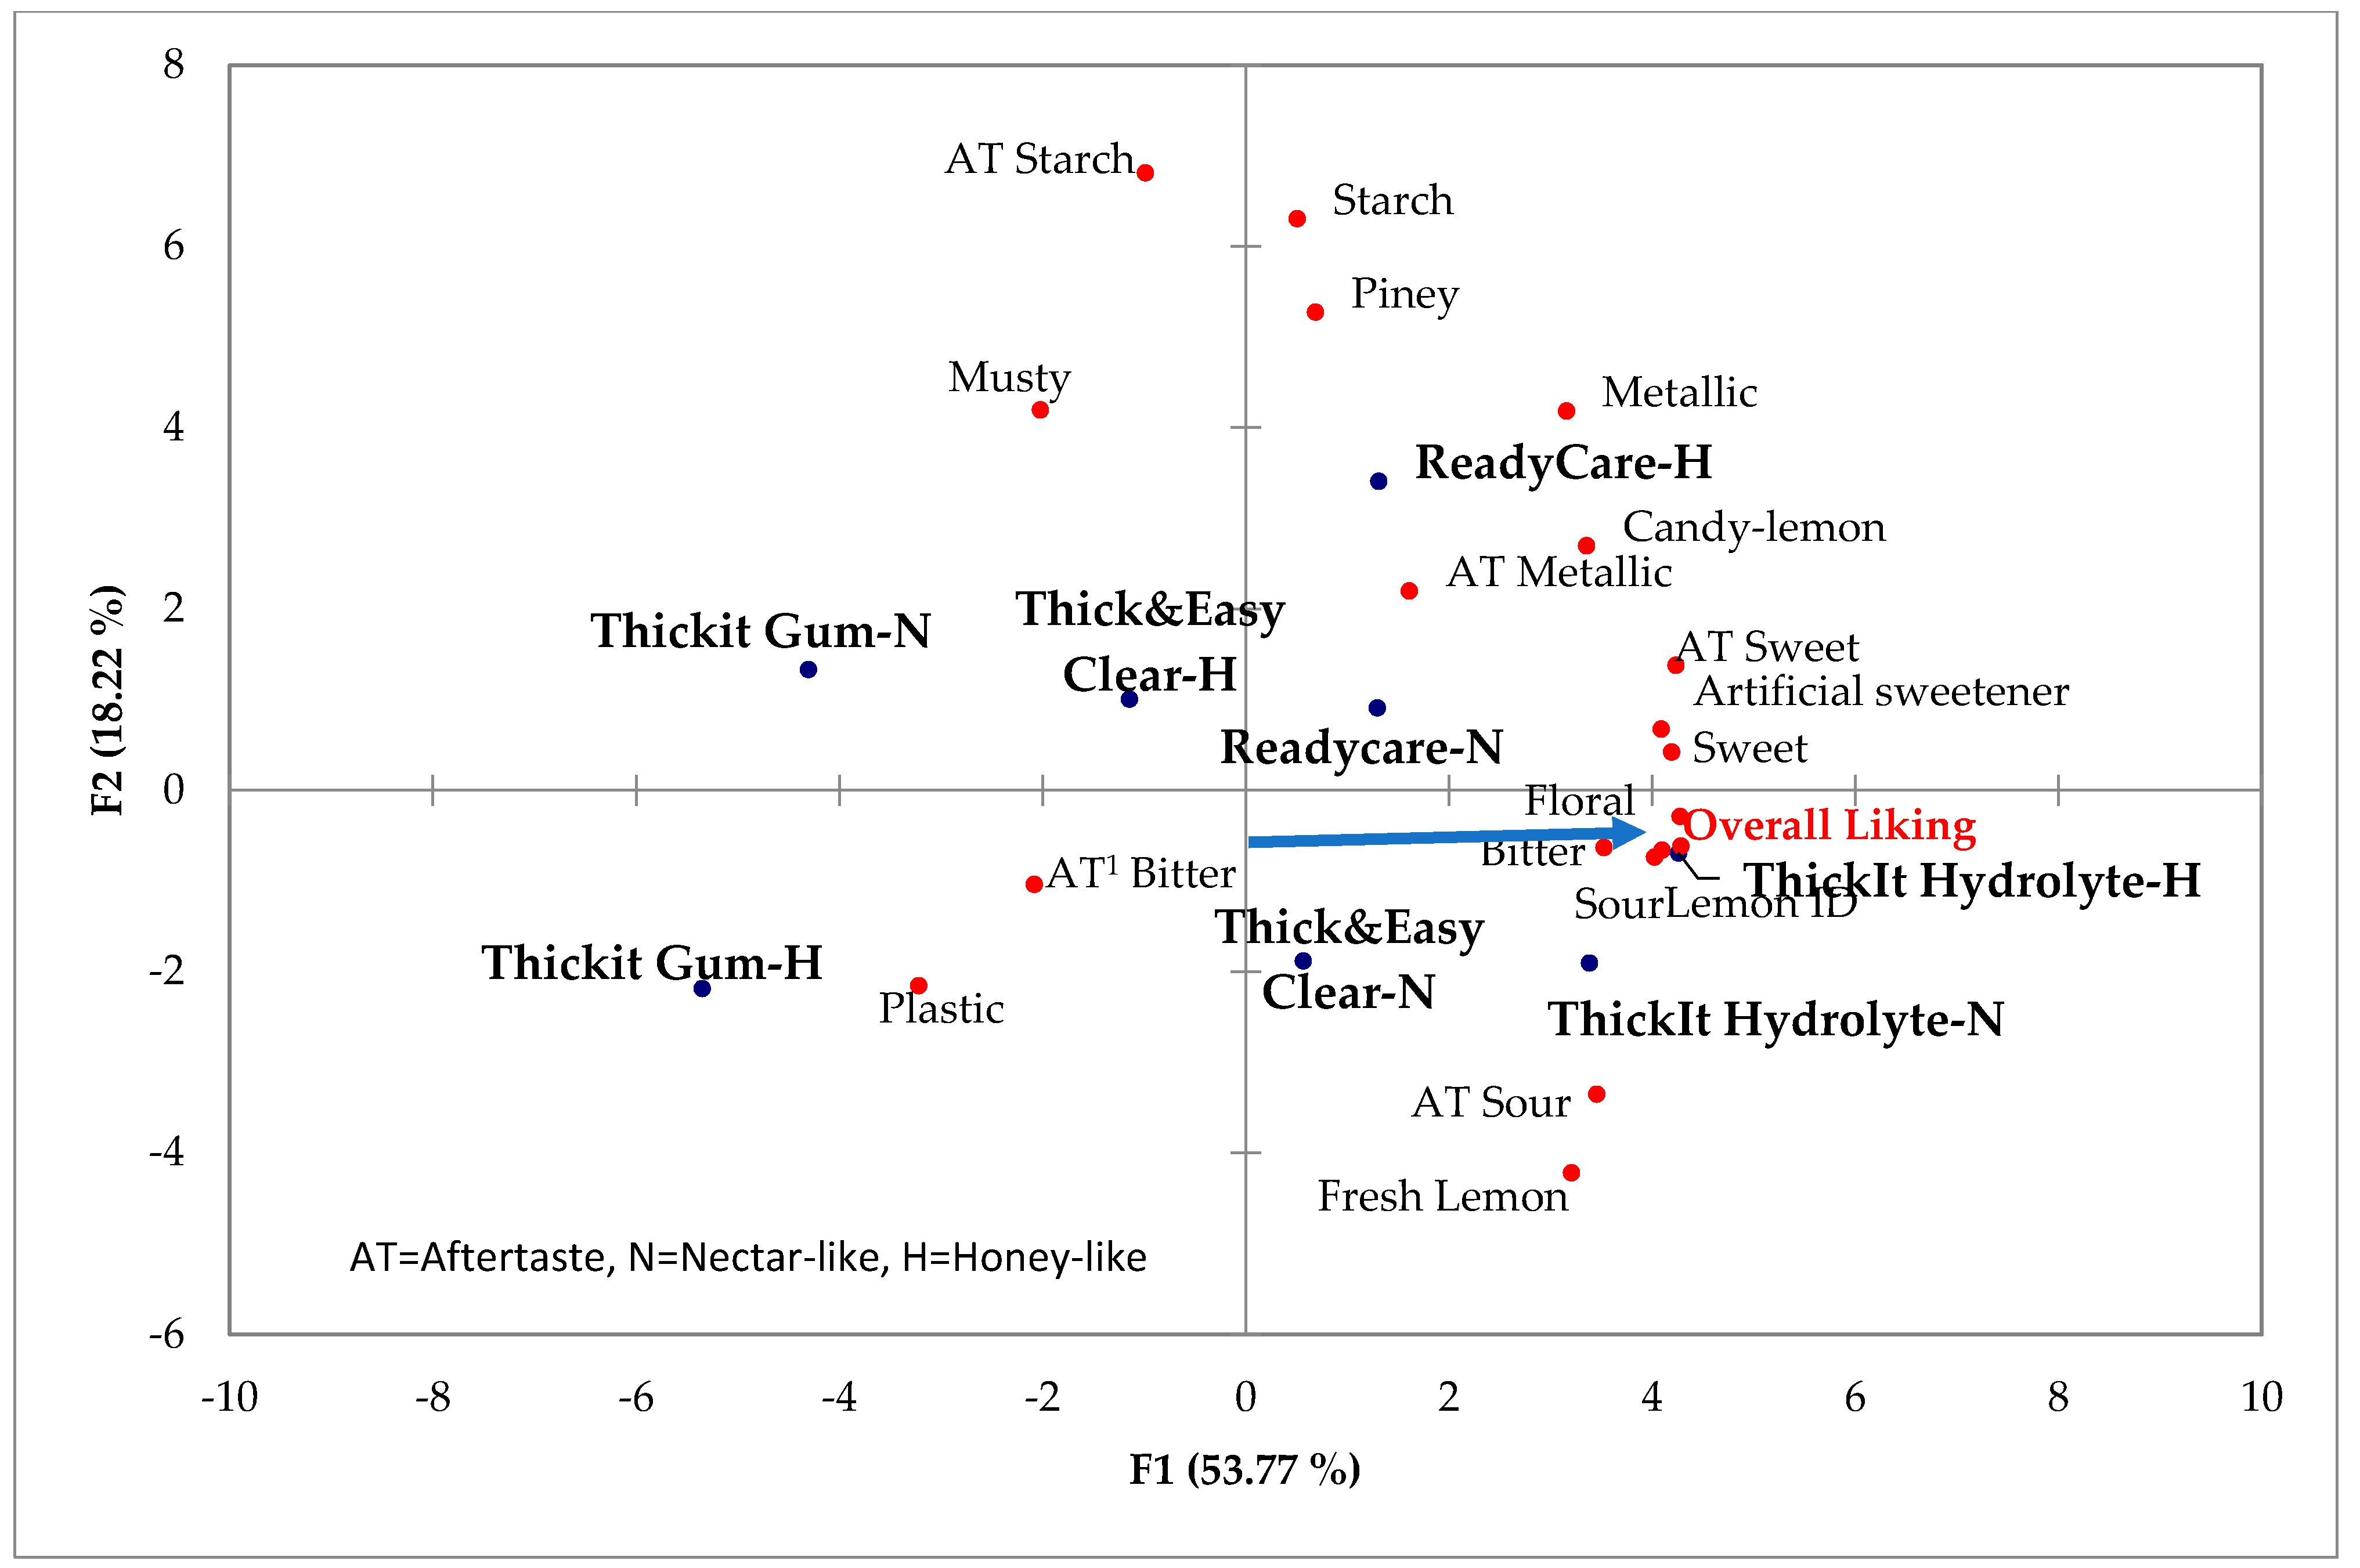
The external preference maps were created with the consumer overall liking data from a prior study [17] paired with the flavor and aftertaste data (Table 2) and texture attribute data (Table 3) from this study. Flavor attributes such as Sour lemon ID, sour, floral and sweet are located close to the direction of overall liking suggesting a positive relationship to overall liking (Figure 2). Flavor attributes such as starchy and piney (a degradation flavor of lemon) appeared to have little impact on liking. It is not surprising that sweetness had a general positive impact on overall liking since sweet products, particularly beverages, are popular products around the world. The addition of flavors, such as lemon, could be positively associated with increased liking of the proudct. However, because all lemon-flavor products also had sweetener added it may be that added flavoring is a covariate with sweetness and really is not adding additional liking. That would need to be studied further.
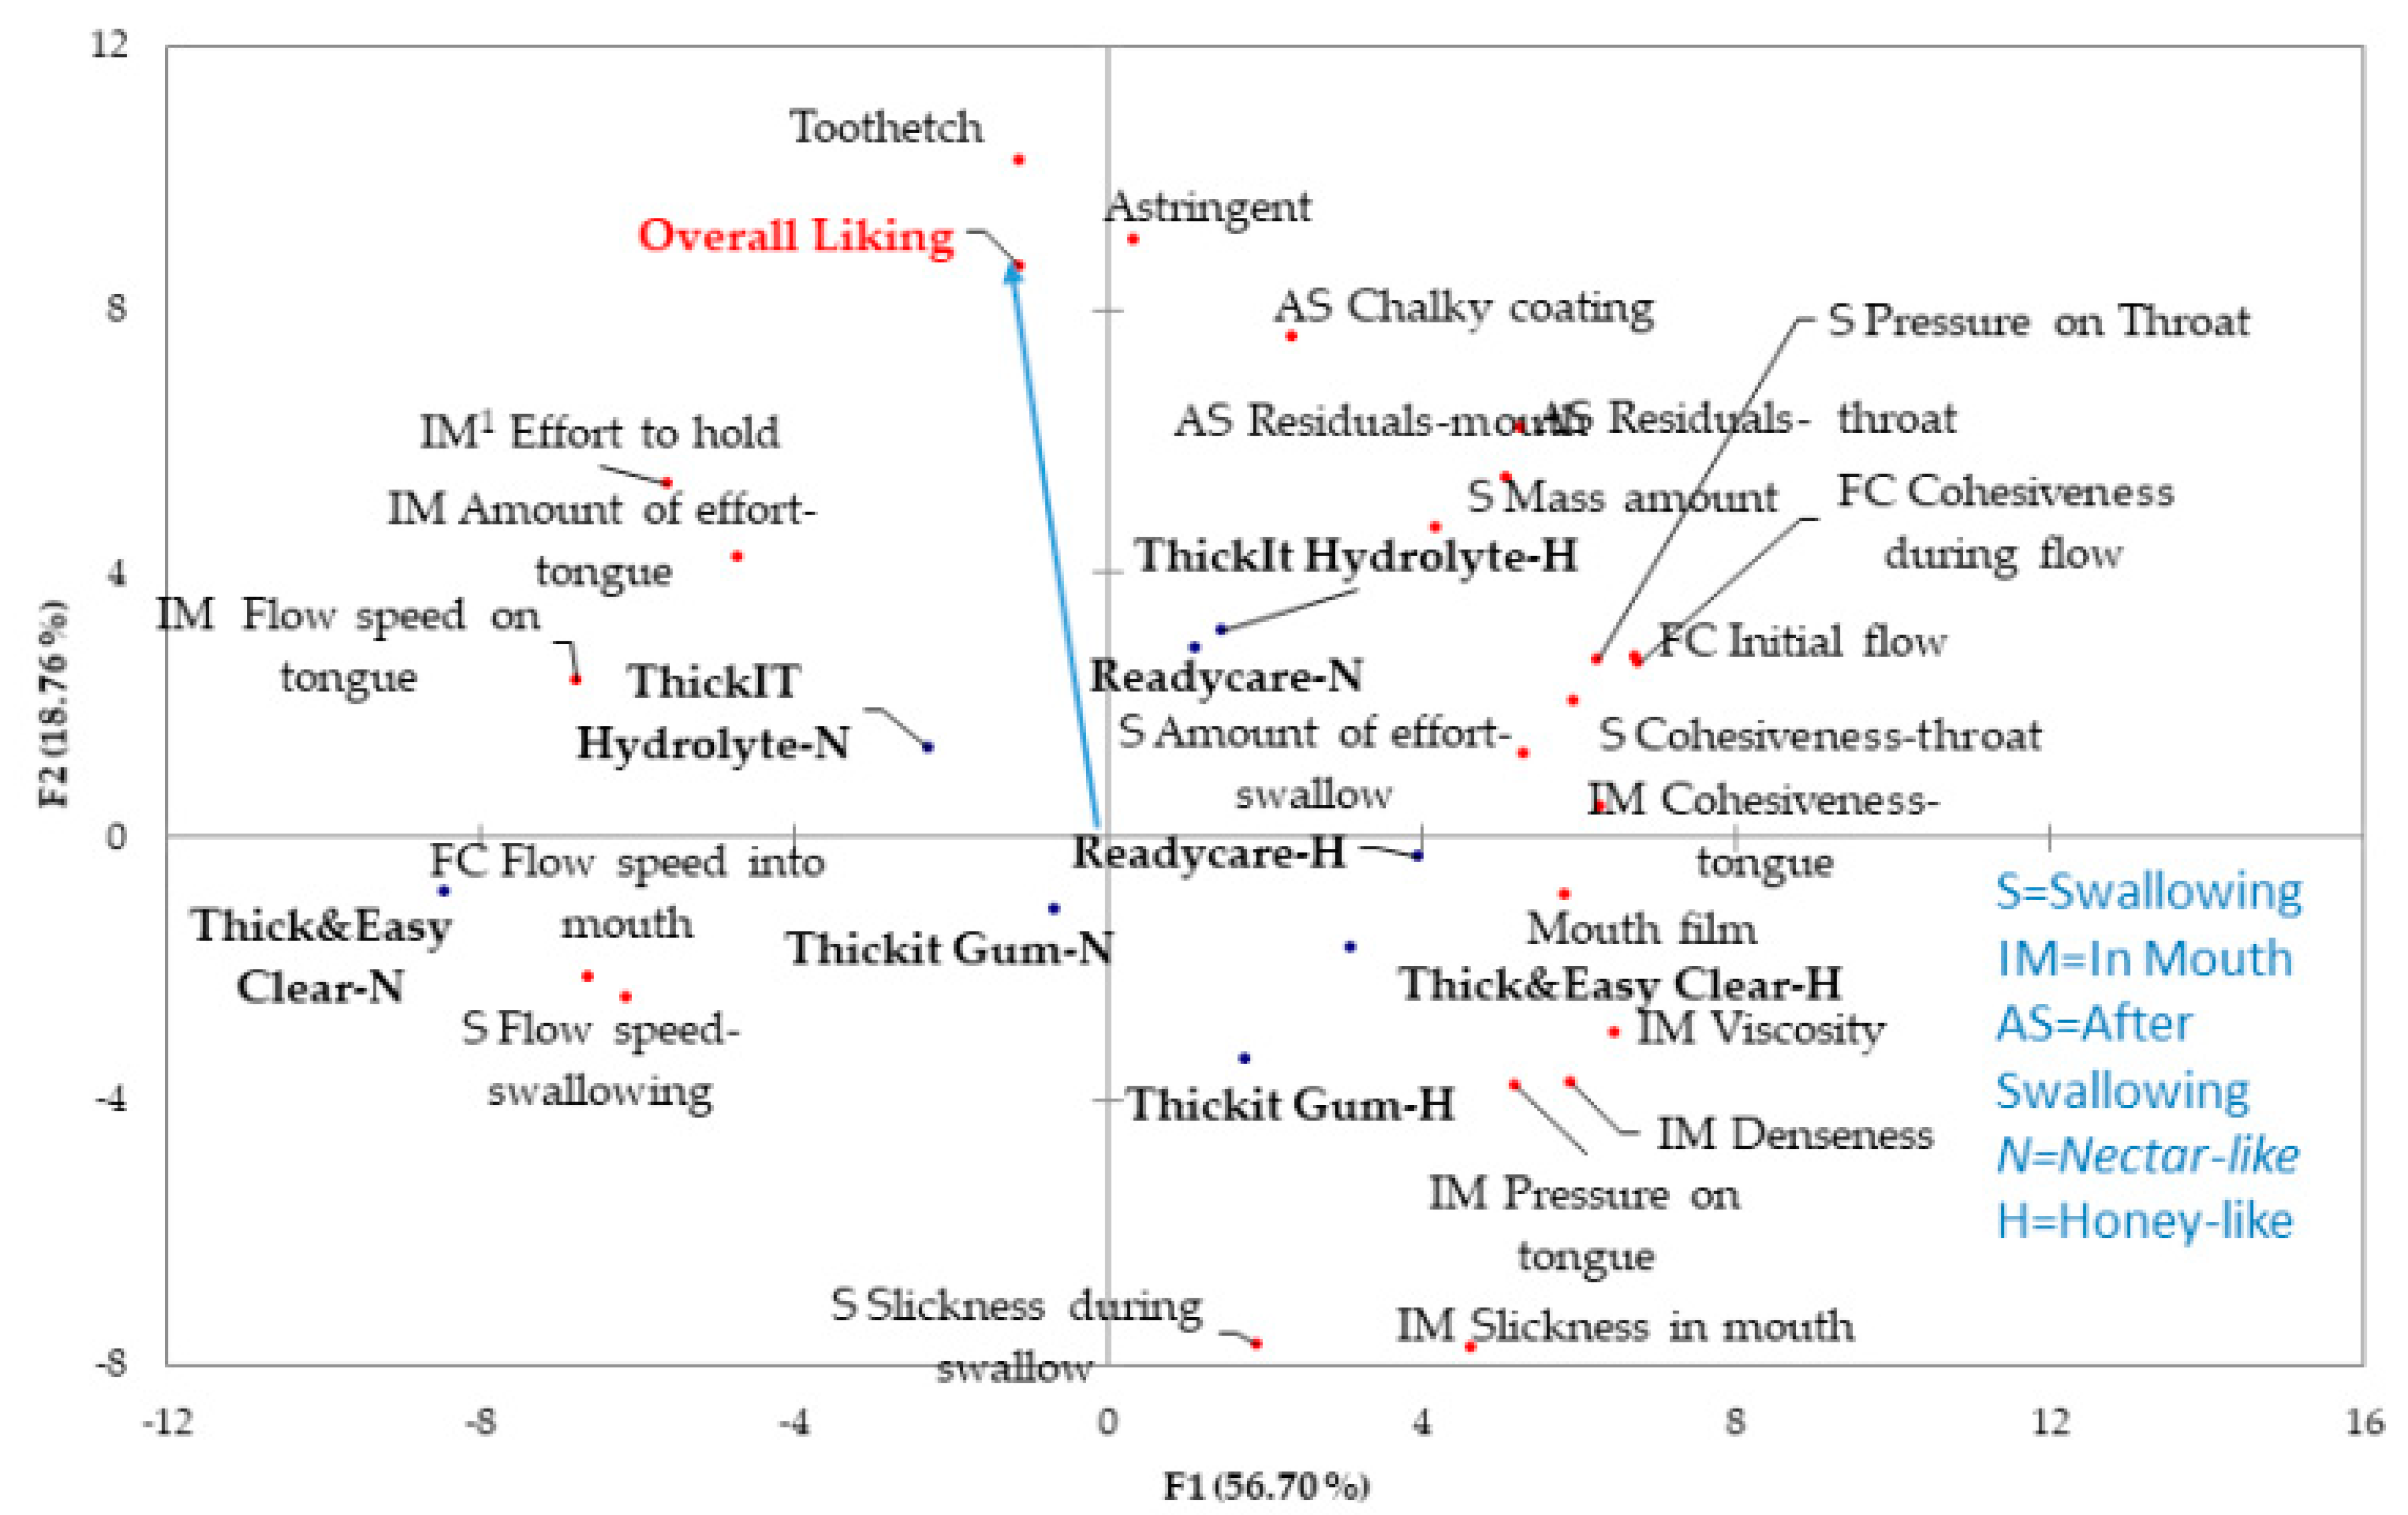
The in-mouth viscosity is located in the opposite direction of overall liking (Figure 3), as is slickness in the mouth and throat. This may indicate that viscosity did not have a positive impact on consumers’ liking and, in fact, may have negatively affected liking. Of course, the negative issue could be slickness or a combination of increased slickness and thickness. The result for thickness did not align with a consumer study that indicated beverages with thicker textures were liked more [17].
Based on the preference maps, it appears that sweetness (and perhaps added lemon flavor), and some combination of lower viscosity and lower slipperiness, had a positive influence on consumers’ acceptance of thickened beverage products. However, this study is limited in the number and combinations of products that were tested. It would be imperative to test a larger number of samples with attributes such as sweetness and added flavor and thickness and slipperiness that do not vary in a collinear fashion in order to better understand the impacts of those attributes.
It is critical to understand that this data is intended to help understand the attributes that drive consumer acceptance and, thus, potentially compliance of patients prescribed thickened liquids. The data can be used to help manufacturers better understand how products might be changed to help improve their products. The data also can be used to help clinicians who choose between varying brands with different sensory characteristics. The data are not intended to suggest modification of consistency to patients. It is imperative that the consistency of the product should match the patients’ capability of swallowing [5] not necessarily be their most preferred product. It must be noted that other researchers have found that when information is provided on the importance of consuming thickened beverages, liking increases regardless of the thickness level [43]. The current finding does suggest, however, that the current practice of providing the lowest level of thickness modification needed [6,17,44,45] also may provide the best chance for meeting expected sensory attributes that can lead to acceptance for those products.
3.4. Correlation between the LST and Bostwick and Descriptive Sensory Viscosity
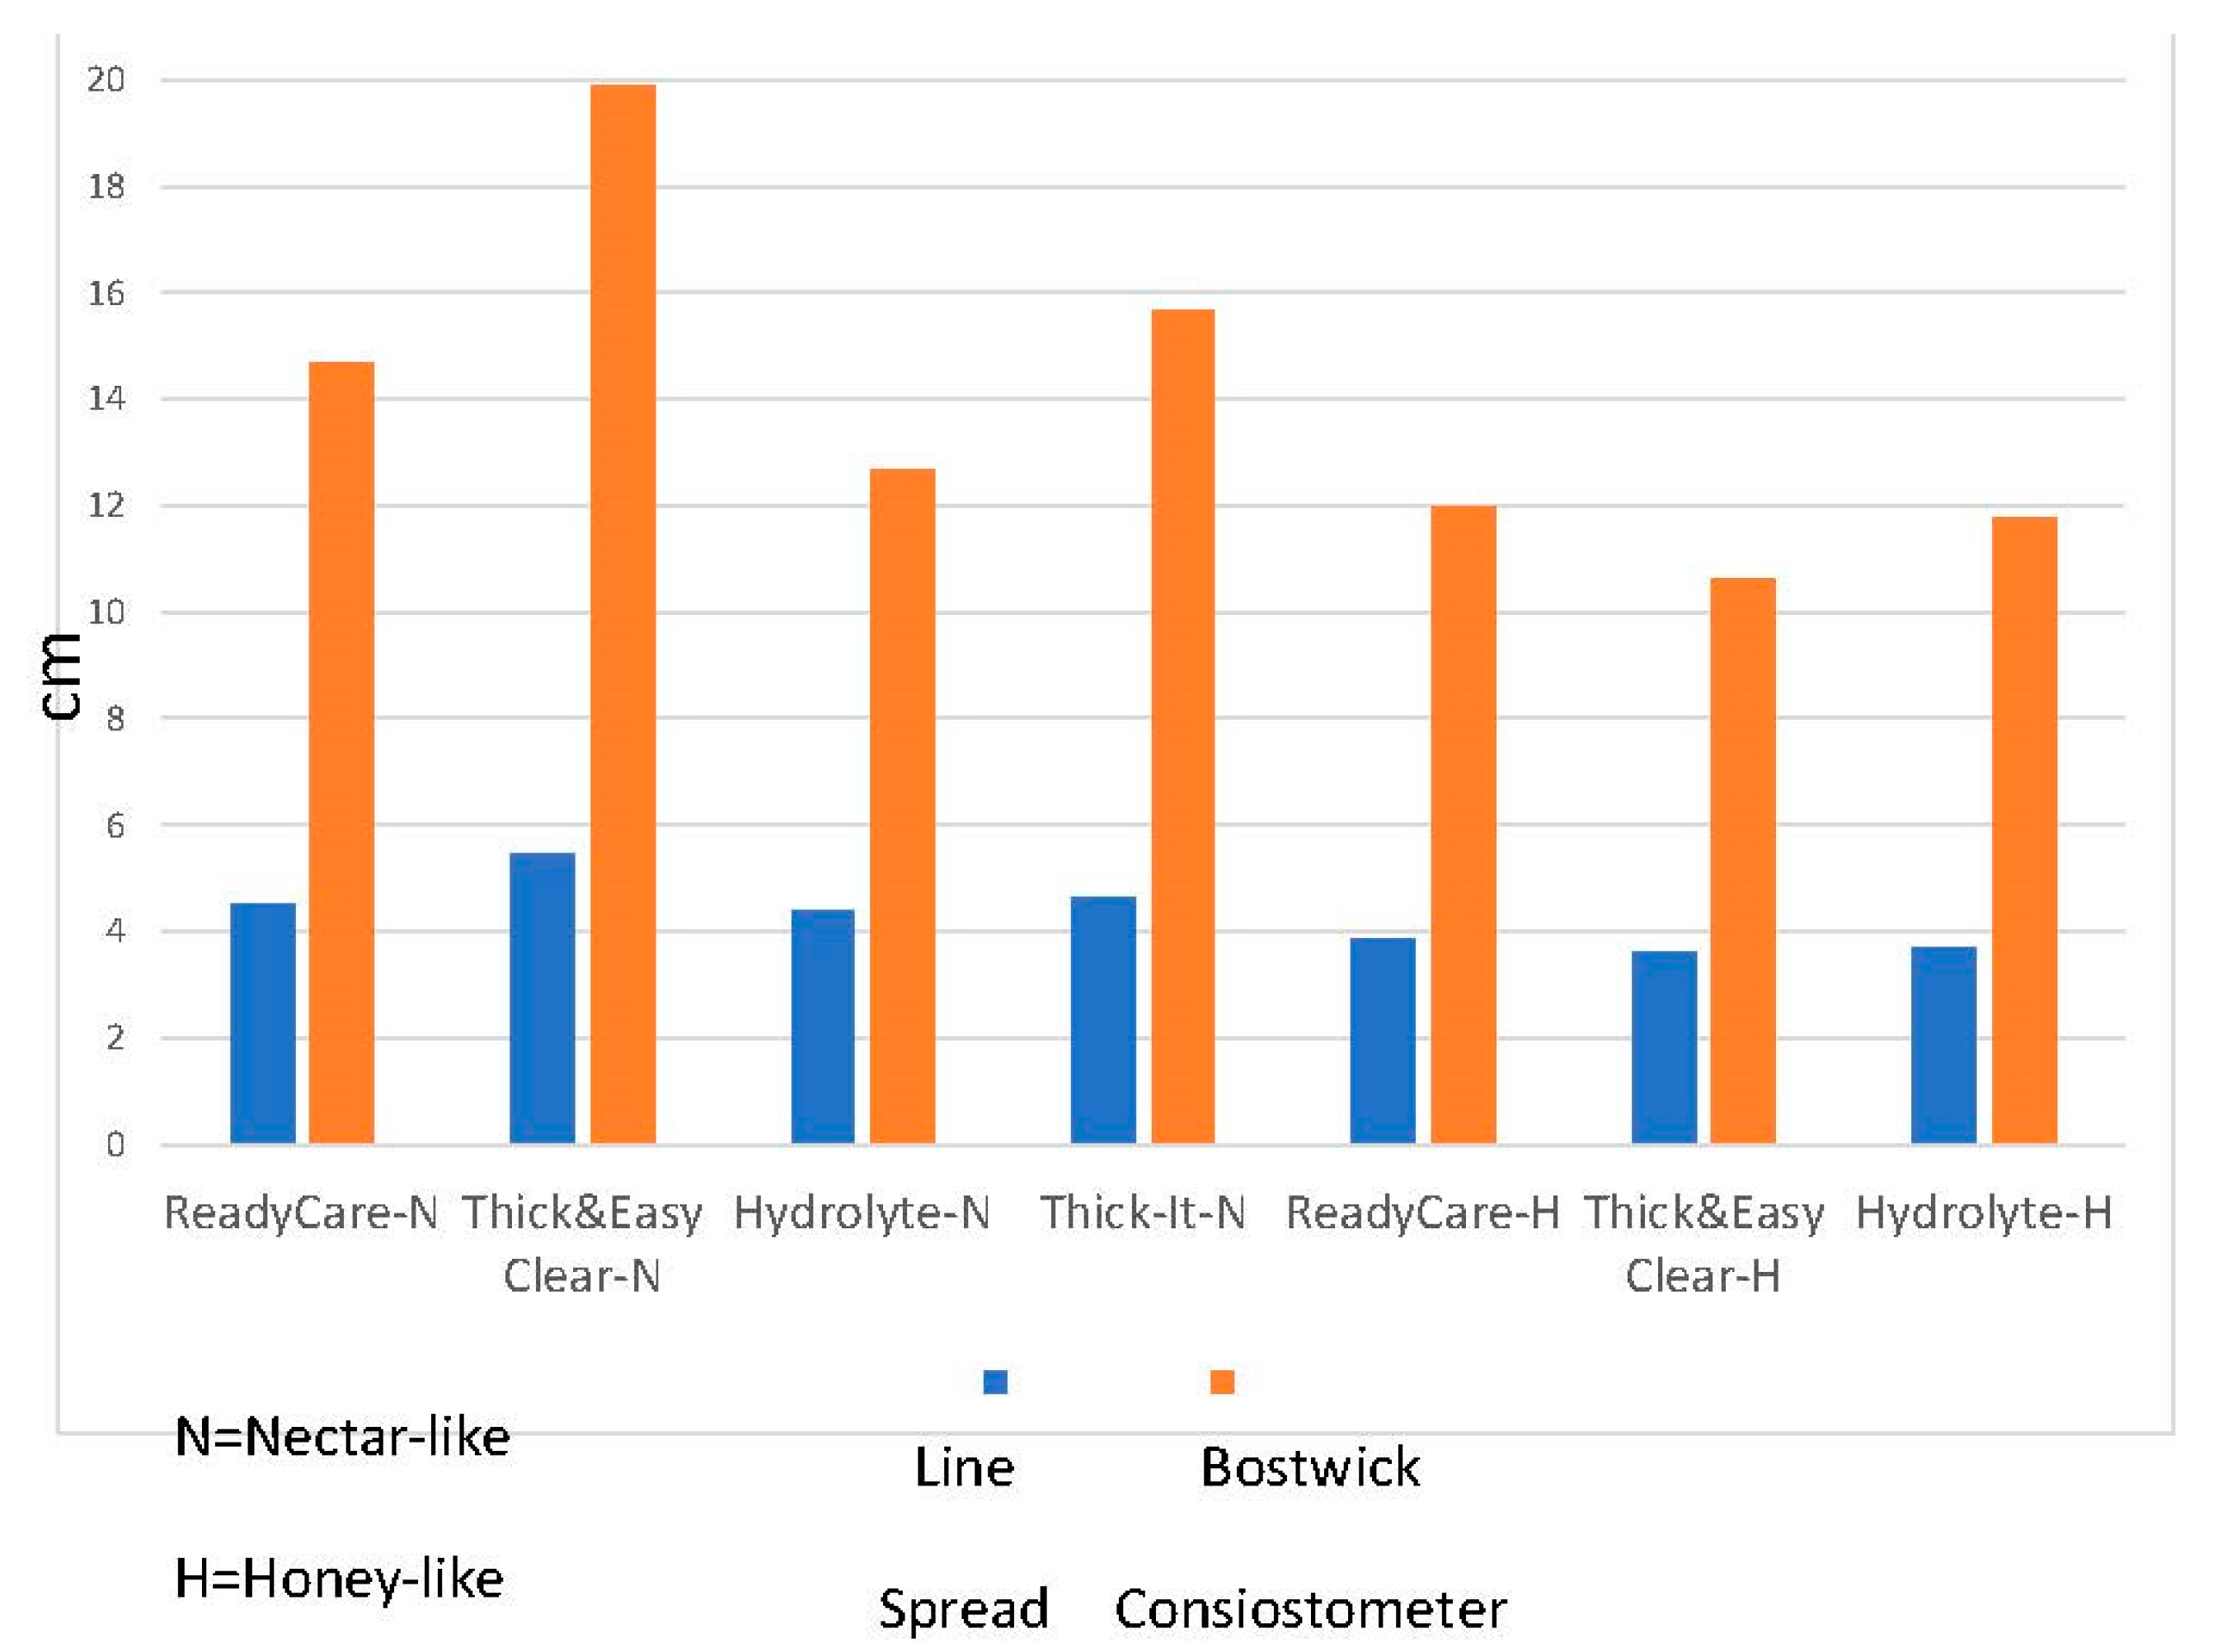
Physical flow data were collected to be compared with the sensory thickness data. Mean values for line spread were less than 4.0 for honey-thick samples and approximately 5 for nectar-like thickness (Figure 4), with standards deviations (SD) less than 0.2 for all samples. Similarly, mean values for Bostwick flow distances were 12–20 for nectar-like samples and 10–12 for honey-like samples with SD less than 0.6 for all samples except Hydrolyte nectar, which was 1.6. The flow (centimeters) measured with the Bostwick test and the LST were positively correlated (r = 0.97, p < 0.05) and both, as expected, were inversely correlated with viscosity scores from the descriptive panel (Bostwick, r = −0.81, p < 0.05 and line spread, r = −0.85, p < 0.05). The results clearly show that as flow distance increased, as measured by the physical measurements, sensory viscosity scores decreased. That is, the thinnest products measured instrumentally were also the thinnest products as measured sensorially. This suggests that for thickened liquids, the measurement of human perceived viscosity can be closely estimated using simple tools that measure flow. In addition, because many of the measurements associated with texture of liquids correlate highly with viscosity as shown in this study and in prior research [20] many other textural characteristics can be estimated using the same tools.
4. Conclusions
Pre-thickened ready-to-serve products generally appear to provide appropriate texture and provide some differentiation in flavor among the products tested in this study. In some cases, pre-thickened liquids may be better options for patients with dysphagia than instant thickening agents since they do not need preparation and may provide fewer off-flavors than instant thickeners. Although this study only examined pre-thickened water products, a few other beverage options are available. As with other product categories, additional pre-thickened beverage options may become available if pre-thickened products are more widely purchased and used by healthcare facilities and consumers.
However, to ensure patients receive the product at the most appropriate consistency, manufactures should reach a better agreement on the viscosity for each consistency, especially the difference between multiple consistencies of the same products. In this study, a nectar-like product from one company was a similar viscosity as a honey-like product from another company, which clearly does not respect guidelines, such as the NDD or IDDSI guidelines in place for healthcare providers. It is important to give patients products that match the patients’ swallowing needs. Since it may be difficult or impossible to adjust the viscosity of the pre-thickened beverage, it can be potentially dangerous for patients if manufactures produce products with dramatically different texture but label them similarly.
To help improve the acceptance of the consumers for the pre-thickened water products this study also showed that the addition of sweetness and flavor, such a lemon flavor, is recommended.
Author Contributions
Conceptualization, E.C.I. and J.M.G.; methodology, E.C.I.; software, H.L.; validation, H.L.; formal analysis, E.C.I. and H.L.; investigation, H.L. and J.M.G.; resources, E.C.I. and J.M.G.; data curation, H.L.; writing—original draft preparation, H.L. and E.C.I.; writing—review and editing, E.C.I. and J.M.G.; visualization, E.C.I. and H.L.; supervision, E.C.I.; project administration, E.C.I. and J.M.G.; funding acquisition, J.M.G. and E.C.I. All authors have read and agreed to the published version of the manuscript.
Funding
This research was supported, in part, by the National Institute of Food and Agriculture, US Department of Agriculture, Hatch, under accession number 1016242.
Institutional Review Board Statement
The study was approved by the Committee on Research with Human Subjects at Kansas State University with protocol #7297.3.
Informed Consent Statement
Informed consent was obtained from all participants in the descriptive sensory study and a notice of informed consent was provided to all consumer survey participants who were anonymous to the researchers.
Acknowledgments
The authors appreciate the sensory panel for their work on this project and other graduate students who helped ensure during preparation and testing of the products.
Conflicts of Interest
The authors declare no conflict of interest.
Appendix A

Table A1.
Sensory Characteristics and their definitions and references used in this study.
| Sensory Attribute | Definition | Reference(s) |
|---|---|---|
| FLAVOR | ||
| Lemon ID | A somewhat sharp slightly, peely, sour, astringent, sweet, and sometimes floral or candy-like aromatic associated with citrus fruit (specifically lemon-lime). | Kool-Aid mix lemonade = 5.5 (flavor) Made according to package using C & H granulated sugar. |
| Fresh Lemon | The aromatics associated with a fresh lemon. | Fresh Lemon Juice = 7.0 (flavor) 1 part juice to 4 parts water. |
| Candy-Lemon | A sweet, floral, citrus aromatic that is somewhat non-natural in character. | Jell-O Lemon Gelatin (dry) = 7.5 (aroma) Serve ¼ teaspoon in a medium snifter, covered. |
| Floral | Sweet, light, slightly fragrant aromatic associated with flowers. | Diluted Welch’s White Grape juice, diluted 1:1 = 5.0 (f) Mix 1 part of water and one part of juice. Serve in 1 oz cup |
| Piney | Aromatics reminiscent of a resinous pine tree. Can be medicinal or disinfectant in character. | Pine-Sol Original Cleaner = 6.0 (aroma) Dilute Pine-Sol with water in a 1:160 ratio. Place one drop of the mixture on a cotton ball in a medium snifter, cover. |
| Vanilla | Aromatic blend of sweet, vanillin, woody, brown notes, some having floral or spicy components. | McCormick pure vanilla extract in Hiland whole milk = 3.0 (f) Mix 1/8 tsp of McCormick Vanilla Extract with ½ cup of whole milk. Serve in 1 oz. cup. |
| Musty | Aromatic associated with closed air spaces such as attics (dry) and basements (wet). | Bush’s Best Pinto Beans (Canned) = 5.0 (flavor) Drain beans and rinse with de-ionized water. Serve in 1 oz. cups. |
| Hay | Aromatic associated with sweet dry grasses: hay straw, dry parsley, and tea and tobacco leaves. | McCormick Parsley Flakes = 7.5 (aroma) Place 0.25 g parsley in medium snifter, cover. |
| Artificial Sweetener | Aromatic impression of sweetness which is uncharacteristic of sucrose and which may or may not include the combinations of bitter, chemical and metallic. | 4 g Equal Spoonful Sweetener filled to 500 mL volume with water = 2.0 (flavor) 8 g Equal Spoonful Sweetener filled to 500 mL volume with water = 4.0 (flavor) |
| Starch | Aromatics associated with starch and starch based ingredients. | 2.5% Argo Corn Starch Gel in Water = 6.0 (flavor) Cornstarch boiled in water for 1 min, cool, serve at room temperature |
| Plastic | The aromatics associated with plastic containers or food stored in plastic. | Ziploc Bag in covered snifter = 3.5 (aroma) |
| Sweet | The fundamental taste factor associated with sucrose. | 2% Sucrose Solution = 2.0 3% Sucrose Solution = 3.0 5% Sucrose Solution = 5.0 |
| Bitter | The fundamental taste of which caffeine in water is typical. | 0.01% Caffeine Solution = 2.0 0.02% Caffeine Solution = 3.5 |
| Sour | A Fundamental taste factor of which citrus acid in water is typical. | 0.015 Citric Acid Solution = 1.5 0.025% Citric Acid Solution = 2.5 |
| Metallic | The chemical feeling factors on the tongue described as flat, associated with slightly oxidized metal such as iron, copper and silver | 0.10% Potassium Chloride Solution = 1.5 0.2% Potassium Chloride solution = 4.0 |
| AFTERTASTE (evaluated after 30 s): | Definitions forAftertaste are the same as for flavor | References for Aftertaste are the same as for flavor |
| Starch | ||
| Sweet | ||
| Bitter | ||
| Sour | ||
| Metallic | ||
| TEXTURE | ||
| From cup: | ||
| Initial flow | A measure of the exertion required to begin the flow of the sample from the cup and guide into mouth. Low to High. | Water = 2.0 2.5% Argo Corn Starch in Water = 2.5 Hiland Heavy Whipping Cream = 4.0 Kroger strawberry/peach smoothie = 5.5 3.0% Argo Corn Starch Gel in water = 7.0 Gerber 1st Foods Applesauce = 10.5 Nestle Carnation Sweetened Condensed Milk = 13.0 Cornstarch boiled in water for 1 min, cool, serve at room temperature |
| Cohesiveness During Flow | A measure of how much of the product holds together as it flows from the cup into the mouth. High Spread to No Spread. | Hiland Heavy Whipping Cream = 4.0 3.0% Argo Corn Starch Gel in water = 7.5 Gerber 1st Foods Applesauce = 11.0 Nestle Carnation Sweetened Condensed Milk = 13.0 Cornstarch boiled in water for 1 min, cool, serve at room temperature |
| Flow Speed Into Mouth | A measure of the speed of the flow from cup into mouth. Slow to Fast. | 3.0% Argo Corn Starch Gel in water = 3.0 Log Cabin Sugar Free Syrup = 8.0 Hiland Heavy Whipping Cream = 11.0 Water = 14.0 Cornstarch boiled in water for 1 min, cool, serve at room temperature |
| Flow Direction | Directional flow of the sample into the mouth: straight, right, left, combination (multiple directions) | |
| In mouth: | ||
| Graininess | The amount of particles detected in the mouth and on the tongue while the sample dissolves or disintegrates. | Gerber 1st foods Applesauce = 2.0 Gerber 2nd foods Applesauce = 3.0 Musselman’s Apple Butter = 4.0 Musselman’s Natural Applesauce = 7.5 |
| Lumpy | The amount of lumps present in the sample. | Jell-O Tapioca Pudding Snack = 7.5 |
| Viscosity | The force required to move the product across the tongue. | Water = 0.0 2.5% Argo Corn Starch in water = 5.0 3.0% Argo Corn Starch in water = 9.0 3.5% Argo Corn Starch in water = 11.0 Cornstarch boiled in water for 1 min, cool, serve at room temperature |
| Denseness | The compactness of the product when compressed once between the tongue and palate. | Dillon’s 2% Milk = 1.0 Kraft Cool Whip = 3.5 Gerber 2nd Foods Applesauce = 4.5 Hiland Sour Cream = 8.0 Nestle Carnation Sweetened Condensed Milk = 11.0 |
| Amount of Effort-Tongue | A measure of the exertion required to hold the sample on the tongue by cupping tongue as sample is moved to the back of the mouth. None to High. | Nestle Carnation Sweetened Condensed Milk = 2.0 Gerber 1st Foods Applesauce = 3.0 Hiland Heavy Whipping Cream = 7.0 2.5% Argo Corn Starch in Water = 10.0 Water = 13.0 Cornstarch boiled in water for 1 min, cool, serve at room temperature |
| Flow Speed on Tongue | A measure of the speed of flow of sample from front to back of mouth. Lift tip of tongue to roof of mouth and move sample from front of mouth to back of mouth. Slow to Fast. | Nestle Carnation Sweetened Condensed Milk = 2.0 Gerber 1st Foods Applesauce = 3.0 Hiland Heavy Whipping Cream = 7.0 2.5% Argo Corn Starch in Water = 10.0 Water = 15.0 Cornstarch boiled in water for 1 min, cool, serve at room temperature |
| Cohesiveness—Tongue | A measure of how much the product holds together on tongue while holding sample to roof of mouth with tip of tongue placed behind upper teeth. High Spread to No Spread. | Water = 0.0 Hiland Heavy Whipping Cream = 4.0 Yoplait light vanilla yogurt = 11.0 Nestle Carnation Sweetened Condensed Milk = 13.0 |
| Effort to Hold | A measure of the exertion required to hold the sample at the back of the mouth using the tongue just before swallowing. Place tip of tongue behind upper teeth. None to High. | Nestle Carnation Sweetened Condensed Milk = 1.0 Gerber 1st Foods Applesauce = 4.0 Hiland Heavy Whipping Cream = 12.0 Water = 15.0 |
| Pressure on Tongue | Amount of pressure felt on tongue while holding sample in mouth in preparation for swallowing. None to High. | Water = 2.0 Dannon Danimals Strawberry Banana smoothie = 4.5 Yoplait Light Vanilla yogurt = 9.0 Nestle Carnation Sweetened Condensed Milk = 13.0 |
| Slickness in Mouth | The slippery feel of the sample while sample is being moved from front to back of mouth. None to High. | Water = 2.0Gerber 1st Foods Applesauce = 4.0 Yoplait Light Vanilla yogurt = 7.5 Log Cabin Sugar Free Syrup = 12.0 |
| Swallow: | ||
| Amount of Effort—Swallow | A measure of exertion required to move sample down throat to swallow. None to High. | Water = 2.0 Hiland Heavy Whipping Cream = 4.0 Yoplait Light Vanilla yogurt = 8.0 Gerber 1st Foods Applesauce = 10.5 Nestle Carnation Sweetened Condensed Milk = 13.0 |
| Flow Speed- Swallowing | A measure of the speed of flow of the product down the throat while swallowing. Slow to fast. | Nestle Carnation Sweetened Condensed Milk = 1.0 Gerber 1st Foods Applesauce = 2.5 Hiland Heavy Whipping Cream = 7.0 2.5% Argo Corn Starch Gel in Water = 10.5 Water = 13.0 Cornstarch boiled in water for 1 min, cool, serve at room temperature |
| Pressure on Throat | The amount of pressure felt on throat while swallowing. The perception of a squeezing or a tightening sensation at the back of the throat. None to High. | Water = 1.0 2.5% Argo Corn Starch Gel in Water = 2.5 Hiland Heavy Whipping Cream = 4.0 Gerber 1st Foods Applesauce = 10.5 Nestle Carnation Sweetened Condensed Milk = 13.0 Cornstarch boiled in water for 1 min, cool, serve at room temperature |
| Cohesiveness- Throat | A measure of how much the product holds together while swallowing. High Spread to No Spread. | Water = 0.0 2.5% Argo Corn Starch Gel in water = 2.5 Hiland Heavy Whipping Cream = 4.0 Yoplait Light Vanilla yogurt = 9.0 Gerber 1st Foods Applesauce = 10.5 Nestle Carnation Sweetened Condensed Milk = 13.0 Cornstarch boiled in water for 1 min, cool, serve at room temperature |
| Mass Amount | The extent the product breaks apart into distinguishable masses. None to Many. Technique: Pushing tongue against the roof of the mouth, see if it breaks into pieces. | Water = 1.0 Gerber 1st Foods Applesauce = 4.0 Musselman’s Home-style Natural Unsweetened Applesauce = 7.0 |
| Roughness | A measure of a rough/scratchy sensation on throat as sample is being swallowed. Smooth to Rough. | Musselman’s Home-style Natural Unsweetened Applesauce = 4.0 |
| Slickness During Swallow | The slippery feel of the sample while being swallowed. None to High. | Water = 2.0 Gerber 1st Foods Applesauce = 4.0 Yoplait Light Vanilla yogurt = 7.5 Log Cabin Sugar Free Syrup = 12.0 |
| After swallow: | ||
| Chalky Coating | The perception of a chalky coating left on mouth and throat surfaces after sample has been swallowed. None to High. | Water = 0.0 Yoplait Light Vanilla yogurt = 3.5 2.5% Argo Corn Starch Gel in Water = 6.0 Ensure Homemade Vanilla Shake = 10.0 Cornstarch boiled in water for 1 min, cool, serve at room temperature |
| Residuals- Mouth | Sample remaining in or on surfaces of mouth after swallowing that triggers the need for subsequent swallows to clear. None to High. | Water = 0.0 2.5% Argo Corn Starch Gel in water = 2.0 Hiland Heavy Whipping Cream = 3.0 Musselman’s Home-style Natural Unsweetened Applesauce = 6.0 Nestle Carnation Sweetened Condensed Milk = 9.0 Cornstarch boiled in water for 1 min, cool, serve at room temperature |
| Residuals- Throat | Sample remaining in back of mouth or throat area after swallowing that triggers the need for subsequent swallows to clear mouth/throat. None to High. | Water = 1.0 2.5% Argo Corn Starch Gel in Water = 3.0 Hiland Heavy Whipping Cream = 4.0 Musselman’s Home-style Natural Unsweetened Applesauce = 7.0 Nestle Carnation Sweetened Condensed Milk = 10.0 Cornstarch boiled in water for 1 min, cool, serve at room temperature |
| Throat Clear | The desire to clear throat or cough in order to remove residual from throat. | Yes/No? |
| Mouthfeel: | ||
| Toothetch | A sensation of abrasion and drying of the surface of the teeth. | Welch’s Concord Grape Juice diluted (1:1) = 5.0 Dilute Concord grape juice 1(juice):1(water) serve in 1 oz cup |
| Mouth Film: | The amount of film left in the mouth after swallowing, similar to milk, etc. | Dillons Skim Milk = 2.5 |
| Astringent | The feeling of a puckering or a tingling sensation on the surface and/or edges of the tongue or mouth. | 0.05% Alum Solution = 2.5 0.1% Alum Solution = 5.0 |
References
- Germain, I.; Dufresne, T.; Gray-Donald, K. A Novel Dysphagia Diet Improves the Nutrient Intake of Institutionalized Elders. J. Am. Diet. Assoc. 2006, 106, 1614–1623. [Google Scholar] [CrossRef]
- Cichero, J.A.Y.; Steele, C.; Duivestein, J.; Clavé, P.; Chen, J.; Kayashita, J.; Dantas, R.; Lecko, C.; Speyer, R.; Lam, P.; et al. The Need for International Terminology and Definitions for Texture-Modified Foods and Thickened Liquids Used in Dysphagia Management: Foundations of a Global Initiative. Curr. Phys. Med. Rehabil. Rep. 2013, 1, 280–291. [Google Scholar] [CrossRef] [Green Version]
- Paik, N.J.; Han, T.R.; Park, J.W.; Lee, E.K.; Park, M.S.; Hwang, I.K. Categorization of dysphagia diets with the line spread test. Arch. Phys. Med. Rehabil. 2004, 85, 857–861. [Google Scholar] [CrossRef] [PubMed]
- Christoffersen, C.; Sargent, A.L.; Halley, P.J.; Murdoch, B.; Cichero, J.A.Y. What we don’t know could hurt us: A single center study of batch-to-batch variability of dietary fluids and “matched” videofluoroscopy fluids. J. Med. Speech-Lang. Pathol. 2002, 10, 159–171. [Google Scholar]
- Garcia, J.M.; Chambers, E. Managing dysphagia through diet modifications. Am. J. Nurs. 2010, 110, 26–33. [Google Scholar] [CrossRef] [PubMed]
- Garcia, J.M.; Chambers IV, E.; Molander, M. Thickened liquids: Practice patterns of speech-language pathologists. Am. J. Speech-Lang. Pathol. 2005, 14, 4–13. [Google Scholar] [CrossRef]
- Steele, C.M.; Van Lieshout, P.H.H.M.; Goff, H.D. The rheology of liquids: A comparison of clinicians’ subjective impressions and objective measurement. Dysphagia 2003, 18, 182–195. [Google Scholar] [CrossRef] [PubMed]
- Robbins, J.; Gensler, G.; Hind, J.; Logemann, J.A.; Lindblad, A.S.; Brandt, D.; Baum, H.; Lilienfeld, D.; Kosek, S.; Lundy, D.; et al. Comparison of 2 interventions for liquid aspiration on pneumonia incidence: A randomized trial. Ann. Intern. Med. 2008, 148, 509–518. [Google Scholar] [CrossRef]
- Clavé, P.; De Kraa, M.; Arreola, V.; Girvent, M.; Farré, R.; Palomera, E.; Serra-Prat, M. The effect of bolus viscosity on swallowing function in neurogenic dysphagia. Aliment. Pharmacol. Ther. 2006, 24, 1385–1394. [Google Scholar] [CrossRef] [PubMed]
- Rofes, L.; Arreola, V.; Mukherjee, R.; Swanson, J.; Clavé, P. The effects of a xanthan gum-based thickener on the swallowing function of patients with dysphagia. Aliment. Pharmacol. Ther. 2014, 39, 1169–1179. [Google Scholar] [CrossRef]
- Kuhlemeier, K.V.; Palmer, J.B.; Rosenberg, D. Effect of liquid bolus consistency and delivery method on aspiration and pharyngeal retention in dysphagia patients. Dysphagia 2001, 16, 119–122. [Google Scholar] [CrossRef]
- Barbon, C.E.A.; Chepeha, D.B.; Hope, A.J.; Peladeau-Pigeon, M.; Waito, A.A.; Steele, C.M. Determining the Impact of Thickened Liquids on Swallowing in Patients Undergoing Irradiation for Oropharynx Cancer. Otolaryngol. Head Neck Surg. 2021, 01945998211010435. [Google Scholar] [CrossRef]
- Kotecki, S.; Schmidt, R. Cost and effectiveness analysis using nursing staff-prepared thickened liquids vs. commercially thickened liquids in stroke patients with dysphagia. Nurs. Econ. 2010, 28, 106. [Google Scholar]
- Garcia, J.M.; Chambers, E. Perspectives of registered dietitians about thickened beverages in nutrition management of dysphagia. Top. Clin. Nutr. 2012, 27, 105–113. [Google Scholar] [CrossRef]
- Lotong, V.; Chun, S.S.; Chambers IV, E.; Garcia, J.M. Texture and flavor characteristics of beverages containing commercial thickening agents for dysphagia diets. J. Food Sci. 2003, 68, 1537–1541. [Google Scholar] [CrossRef]
- Matta, Z.; Chambers IV, E.; Garcia, J.M.; Helverson, J.M. Sensory Characteristics of Beverages Prepared with Commercial Thickeners Used for Dysphagia Diets. J. Am. Diet. Assoc. 2006, 106, 1049–1054. [Google Scholar] [CrossRef] [PubMed]
- McCurtin, A.; Healy, C.; Kelly, L.; Murphy, F.; Ryan, J.; Walsh, J. Plugging the patient evidence gap: What patients with swallowing disorders post-stroke say about thickened liquids. Int. J. Lang. Commun. Disord. 2018, 53, 30–39. [Google Scholar] [CrossRef] [Green Version]
- Sharma, M.; Kristo, E.; Corredig, M.; Duizer, L. Effect of hydrocolloid type on texture of pureed carrots: Rheological and sensory measures. Food Hydrocoll. 2017, 63, 478–487. [Google Scholar] [CrossRef]
- Šárka, E.; Dvořáček, V. New processing and applications of waxy starch (a review). J. Food Eng. 2017, 206, 77–87. [Google Scholar] [CrossRef]
- Chambers, E.; Jenkins, A.; Mertz Garcia, J. Sensory texture analysis of thickened liquids during ingestion. J. Texture Stud. 2017, 48, 518–529. [Google Scholar] [CrossRef]
- Garcia, J.M.; Chambers, E.; Chacon, C.; Di Donfrancesco, B. Consumer acceptance testing of prethickened water products: Implications for nutrition care. Top. Clin. Nutr. 2015, 30, 264–275. [Google Scholar] [CrossRef]
- Chambers, E.; Bowers, J.A.; Dayton, A.D. Statistical designs and panel training/experience for sensory analysis. J. Food Sci. 1981, 46, 1902–1906. [Google Scholar] [CrossRef]
- Chambers, D.H.; Allison, A.M.A.; Chambers IV, E. Training effects on performance of descriptive panelists. J. Sens. Stud. 2004, 19, 486–499. [Google Scholar] [CrossRef]
- Chambers, E.; Smith, E.A. Effects of testing experience on performance of trained sensory panelists. J. Sens. Stud. 1993, 8, 155–166. [Google Scholar] [CrossRef]
- Chambers, E.; Chambers, D.H. Chapter 1 | Consensus Profile Method. In Descriptive Analysis Testing for Sensory Evaluation, 2nd ed.; Bleibaum, R., Ed.; ASTM International: West Conshohocken, PA, USA, 2020; pp. 1–18. [Google Scholar]
- Chambers, E. Consensus Methods for Descriptive Analysis. In Descriptive Analysis in Sensory Evaluation; Kemp, S., Hort, J., Hollowood, T., Eds.; John Wiley & Sons, Ltd.: Chichester, UK, 2018; pp. 213–236. ISBN 9781118991657. [Google Scholar]
- Muñoz, A.M.; Chambers, E.I.V.; Hummer, S. A Multifaceted Category Research Study: How to understand a product category and its consumer responses. J. Sens. Stud. 1996, 11, 261–291. [Google Scholar] [CrossRef]
- Thompson, K.R.; Chambers, D.H.; Chambers IV, E. Sensory characteristics of ice cream produced in the U.S.A. and ITALY. J. Sens. Stud. 2009, 24, 396–414. [Google Scholar] [CrossRef]
- Chambers, E.; Lee, J.; Chun, S.; Miller, A.E. Development of a Lexicon for Commercially Available Cabbage (Baechu) Kimchi. J. Sens. Stud. 2012, 27, 511–518. [Google Scholar] [CrossRef]
- Suwonsichon, S.; Chambers Iv, E.; Kongpensook, V.; Oupadissakoon, C. Sensory lexicon for mango as affected by cultivars and stages of ripeness. J. Sens. Stud. 2012, 27, 148–160. [Google Scholar] [CrossRef]
- Tran, T.; James, M.N.; Chambers, D.; Koppel, K.; Chambers, E. Lexicon development for the sensory description of rye bread. J. Sens. Stud. 2019, 34, e12474. [Google Scholar] [CrossRef] [Green Version]
- Chun, S.; Chambers, E.; Han, I. Development of a Sensory Flavor Lexicon for Mushrooms and Subsequent Characterization of Fresh and Dried Mushrooms. Foods 2020, 9, 980. [Google Scholar] [CrossRef] [PubMed]
- Yang, G.; Chambers, E., IV; Wang, H. Flavor lexicon development and descriptive analysis of Sichuan pepper. J. Sens. Stud. 2021, 36, e12636. [Google Scholar] [CrossRef]
- Mertz Garcia, J.; Chambers, E.; Cook, K. Visualizing the Consistency of Thickened Liquids with Simple Tools: Implications for Clinical Practice. Am. J. Speech-Lang. Pathol. 2018, 27, 270. [Google Scholar] [CrossRef]
- Mann, L.L.; Wong, K. Development of an objective method for assessing viscosity of formulated foods and beverages for the dysphagic diet. J. Am. Diet. Assoc. 1996, 96, 585–588. [Google Scholar] [CrossRef]
- Lund, A.M.; Garcia, J.M.; Chambers, E.I. Line spread as a visual clinical tool for thickened liquids. Am. J. Speech-Lang. Pathol. 2013, 22, 566–571. [Google Scholar] [CrossRef]
- Nguyen, H.; Campi, E.M.; Roy Jackson, W.; Patti, A.F. Effect of oxidative deterioration on flavour and aroma components of lemon oil. Food Chem. 2009, 112, 388–393. [Google Scholar] [CrossRef]
- Society of Sensory Professionals. Psychological Errors. Available online: https://www.sensorysociety.org/knowledge/sspwiki/Pages/Psychological%20Errors.aspx (accessed on 23 November 2021).
- Egharevba, H.O. Chemical Properties of Starch and Its Application in the Food Industry. In Chemical Properties of Starch; Emeje, M., Ed.; IntechOpen: London, UK, 2019. [Google Scholar] [CrossRef] [Green Version]
- Cichero, J.A.Y.; Lam, P.; Steele, C.M.; Hanson, B.; Chen, J.; Dantas, R.O.; Duivestein, J.; Kayashita, J.; Lecko, C.; Murray, J.; et al. Development of International Terminology and Definitions for Texture-Modified Foods and Thickened Fluids Used in Dysphagia Management: The IDDSI Framework. Dysphagia 2017, 32, 293–314. [Google Scholar] [CrossRef] [PubMed] [Green Version]
- Garcia, J.M.; Chambers IV, E.; Matta, Z.; Clark, M. Viscosity measurements of nectar- and honey-thick liquids: Product, liquid, and time comparisons. Dysphagia 2005, 20, 325–335. [Google Scholar] [CrossRef] [PubMed]
- Kwong, E.; Tse, S.K. Application of a Manufacturer’s Guideline and an IDDSI-Driven Guideline to Thickening of Some Non-water Beverages: A Rheological Study. Dysphagia 2021, 36, 270–280. [Google Scholar] [CrossRef] [PubMed]
- An, J.-H.; Yoon, J.-A.; Shin, M.-J.; Kim, S.-H.; Lee, J.-H. Dysphagia-related health information improved consumer acceptability of thickened beverages. Beverages 2021, 7, 32. [Google Scholar] [CrossRef]
- Baert, F.; Vlaemynck, G.; Beeckman, A.S.; Van Weyenberg, S.; Matthys, C. Dysphagia management in Parkinson’s disease: Comparison of the effect of thickening agents on taste, aroma, and texture. J. Food Sci. 2021, 86, 1039–1047. [Google Scholar] [CrossRef] [PubMed]
- Sánchez-Sánchez, E.; Avellaneda-López, Y.; García-Marín, E.; Ramírez-Vargas, G.; Díaz-Jimenez, J.; Ordonez, F.J. Knowledge and practice of health professionals in the management of dysphagia. Int. J. Environ. Res. Public Health 2021, 18, 2139. [Google Scholar] [CrossRef]
Figure 1.
Comparison of viscosity evaluated by the descriptive panel.

Figure 2.
External preference mapping (flavor and aftertaste).

Figure 3.
External preference mapping (texture) FC = From Cup.

Figure 4.
Physical Measures and Fliow (cm) for Line Spread and Bostwick.

Table 1.
Product information.
| Product | Manufacturer | Ingredients |
|---|---|---|
| Thick & Easy Hydrolyte Lemon flavor | Hormel Health Labs Hormel Foods Corporation Savannah, GA 31405 | Water, High Fructose Corn Syrup, Modified Food Starch, Contains 2% or Less of Citric Acid, Salt, Sodium Citrate, Natural and Artificial Flavors, Potassium Citrate, Tricalcium Phosphate, Glycerol Ester of Wood Rosin, Potassium Sorbate and TBHQ, Brominated Soybean Oil, Ascorbic Acid |
| Ready Care Lemon flavor | Lyons-Magnus Fresno, CA 93702 | Water, Modified Food Starch, Natural Flavors, Concentrated Lemon Juice, Ascorbic Acid, Citric Acid, Aspartame, Potassium Citrate |
| Thick & Easy Clear Lemon flavor | Hormel Health LabsHormel Foods Corporation Savannah, GA 31405 | Filtered Water, Contains 2% or Less of the Following: Xanthan Gum, Cellulose Gum, Citric Acid, Natural Lemon Flavor, Sucralose |
| Thick-It AquaCareH2O No flavor added | Precision Foods, Inc. St. Louis, MO 63141 | Artesian Mineral Water, Xanthan Gum, Potassium Sorbate and Sodium Benzoate, Sodium Acid Sulfate, Sodium Hexametaphosphate, Calcium Disodium EDTA |
Note: Identical ingredients are listed for both nectar and honey consistencies within a product line.
Table 2.
Flavor and aftertaste attributes and intensities a of thickened water products b.
| ReadyCare (Starch) | Thick & Easy Hydrolyte (Starch) | Thick-It AquaCareH2O (Gum) | Thick & Easy Clear (Gum) | |||||
|---|---|---|---|---|---|---|---|---|
| Attributes | Nectar | Honey | Nectar | Honey | Nectar | Honey | Nectar | Honey |
| Flavor | ||||||||
| Lemon ID | 2 | 2 | 3.5 | 3 | 0 | 0 | 1.5 | 1.5 |
| Fresh Lemon | 0 | 0 | 2 | 2 | 0 | 0 | 1 | 0 |
| Candy-lemon | 2 | 1.5 | 1.5 | 1.5 | 0 | 0 | 0 | 1 |
| Floral | 1 | 1.5 | 2 | 2 | 0 | 0 | 1 | 0 |
| Piney | 0 | 1.5 | 0 | 0 | 0 | 0 | 0 | 0 |
| Musty | 1.5 | 2.5 | 2 | 1.5 | 2.5 | 2 | 1.5 | 2 |
| Artificial sweetener | 1.5 | 1.5 | 1.5 | 2 | 0 | 0 | 1.5 | 1.5 |
| Starch | 2 | 2 | 1.5 | 2 | 2 | 1.5 | 1.5 | 2 |
| Plastic | 1.5 | 1.5 | 2 | 1.5 | 2.5 | 2.5 | 1.5 | 1.5 |
| Sweet | 2.5 | 2 | 3 | 2.5 | 1 | 0 | 2 | 1.5 |
| Bitter | 2.5 | 2 | 2.5 | 3 | 2 | 1.5 | 2 | 1.5 |
| Sour | 2.5 | 2.5 | 3 | 3 | 2 | 1.5 | 3 | 2.5 |
| Metallic | 1.5 | 2 | 1.5 | 2 | 1.5 | 1 | 1.5 | 1.5 |
| Aftertaste | ||||||||
| Starch | 1.5 | 1.5 | 1 | 1 | 1.5 | 1 | 1 | 1.5 |
| Sweet | 1.5 | 2 | 2 | 2 | 0 | 0 | 1 | 1 |
| Bitter | 1.5 | 2 | 2 | 2 | 2 | 2.5 | 1.5 | 2 |
| Sour | 2 | 2 | 2.5 | 2.5 | 1.5 | 2 | 2 | 2 |
| Metallic | 1 | 1.5 | 1.5 | 1.5 | 1.5 | 1 | 1 | 1 |
a Intensities are based on a 15-point scale with 0.5 increment. b Note: Some brands have both gum and starch-based products provided under the same label. The specific thickening agent in the products tested are listed.
Table 3.
Texture attributes and intensities a.
| Ready Care | Thick & Easy Hydrolyte | Thick-It AquaCareH2O | Thick & Easy Clear | ||||||
|---|---|---|---|---|---|---|---|---|---|
| Stages/Position | Attributes | Nectar | Honey | Nectar | Honey | Nectar | Honey | Nectar | Honey |
| From Cup | Initial flow | 8 | 8.5 | 7 | 8 | 7 | 7.5 | 5.5 | 8 |
| Cohesiveness during flow | 8 | 8.5 | 7 | 8 | 7 | 7.5 | 5 | 8 | |
| Flow speed into mouth | 7.5 | 7 | 8 | 7.5 | 8 | 8 | 9.5 | 7 | |
| Flow direction | straight | straight | straight | straight | straight | straight | combination | straight | |
| In mouth | Graininess | 0 | 0 | 0 | 0 | 0 | 0 | 0 | 0 |
| Lumpy | 0 | 0 | 0 | 0 | 0 | 0 | 0 | 0 | |
| Viscosity | 7.5 | 9.5 | 7 | 8 | 7.5 | 8.5 | 6 | 9 | |
| Denseness | 5 | 7 | 6 | 5.5 | 6 | 7 | 3 | 6.5 | |
| Amount of effort-tongue | 5.5 | 5 | 6 | 6 | 5.5 | 5.5 | 6 | 5.5 | |
| Flow speed on tongue | 5.5 | 5 | 6 | 5.5 | 5.5 | 5 | 7 | 5 | |
| Cohesiveness-tongue | 5.5 | 6.5 | 5.5 | 6 | 5.5 | 5.5 | 4.5 | 6.5 | |
| Effort to hold | 8.5 | 5.5 | 7.5 | 8 | 7 | 6 | 10 | 6.5 | |
| Pressure on tongue | 5.5 | 7 | 7 | 7 | 7 | 7.5 | 4.5 | 8 | |
| Slickness in mouth | 7.5 | 8 | 7 | 7.5 | 7.5 | 9 | 7 | 8.5 | |
| Swallow | Amount of effort-swallow | 6.5 | 7.5 | 6 | 8 | 6 | 8 | 5 | 7.5 |
| Flow speed-swallowing | 5.5 | 5 | 6.5 | 5 | 6.5 | 5.5 | 7 | 5.5 | |
| Pressure on Throat | 7 | 7 | 6.5 | 7 | 6.5 | 7 | 5 | 6.5 | |
| Cohesiveness-throat | 8 | 7 | 6 | 8.5 | 6.5 | 8 | 4.5 | 8 | |
| Mass amount | 2.5 | 3 | 2.5 | 2.5 | 2.5 | 2 | 2 | 2.5 | |
| Roughness | 0 | 0 | 0 | 0 | 0 | 0 | 0 | 0 | |
| Slickness during swallow | 8 | 8 | 7.5 | 7.5 | 7.5 | 8.5 | 8 | 8.5 | |
| After Swallow | Chalky coating | 3 | 2.5 | 2 | 2.5 | 2.5 | 2 | 2 | 2 |
| Residuals-mouth | 2.5 | 2.5 | 2.5 | 2.5 | 2 | 2 | 1.5 | 2.5 | |
| Residuals- throat | 3 | 2.5 | 2 | 2.5 | 2.5 | 2 | 1.5 | 2.5 | |
| Throat clear | yes-1 no-5 | no | no | no | no | no | no | no | |
a Intensities are based on a 15-point scale with 0.5 increment.
Publisher’s Note: MDPI stays neutral with regard to jurisdictional claims in published maps and institutional affiliations. |
© 2022 by the authors. Licensee MDPI, Basel, Switzerland. This article is an open access article distributed under the terms and conditions of the Creative Commons Attribution (CC BY) license (https://creativecommons.org/licenses/by/4.0/).
Share and Cite
MDPI and ACS Style
Chambers, E., IV; Garcia, J.M.; Li, H. Sensory Profiling and External Preference Mapping of Pre-Thickened Water Products for Dysphagia. Beverages 2022, 8, 2. https://0-doi-org.brum.beds.ac.uk/10.3390/beverages8010002
AMA Style
Chambers E IV, Garcia JM, Li H. Sensory Profiling and External Preference Mapping of Pre-Thickened Water Products for Dysphagia. Beverages. 2022; 8(1):2. https://0-doi-org.brum.beds.ac.uk/10.3390/beverages8010002
Chicago/Turabian StyleChambers, Edgar, IV, Jane Mertz Garcia, and Han Li. 2022. "Sensory Profiling and External Preference Mapping of Pre-Thickened Water Products for Dysphagia" Beverages 8, no. 1: 2. https://0-doi-org.brum.beds.ac.uk/10.3390/beverages8010002
Note that from the first issue of 2016, this journal uses article numbers instead of page numbers. See further details here.