
A Rapid HPLC Method for the Simultaneous Determination of Organic Acids and Furans: Food Applications


Chemical and Environmental Science Department, Bernal Institute, University of Limerick, V94 T9PX Limerick, Ireland
*
Authors to whom correspondence should be addressed.
Beverages 2022, 8(1), 6; https://0-doi-org.brum.beds.ac.uk/10.3390/beverages8010006
Submission received: 12 November 2021
/
Revised: 16 December 2021
/
Accepted: 4 January 2022
/
Published: 7 January 2022
(This article belongs to the Section Quality, Nutrition, and Chemistry of Beverages)
Abstract
:Concerns over the potential adulteration of commercially produced foods give rise to a requirement for a simple and fast analytical method capable of quantifying potential adulterants. This work demonstrates a simple HPLC method tailored to detect major organic acids and furans within ingredients in commercial food products, for example, pomegranate molasses, balsamic vinegar, and apple cider vinegar. The relative importance of this method is in its simplicity and its use of an environmentally friendly aqueous mobile phase under isocratic conditions, providing results in a less than 20 min runtime. The chromatographic separation was achieved using an Acclaim® OA, 5 µm, 120 Å (4.0 × 250 mm) column; a UV-DAD detector set at 210 nm; and a 200 mM Na2SO4 mobile phase with 0.55 mL/L methanosulfonic acid as a pH modifier. The method was then validated by quantifying the concentration of acetic acid, formic acid, citric acid, and hydroxymethyl furfural (HMF) in pomegranate molasses, balsamic vinegar, and apple cider vinegar commercial products. The concentration of acetic acid and HMF in balsamic vinegar was 80.380 mg/mL (±1.272 mg/mL) and 2.153 mg/mL (±0.021 mg/mL), respectively. The apple cider vinegar was composed only of acetic acid with a concentration of 44.139 mg/mL (±0.053 mg/mL). The concentrations of citric acid and HMF were 123.425 mg/mL (±2.502 mg/mL) and 11.382 mg/mL (±0.582 mg/mL), respectively, in pomegranate molasses. Furthermore, this method is also capable of determining various organic acids and furans in biomass: levulinic acid, formic acid, furfurals, diformylfuran, and gamma-valerolactone.
1. Introduction
Organic acids and furans are products in various biomass reactions and can be found in food products. They constitute a wide spectrum of biomass compounds and form a platform of value-added compounds with distinctive properties and applications. For instance, some compounds derived from 5-hydroxymethylfurfural (HMF) are used in surfactants that can be included in detergents, pharmaceuticals, cosmetics, and food ingredients [1]. Equally important, γ-valerolactone (GVL) has numerous potential applications: for example, it is used as a fuel additive and is a crucial compound involved in the polyester and bioplastic industries [2,3,4,5,6]. Likewise, the advantage of organic acids lies in the role they provide in producing higher value liquid alkanes via deoxygenating reactions [7,8]. Levulinic acid (LA), for example, is characterized by its carbonyl and ketone functional groups, identifying it as an attractive organic acid in producing added-value cyclic compounds [9]. Formic acid (FA) is a key acid that is obtained in a nearly equimolar ratio with levulinic acid by the liberation of carbohydrates via the hydrolysis of lignocellulosic biomass [7,10,11,12]. Hydrogenation reactions, hydrogen release, and H2 purification have led to new potential roles for formic acid [13]. Similarly, acetic acid is usually produced by the fermentation of grapes along with wheat, corn, wine, and sugars derived from sugar cane and fruits [14]. In order to understand the constituents which make up vinegar, it is necessary to have a good understanding of the upstream production process. It is a sequential two-staged fermentation process of fermentable sugars into ethanol followed by the oxidation of ethanol into acetic acid using Acetobacter bacteria. Vinegar is considered as a dilute solution of acetic acid [15]. Similarly, while citric acid is a key natural constituent used in foods, beverages, and pharmaceuticals, it also features in industrial applications such as chelation, buffering, pH adjustment, and derivatization, making it an important additive used in laundry detergents, shampoos and cosmetics, enhanced oil recovery, and metal cleaning [16]. Equally important, commercially available juices such as lemon and lime juice concentrates are rich in citric acid at about 1.44 and 1.38 g/oz, respectively [17]. Pomegranate molasses is a well-known ingredient used for salad dressing and in traditional Middle Eastern and Turkish cuisine [18]. It is characterized by its bioactive compounds and antioxidants [19,20,21,22].
Pomegranate molasses is produced from pomegranate juice by following traditional methods in which the juice is concentrated by boiling [23]. In brief, upstream processing consists of cleaning, crushing, extraction, filtration, clarification, and evaporation in either an open vessel or under vacuum [24,25]. Krueger (2012) published a comprehensive study that employs statistical tools in order to identify the composition of pomegranate juice based on the screening of 793 commercial pomegranate juices [26]. The study exhibited a mean value of fructose and glucose of 6.83 g/100 g and 6.66 g/100 g, respectively, from which HMF is derived. Citric acid constitutes almost 1.19 g/100 g. In a different study, HPLC-MS was used in order to quantitatively investigate the total acidity in terms of citric acid between authentic and commercial pomegranate molasses [27]. Kamal and his team used matrix solid-phase dispersion extraction coupled with HPLC to study the composition of antioxidants in commercial pomegranate, which included vitamin C, gallic acid, rutin, and ellagic acid [28]. It was published elsewhere that sugars such as fructose, glucose, and sucrose in sugarcane molasses were determined using HPLC with a refractive index detector [29]. Interestingly, HMF was quantified in pomegranate juice concentrates using coupled solid phase extraction ultra-performance liquid chromatography (UPLC) [30]. The main question is whether it is possible to have a simple analytical method capable of analyzing and quantifying major acids and furans. Eventually, insight into the quality of commercial food products as well as the assessment of some biomass reactions is gained from quantification analysis.
To the best of our knowledge, no simple and fast HPLC method has been published to quantify organic acids and furans simultaneously in food products and beverages. In this work, an analytical HPLC method based on work by Lopes et al. [31] was tailored to analyze organic acids such as formic, citric, acetic, and levulinic acid as well as furans such as GVL and HMF. This method is novel in that, while based on an IC protocol, it provides accurate results with minimum effort using conventional HPLC equipped with a UV detector at 210 nm.
2. Materials and Methods
2.1. Materials
In this work, formic acid (LC-MS, meets analytical specifications, 98–100%, lot# SZBD3100V), levulinic acid (99%, EC# 204-649-2), diformylfuran (2,5-furandicarboxaldehyde, 97%, 728373-1G), 5-hydroxymethylfurfural (HMF, ≥99% FG, product# 53407), γ- valerolactone (GVL, ReagentPlus®, 99%, lot# STBJ4763), furfural (2-furaldehyde, 99%, lot# SHBJ4026), acetic acid (analytical grade, ≥99%, EC# 200-580-7), citric acid (ACS reagent, ≥99.5%, lot# BCBW8890), and valeric acid (≥99%, lot# STBH0750), methanosulfonic acid (≥99.5% (T), EC# 200-898-6) were all purchased from Sigma Aldrich (Arklow, Co.Wicklow, Ireland). Anhydrous sodium sulfate (lot# 1689172) for buffer mobile phase was purchased from Fisher Scientific (Ballycoolen, Dublin 15, Ireland). Ballyhoura™ Irish apple cider vinegar (pure raw) and Solesta™ balsamic vinegar of Modena were sourced from local Irish supermarkets (Aldi Stores (Ireland) Ltd., Naas, Co. Kildare). Durra® pomegranate molasses was a product of Levant Food Products Company, Ltd. (Massachusetts 01843, United States).
2.2. Instrumentation
The HPLC system used was an Agilent Technologies 1200 series equipped with a G1312B binary pump SL (serial no. DE63057882), G1322A 1260 degasser (serial no. JPAAJ82844), and G1315C DAD SL (serial no. DE73458282). The analytes were separated using an Acclaim® Organic Acid Dionex column (5 µm, 120 Å, 4.0 × 250 mm, serial no. 001601) supplied by Thermo Fisher Scientific (Ballycoolen, Dublin 15, Ireland).
2.3. Chromatography Conditions
The protocol for the chromatography separation was developed based on isocratic simple conditions. The injection volume was set at 2 µL and the column temperature at 30 °C. Ultra-pure water was used as a washing solvent between the samples. The mobile phase used was 200 mM Na2SO4 aqueous solution with 0.55 mL of methanosulfonic acid added per liter of mobile phase (pH = 2.67), and the binary pump was fixed at a flow rate of 0.3 mL/min. As an attempt to investigate the possibility of achieving a shorter runtime, the runs were then repeated using the same conditions but with a flow rate of 0.5 mL/min. All species were detected using DAD wavelengths at 210 nm.
2.4. Standards Mixes and Sample Preparation
For calibration purposes, three different concentrations of each standard were prepared by mixing a certain amount of the standard chemical with ultra-pure water (18 MΩ) in a test tube. The used amounts of the stock chemicals and water are tabulated in Table S1. In addition, mixed standard stock solutions were made up by mixing together different amounts of the already prepared individual standards of formic acid, citric acid, levulinic acid, and HMF into a 15 mL tube, to which ultra-pure water was then added to dilute to a final volume (Table S2). This resulted in three different concentrations of standard mixes labelled as STD1, STD2, and STD3. Similarly, three other mixed standard stock solutions (STD4, STD5, and STD6) consisting of formic acid, acetic acid, levulinic acid, and HMF were prepared in the same way for quantification of the components in the samples of pomegranate molasses (Table S2).
The samples of the three commercial products, pomegranate molasses (POM), balsamic vinegar (B.VIN), and apple cider vinegar (ACV), were prepared as follows: initially, a known amount of the original commercial product was weighed and dispensed into a 15 mL plastic tube. Afterwards, the same amount of levulinic acid internal standard was pipetted onto each sample and subsequently diluted with ultra-pure water to volume in order to meet the indicated calibration range (Table S3).
All the prepared individual standards, the mixed standard stock solutions (STD1–STD6), and the commercial products samples were filtered using a 0.2 µm filter while being transferred to glass vials.
2.5. System Calibration
Firstly, the system was calibrated by running three concentrations of the prepared individual standards of each analyte at a mobile phase flow of 0.5 mL/min. The approximate range of concentrations of standards was 55–108 mg/mL for formic, acetic, citric acid, and levulinic acid, as well as GVL (Table S1). Similarly, three different concentrations within a range of 0.2–1 mg/mL were selected for HMF, diformylfuran, and furfural (Table S1). The linear calibration equations and R2 values are tabulated in Table S4 and the curves are shown in Figures S1–S8. Secondly, the mixed standard solutions STD1, STD2, and STD3 and STD4, STD5, abs STD6 were run in the same sequence with POM and B.VIN and ACV samples, respectively. Table S2 displays the range of concentrations of each standard in the mixed standard solutions used for linear calibration. Figures S9–S14 display the linear calibration plots of peak areas against concentrations in the STD1–STD6 mixed standards. The R2 values ranged between 0.9995 and 1.0000 are listed in Table S5 along with their corresponding equations of the linear relations.
3. Results and Discussion
The analysis of the commercial products’ samples was executed on two different occasions, where on the first event pomegranate molasses samples (POM) were run along with mixed standard solutions STD1, STD2, and STD3. Then, vinegar products (B.VIN and ACV) and mixed standard solutions STD4, STD5, and STD6 were run together as a separate batch. Each commercial product sample (POM, B.VIN, and ACV) was split into two vials as duplicates denoted by A and B. In order to achieve more accurate results in terms of response factor, two mixed standard solutions (STD1 and STD2) were run following POM.A and POM.B samples. These mixed standard solutions were denoted by STD1-inline-POM (A/B) and STD2-inline-POM (A/B). Thus, as a part of the quantification analysis of pomegranate samples, the HPLC sequence was performed as per the order in Table 1.
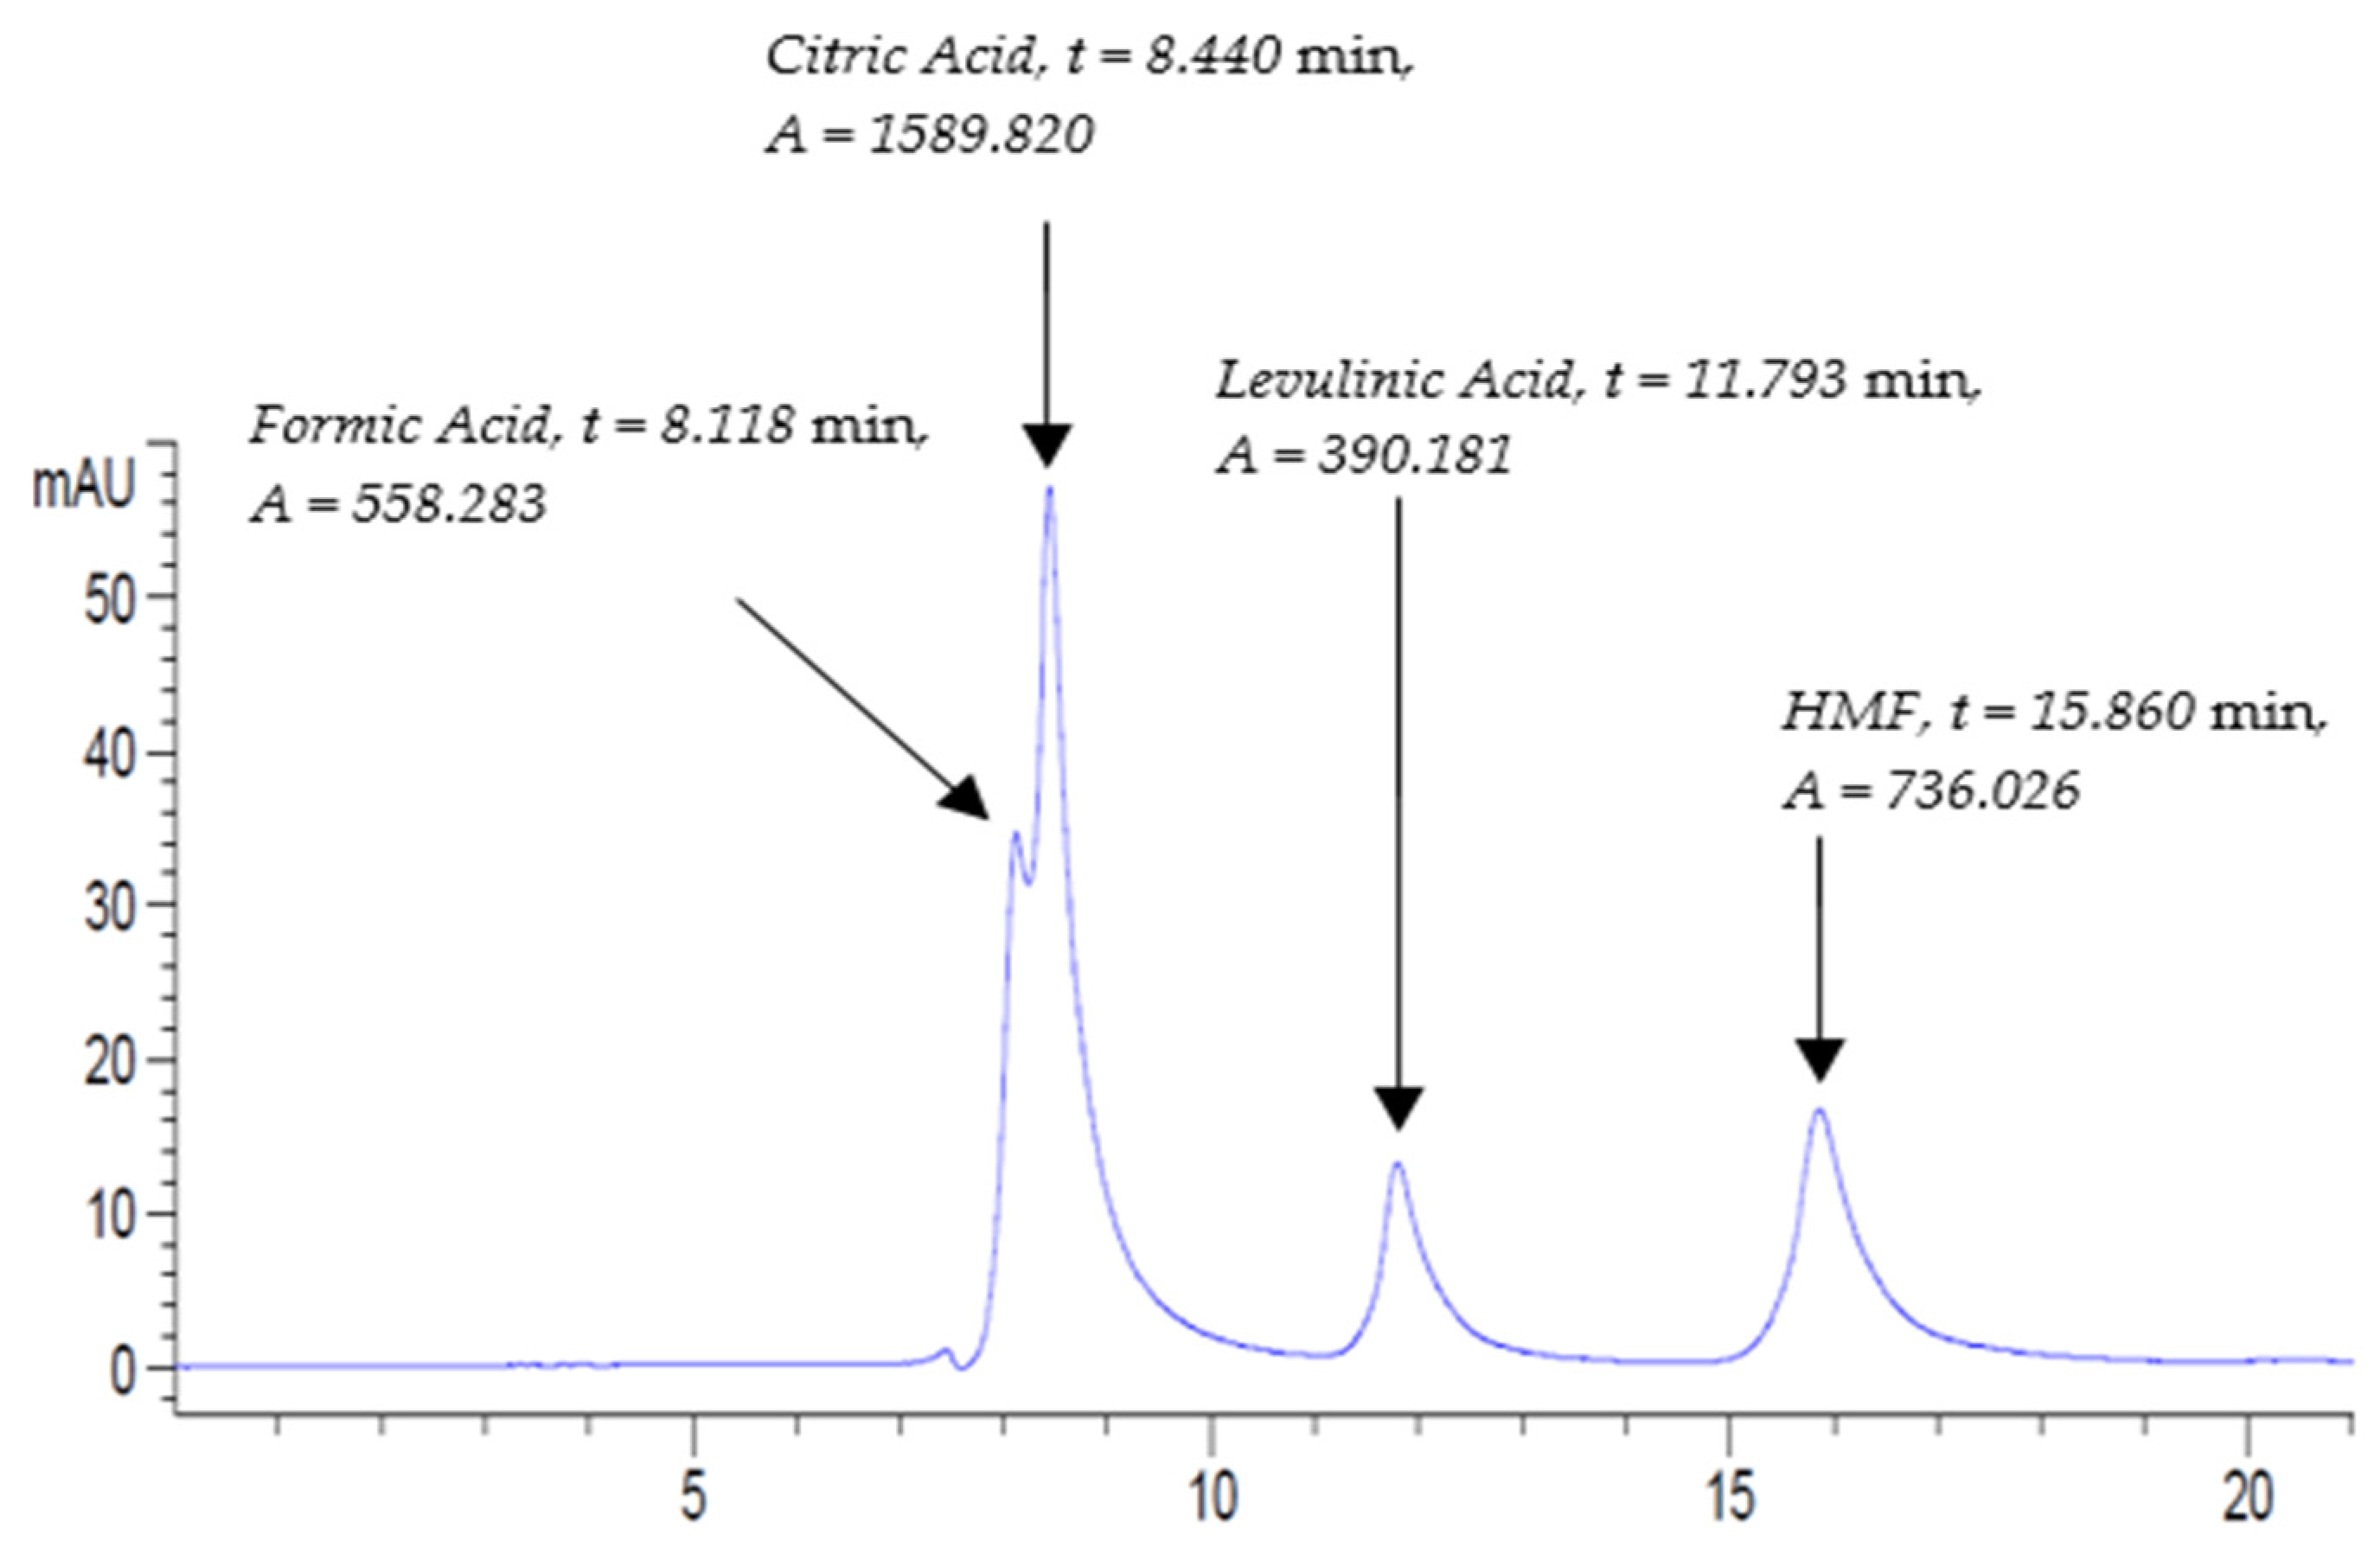
The HPLC chromatogram of STD2 mixed standard solution at 210 nm is shown in Figure 1. The retention times of formic acid, citric acid, levulinic acid, and HMF were at 8.118 min, 8.440 min, 11.793 min, and 15.860 min, respectively. Clearly, all analytes eluted no later than 18 min at a flow rate of 0.3 mL/min.
The remaining chromatograms of the used mixed standard solutions are listed in the Supplementary Material (Figures S15 and S16).
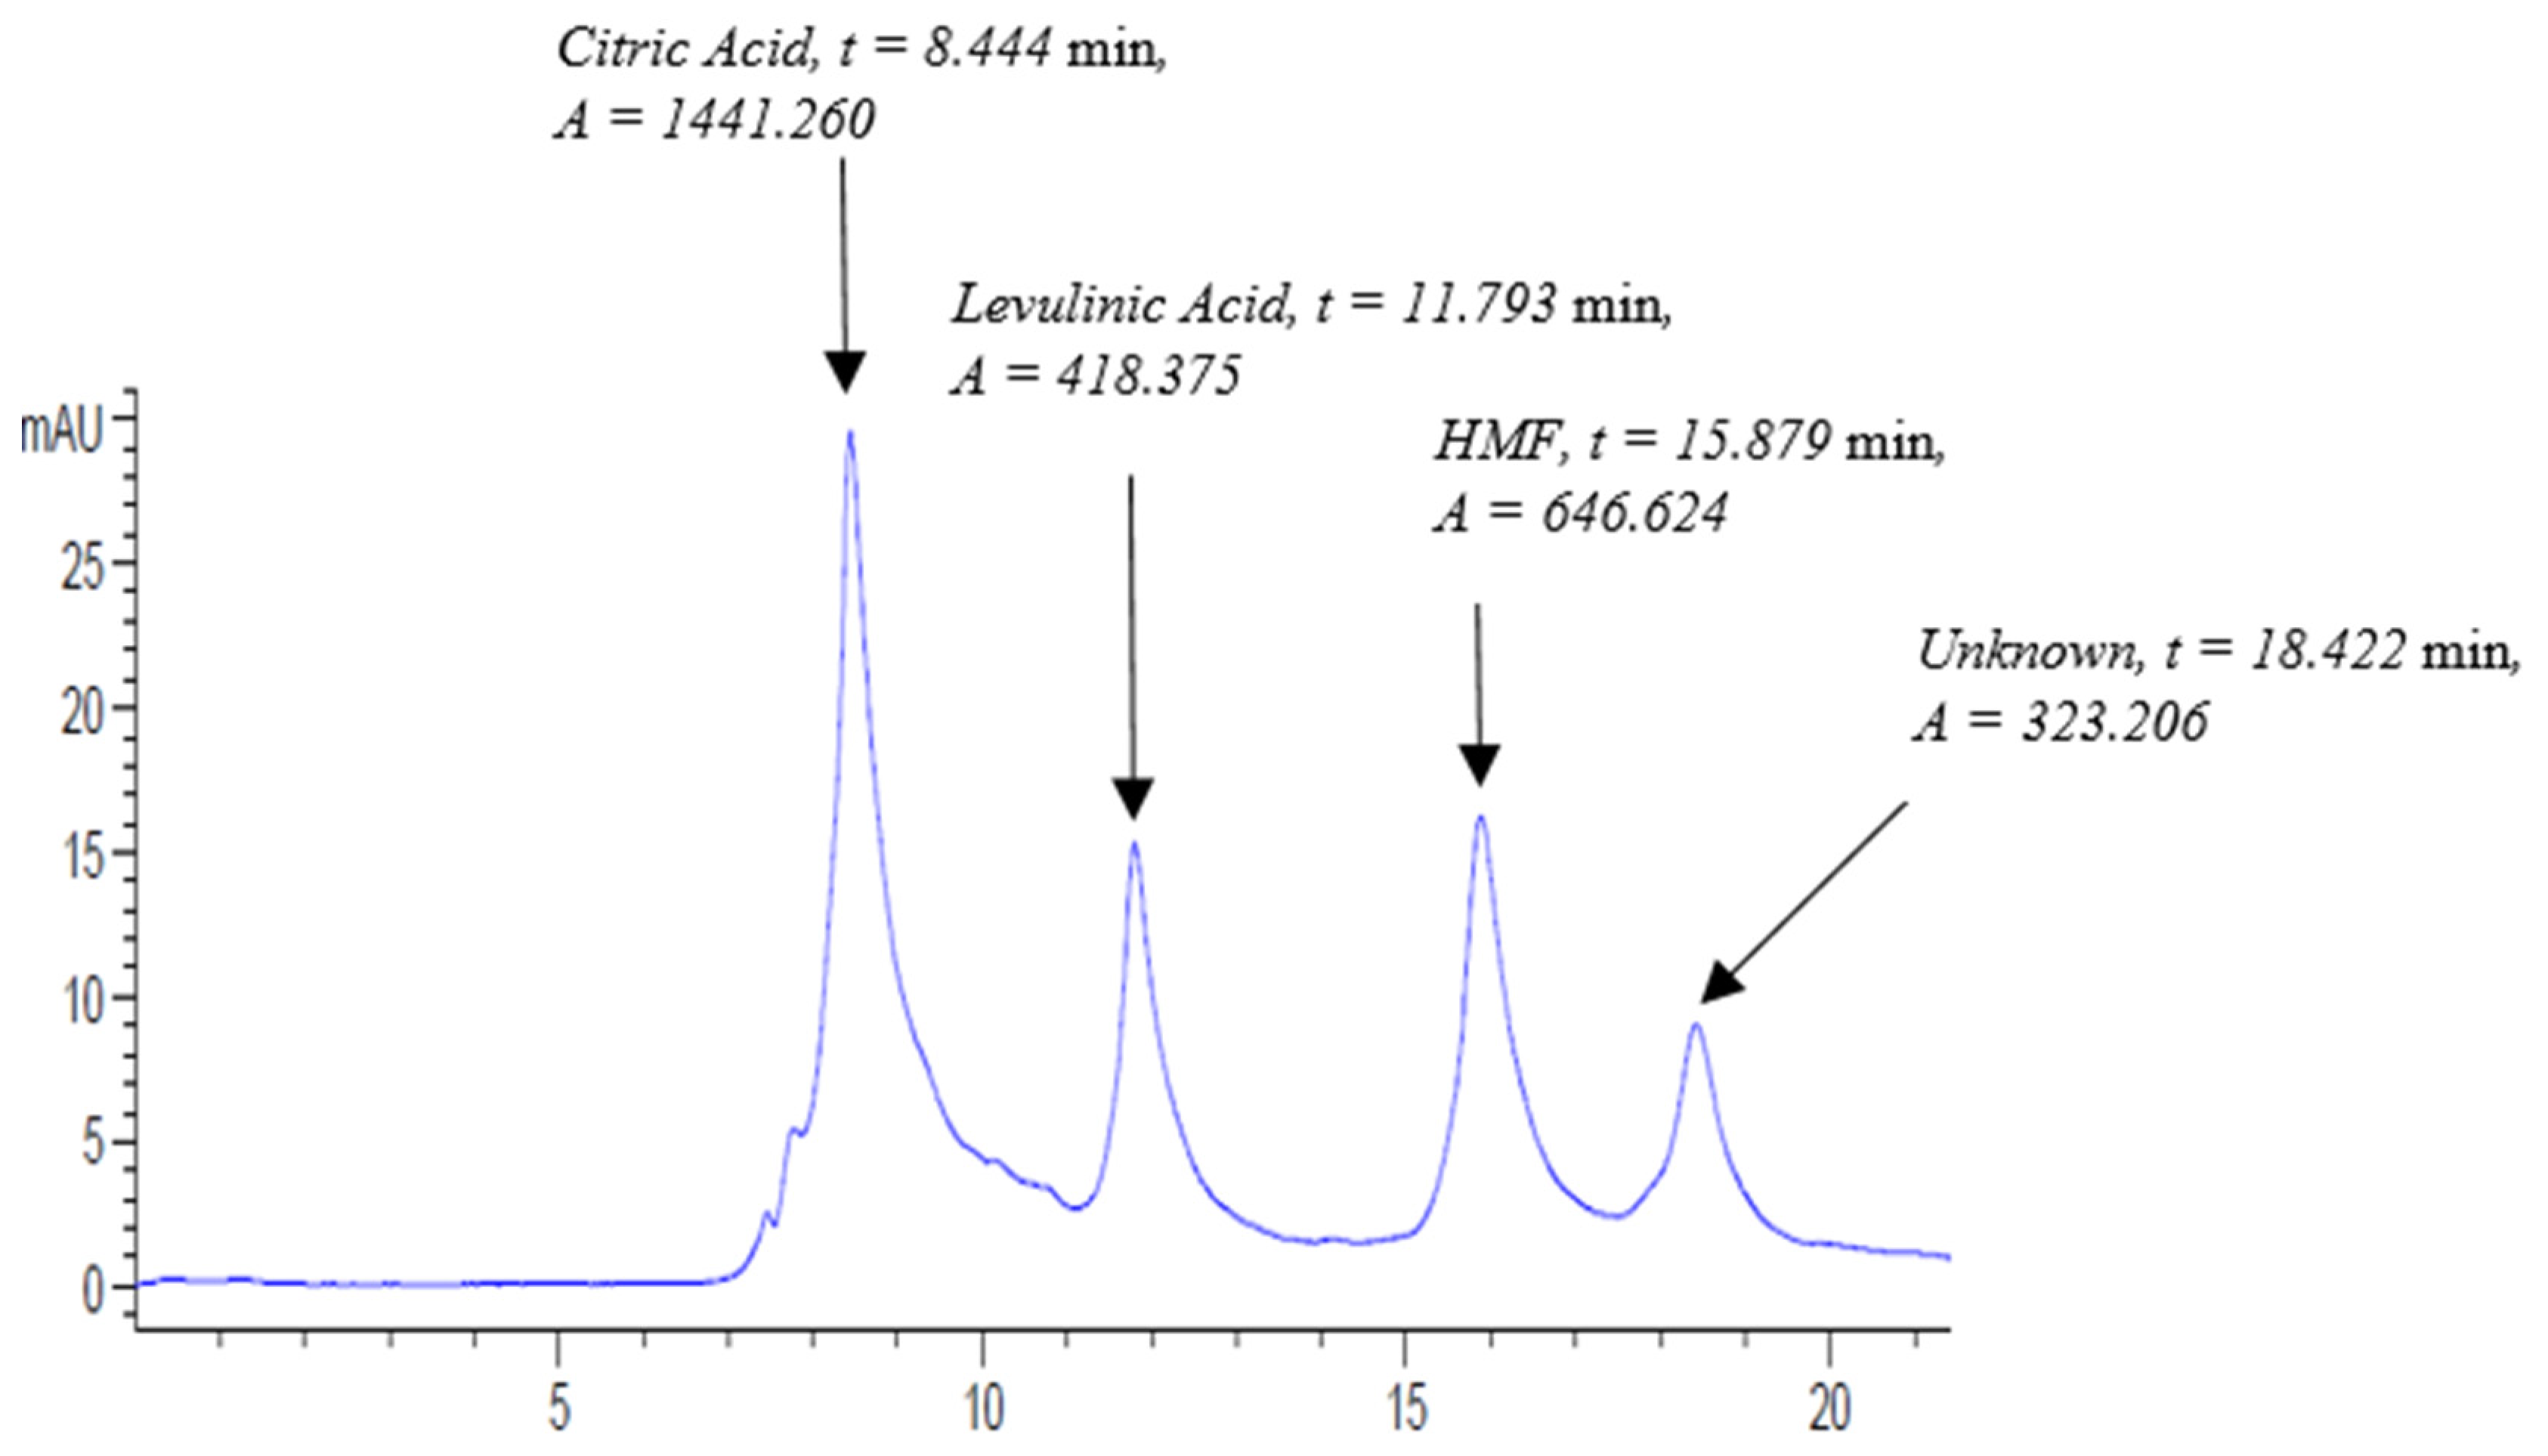
Figure 2 elucidates the chromatogram of the pomegranate molasses (POM.A) sample at 210 nm at a flow rate of 0.3 mL/min. The chromatogram shows four major peaks, where the first, second, and third peak correspond to citric acid, levulinic acid (IS), and HMF, respectively, whereas the 4th peak did not match with any of the used standards and was denoted as unknown. All the identified peaks eluted before 20 min (Figure 2). The chromatogram of POM.B is listed in Figure S17.
The concentrations of citric acid and HMF species in pomegranate molasses were calculated based on the external standard response factor, which was determined by Equation (1):
The calculation footprints were started by determining the response factor of all mixed standard solutions, including that of STD1-inline-POM (A/B) and STD2-inline-Pom (A/B). Consequently, the concentration of the samples POM.A and POM.B were calculated via Equation (1) using the RF value of the inline mixed standard. The relative response factor RRF of each species was calculated using Equation (2) or Equation (3).
Or
Table 2 exhibits the concentration, standard deviation, and RRF of each constituent of pomegranate samples.
The mean value and standard deviation of citric acid concentration in pomegranate molasses were 123.425 mg/mL and ±2.502 mg/mL, respectively. This is equivalent to 8.814% citric acid content, which is in agreement with the reported values of 7.5% citric acid [32]. In regard to HMF, the average concentration and standard deviation were 11.382 mg/mL and ±0.582 mg/mL, respectively. This is equivalent to 794.767 mg/100 g molasses, which is higher than the standard value of HMF of 50 mg/100 g as per the chemical analysis performed by the same group [32]. This could be attributed to open air heating for a long time [32] or due to some added glucose syrup, as was the case for one of the commercial products analyzed to have 1524.98 mg/kg [29]. Moreover, it was proposed that low pH values (total acidity) facilitate the formation of HMF [33].
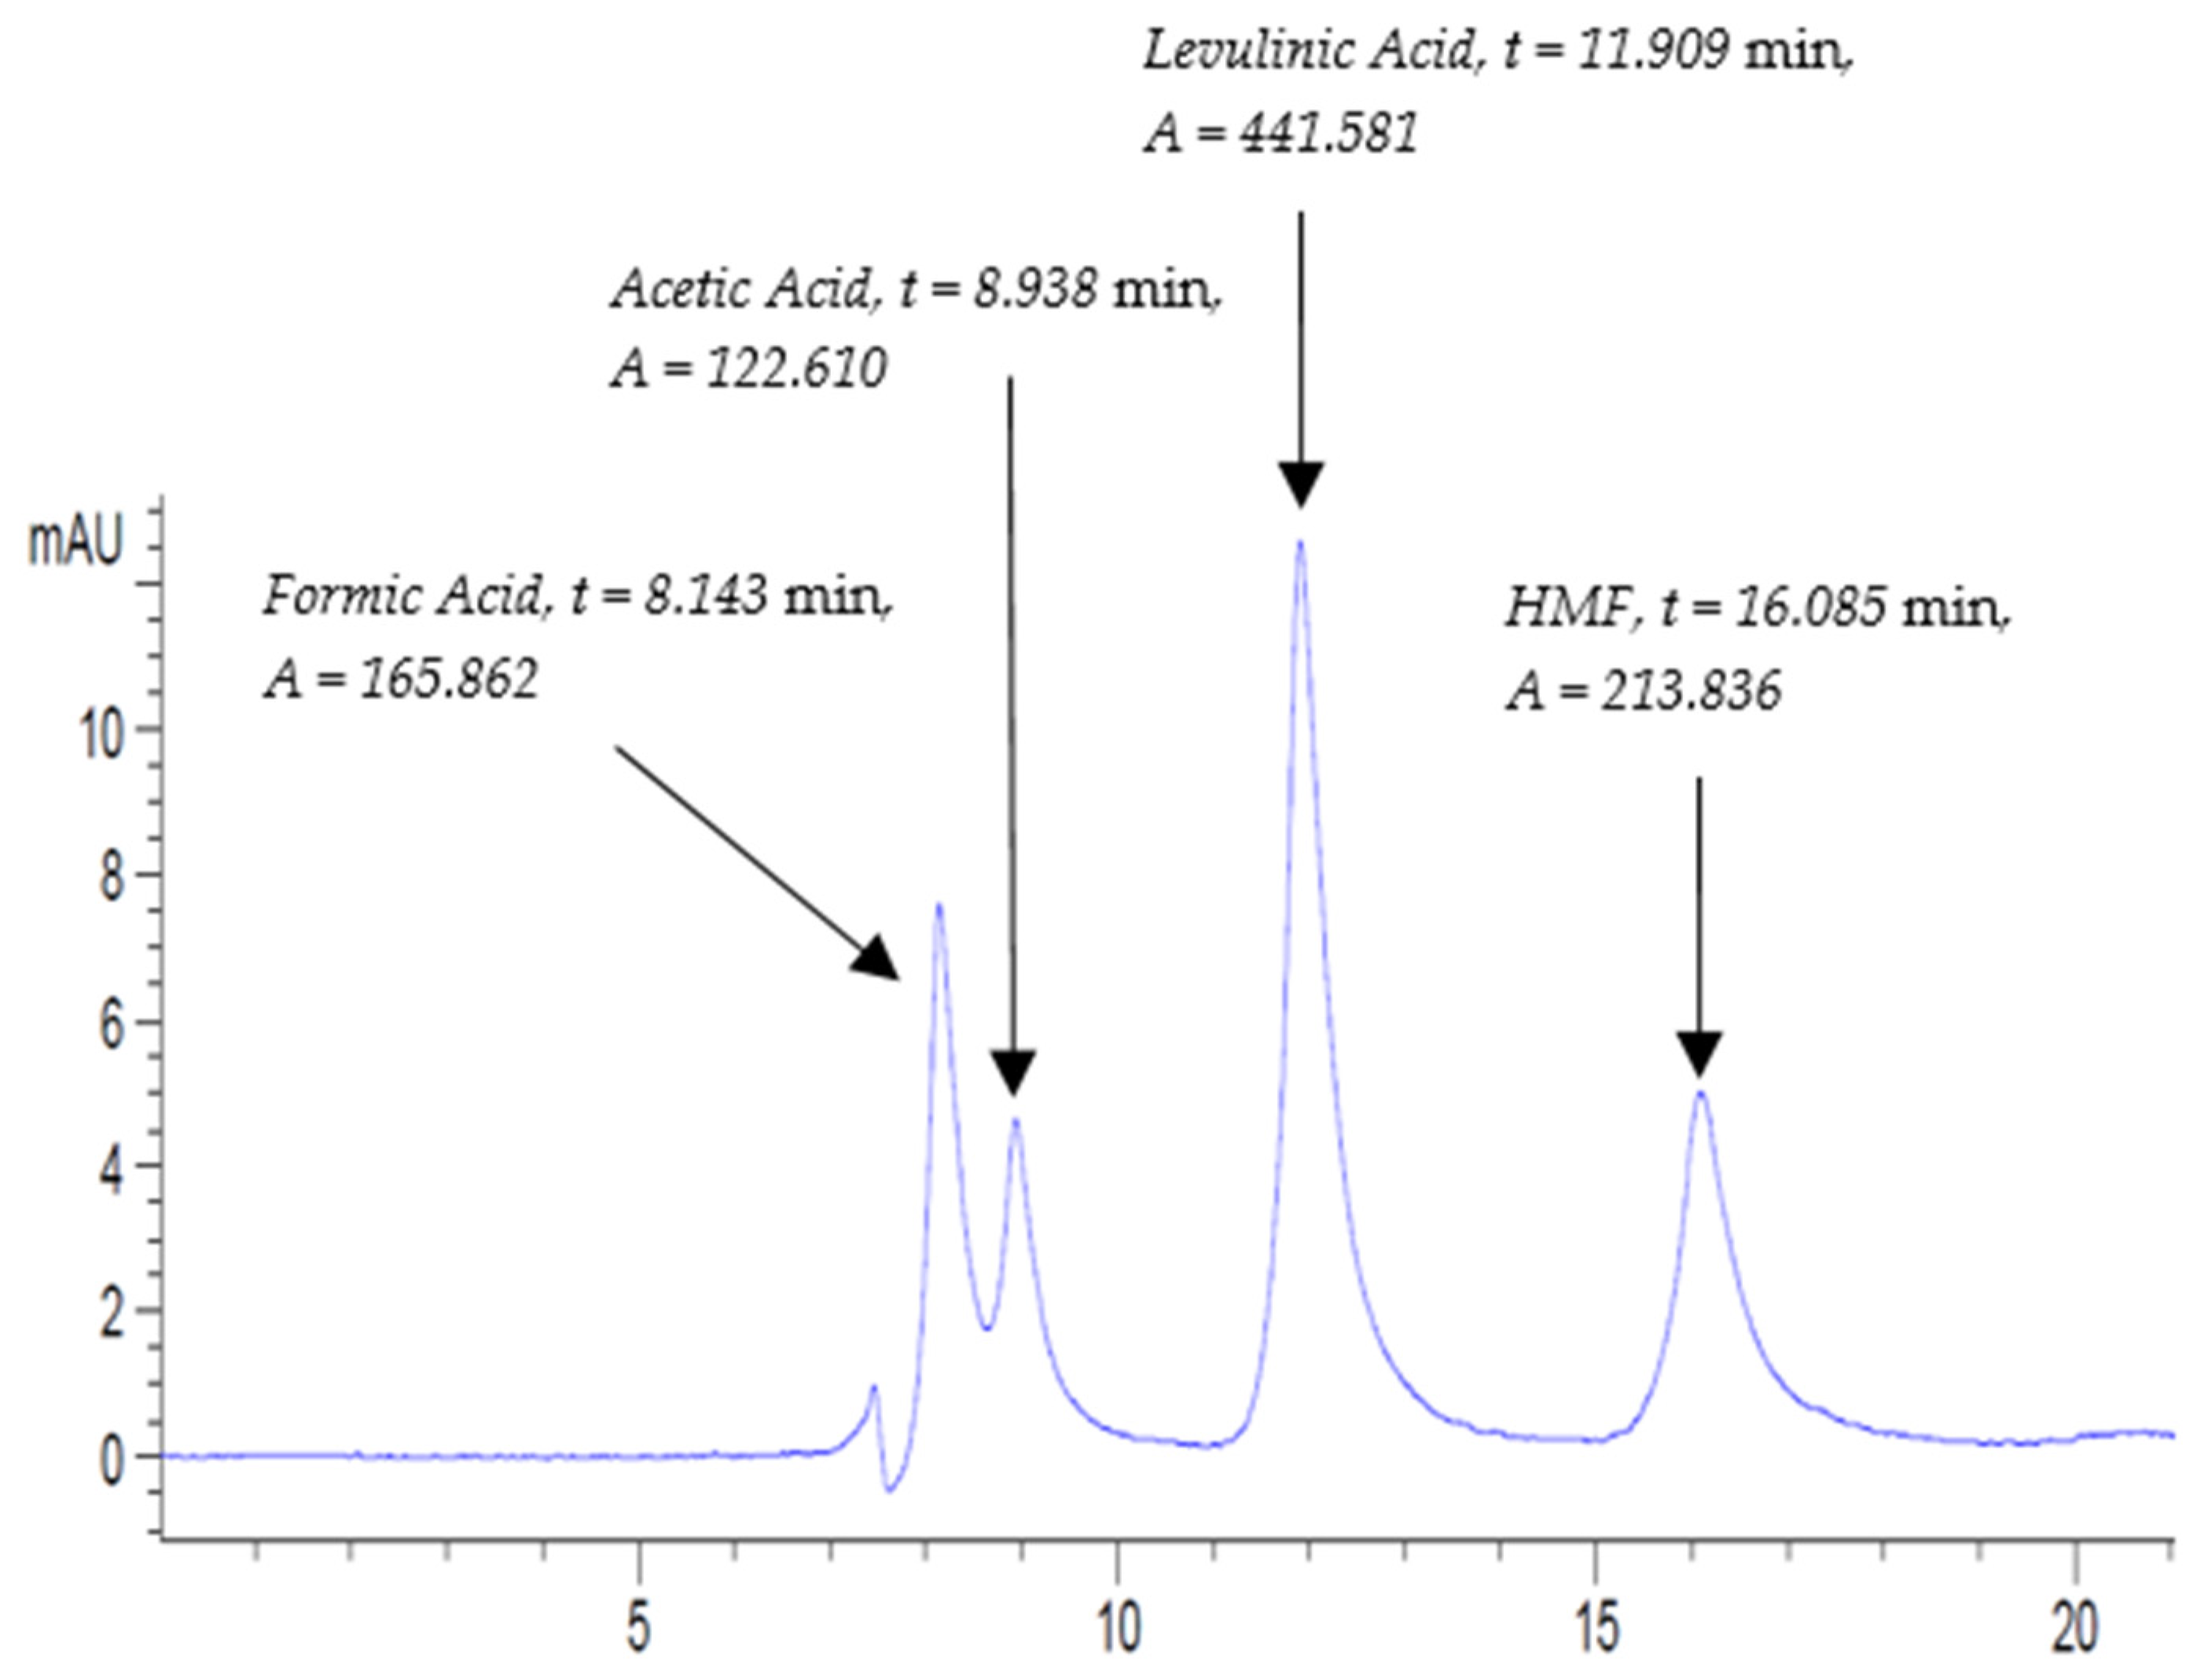
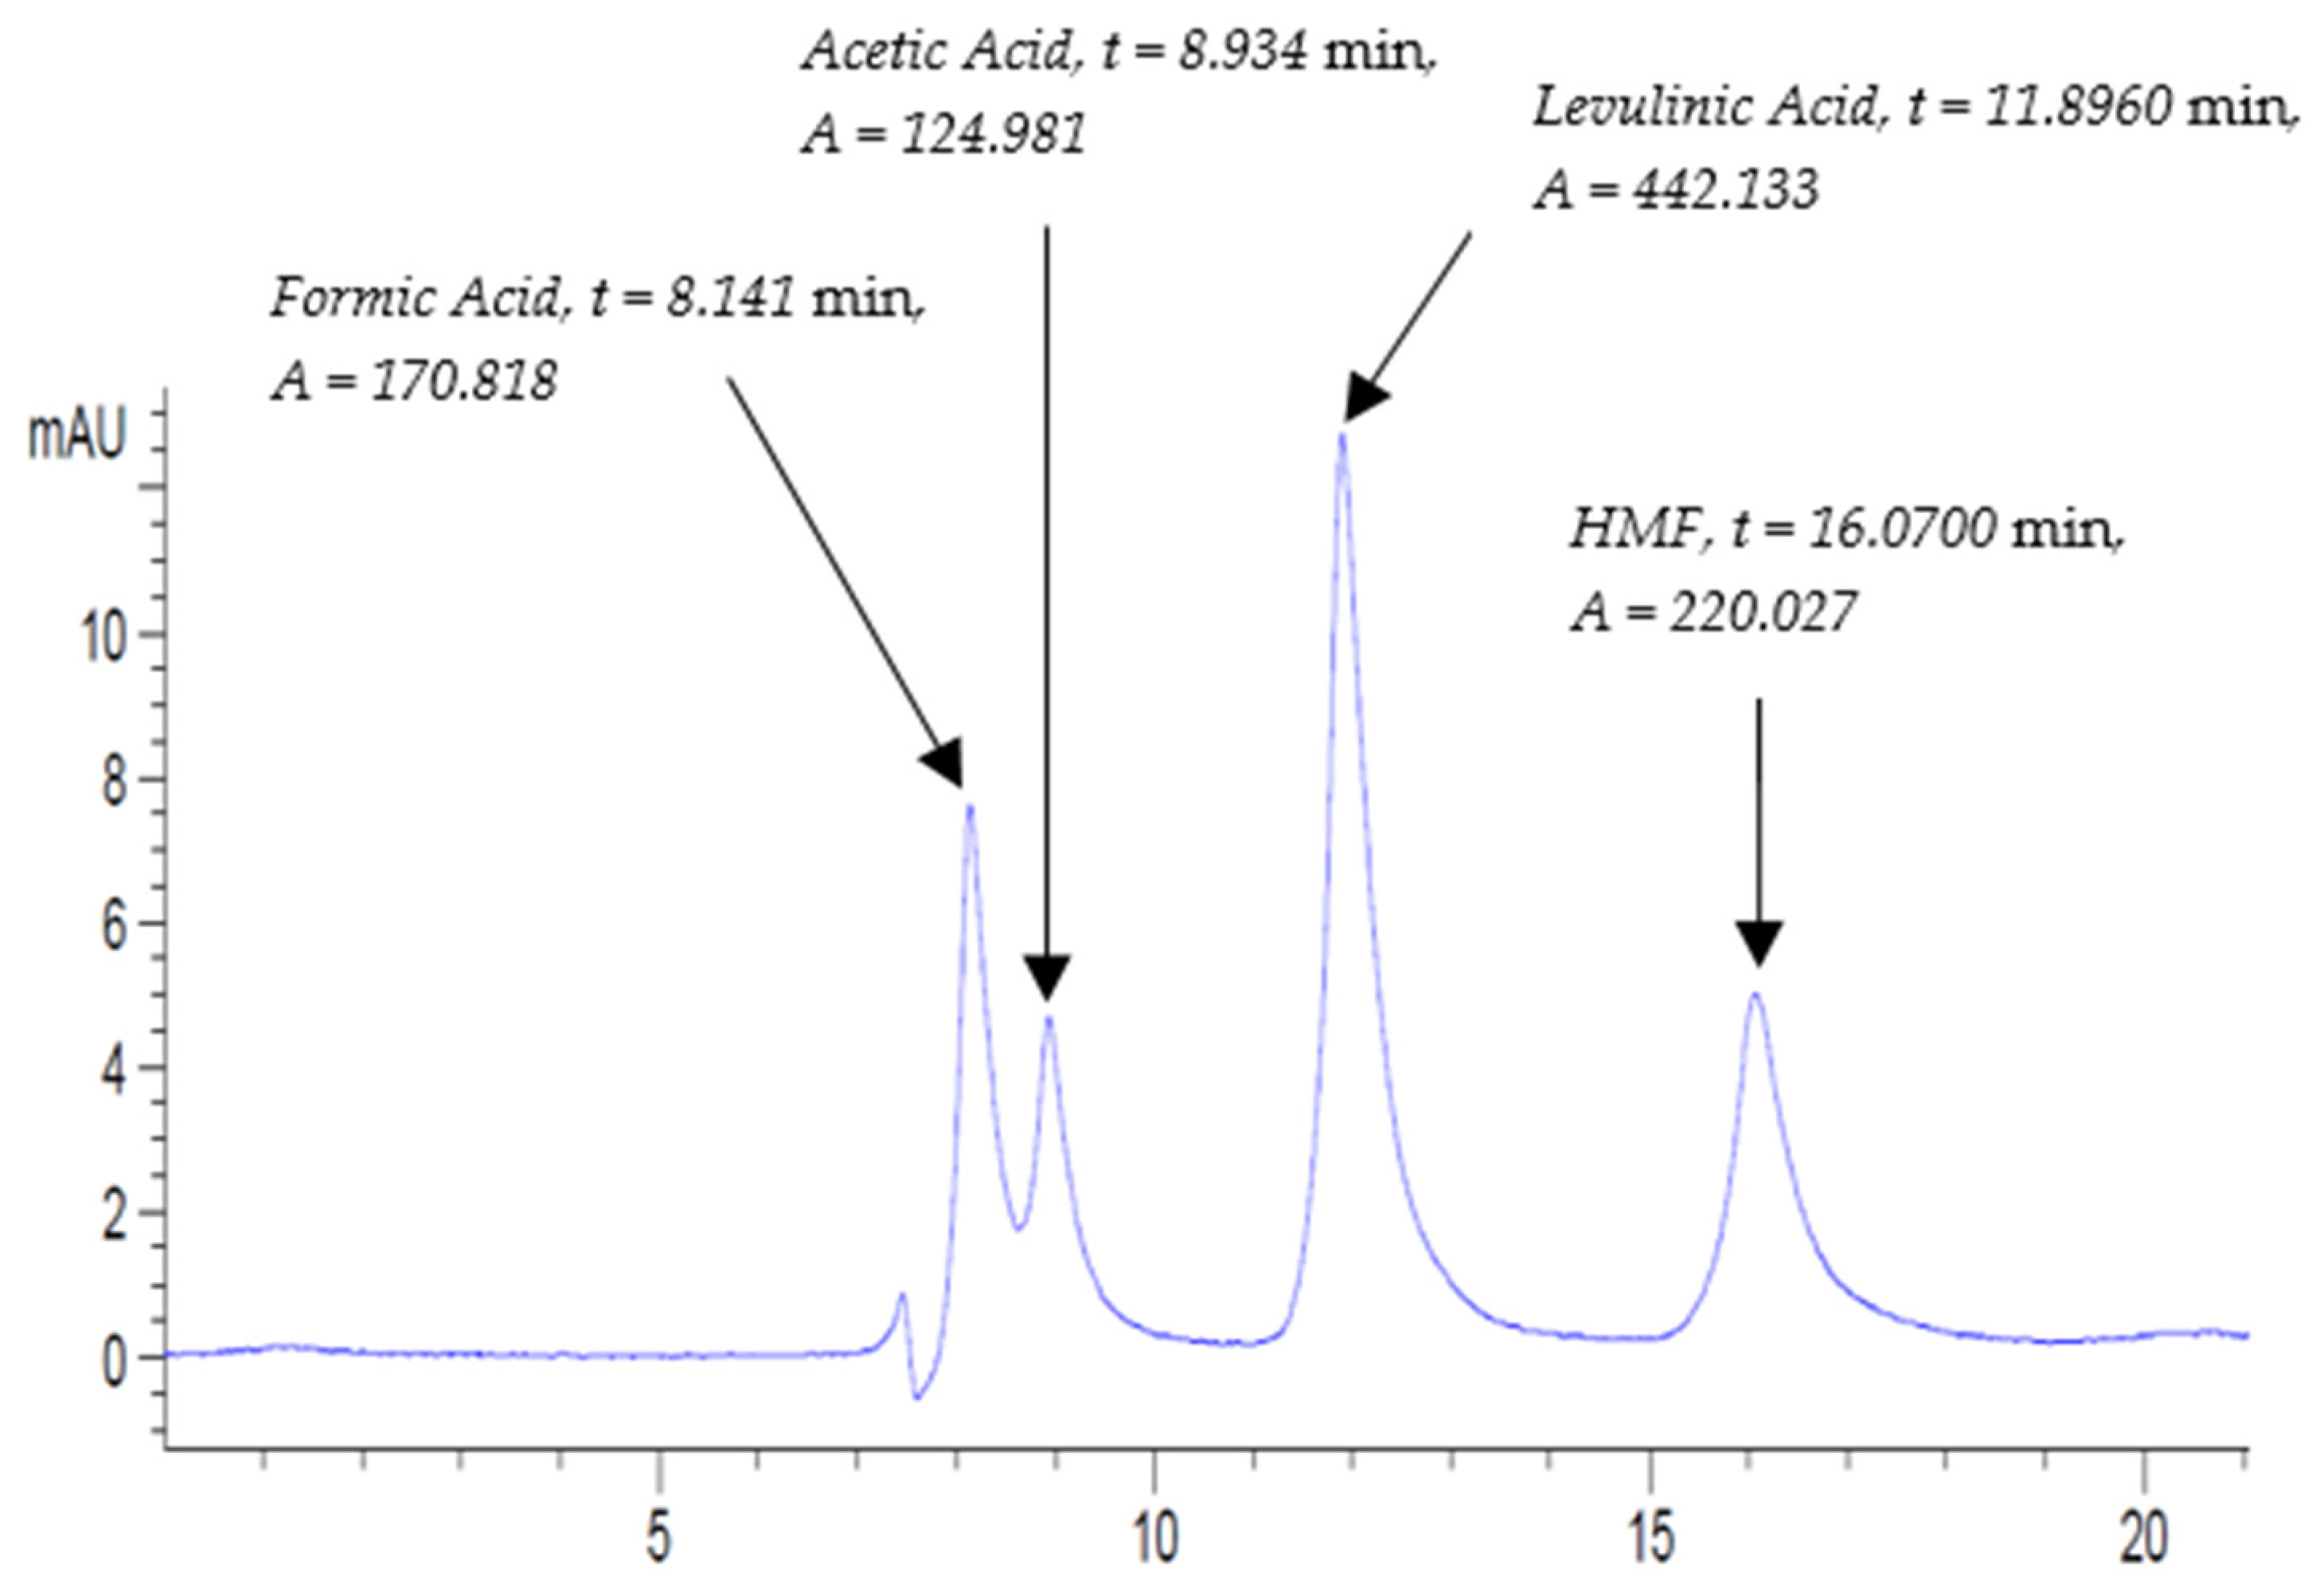
Concerning vinegar products, both B.VIN and ACV were run in the same order as the sequence in Table 1. The HPLC chromatogram of STD4-Inline-B.VIN (A) mixed standard solution at 210 nm is shown in Figure 3. The retention times of formic acid, acetic acid, levulinic acid (IS), and HMF were at 8.143, 8.938, 11.909, and 16.085 min, respectively. The rest of the mixed standard solutions’ chromatograms (STD4, STD5, and STD6) used for all vinegar samples (B.VIN and ACV) are listed in Figures S18–S20.
The chromatogram of the balsamic vinegar sample B.VIN (A), executed at the same HPLC conditions, is shown in Figure 4. This chromatogram demonstrates four major peaks, where all of them eluted no later than 20 min. Using the elution order of analytes in the mixed standard solution STD4-Inline-B.VIN (A) displayed in Figure 3, the second peak, third peak, and fourth peak correspond to acetic acid, levulinic acid (IS), and HMF, respectively. The first peak was not relevant to any of the selected standards and was denoted as unknown. The chromatogram of the second sample of the duplicates of balsamic vinegar B.VIN (B) is displayed in Figure S21.
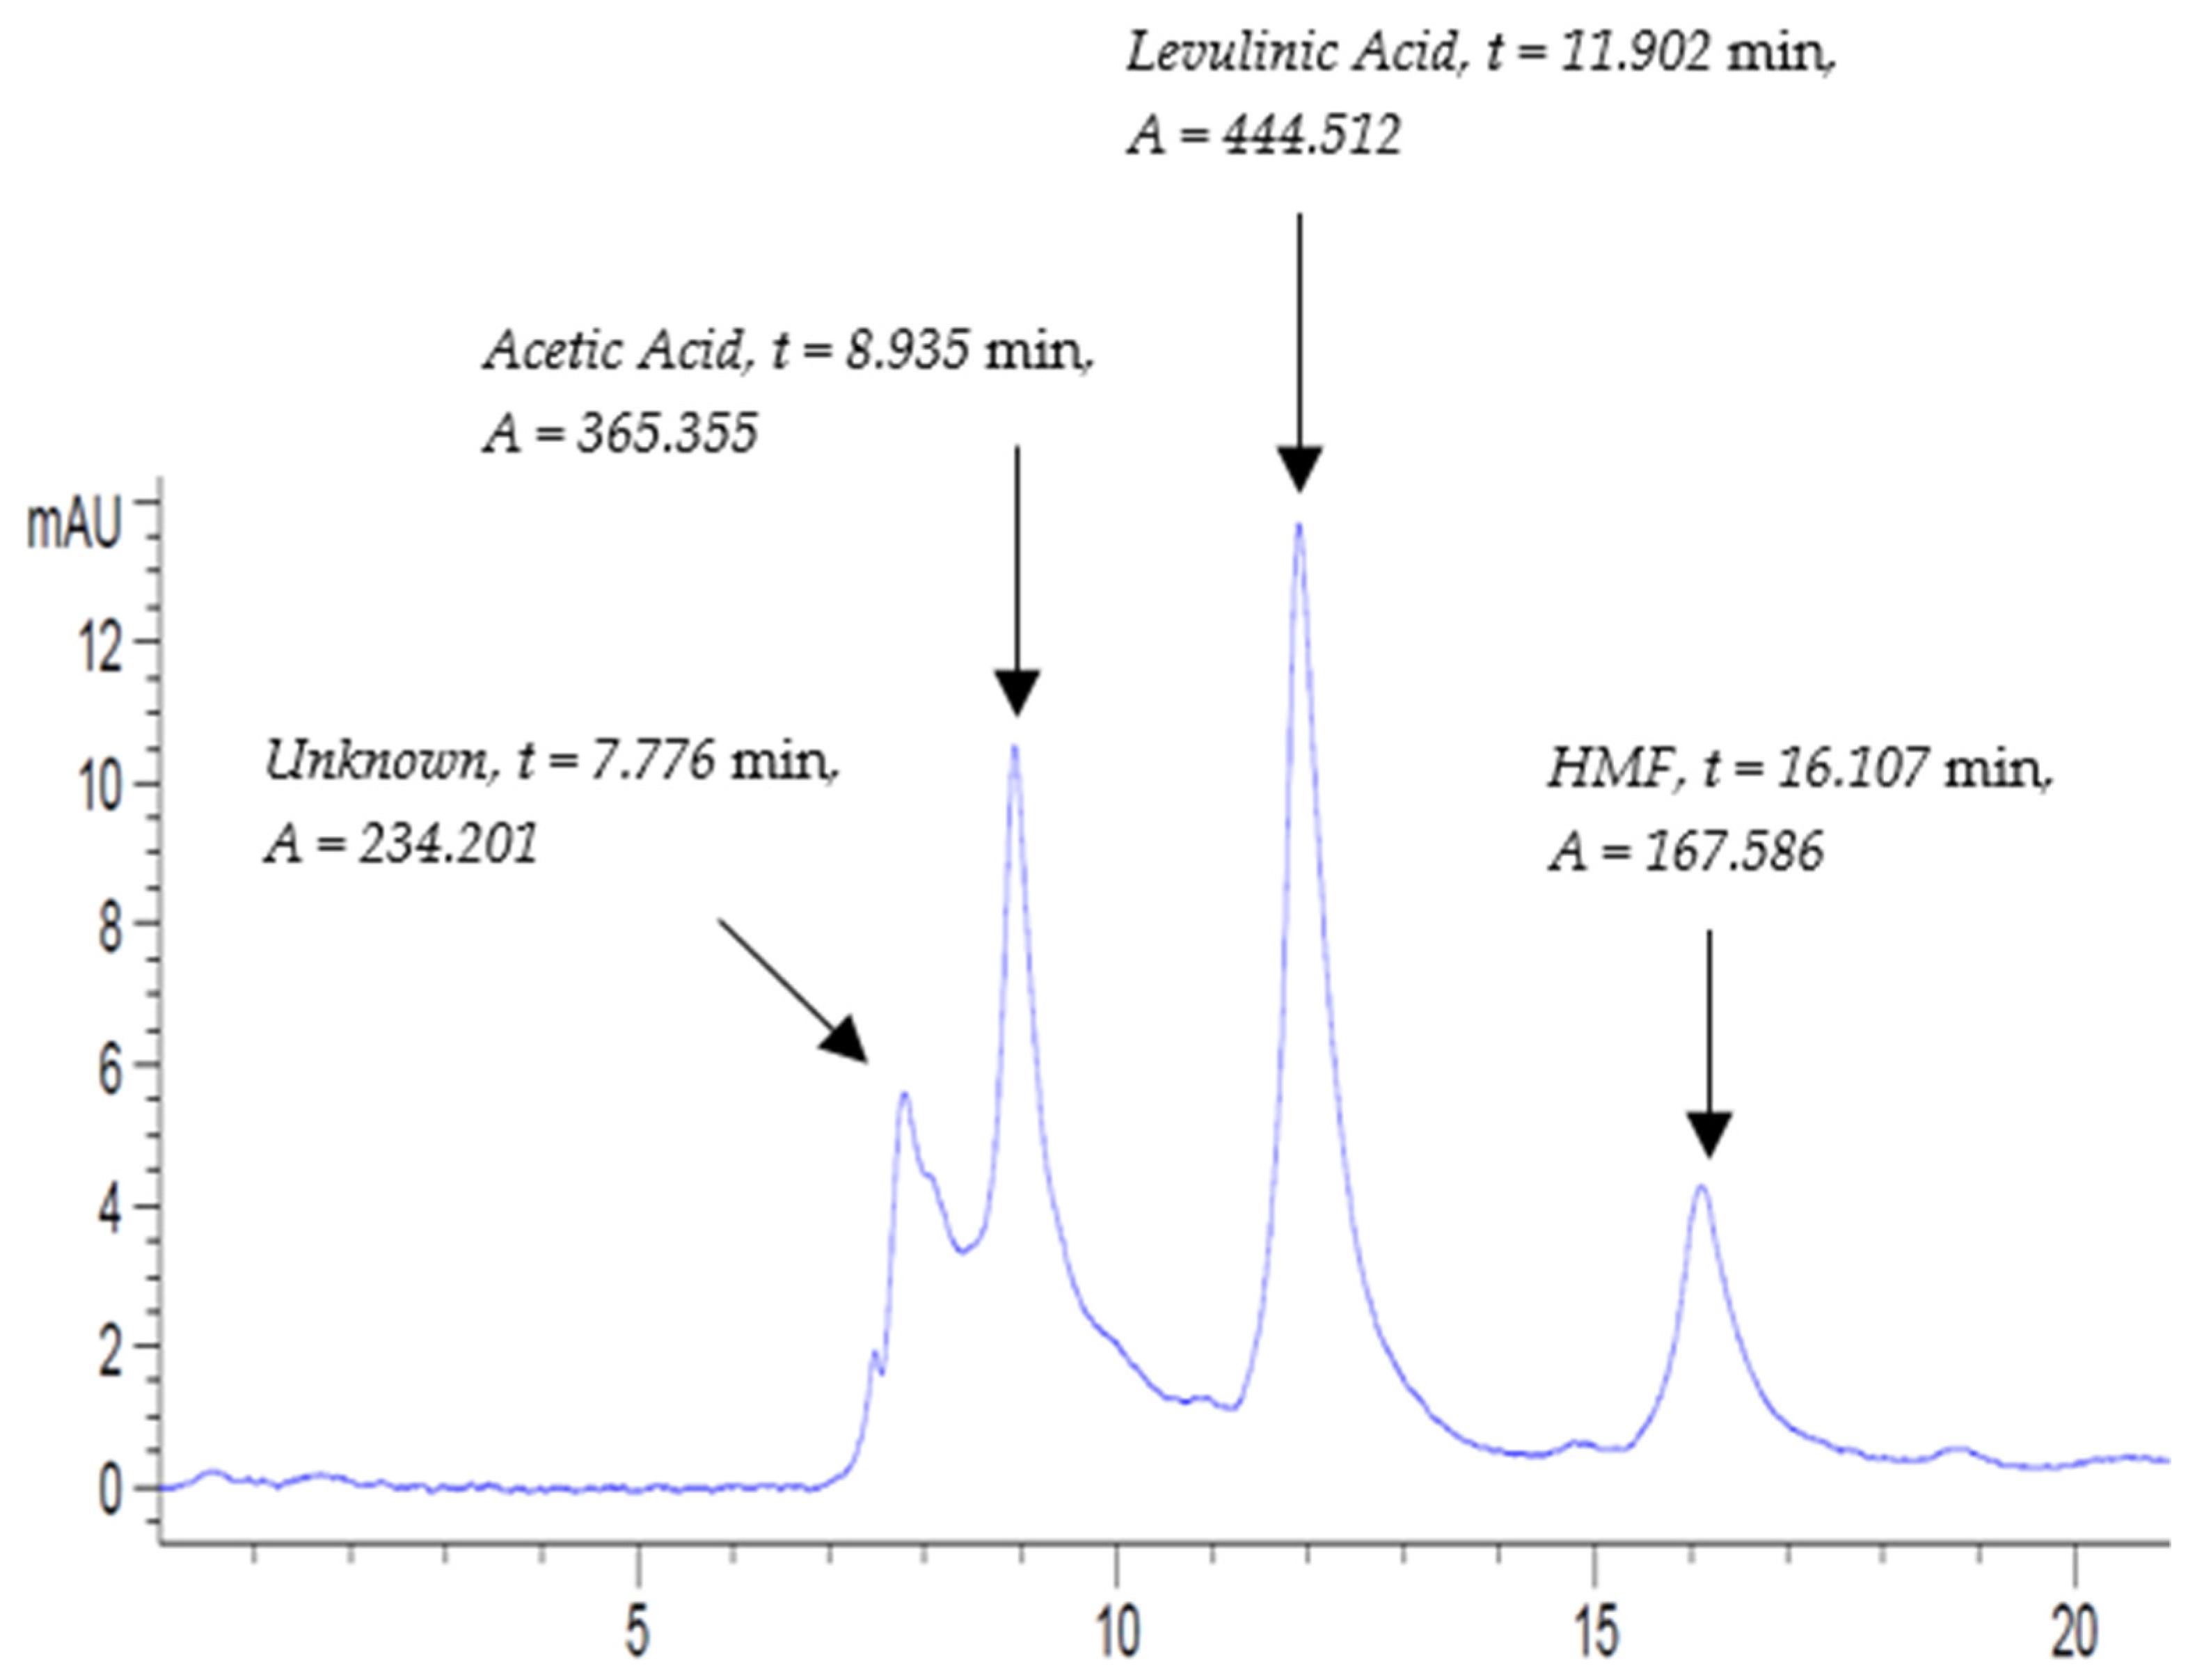
As mentioned previously, the ACV sample relating to pure apple cider vinegar of Modena® was run along with B.VIN as one batch sequence. In order to identify the nature of the peaks, the mixed standard solution STD4 was run again in between ACV duplicates and was labeled as STD4-Inline-ACV(A/B). Undoubtedly, a similar chromatogram was reproduced having four peaks that correspond to formic acid, acetic acid, levulinic acid (IS), and HMF (Figure 5).
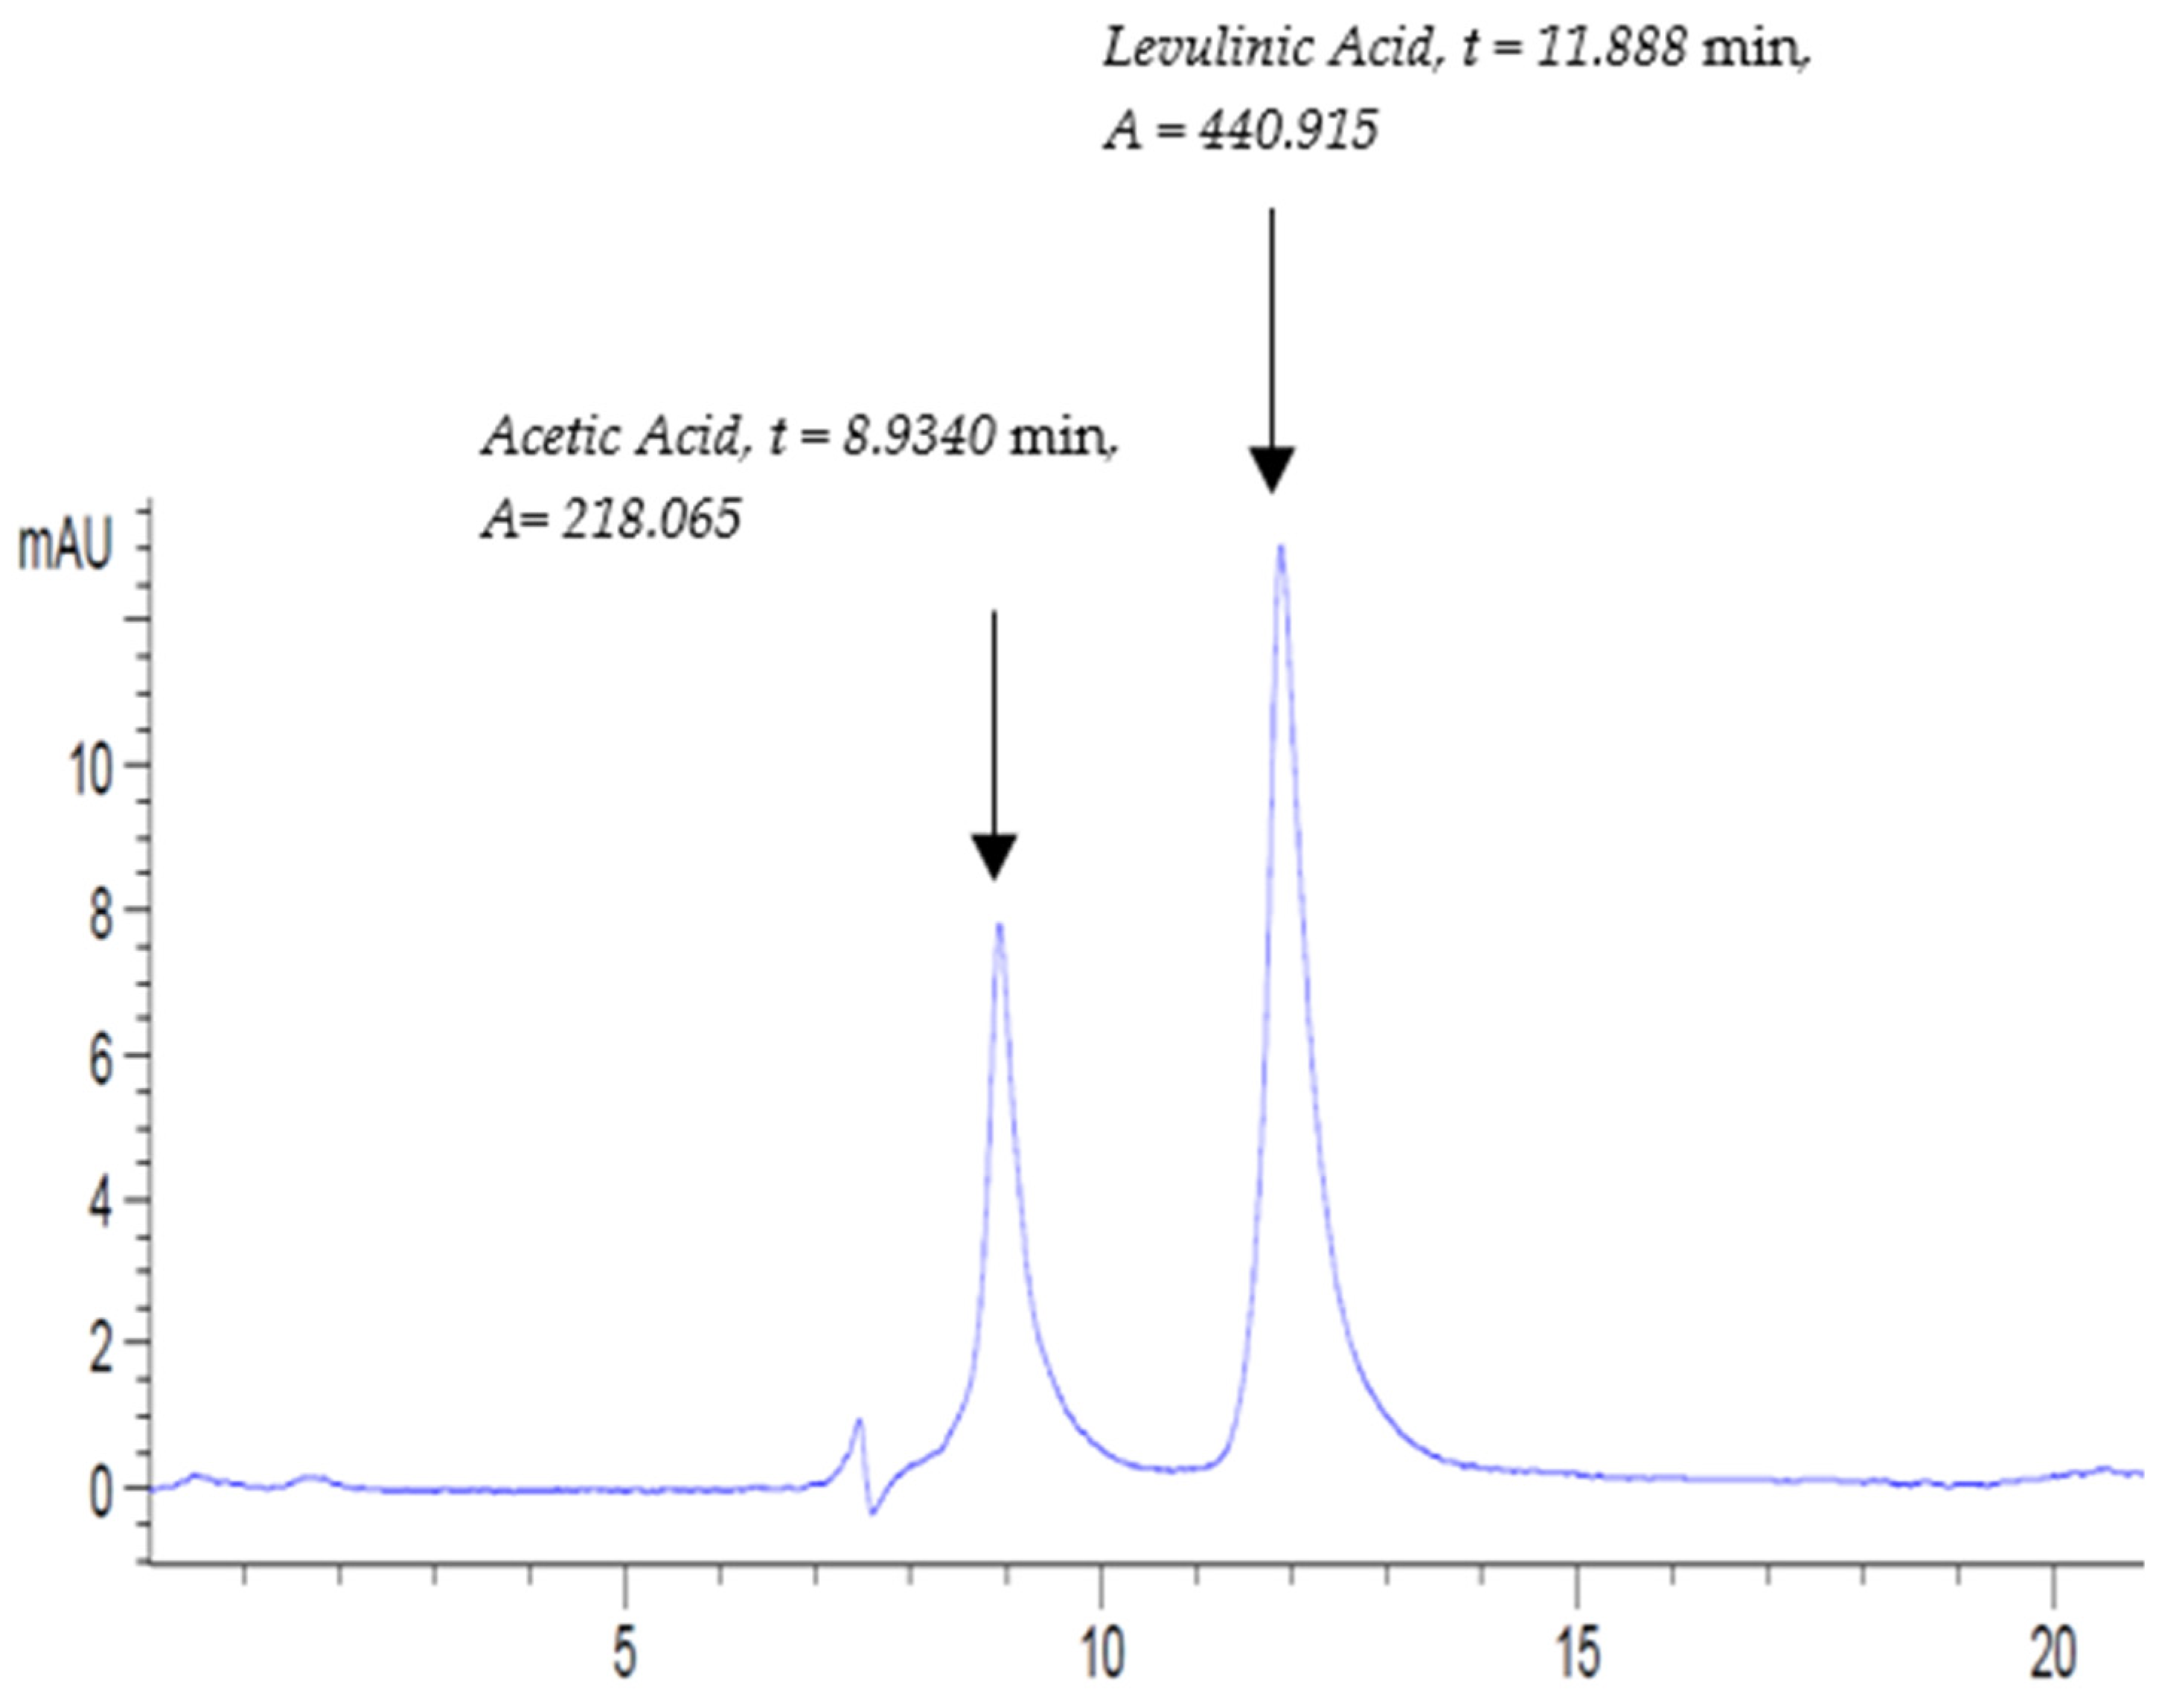
The chromatogram of ACV (A) was composed of two major peaks at retention times near 8.934 min and 11.888 min (Figure 6). In order to identify the nature of the peaks, the chromatogram of mixed standard solution STD4-Inline-ACV (A) in Figure 5 was considered. The first component eluted at 8.934 min and it corresponds to acetic acid, while the second element is relevant to the internal standard levulinic acid (Figure 6). Indeed, this chromatogram conclusively confirmed the high purity of apple cider vinegar as it constitutes only acetic acid. The chromatogram of the second sample of the duplicates of apple cider vinegar ACV (B) is included in Figure S22.
The concentrations of acetic acid and HMF in balsamic vinegar (B.VIN) were quantified using the RF of the inline mixed standard solution STD4-Inline-B.VIN (A), whereas the concentration of acetic acid in apple cider vinegar was determined using the response factor (RF) value of STD4-Inline-ACV (A) mixed standard solution. In a similar fashion, RRF was calculated using Equations (2) and (3) as done previously for pomegranate samples.
Statistics in Table 3 show a mean value and standard deviation of acetic acid concentration in balsamic vinegar of 80.3795 mg/mL and ±1.2715 mg/mL, respectively. Moreover, the average value of HMF concentration was 2.1526 mg/mL with a standard deviation of ±0.021 mg/mL (Table 3). The concentration of acetic acid of 80.380 mg/mL was equivalent to 70.011 g/kg, which was close to the composition of 63.57 ± 5.8 g/kg [34]. Also, the average HMF concentration of 2.153 ± 0.021 mg/mL, equivalent to 1909.285 mg/kg, is approximately equal to the value of 1812 ± 105 mg/kg reported by the same team [34]. The formation of HMF in balsamic vinegar is due to the thermal degradation of sugar [35,36] and is considered a sign of how optimized the production process is, with high HMF values of 3300 and 5000 mg/kg [37]. Of note is that the resulted concentration of HMF of a value of 1909.2846 mg/kg was much less than the reported values of 4035 ± 260 and 4947 ± 390 mg/kg [34]. Therefore, the HMF level marks the quality of commercial balsamic vinegars in terms of their production technique.
The analysis of apple cider vinegar (ACV) demonstrated a pure acetic acid content of 44.134 mg/mL (Table 3). This confirms the high purity written on the label of Ballyhoura™ Irish apple cider vinegar (pure raw). It was noticed that in both samples there was no presence of any other organic acid, such as lactic acid sourced from orange vinegar [38] or the tartaric acid and ethyl acetate found in wine vinegar [38]. This implies that there were no fraudulent practices conducted by adding some blends.
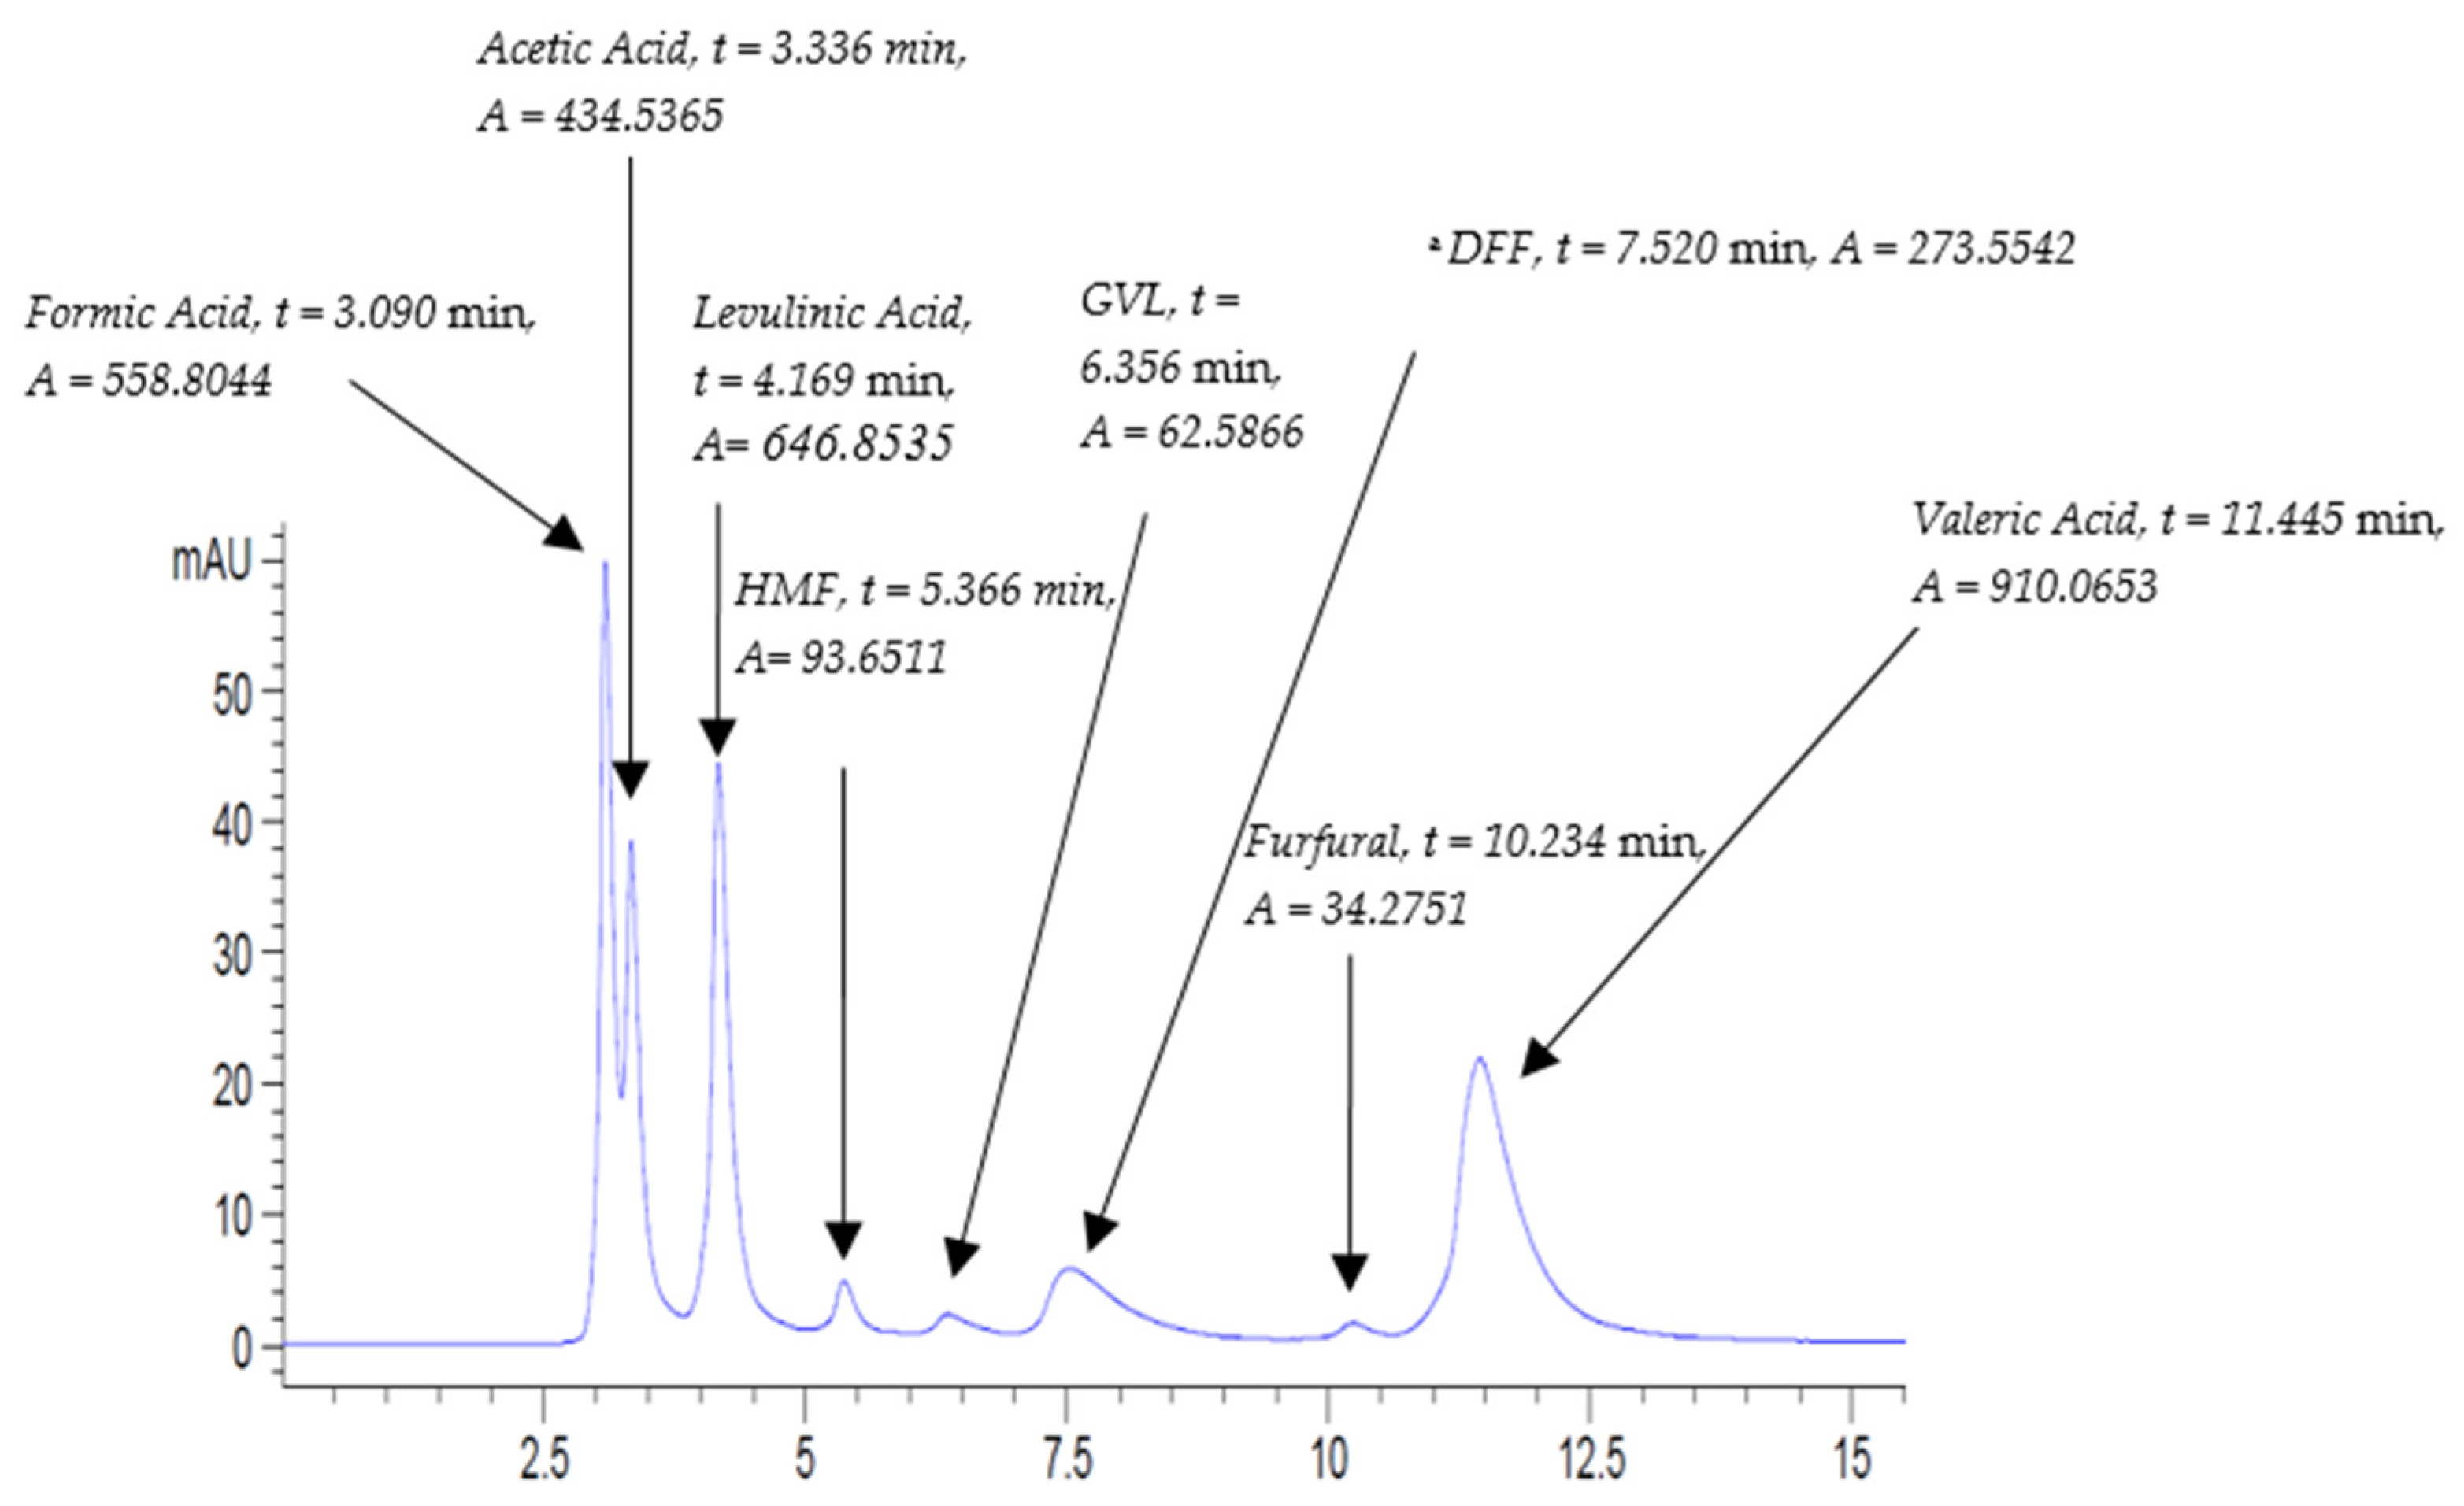
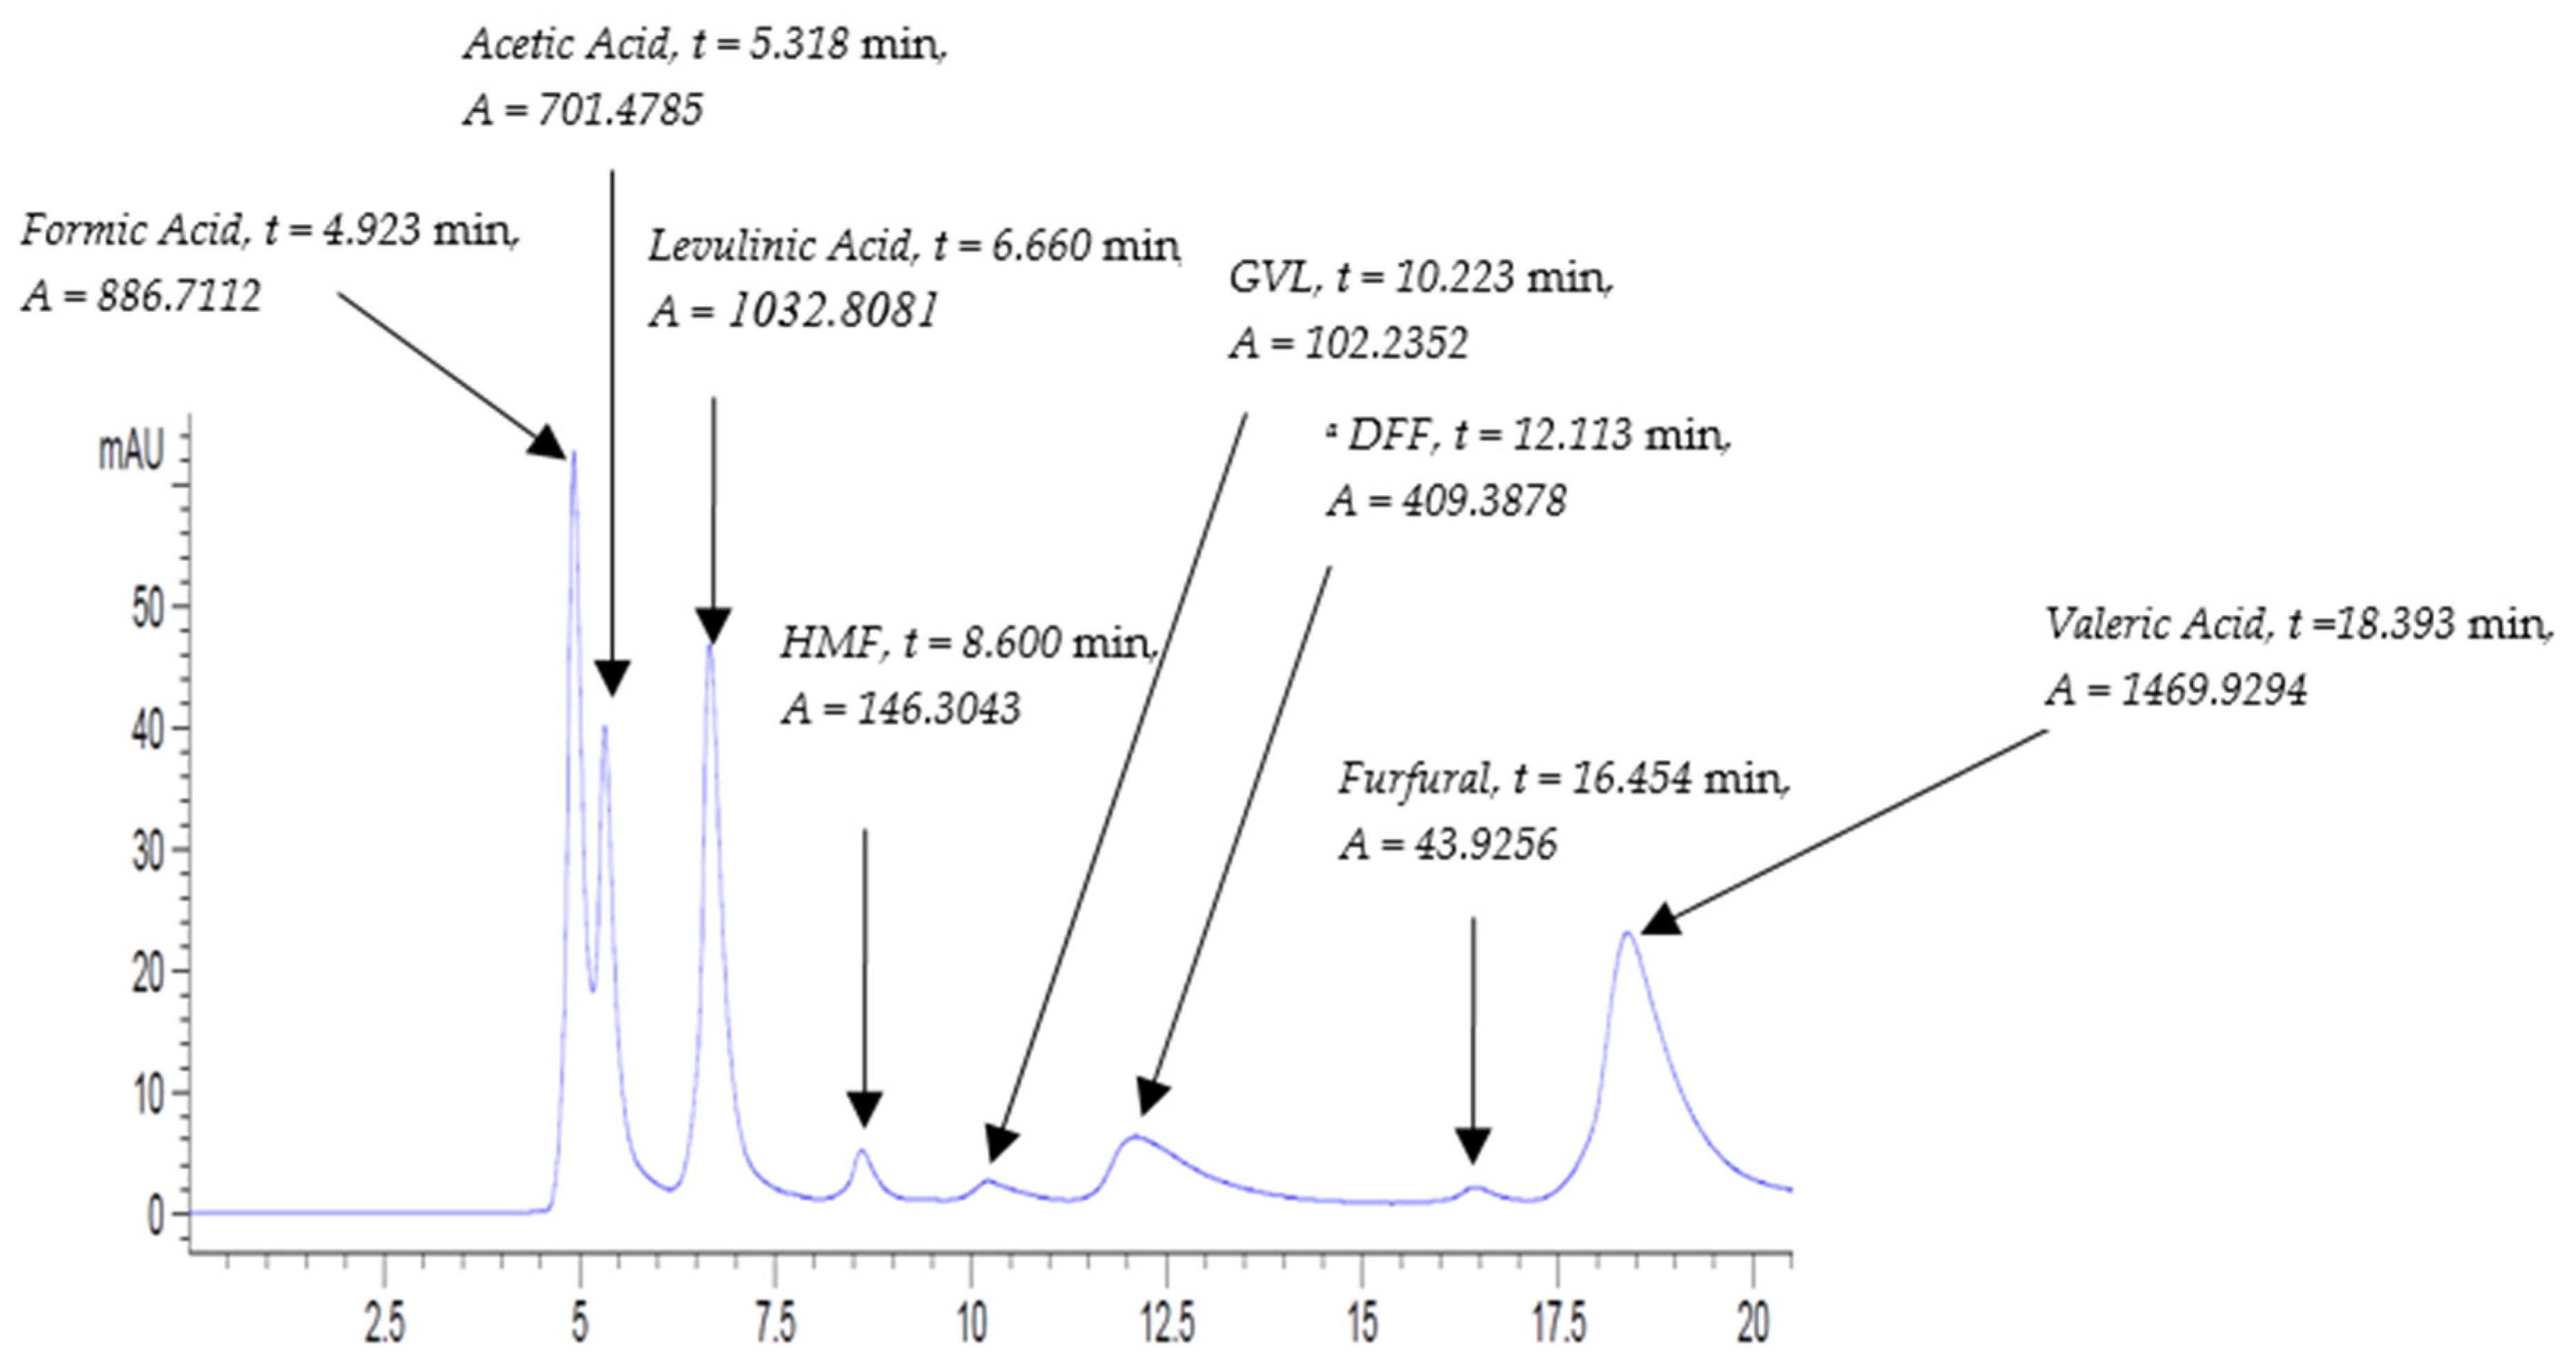
The method was also tested to detect a further variety of compounds that are involved in biomass platform reactions. Indeed, it proved an excellent ability in sensing a wide spectrum of compounds, ranging from organic acids to furans. A mix of standards was prepared and labelled as ‘Biomass’ and was run using the same method at flow rates of 0.5 mL/min and 0.8 mL/min. The chromatograms generated at 0.5 and 0.8 mL/min are shown in Figure 7 and Figure 8, respectively.
The chromatograms in Figure 7 and Figure 8 revealed a good separation of the eight peaks, where furans are completely distanced from each other. It is worth noting that peaks with higher absorbance correspond to the run of the slower flow rate of 0.5 mL/min despite the fact that all the analytes were eluted at 0.8 mL/min.
4. Conclusions
Due to the continued concerns over adulterations of commercially produced foods, finding a simple and fast HPLC method capable of determining the major organic acids and furans ingredients is considered very important. Additionally, the increasing research interest in biomass hydrolysis processing places increased emphasis on robust analytical methods for quantifying the products of hydrolysis. The simple HPLC method reported in this work provides a fast, quantitative analysis for both these tasks. The tailored method was applied to test three commercial food products: pomegranate molasses, balsamic vinegar, and apple cider vinegar. Acetic acid, citric acid, and HMF were the three main ingredients which were detected and quantified. The level of HMF composition in the tested products signifies possible fraudulent practices due to added glucose syrup. Similarly, the ability to test the purity of acetic acid in vinegar products marks the importance of developing such a chromatography technique to avoid unfair practices.
Supplementary Materials
The following supporting information can be downloaded at: https://0-www-mdpi-com.brum.beds.ac.uk/article/10.3390/beverages8010006/s1. Table S1. Organic acids & furans standards: amounts used in grams (gr) and concentrations in (mg/mL) of each individual standard; Table S2. Mix standard solutions of V = 15 mL: amounts used in grams (gr) and concentrations (mg/mL) of each individual standard; Table S3. Recipe of commercial products samples with internal standard (LA) of V = 15 mL; Table S4. Linear calibration of individual standards: 3-pts concentrations run at 0.5 mL/min mobile phase; Table S5. Linear calibration of standards in mix solutions: 3-pts concentrations run at 0.3 mL/min mobile phase; Figure S1. Formic acid standard calibration curve at mobile phase flow rate 0.5 mL/min; Figure S2. Acetic acid standard calibration curve at mobile phase flow rate 0.5 mL/min; Figure S3. Citric acid standard calibration curve at mobile phase flow rate 0.5 mL/min; Figure S4. Levulinic acid standard calibration curve at mobile phase flow rate 0.5 mL/min; Figure S5. Hydroxymethylfurfural standard calibration curve at mobile phase flow rate 0.5 mL/min; Figure S6. Gamma valerolactone standard calibration curve at mobile phase flow rate 0.5 mL/min; Figure S7. Furfural standard calibration curve at mobile phase flow rate 0.5 mL/min; Figure S8. Diformylfuran standard calibration curve at mobile phase flow rate 0.5 mL/min; Figure S9. Formic acid in mix standard solutions STD1, STD2, & STD3 calibration curve at mobile phase flow rate 0.3 ml/min; Figure S10. Citric acid in mix standard solutions STD1, STD2, & STD3 calibration curve at mobile phase flow rate 0.3 mL/min; Figure S11. HMF in mix standard solutions STD1, STD2, & STD3 calibration curve at mobile phase flow rate 0.3 mL/min; Figure S12. Formic acid in mix standard solutions STD4, STD5, & STD6 calibration curve at mobile phase flow rate 0.3 mL/min; Figure S12. Formic acid in mix standard solutions STD4, STD5, & STD6 calibration curve at mobile phase flow rate 0.3 mL/min; Figure S13. Acetic acid in mix standard solutions STD4, STD5, & STD6 calibration curve at mobile phase flow rate 0.3 mL/min; Figure S14. HMF in mix standard solutions STD4, STD5, & STD6 calibration curve at mobile phase flow rate 0.3 mL/min; Figure S15. Mix standard solution STD1 chromatogram run at UV-210 nm at conditions: flow rate: 0.3 mL/min., column temperature: 30 °C, run time: 20 min; Figure S16. Mix standard solution STD3 chromatogram run at UV-210 nm at conditions: flow rate: 0.3 mL/min., column temperature: 30 °C, run time: 20 min; Figure S17. Pomegranate molasses (Pom.B) sample chromatogram run at UV-210 nm at conditions: flow rate: 0.3 mL/min, column temperature: 30 °C, run time: 20 min; Figure S18. Standard mix solution STD4 chromatogram run at UV-210 nm at conditions: flow rate: 0.3 mL/min, column temperature: 30 °C, run time: 20 min; Figure S19. Standard mix solution STD5 chromatogram run at UV-210 nm at conditions: flow rate: 0.3 mL/min., column temperature: 30 °C, run time: 20 min; Figure S20. Standard mix solution STD6 chromatogram run at UV-210 nm at conditions: flow rate: 0.3 mL/min, column temperature: 30 °C, run time: 20 min; Figure S21. Balsamic vinegar B.VIN (B) chromatogram run at UV-210 nm at conditions: flow rate: 0.3 mL/min, column temperature: 30 °C, run time: 20 min; Figure S22. Apple cider vinegar ACV (B) chromatogram run at UV-210 nm at conditions: flow rate: 0.3 mL/min, column temperature: 30 °C, run time: 20 min.
Author Contributions
A.H.: conceptualization, investigation, formal analysis, data curation, writing—original draft, writing—review and editing, visualization; I.P.: methodology, investigation; P.I.: resources; J.J.L.: supervision. All authors have read and agreed to the published version of the manuscript.
Funding
This project is funded by the Science Foundation Ireland (SFI) under grant number 16/RC/3889.
Institutional Review Board Statement
Not Applicable.
Informed Consent Statement
Not Applicable.
Data Availability Statement
Data supporting results presented in this study are openly available in Mendeley Data at http://0-doi-org.brum.beds.ac.uk/10.17632/9pfgb67ndk.1 (accessed on 6 December 2021). Data citation: Hijazi: Ayman (2021), “AH_Organic_Acids_HPLC”, Mendeley Data, V1, doi:10.17632/9pfgb67ndk.1.
Acknowledgments
The authors express their gratitude to the Science Foundation Ireland (SFI) for funding this project.
Conflicts of Interest
The authors declare no conflict of interest. The funders had no role in the design of the study; in the collection, analyses, or interpretation of data; in the writing of the manuscript, or in the decision to publish the results.
References
- Arias, K.; Al-Resayes, S.I.; Climent, M.J.; Corma, A.; Iborra, S. From Biomass to Chemicals: Synthesis of Precursors of Biodegradable Surfactants from 5-Hydroxymethylfurfural. ChemSusChem 2013, 6, 123–131. [Google Scholar] [CrossRef]
- Bozell, J.J.; Moens, L.; Elliott, D.; Wang, Y.; Neuenscwander, G.; Fitzpatrick, S.; Bilski, R.; Jarnefeld, J. Production of levulinic acid and use as a platform chemical for derived products. Resour. Conserv. Recycl. 2000, 28, 227–239. [Google Scholar] [CrossRef]
- Derle, S.N.; Parikh, P.A. Hydrogenation of levulinic acid and γ-valerolactone: Steps towards biofuels. Biomass Convers. Biorefin. 2014, 4, 293–299. [Google Scholar] [CrossRef]
- Al-Shaal, M.G.; Calin, M.; Delidovich, I.; Palkovits, R. Microwave-assisted reduction of levulinic acid with alcohols producing γ-valerolactone in the presence of a Ru/C catalyst. Catal. Commun. 2016, 75, 65–68. [Google Scholar] [CrossRef]
- Serrano-Ruiz, J.C.; Luque, R.; Campelo, J.M.; Romero, A.A. Continuous-flow processes in heterogeneously catalyzed transformations of biomass derivatives into fuels and chemicals. Challenges 2012, 3, 114–132. [Google Scholar] [CrossRef]
- Alonso, D.M.; Wettstein, S.G.; Bond, J.Q.; Root, T.W.; Dumesic, J.A. Production of biofuels from cellulose and corn stover using alkylphenol solvents. ChemSusChem 2011, 4, 1078–1081. [Google Scholar] [CrossRef] [PubMed]
- Climent, M.J.; Corma, A.; Iborra, S. Conversion of biomass platform molecules into fuel additives and liquid hydrocarbon fuels. Green Chem. 2014, 16, 516–547. [Google Scholar] [CrossRef] [Green Version]
- Bozell, J.J.; Petersen, G.R. Technology development for the production of biobased products from biorefinery carbohydrates—the US Department of Energy’s “Top 10” revisited. Green Chem. 2010, 12, 539–554. [Google Scholar] [CrossRef]
- Hayes, D.J.; Fitzpatrick, S.; Hayes, M.H.; Ross, J.R. The biofine process–production of levulinic acid, furfural, and formic acid from lignocellulosic feedstocks. Biorefin. Ind. Processes Prod. 2006, 1, 139–164. [Google Scholar]
- Valentini, F.; Kozell, V.; Petrucci, C.; Marrocchi, A.; Gu, Y.; Gelman, D.; Vaccaro, L. Formic acid, a biomass-derived source of energy and hydrogen for biomass upgrading. Energy Environ. Sci. 2019, 12, 2646–2664. [Google Scholar] [CrossRef]
- Lange, J.P. Lignocellulose conversion: An introduction to chemistry, process and economics. Biofuels Bioprod. Biorefin. Innov. A Sustain. Econ. 2007, 1, 39–48. [Google Scholar] [CrossRef]
- Flannelly, T.; Lopes, M.; Kupiainen, L.; Dooley, S.; Leahy, J. Non-stoichiometric formation of formic and levulinic acids from the hydrolysis of biomass derived hexose carbohydrates. RSC Adv. 2016, 6, 5797–5804. [Google Scholar] [CrossRef] [Green Version]
- Müller, K.; Brooks, K.; Autrey, T. Hydrogen storage in formic acid: A comparison of process options. Energy Fuels 2017, 31, 12603–12611. [Google Scholar] [CrossRef]
- Hattori, R.; Yamada, K.; Shibata, H.; Hirano, S.; Tajima, O.; Yoshida, N. Measurement of the isotope ratio of acetic acid in vinegar by HS-SPME-GC-TC/C-IRMS. J. Agric. Food Chem. 2010, 58, 7115–7118. [Google Scholar] [CrossRef]
- Adams, M. Vinegar. In Microbiology of Fermented Foods; Springer: New York, NY, USA, 1998; pp. 1–44. [Google Scholar]
- Lopez-Garcia, R. Citric Acid. In Kirk-Othmer Encyclopedia of Chemical Technology; Wiley: New York, NY, USA, 2000; pp. 1–25. [Google Scholar]
- Penniston, K.L.; Nakada, S.Y.; Holmes, R.P.; Assimos, D.G. Quantitative assessment of citric acid in lemon juice, lime juice, and commercially-available fruit juice products. J. Endourol. 2008, 22, 567–570. [Google Scholar] [CrossRef]
- Al-Maiman, S.A.; Ahmad, D. Changes in physical and chemical properties during pomegranate (Punica granatum L.) fruit maturation. Food Chem. 2002, 76, 437–441. [Google Scholar] [CrossRef]
- Bou Ajram, D. Effect of Accelerated Aging on Total Phenolic Content, Antioxidant and Anti-Diabetic Activities of Lebanese Homemade Pomegranate Molasses with and without Addition of Glutathione. Ph.D. Thesis, Notre Dame University-Louaize, Zouk Mosbeh, Lebanon, 2021. [Google Scholar]
- Faria, A.; Calhau, C. Pomegranate in Human Health: An Overview; Bioactive Foods in Promoting Health; Elsevier: Amesterdam, The Netherlands, 2010; pp. 551–563. [Google Scholar]
- Cam, M.; Hisil, Y.; Durmaz, G. Characterisation of pomegranate juices from ten cultivars grown in Turkey. Int. J. Food Prop. 2009, 12, 388–395. [Google Scholar] [CrossRef] [Green Version]
- Viuda-Martos, M.; Fernandez-Lopez, J.; Perez-Alvarez, J. Pomegranate and its many functional components as related to human health: A review. Compr. Rev. Food Sci. Food Saf. 2010, 9, 635–654. [Google Scholar] [CrossRef] [PubMed]
- Üniversitesi, Y.D.; Dali, U.İ.A.B.; Dali, U.İ.B. Yüksek Lisans Tezi. Ph.D. Thesis, Sosyal Bilimler Enstitüsü, Kadıköy, Istanbul, 1998. [Google Scholar]
- Vardin, H.; Abbasoğlu, M. Nar ekşisi ve narın diğer değerlendirme olanakları. Geleneksel Gıdalar Sempozyumu 2004, 23, 195–196. [Google Scholar]
- Kaya, A.; Sözer, N. Rheological behaviour of sour pomegranate juice concentrates (Punica granatum L.). Int. J. Food Sci. Technol. 2005, 40, 223–227. [Google Scholar] [CrossRef]
- Krueger, D.A. Composition of pomegranate juice. J. AOAC Int. 2012, 95, 163–168. [Google Scholar] [CrossRef] [PubMed]
- El Darra, N.; Rajha, H.N.; Saleh, F.; Al-Oweini, R.; Maroun, R.G.; Louka, N. Food fraud detection in commercial pomegranate molasses syrups by UV–VIS spectroscopy, ATR-FTIR spectroscopy and HPLC methods. Food Control 2017, 78, 132–137. [Google Scholar] [CrossRef]
- Kamal, Y.; Alam, P.; Alqasoumi, S.I.; Foudah, A.I.; Alqarni, M.H.; Yusufoglu, H.S. Investigation of antioxidant compounds in commercial pomegranate molasses products using matrix-solid phase dispersion extraction coupled with HPLC. Saudi Pharm. J. 2018, 26, 839–844. [Google Scholar] [CrossRef]
- Xu, W.; Liang, L.; Zhu, M. Determination of sugars in molasses by HPLC following solid-phase extraction. Int. J. Food Prop. 2015, 18, 547–557. [Google Scholar] [CrossRef]
- Liu, X.-z.; He, Q.; Kong, X.-h.; Du, B.-z. Determination of hydroxymethylfurfural in pomegranate juice concentrates by solid phase extraction-ultra performance liquid chromatography. Sci. Technol. Food Ind. 2013, 10, 62–64. [Google Scholar]
- Lopes, M.; Dussan, K.; Leahy, J.; Da Silva, V. Conversion of d-glucose to 5-hydroxymethylfurfural using Al2O3-promoted sulphated tin oxide as catalyst. Catal. Today 2017, 279, 233–243. [Google Scholar] [CrossRef]
- İncedayi, B.; Tamer, C.E.; Çopur, Ö.U. A research on the composition of pomegranate molasses. J. Agric. Fac. Uludag Univ. 2010, 24, 37–47. [Google Scholar]
- Kus, S.; Gogus, F.; Eren, S. Hydroxymethyl furfural content of concentrated food products. Int. J. Food Prop. 2005, 8, 367–375. [Google Scholar] [CrossRef]
- Lalou, S.; Hatzidimitriou, E.; Papadopoulou, M.; Kontogianni, V.G.; Tsiafoulis, C.G.; Gerothanassis, I.P.; Tsimidou, M.Z. Beyond traditional balsamic vinegar: Compositional and sensorial characteristics of industrial balsamic vinegars and regulatory requirements. J. Food Compos. Anal. 2015, 43, 175–184. [Google Scholar] [CrossRef]
- Hillmann, H.; Mattes, J.; Brockhoff, A.; Dunkel, A.; Meyerhof, W.; Hofmann, T. Sensomics analysis of taste compounds in balsamic vinegar and discovery of 5-acetoxymethyl-2-furaldehyde as a novel sweet taste modulator. J. Agric. Food Chem. 2012, 60, 9974–9990. [Google Scholar] [CrossRef]
- Belitz, H.-D.; Grosch, W.; Schieberle, P. Food Cemistry; Springer: New York, NY, USA, 2009. [Google Scholar]
- Theobald, A.; Müller, A.; Anklam, E. Determination of 5-hydroxymethylfurfural in vinegar samples by HPLC. J. Agric. Food Chem. 1998, 46, 1850–1854. [Google Scholar] [CrossRef]
- Sobolev, A.; Circi, S.; Mannina, L. Advances in Nuclear Magnetic Resonance Spectroscopy for Food Authenticity Testing. In Advances in Food Authenticity Testing; Elsevier: Amsterdam, The Netherlands, 2016; pp. 147–170. [Google Scholar]
Figure 1.
Mixed standard solution STD2 chromatogram run at UV-210 nm at the following conditions: flow rate, 0.3 mL/min; column temperature, 30 °C; and run time, 20 min.
Figure 1.
Mixed standard solution STD2 chromatogram run at UV-210 nm at the following conditions: flow rate, 0.3 mL/min; column temperature, 30 °C; and run time, 20 min.

Figure 2.
Pomegranate molasses (POM.A) sample chromatogram run at UV-210 nm at the following conditions: flow rate, 0.3 mL/min; column temperature, 30 °C; and run time, 20 min.
Figure 2.
Pomegranate molasses (POM.A) sample chromatogram run at UV-210 nm at the following conditions: flow rate, 0.3 mL/min; column temperature, 30 °C; and run time, 20 min.

Figure 3.
Mixed standard solution STD4-Inline-B.VIN (A) chromatogram at UV-210 nm at the following conditions: flow rate, 0.3 mL/min; column temperature, 30 °C; and run time, 20 min.
Figure 3.
Mixed standard solution STD4-Inline-B.VIN (A) chromatogram at UV-210 nm at the following conditions: flow rate, 0.3 mL/min; column temperature, 30 °C; and run time, 20 min.

Figure 4.
Balsamic vinegar B.VIN(A) chromatogram at UV-210 nm at the following conditions: flow rate, 0.3 mL/min; column temperature, 30 °C; and run time, 20 min.
Figure 4.
Balsamic vinegar B.VIN(A) chromatogram at UV-210 nm at the following conditions: flow rate, 0.3 mL/min; column temperature, 30 °C; and run time, 20 min.

Figure 5.
Mixed standard solution STD4-Inline-ACV(A) chromatogram at UV-210 nm at the following conditions: flow rate, 0.3 mL/min; column temperature, 30 °C; and run time, 20 min.
Figure 5.
Mixed standard solution STD4-Inline-ACV(A) chromatogram at UV-210 nm at the following conditions: flow rate, 0.3 mL/min; column temperature, 30 °C; and run time, 20 min.

Figure 6.
Apple cider vinegar (ACV(A)) chromatogram at UV 210 nm at the following conditions: flow rate, 0.3 mL/min; column temperature, 30 °C; and run time, 20 min.
Figure 6.
Apple cider vinegar (ACV(A)) chromatogram at UV 210 nm at the following conditions: flow rate, 0.3 mL/min; column temperature, 30 °C; and run time, 20 min.

Figure 7.
Mixed standard solution ‘Biomass’ chromatogram at UV-210 nm at the following conditions: flow rate, 0.8 mL/min; column temperature, 30 °C; and run time, 15 min. a: DFF: Diformylfuran.
Figure 7.
Mixed standard solution ‘Biomass’ chromatogram at UV-210 nm at the following conditions: flow rate, 0.8 mL/min; column temperature, 30 °C; and run time, 15 min. a: DFF: Diformylfuran.

Figure 8.
Mixed standard solution ‘Biomass’ chromatogram at UV-210 nm at the following conditions: flow rate, 0.5 mL/min; column temperature, 30 °C; and run time, 20 min. a: DFF: Diformylfuran.
Figure 8.
Mixed standard solution ‘Biomass’ chromatogram at UV-210 nm at the following conditions: flow rate, 0.5 mL/min; column temperature, 30 °C; and run time, 20 min. a: DFF: Diformylfuran.


Table 1.
Executed HPLC sequence for the quantification of pomegranate molasses samples.
| Sequence Order | Sample Name |
|---|---|
| 1 | STD1 |
| 2 | STD2 |
| 3 | STD3 |
| 4 | POM.A |
| 5 | STD1-inline-POM.A |
| 6 | STD2-inline-POM.A |
| 7 | POM. B |
| 8 | STD1-inline-POM.B |
| 9 | STD2-inline-POM.B |
STD1, STD2, STD3—three different concentrations of standard mixes. POM—pomegranate molasses samples.
Table 2.
Concentrations of species in vial: Ci, vial (mg/mL), calculated concentration of species in commercial product: Ci, sample (mg/mL), and RRF (relative response factor) of each species based on LA (levulinic acid) (ISD—internal standard): RRFi.
Table 2.
Concentrations of species in vial: Ci, vial (mg/mL), calculated concentration of species in commercial product: Ci, sample (mg/mL), and RRF (relative response factor) of each species based on LA (levulinic acid) (ISD—internal standard): RRFi.
| Sample Name | Ccitric, Vial (mg/mL) | Ccitric, Sample (mg/mL) | %Citric Acid (g/g Molasses) | RRFCitric | CHMF, Vial (mg/mL) | CHMF, Sample (mg/mL) | %HMF (g/g Molasses) | RRFHMF |
|---|---|---|---|---|---|---|---|---|
| POM. (A) | 1.948 | 121.656 | 8.814% | 6.315 * | 0.176 | 10.970 | 0.795% | 34.116 * |
| POM. (B) | 2.004 | 125.1936 | 9.070% | 6.451 ** | 0.189 | 11.794 | 0.854% | 32.099 ** |
| Standard Deviation (mg/mL) | ±0.040 | ±2.502 | - | - | ±0.009 | ±0.582 | - | - |
* Calculated by Equation (2). ** Calculated by Equation (3). POM—pomegranate molasses samples. HMF—hydroxymethyl furfural.
Table 3.
Concentrations of species in vial: Ci,vial (mg/mL), calculated concentration of species in commercial product: Ci,sample (mg/mL), and relative response factor (RRF) of each species based on LA (ISD): RRFi.
Table 3.
Concentrations of species in vial: Ci,vial (mg/mL), calculated concentration of species in commercial product: Ci,sample (mg/mL), and relative response factor (RRF) of each species based on LA (ISD): RRFi.
| Sample | Cacetic, Vial (mg/mL) | Cacetic, sample (mg/mL) | %Acetic Acid (g/g Sample) | RRFacetic | CHMF, vial (mg/mL) | CHMF, sample (mg/mL) | %HMF (g/g Sample) | RRFHMF |
|---|---|---|---|---|---|---|---|---|
| B.VIN (A) | 1.547 | 79.480 | 7.001% | 1.888 * | 0.044 | 2.168 | 0.191% | 31.330 * |
| B.VIN (B) | 1.582 | 81.279 | 7.159% | 1.878 ** | 0.044 | 2.138 | 0.188% | 31.166 ** |
| Standard Deviation (mg/mL) | ±0.025 | ±1.272 | - | - | ±0.0004 | ±0.021 | - | - |
| ACV (A) | 0.939 | 44.384 | 4.249% | 1.922 * | - | - | - | - |
| ACV (B) | 0.928 | 43.884 | 4.201% | 1.930 ** | - | - | - | - |
| Standard Deviation (mg/mL) | ±0.008 | ±0.354 | - | - | - | - | - | - |
* Calculated by Equation (2). ** Calculated by Equation (3). POM—pomegranate molasses samples. HMF—hydroxymethyl furfural.
Publisher’s Note: MDPI stays neutral with regard to jurisdictional claims in published maps and institutional affiliations. |
© 2022 by the authors. Licensee MDPI, Basel, Switzerland. This article is an open access article distributed under the terms and conditions of the Creative Commons Attribution (CC BY) license (https://creativecommons.org/licenses/by/4.0/).
Share and Cite
MDPI and ACS Style
Hijazi, A.; Pisano, I.; Illek, P.; Leahy, J.J. A Rapid HPLC Method for the Simultaneous Determination of Organic Acids and Furans: Food Applications. Beverages 2022, 8, 6. https://0-doi-org.brum.beds.ac.uk/10.3390/beverages8010006
AMA Style
Hijazi A, Pisano I, Illek P, Leahy JJ. A Rapid HPLC Method for the Simultaneous Determination of Organic Acids and Furans: Food Applications. Beverages. 2022; 8(1):6. https://0-doi-org.brum.beds.ac.uk/10.3390/beverages8010006
Chicago/Turabian StyleHijazi, Ayman, Italo Pisano, Paulina Illek, and James J. Leahy. 2022. "A Rapid HPLC Method for the Simultaneous Determination of Organic Acids and Furans: Food Applications" Beverages 8, no. 1: 6. https://0-doi-org.brum.beds.ac.uk/10.3390/beverages8010006
Note that from the first issue of 2016, this journal uses article numbers instead of page numbers. See further details here.