
Analysis of Retronasal Flavor Alterations in Smoke-Affected Wines and the Efficacy of Various Inter-Stimulus Rinse Protocols in Clearing Smoke-Related Attributes


Abstract
:
1. Introduction
2. Materials and Methods
2.1. Panelists
2.2. Reference Just-About-Right (JAR)
2.3. Standard In-Person Panel Procedures
2.4. Panel Screening
2.5. Panel Training
2.6. Fixed Time-Point Evaluation
2.7. Data Analysis
3. Results
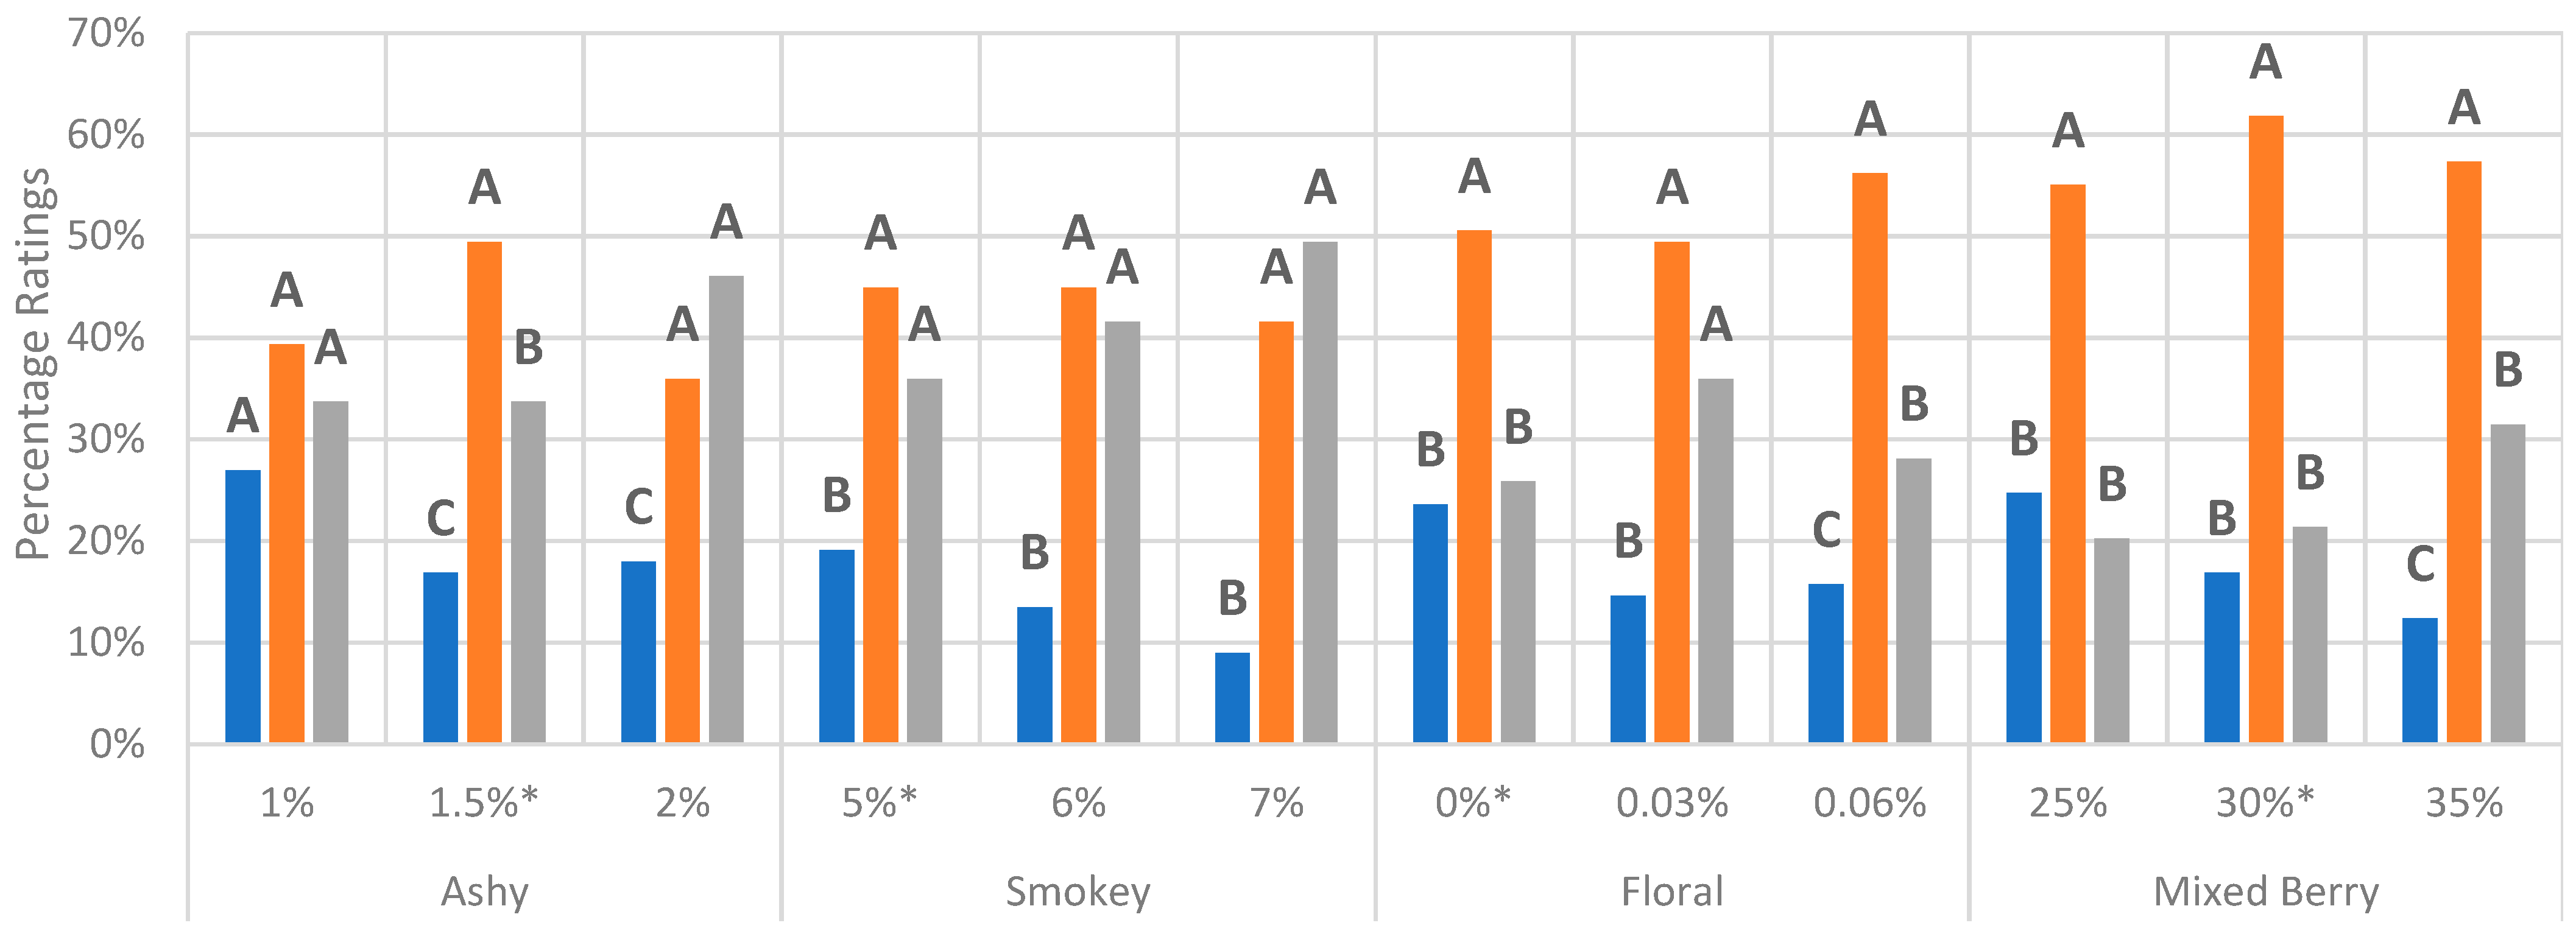
3.1. Reference JAR
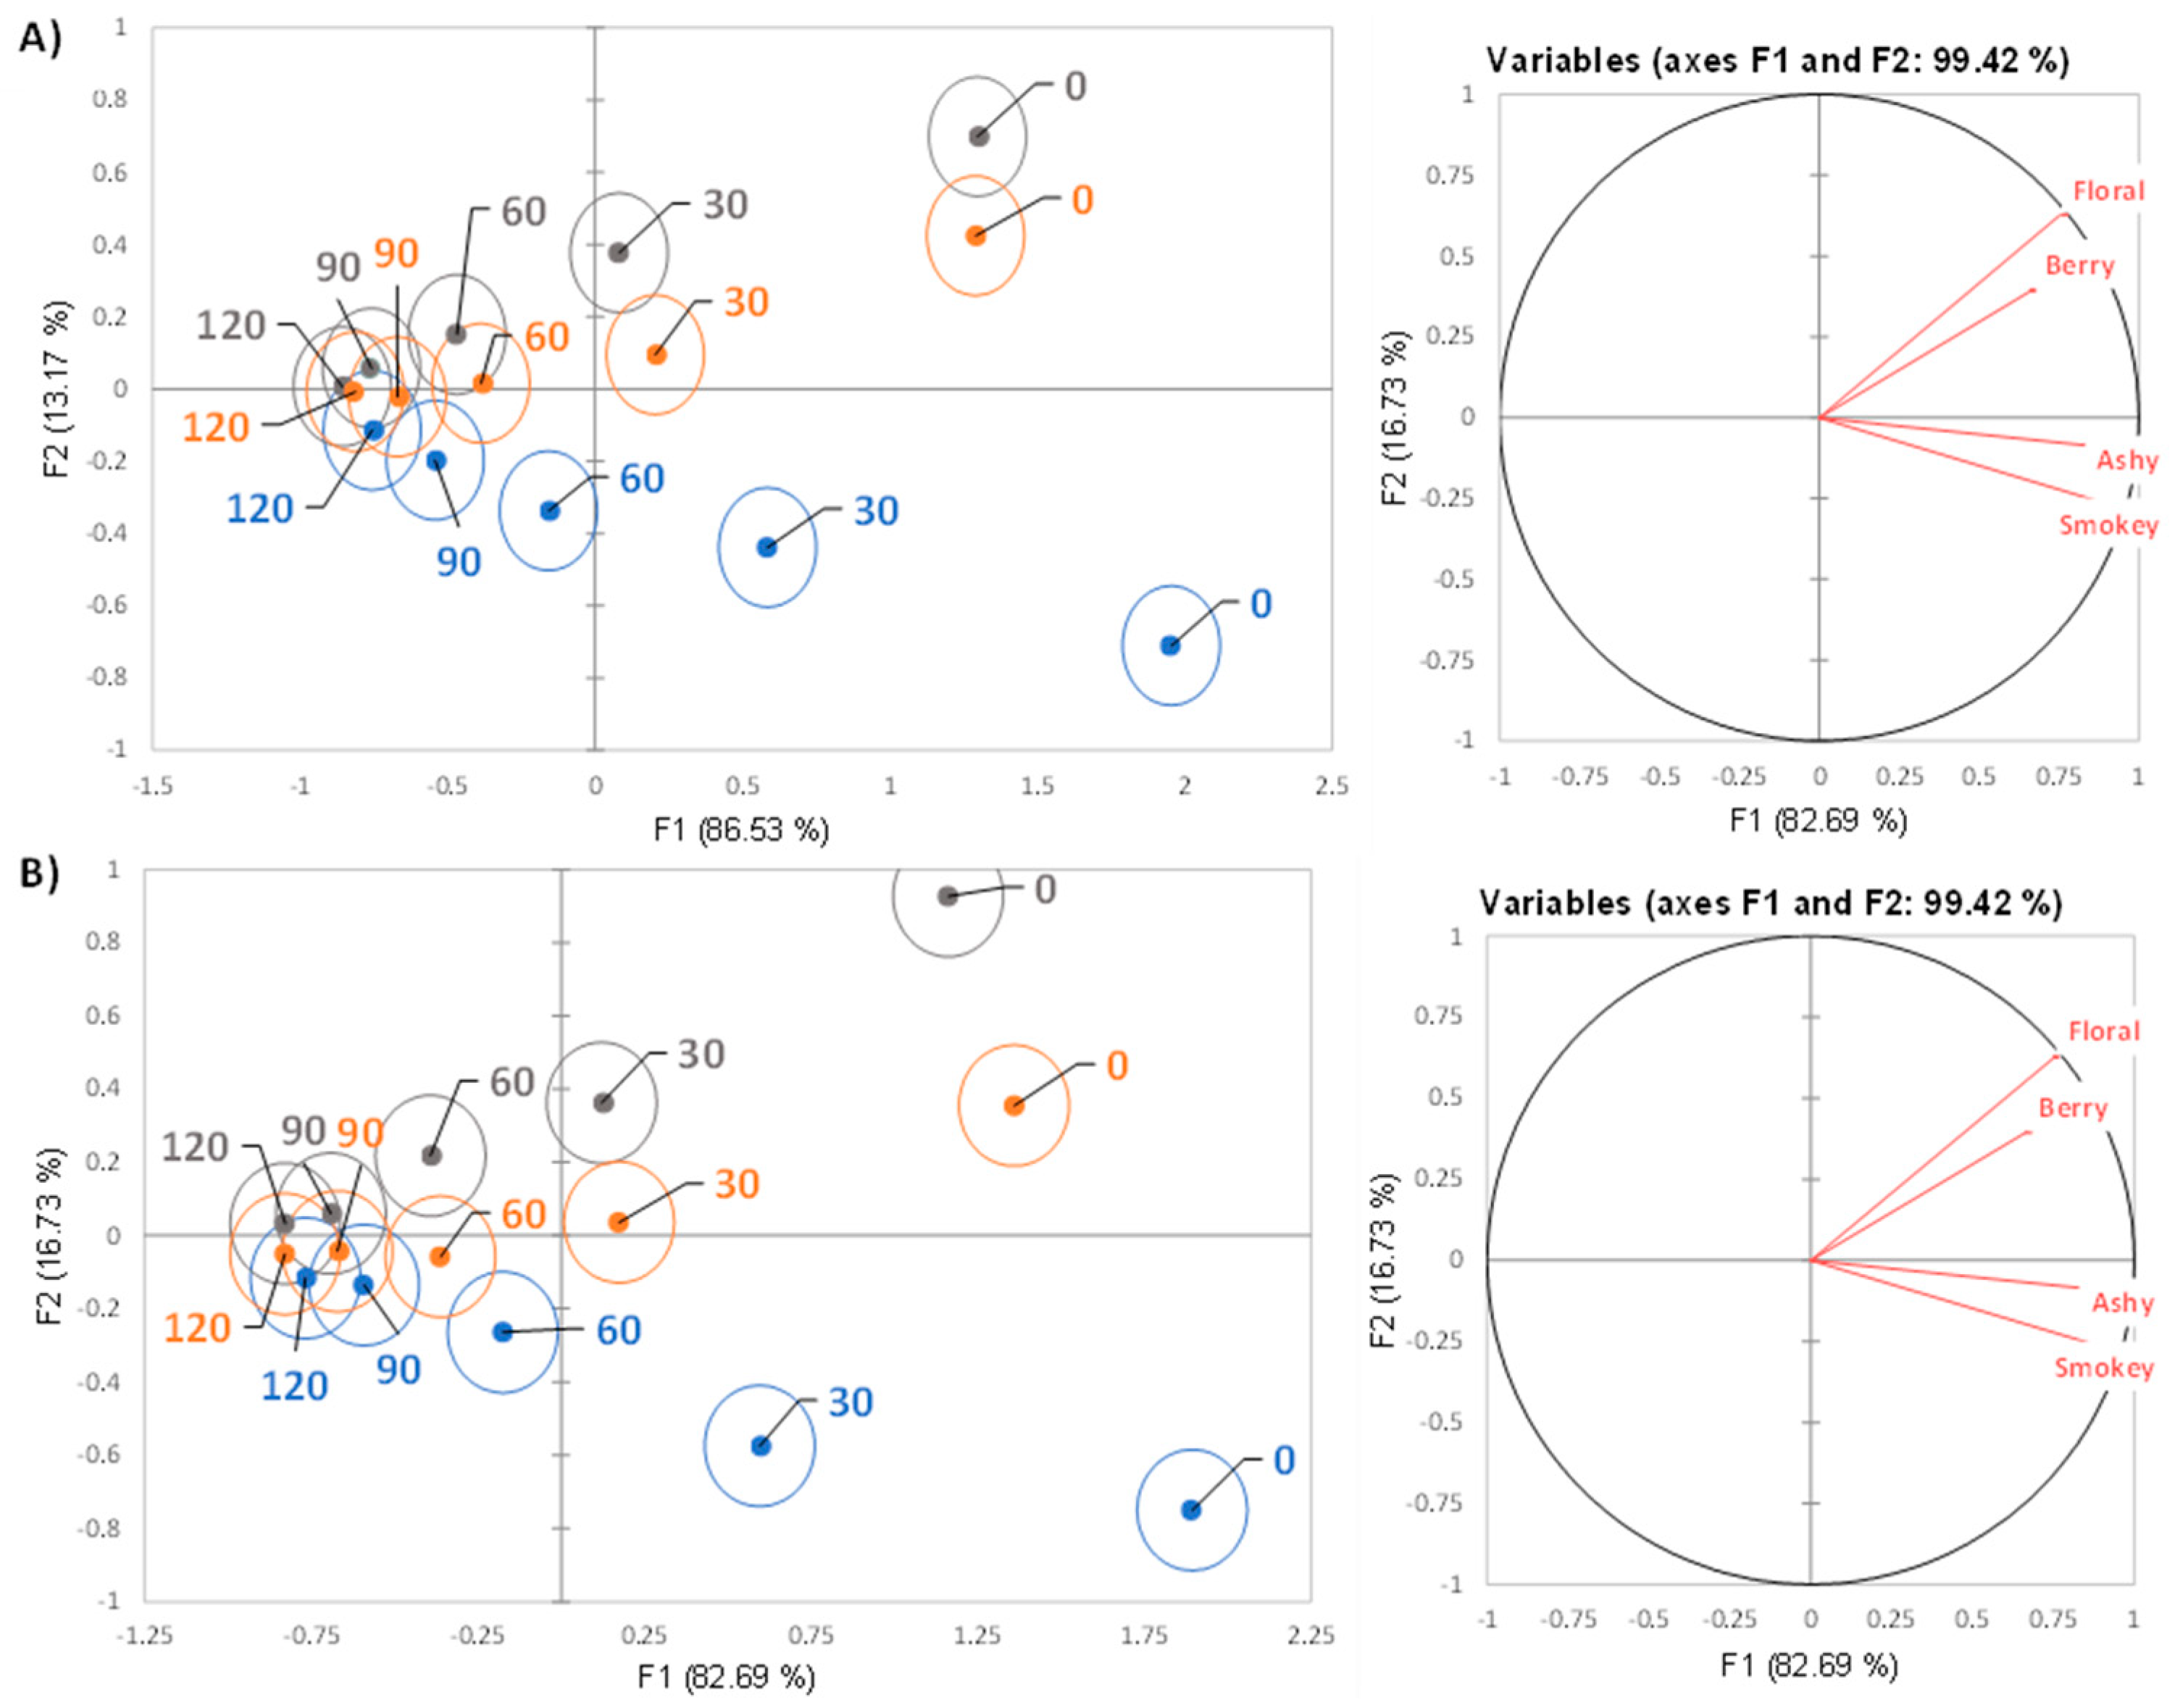
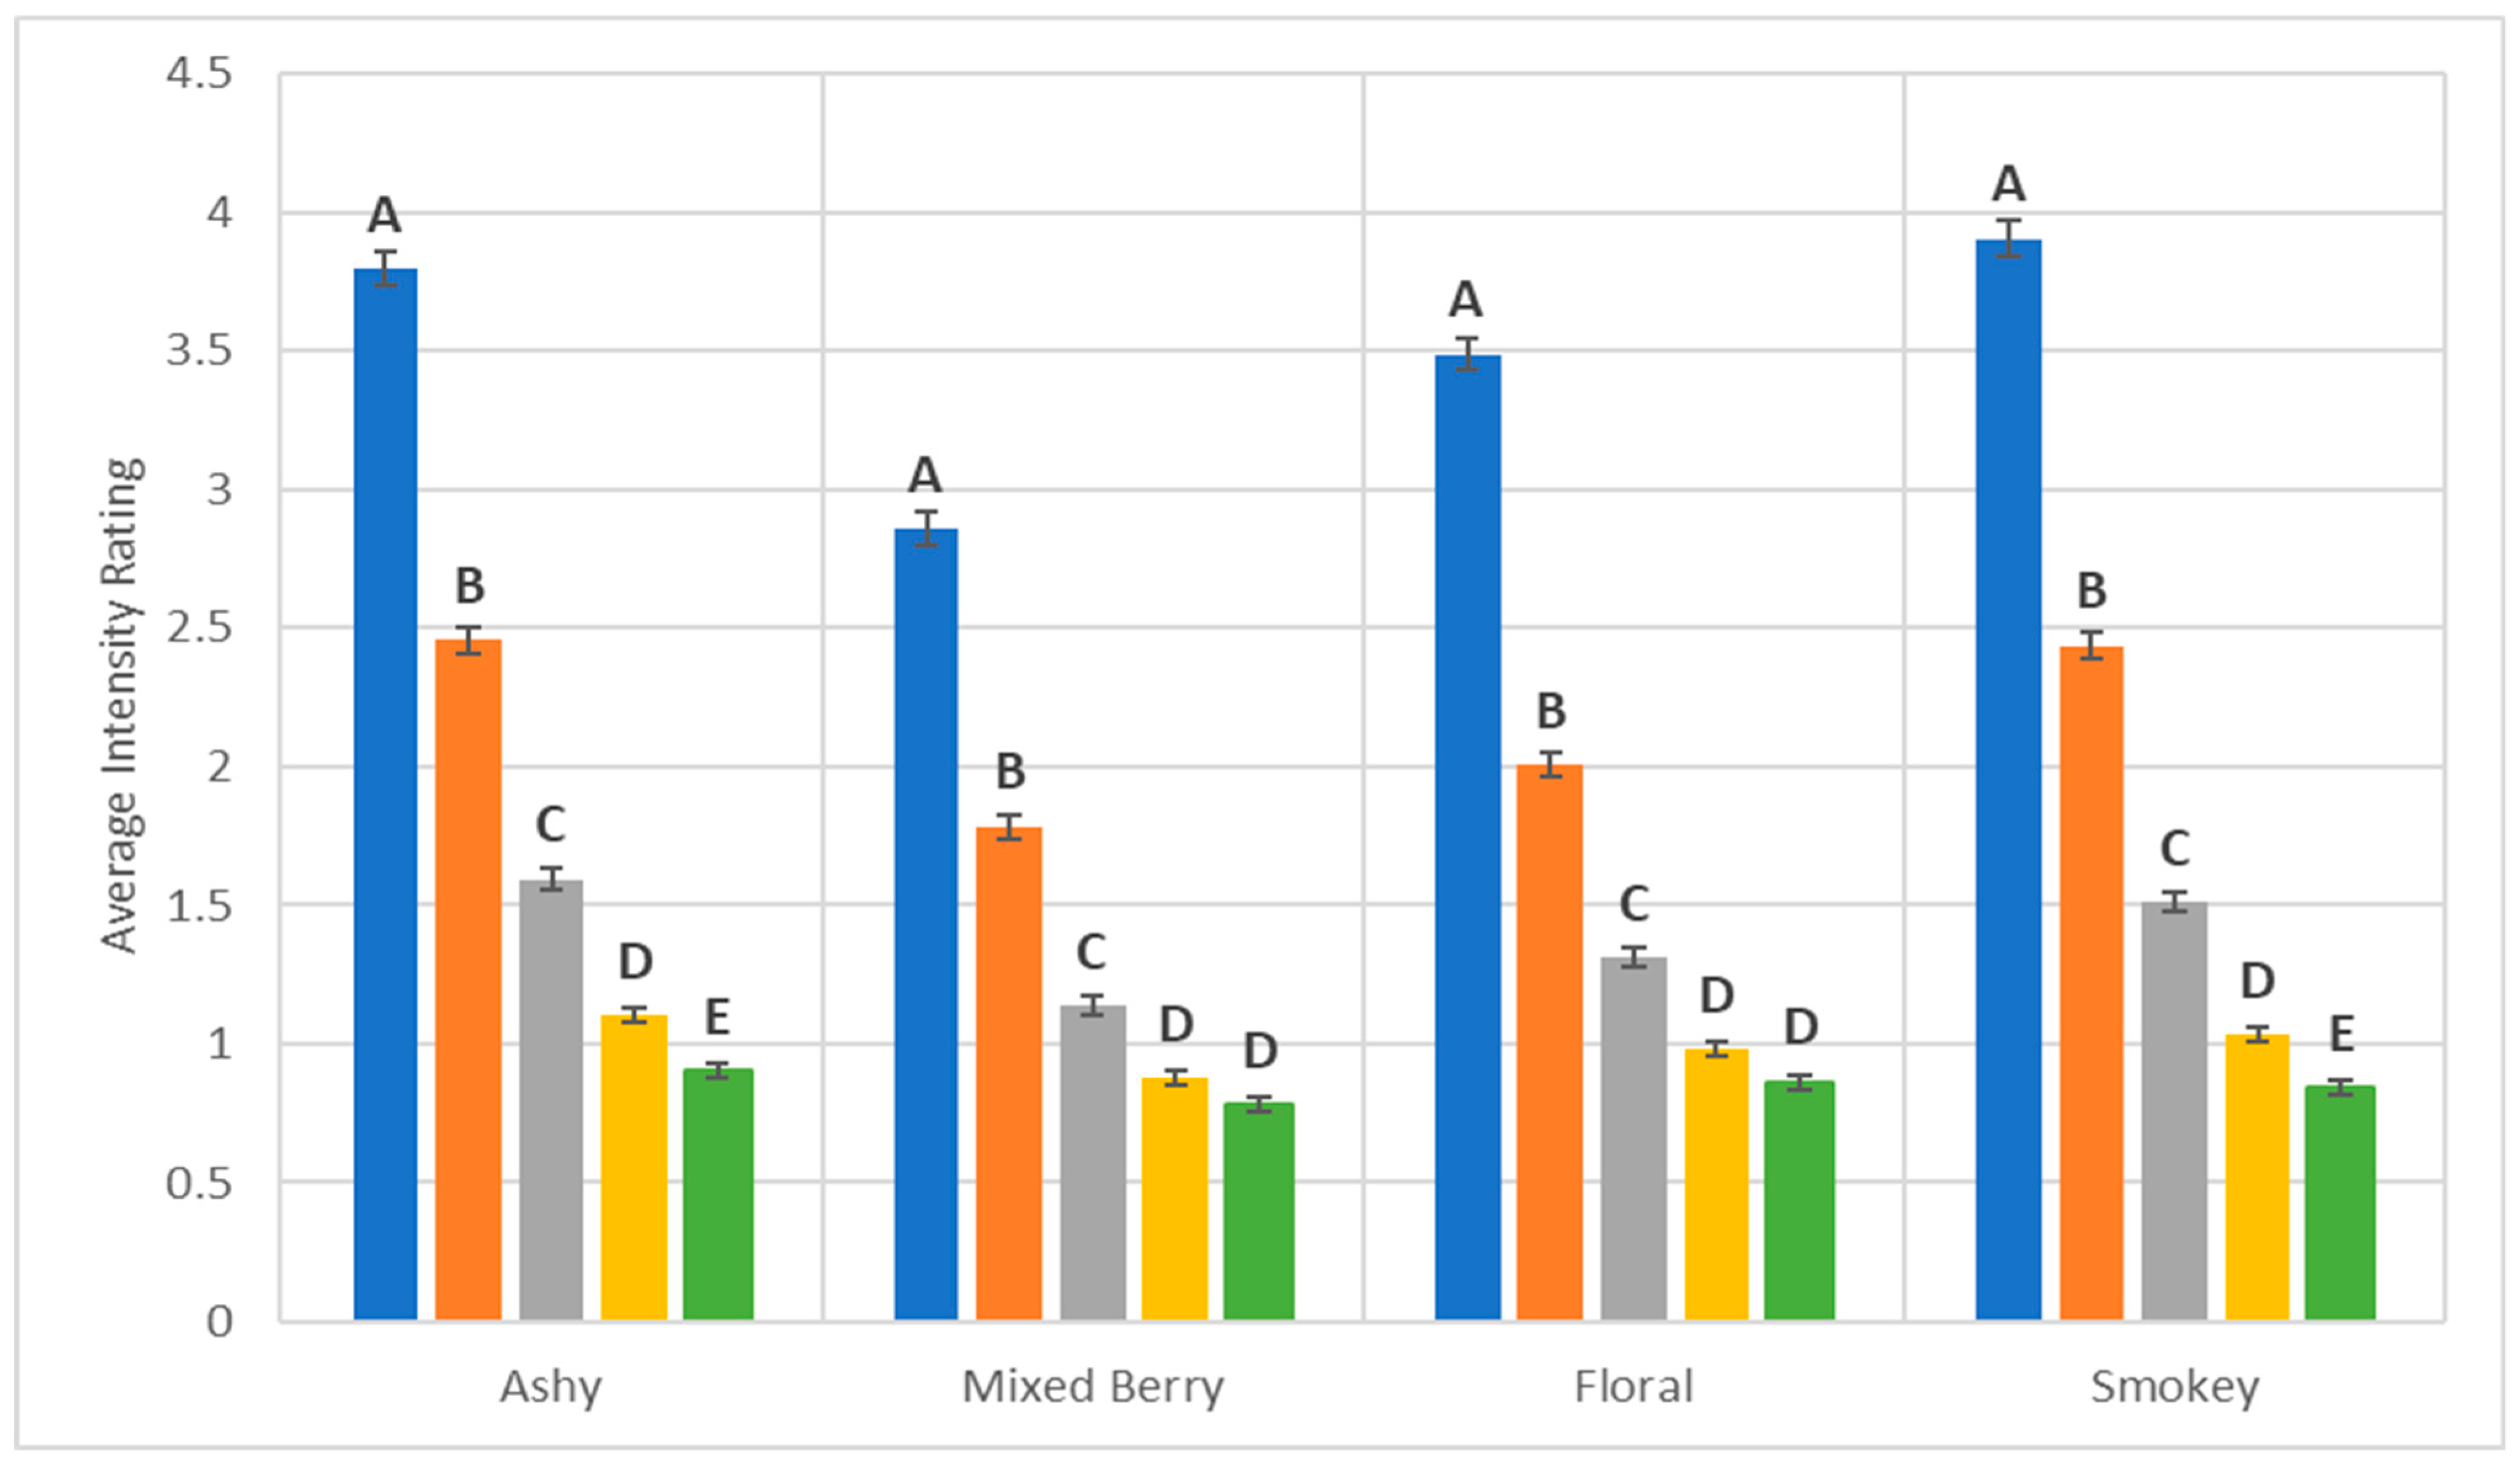
3.2. Fixed Time Point (FTP) Evaluation
4. Discussion
4.1. JAR and Reference Evaluation
4.2. Evaluation of Rinses
5. Conclusions
Supplementary Materials
Author Contributions
Funding
Institutional Review Board Statement
Informed Consent Statement
Acknowledgments
Conflicts of Interest
References
- Toth, L.; Wittkowski, R. Das Räuchern-Aus Der Sicht Der Chemie. Chenie Unserer Zeit 1985, 24–29. [Google Scholar]
- Hensel Flavor Tracking: Where Are They Now? Available online: https://www.ift.org/news-and-publications/blog/2020/flavor-trends (accessed on 11 October 2021).
- Høj, D.M.; Pillarisetti, A.; Smith, K.R.; Seto, E. The Australian Wine Research Institute Annual Report; The Australian Wine Research Institute: Urrbrae, SA, Australia, 2003. [Google Scholar]
- Simoneit, B.R.T. Biomass Burning—A Review of Organic Tracers for Smoke from Incomplete Combustion. Appl. Geochem. 2002, 17, 129–162. [Google Scholar] [CrossRef]
- Summerson, V.; Gonzalez Viejo, C.; Pang, A.; Torrico, D.D.; Fuentes, S. Review of the Effects of Grapevine Smoke Exposure and Technologies to Assess Smoke Contamination and Taint in Grapes and Wine. Beverages 2021, 7, 7. [Google Scholar] [CrossRef]
- Wasserman, A.E. Organoleptic Evaluation of Three Phenols Present in Wood Smoke. J. Food Sci. 1966, 31, 1005–1010. [Google Scholar] [CrossRef]
- Krstic, M.P.; Johnson, D.L.; Herderich, M.J. Review of Smoke Taint in Wine: Smoke-Derived Volatile Phenols and Their Glycosidic Metabolites in Grapes and Vines as Biomarkers for Smoke Exposure and Their Role in the Sensory Perception of Smoke Taint. Aust. J. Grape Wine Res. 2015, 21, 537–553. [Google Scholar] [CrossRef]
- Prida, A.; Chatonnet, P. Impact of Oak-Derived Compounds on the Olfactory Perception of Barrel-Aged Wines. Am. J. Enol. Vitic. 2010, 61, 408–413. [Google Scholar]
- Kennison, K.R.; Wilkinson, K.L.; Pollnitz, A.P.; Williams, H.G.; Gibberd, M.R. Effect of Smoke Application to Field-Grown Merlot Grapevines at Key Phenological Growth Stages on Wine Sensory and Chemical Properties. Aust. J. Grape Wine Res. 2011, 15, 228–237. [Google Scholar] [CrossRef]
- Jiang, W.; Parker, M.; Hayasaka, Y.; Simos, C.; Herderich, M. Compositional Changes in Grapes and Leaves as a Consequence of Smoke Exposure of Vineyards from Multiple Bushfires across a Ripening Season. Molecules 2021, 26, 3187. [Google Scholar] [CrossRef]
- Hayasaka, Y.; Baldock, G.A.; Parker, M.; Pardon, K.H.; Black, C.A.; Herderich, M.J.; Jeffery, D.W. Glycosylation of Smoke-Derived Volatile Pheols in Grapes as a Consequence of Grapevine Exposure to Bushfire Smoke. J. Agric. Food Chem. 2010, 58, 10989–10998. [Google Scholar] [CrossRef]
- Parker, M.; Osidacz, P.; Baldock, G.A.; Hayasaka, Y.; Black, C.A.; Pardon, K.H.; Jeffery, D.W.; Geue, J.P.; Herderich, M.J.; Francis, I.L. Contibution of Several Volatile Phenols and Their Glycoconjugates to Smoke-Related Sensory Properties of Red Wine. J. Agric. Food Chem. 2012, 60, 2629–2637. [Google Scholar] [CrossRef]
- Mayr, C.M.; Parker, M.; Baldock, G.A.; Black, C.A.; Pardon, K.H.; Williamson, P.O.; Herderich, M.J.; Francis, I.L. Determination of the Importance of In-Mouth Release of Volatile Phenol Glycoconjugates to the Flavor of Smoke-Tainted Wines. J. Agric. Food Chem. 2014, 62, 2327–2336. [Google Scholar] [CrossRef] [PubMed]
- Ferris, S.J.; Kempton, R.A.; Muir, D.D. Carryover in Sensory Trials. Food Qual. Prefer. 2013, 14, 299–304. [Google Scholar] [CrossRef]
- Ball, R.D. Incomplete Block Design for the Minimisation of Order and Carry-over Effects in Sensory Analysis. Food Qual. Prefer. 1997, 8, 111–118. [Google Scholar] [CrossRef]
- Colonna, A.E.; Adams, D.O.; Noble, A.C. Comparison of Procedures for Reducing Astringency Carry-over Effects in Evaluation of Red Wines. Aust. J. Grape Wine Res. 2008, 10, 26–31. [Google Scholar] [CrossRef]
- Torrico, D.D.; Jirangrat, W.; Want, J.; Chompreeda, P.; Sriwattana, S.; Prinyawiwatkul, W. Novel Modeling Approaches to Characterize and Quantify Carryover Effects in Sensory Acceptability. Foods 2018, 7, 186. [Google Scholar] [CrossRef] [PubMed] [Green Version]
- Lucak, C.L.; Delwiche, J.F. Efficacy of Various Palate Cleansers with Representative Foods. Chem. Percept. 2009, 2, 32–39. [Google Scholar] [CrossRef]
- Fryer, J.A.; Collins, T.S.; Tomasino, E. Evaluation of Different Interstimulus Rinse Protocol on Smoke Attribute Perception in Wildfire-Affected Wines. Molecules 2021, 26, 5444. [Google Scholar] [CrossRef]
- Jaffe, T.R.; Wang, H.; Chambers IV, E. Determination of a Lexicon for the Sensory Flavor Attributes of Smoked Food Products. J. Sens. Stud. 2017, 32, e12262. [Google Scholar] [CrossRef]
- Koppel, K.; Chambers IV, E. Development and Application of a Lexicon to Describe the Flavor of Pomegranate Juice. J. Sens. Stud. 2010, 25, 819–837. [Google Scholar] [CrossRef]
- Rozin, P. “Taste-Smell Confusions” and the Duality of the Olfactory Sense. Percept. Psychophys. 1982, 3, 397–401. [Google Scholar] [CrossRef] [Green Version]
- Hannum, M.E.; Fryer, J.A.; Simons, C.T. Non-Food Odors and the Duality of Smell: Impact of Odorant Delivery Pathway and Labeling Convention on Olfactory Perception. Physiol. Behav. 2021, 238, 113480. [Google Scholar] [CrossRef] [PubMed]
- Kennison, K.R.; Wilkinson, K.L.; Pollnitz, A.P.; Williams, H.G.; Gibberd, M.R. Effect of Timing and Duration of Grapevine Exposure to Smoke on the Composition and Sensory Properties of Wine. Aust. J. Grape Wine Res. 2009, 15, 228–237. [Google Scholar] [CrossRef]
- Kelly, D.; Zerihun, A. The Effect of Phenol Composition on the Sensory Profile of Smoke Affected Wines. Molecules 2015, 20, 9536–9549. [Google Scholar] [CrossRef] [Green Version]
- Perez-Jimenez, M.; Chaya, C.; Pozo-Bayon, M.A. Individual Differences and Effect of Phenolic Compounds in the Immediate and Prolonged In-Mouth Aroma Release and Retronasal Aroma Intensity during Wine Tasting. Food Chem. 2019, 285, 147–155. [Google Scholar] [CrossRef] [PubMed] [Green Version]
- Food and Agriculture Organization of the United Nations. Specification of Flavors; Online Edition; Food and Agriculture Organization of the United Nations: Quebec City, QC, Canada, 2022. [Google Scholar]
- Pivk, U.; Ulrih, N.P.; Juillerat, M.-A.; Raspor, P. Assessing Lipid Coating of the Human Oral Cavity after Ingestion of Fatty Foods. J. Agric. Food Chem. 2008, 56, 507–511. [Google Scholar] [CrossRef] [PubMed]
- Furlan, A.L.; Jobin, M.-L.; Pianet, I.; Dufourc, E.J.; Gean, J. Flavanol/Lipid Interaction: A Novel Molecular Perspective in the Description of Wine Astringency & Bitterness and Antioxidant Action. Tetrahedron 2015, 71, 3143–3147. [Google Scholar]
- Kuusk, S.; Valjamae, P. When Substrate Inhibits and Inhibitor Activates: Impliations of Beta-Glucosidases. Biotechnol. Biofuels 2017, 10, 1–15. [Google Scholar] [CrossRef] [Green Version]


| Attribute | Definition | Samples |
|---|---|---|
| Ashy | Dry, dusty, dirty aroma associated with the residual of burnt products, e.g., a day-old campfire a | 20% v/v ash solution in water |
| 15% v/v ash solution in water * | ||
| 10% v/v ash solution in water | ||
| Floral | Sweet, light, slightly perfumy impression associated with all flowers b | 0.06% v/v violet extract c in floral solution |
| 0.03% v/v violet extract c in floral solution | ||
| Floral solution * | ||
| Mixed Berry | Sweet, sour, sometimes dark aromas associated with a variety of berries, such as blackberries, strawberries, raspberries, currants, etc. b | 35% w/v mixed berry preserves in water |
| 30% w/v mixed berry preserves in water * | ||
| 25% w/v mixed berry preserves in water | ||
| Smokey | Sweet, brown, pungent, acrid, slightly charred/burnt aroma associated with woodfire smoke a | 7% v/v whiskey in water |
| 6% v/v whiskey in water | ||
| 5% v/v whiskey in water * |
| Rinse | Preparation |
|---|---|
| Pectin solution | Powdered pectin (Modernist Pantry, Eliot, ME, USA) suspended in distilled water using an immersion blender (Mueller Austria Ultra-Stock, City of Industry, CA, USA) at a concentration of 1 g/L. |
| Ethanol solution | Dilution of 95% grain alcohol (Luxco, St. Louis, MO, USA) in distilled water to a 7% v/v concentration. |
| Lipid solution | Dilution of liquid medium-chain triglycerides (Stepan Specialty Products LLC, Maywood, NJ, USA) suspended in a 10% ethanol solution a using an immersion blender (Mueller Austria Ultra-Stock, City of Industry, CA, USA) at a concentration of 10 g/L. |
| Glucose solution | Dextrose (NOW Foods, Bloomingdale, IL, USA) fully dissolved in distilled water at a concentration of 4 g/L. |
| Smoke Attributes | Non-Smoke Attributes | |||
|---|---|---|---|---|
| Ashy | Smokey | Floral | Mixed Berry | |
| Rinse | ** | ^ | ** | ^ |
| Time | *** | *** | *** | *** |
| Wine | *** | *** | *** | *** |
| Rinse*Time | NS | ^ | NS | NS |
| Wine*Time | *** | *** | *** | * |
Publisher’s Note: MDPI stays neutral with regard to jurisdictional claims in published maps and institutional affiliations. |
© 2022 by the authors. Licensee MDPI, Basel, Switzerland. This article is an open access article distributed under the terms and conditions of the Creative Commons Attribution (CC BY) license (https://creativecommons.org/licenses/by/4.0/).
Share and Cite
Fryer, J.A.; Tomasino, E. Analysis of Retronasal Flavor Alterations in Smoke-Affected Wines and the Efficacy of Various Inter-Stimulus Rinse Protocols in Clearing Smoke-Related Attributes. Beverages 2022, 8, 23. https://0-doi-org.brum.beds.ac.uk/10.3390/beverages8020023
Fryer JA, Tomasino E. Analysis of Retronasal Flavor Alterations in Smoke-Affected Wines and the Efficacy of Various Inter-Stimulus Rinse Protocols in Clearing Smoke-Related Attributes. Beverages. 2022; 8(2):23. https://0-doi-org.brum.beds.ac.uk/10.3390/beverages8020023
Chicago/Turabian StyleFryer, Jenna A., and Elizabeth Tomasino. 2022. "Analysis of Retronasal Flavor Alterations in Smoke-Affected Wines and the Efficacy of Various Inter-Stimulus Rinse Protocols in Clearing Smoke-Related Attributes" Beverages 8, no. 2: 23. https://0-doi-org.brum.beds.ac.uk/10.3390/beverages8020023