Article

Foam Characteristics and Sensory Analysis of Arabica Coffee, Extracted by Espresso Capsule and Moka Methods

by
Giovanna Lomolino
*,
Valentina Dal Zotto
,
Stefania Zannoni
and
Alberto De Iseppi
Department of Agronomy, Food, Natural Resources, Animals, and Environment (DAFNAE), University of Padua, Viale dell’Università 16, 35020 Padova, Italy
*
Author to whom correspondence should be addressed.
Submission received: 27 March 2022 / Revised: 20 April 2022 / Accepted: 26 April 2022 / Published: 5 May 2022
(This article belongs to the Special Issue Coffee and Related Chemical Analysis)

Abstract

:
The coffee extraction methods modify the structure of the foam (when it is present) and the sensory profile of the beverage. In this research, three ways of extracting and two varieties of 100% Arabica were compared. Nineteen bars and fifteen bars were applied to the coffee thanks to the use of compatible capsules and machines. The method with the moka was considered, which acts at low pressures and does not allow the formation of foam (crema). In addition, the Brazil and Guatemala Arabica varieties were considered to understand the extent to which Arabica coffee can respond in structural and sensorial terms to the extraction techniques applied. The results show that 19-bar espresso coffees have a very stable crema with very small bubbles, which give a uniform and fine structure to the coffee crema. On the contrary, the pressure at 15 bars generates more unstable foams and bubbles that tend to be disproportionate, with more marked effects in the Brazil variety. The sensory profiles of the coffees respond to the extraction techniques applied. While the coffee extracted with the moka has sensory descriptors with rather low values, those obtained at 19 and 15 bars have much wider profiles. In conclusion, different pressure intensities to the coffee extraction affect the quality of crema and the solubilization of organoleptically active compounds.

1. Introduction

Coffee is one of the most consumed beverages in the world, and its preparation (brewing and extraction methods) changes according to geographical, social, and cultural contexts as well as personal preferences. The beverage has specific qualitative characteristics related to smell, taste, color, and structure [1]. In general, the flavor of a cup of coffee represents the final expression and sensory response to a long process of transformation [2].
The preparation of coffee, in the solid–liquid extraction process, involves: (1) water absorption by ground coffee; (2) the soluble solids transferred into the hot water; and (3) separation of the extract from the exhausted solids. Many factors combine to modify and diversify the coffee beverage, including the contact time between the water and the ground coffee, the water temperature, and the pressure during extraction [3].
There are many methods of coffee extraction, and consumer choice is guided by factors such as culture, lifestyle, and flavor preference [4]. Espresso is the most popular method among those that use pressure. The term “espresso” indicates that the coffee is freshly prepared and must be tasted immediately in order to not lose all the aromatic notes retained by the layer of crema, which is 2–3 mm thick. Espresso is the best-known method of preparation and consumption of coffee in Italy and has spread worldwide. In fact, the fame of this “made in Italy” art has spread all over the world and so much so that every day, it is estimated that 50 million cups of espresso are consumed in the world. The preparation of this beverage is a mix of “ritual and technique”, which must follow precise rules for success of final beverage, as the consumer of espresso coffee is very demanding. In fact, for the preparation of the “perfect espresso”, the attention begins with the choice of high-quality green coffee, the time of roasting, continues with blending of different coffee, the direct grinding, and ends with the extraction [5]. The espresso is obtained by passing a jet of hot water with temperatures around 92 °C, at a high pressure of 9 atm, through a layer of 6.5–7 g of coffee, pressed with a force ranging from 15 to 24 kg. The percolation lasts about 25–30 s (5 of pre-infusion and 25 of the actual spill), and thus, the hot and high-pressure water filtering into the ground coffee “cake” dissolves both lipophilic and hydrophilic substances; this allows to obtain a hazelnut-colored crema on the surface with a compact and resistant structure with a thickness of a few millimeters (in Robusta, it can also increase) corresponding to about 10% of the total volume of the beverage. The total volume of the served beverage is around 30 mL.
The crema itself represents a characteristic of espresso coffee [6]; it has been extensively studied from a physical, chemical, and formation point of view [7]. The crema/foam improves the release of the aroma in the first moments of extraction and influences the dynamics of sensory perception during the sips [8]. In fact, the foam structure is responsible for the release kinetics of volatile odorous compounds through physico-chemical interactions [9]. Furthermore, the visual appearance of the foam could affect the sensory and hedonic expectations during the consumption of the beverage. The presence of crema differentiates espresso from other extraction methods; furthermore, in the context of espresso coffee, the crema can vary its characteristics depending on the coffee blend and the type of extraction machine, which affect the amount of crema, color, and fineness and size of the bubbles. Therefore, the study of the crema/foam in an espresso coffee can be of interest, as it can anticipate the sensory properties and modulate the perception of the product [10].
Among other methods of preparing espresso coffee, capsules systems have attracted consumer interest and gained the market because they are user-friendly and simulate the preparation of bar espresso. This system preserves the quality of the ground coffee by protecting it from humidity and oxidative processes [11]. The capsule is a small, rigid container, which can be made of aluminum or plastic, in which ground coffee powder is sealed. To keep the coffee stable over time inside the small container and thus prevent it from oxidizing, the product is packaged in a protective atmosphere, and some manufacturers make self-protected capsules. The capsules are then closed hermetically with multiple layers of microfilm in aluminum or other material, which can ensure resistance and maintenance of the aroma. When the capsule is inserted into the special machine, a pointed needle pierces the microfilm, allowing water to enter the capsule at high pressure (the pressure varies from the type of machine used), thus pushing it onto the coffee powder. Furthermore, the quality of the espresso coffee obtained with the capsules depends on the extraction conditions, which differ depending on the machines used. The quantities of coffee present in a capsule are not standard but vary by type and manufacturer: for example, Nespresso® are the smallest capsules, with only 5 g of coffee; instead, the Nescafé® Dolce Gusto® has 7 g of powder.
Another method of extraction of coffee widespread especially in Italy is the moka. A moka machine is made up of three pieces: a lower boiler where the water is inserted, a funnel filter where the ground coffee is placed, and the upper part, which is the the collector: a container screwed and sealed with a rubber gasket to the boiler. In the moka, the pressure of the steam is generated in the boiler, which is heated by an external heat source; thanks to this, the boiling water rises, passing through the coffee powder in the filter and through a tube, called the column, allowing the beverage to flow into the collector. The coffee obtained with the moka usually has a typical taste and aroma, which, however, unlike the classic espresso, loses the surface foam due to a lower extraction pressure. The temperature that the water in the boiler reaches during boiling is around 110 °C, and the contact time between water and coffee is about 1–2 min. The pressure that is reached inside the moka in order to push the beverage out is about 1 atm [12].
In addition to the extraction methods mentioned here, there are others that are different in terms of extraction process, grams of coffee, quantity of water, and grain size of ground coffee. Many studies have compared different extraction techniques and described the chemical-physical characteristics and the sensory profiles of the coffee obtained [13,14].
Behind the world of coffee, a large, increasingly articulated, and complex business system has developed in Italy and abroad, and its consumption and production are placed between tradition and innovation.
Times have changed for espresso, too. Hectic lifestyles and lack of time require ever faster and more comfortable systems for preparing coffee without sacrificing the quality and pleasure that espresso gives.
In recent years, in Italy, the growth of the domestic market for single-portion coffee has been approximately 5.8% more than in previous years, especially with a significant increase in the e-commerce channel and with greater growth for aluminum capsules compared to paper pods or capsules. The companies engaged in such production in Italy are numbered more than 500. The companies, which have also chosen to include this product in their catalog, work mainly in the production of capsules compatible with the most popular systems. Even if coffee and its preparation methods remain linked to a question of choice due to liking and culture, internationally, in recent years, there has been a spread of coffee in capsules and compatible machines [12].
The purpose of this work is to compare three types of coffee extraction: two modes of espresso extraction with the use of capsules and coffee machines that operate at different pressures and the method of extraction with the moka. These ways of preparing coffee, which are part of Italian culture, are now present all over the world. Furthermore, the possibility of quickly obtaining an espresso coffee at home, like that of the bar thanks to the technology of the extraction machines and capsules, has allowed a notable diffusion of espresso coffee also in other geographical regions and cultures. However, the type of coffee extraction machines, the pressure during extraction, and the type of coffee could change the characteristics of the espresso crema prepared with the capsules and, in general, the sensory perception of the beverage.
For this reason, the purpose of this research is to compare two different coffees, namely 100% Arabica that is produced in Brasile and Guatemala and processed in the same company and extracts with capsules compatible with Nespresso® and Dolce Gusto® and with the moka. The crema/foam of the two espresso coffees (moka coffee does not have foam), and the sensory profiles of the coffees, obtained with the three extraction methods, were studied.

2. Material and Methods

2.1. Coffee Samples

For this research, two mono-origins of 100% Arabica were chosen.
Guatemala—Genuine Antigua. This variety grows in Guatemala, precisely in the Antigua region, in Central American countries most suited to the production of coffee thanks also to the volcanic soil that makes this land ideal for plant growth. The plantations are located at high altitudes above 1600 m, ideal for the cultivation of Arabica coffee, which is the species most produced in Guatemala. After harvesting, this coffee undergoes a wet treatment, and therefore, it is a “washed coffee”.
Brazil—Santos Cerrado. This Arabica coffee is defined as natural; in fact, the processing of the beans is carried out with the dry method, which is the most used raw coffee treatment method in Brazil. It is grown in Brazil, the largest coffee producer in the world, in the Cerrado area, in the state of Minas Gerais, at 800 m altitude.

2.2. Coffee Preparation

The coffees were prepared by espresso methods with compatible capsules and by moka. The capsules used were all supplied by Caffè Carraro Spa. Two different kinds of capsules compatible with two different systems were used: those compatible with Nespresso®,* and those compatible with Nescafé® Dolce Gusto®,*. The coffee capsules used for Nespresso and Nescafé Dolce Gusto had a slightly different shape.
Nespresso®-compatible Capsules: Coffee content in the capsules is 5 g. Nespresso® Carraro-compatible capsules are packaged in a protective atmosphere and are self-protected.
Nescafé® Dolce Gusto®-compatible Capsules: The coffee content in the capsules is 7 g. The capsules compatible with the Nescafé® Dolce Gusto® system are packaged in a protective atmosphere, and they are not self-protected but are placed inside a hermetically sealed and protective bag.
The coffee for the extraction with the moka was supplied by Caffè Carraro Spa. The coffee used is specific for the use of the moka pot.
Two capsule coffee devices were used to extract the coffee, namely one for the Nespresso® system and the other for the Nescafé® Dolce Gusto® system, as follows: Inissia En80.B, DēLonghi® (for Nespresso® system): extraction pressure 19 bar; Piccolo KP100, Krups® (for Nescafé® Dolce Gusto® system): extraction pressure 15 bar.
The moka used for the extraction of coffee is the Moka Express 3 cups, Bialetti Industrie S.p.a®
The glasses used for the panel test were 33 cl and made of hard and transparent plastic with a smooth surface.
The abbreviations of coffee samples are as follows: N (Nespresso®); G (Guatemala); DG (Dolce Gusto®); M (moka); B (Brasile). The coffee extracted (coffee beverage samples), according to the variety of Arabica and extraction method, were as follows:
  • NG (Nespresso® Guatemala)
  • DGG (Dolce Gusto® Guatemala)
  • MG (Moka Guatemala)
  • NB (Nespresso® Brazil)
  • DGB (Dolce Gusto® Brazil)
  • MB (Moka Brazil).
To standardize the tests, commercially available water was used. It presents the following composition: HCO3 (309 mg/L), Ca2+ (47.1 mg/L), Mg+ (28.5 mg/L), SiO2 (17.9 mg/L), NO3 (9 mg/L), Na (6.2 mg/L), SO42- (4.2 mg/L), Cl (2.1 mg/L), K+ (1 mg/L); pH 7.5. The water used for the extraction of coffees was Natural Mineral Water (Fonte Guizza®, Donato, Italy).

2.3. Foam (Crema) Analysis

The espresso coffee samples were studied for the foam characteristics and persistence. For each coffee evaluated, the thickness of the crema was measured in a 25 mL graduated cylinder after extraction. The measurement was repeated every minute for ten minutes. The same test was repeated three times. Furthermore, for those coffees in which the crema was still present at ten minutes, a fourth test was performed to evaluate the total persistence.
The foams were observed by means of a Stereomicroscope ZEISS LUMAR.V12 at 80× magnification. A total of 1 mL of the foam of espresso coffee was taken soon after extraction and placed on a glass support. The images of foam were acquired and processed by using the Axio Vision software (version 4.8.2; Zeiss, Oberkochen, Germany). that allows to measure the diameter of the bubbles. For each proof, 5 images were acquired, and 150 bubbles’ diameters were considered. Each diameter was measured individually on each bubble, and software showed its size. Every test was carried out in triplicate (3 individual proofs, 450 bubbles in total).
The data were used to calculate the Sauter coefficient d32. For wet foam with n number of bubbles of individual bubble size di, the d32 is typically given by
d 32 = i = 1 k n i   d i 3 i = 1 k n i   d i 2
The Sauter mean diameter, also called surface area mean (d32), is defined as the mean diameter of the bubbles as obtained from the ratio of the third and second moments of the diameter of all bubbles in foam [15].
Furthermore, coffee foam was studied by sensory test (see below).
As there was no crema in the samples extracted with the moka, the analysis did not include the two coffees extracted with this system.

2.4. Sensory Analysis

Fourteen trained panelists (8 females and 6 males) of 25–35 years old and who are highly trained evaluators for coffee beverages were involved in sensory profiling of coffee by Quantitative Descriptive Analysis (QDA®); the test was carried out in the sensory analysis laboratory at 21 °C and under artificial white light. The sensory panel for quantitative descriptive analysis considered 11 parameters as follows: crema (the thickness of the foam); texture of crema (the foam grain); smell (the intensity of the direct smell); the tastes sour, sweet, and bitter; the balance (how balanced are the taste parameters); body (the density of the coffee); astringency (feeling of dryness and roughness in the mouth); aroma (smell intensity retro-nasally); and persistence of aroma (how long the aroma lasts in the mouth). Assessors rated each attribute using a discontinuous scale from 0 to 10. The data were acquired by Fizz software (Biosystèmes, Couternon, France). Tests were carried out in three different days and always in the morning.
The order of sample presentation was balanced across the assessors and replicates. Each sample was prepared blindly, without the panels knowing before tasting what type of coffee was being served. The coffee volume of the coffee samples was set at 20 mL. Each glass was marked with a number established before the test (three-digit random number). Each coffee was prepared and served at 75 °C, individually, as proposed by Labbe et al. (2016) [10], in order to ensure a constant temperature across coffee. The assessors had to wait 5 min between one sample and another and were required to eat unsalted crackers and rinse their mouths with water.

2.5. Statistical Analysis

Data were statistically processed by Excel 2016 (Microsoft Corporation, Redmond, WA, USA), Origin 2018 Graphing and Analysis (OriginLab Corporation, Northampton, MA, USA) and Statgraphics Centurion XVI (StatPoint Technologies Inc., Warrenton, VA, USA). A descriptive statistical study using box plots (diameter of foam bubbles) and spider plots (sensory parameters) was conducted; an analysis of variance (ANOVA) was applied for inferential study. Tukey test, HSD (p < 0.05) (sensory parameters data) [3], (diameters of foam bubbles) was applied. Principal component analysis (PCA) was applied to identify patterns and structures on the sensory parameters: texture of crema, smell, sour, sweet, bitter, the balance, body, astringency, aroma, and persistence of aroma and the three coffee methods of extraction. For the descriptive analysis, attributes receiving a score < 1.0 for all samples were not included in the PCA. To perform the image analysis, about 30 bubbles diameters for each image were measured. All the foaming tests were carried out in triplicate (three individual proofs); in each proof, 150 bubbles were considered.

3. Results and Discussion

Coffee production is constantly evolving in terms of agronomic techniques, selection of new varieties that adapt to different climatic conditions, and expressing optimal organoleptic characteristics. Moreover, different varieties of Arabica respond differently to the treatments of the drupes in post-harvest, showing their best characteristics, according to the technology applied: “natural coffee” and “washed coffee”. The two varieties discussed here represent new varietal selections, which correspond to new Arabica coffee crus. The results obtained by the three extraction methods of coffee are reported below.

3.1. Crema Analysis

It is well-known that the foam stability and texture represent a very important qualitative parameter in espresso coffee both when it is prepared at the bar, thanks to high-pressure coffee machines, and when it is obtained by means of devices that use capsules. For this reason, the stability, visual perception, and size of bubbles in espresso coffees obtained through the two extrusion methods at 19 bar (Nespresso®, N) and 15 bar (Dolce Gusto®, DG) in the presence of capsules were studied. The same coffee selections extracted through the moka did not show foam (due to the low pressure of the water vapor), so they were not considered in this phase of the research.
The coffee foam is a thick layer of very small gas bubbles consisting of water vapor due to the percolation process and carbon dioxide that is formed with the Maillard reaction during coffee roasting [16]. Coffee foam, texture, and persistence play a very important role in qualitative and sensorial terms in espresso coffee even if the factors that influence the formation and stability of the foam are still unclear [17]. Coffee foam is a dynamic and unstable system, which tends to collapse after a short time. In this study, the observation of the persistence and thickness of the foam collar was carried out for 10 min.
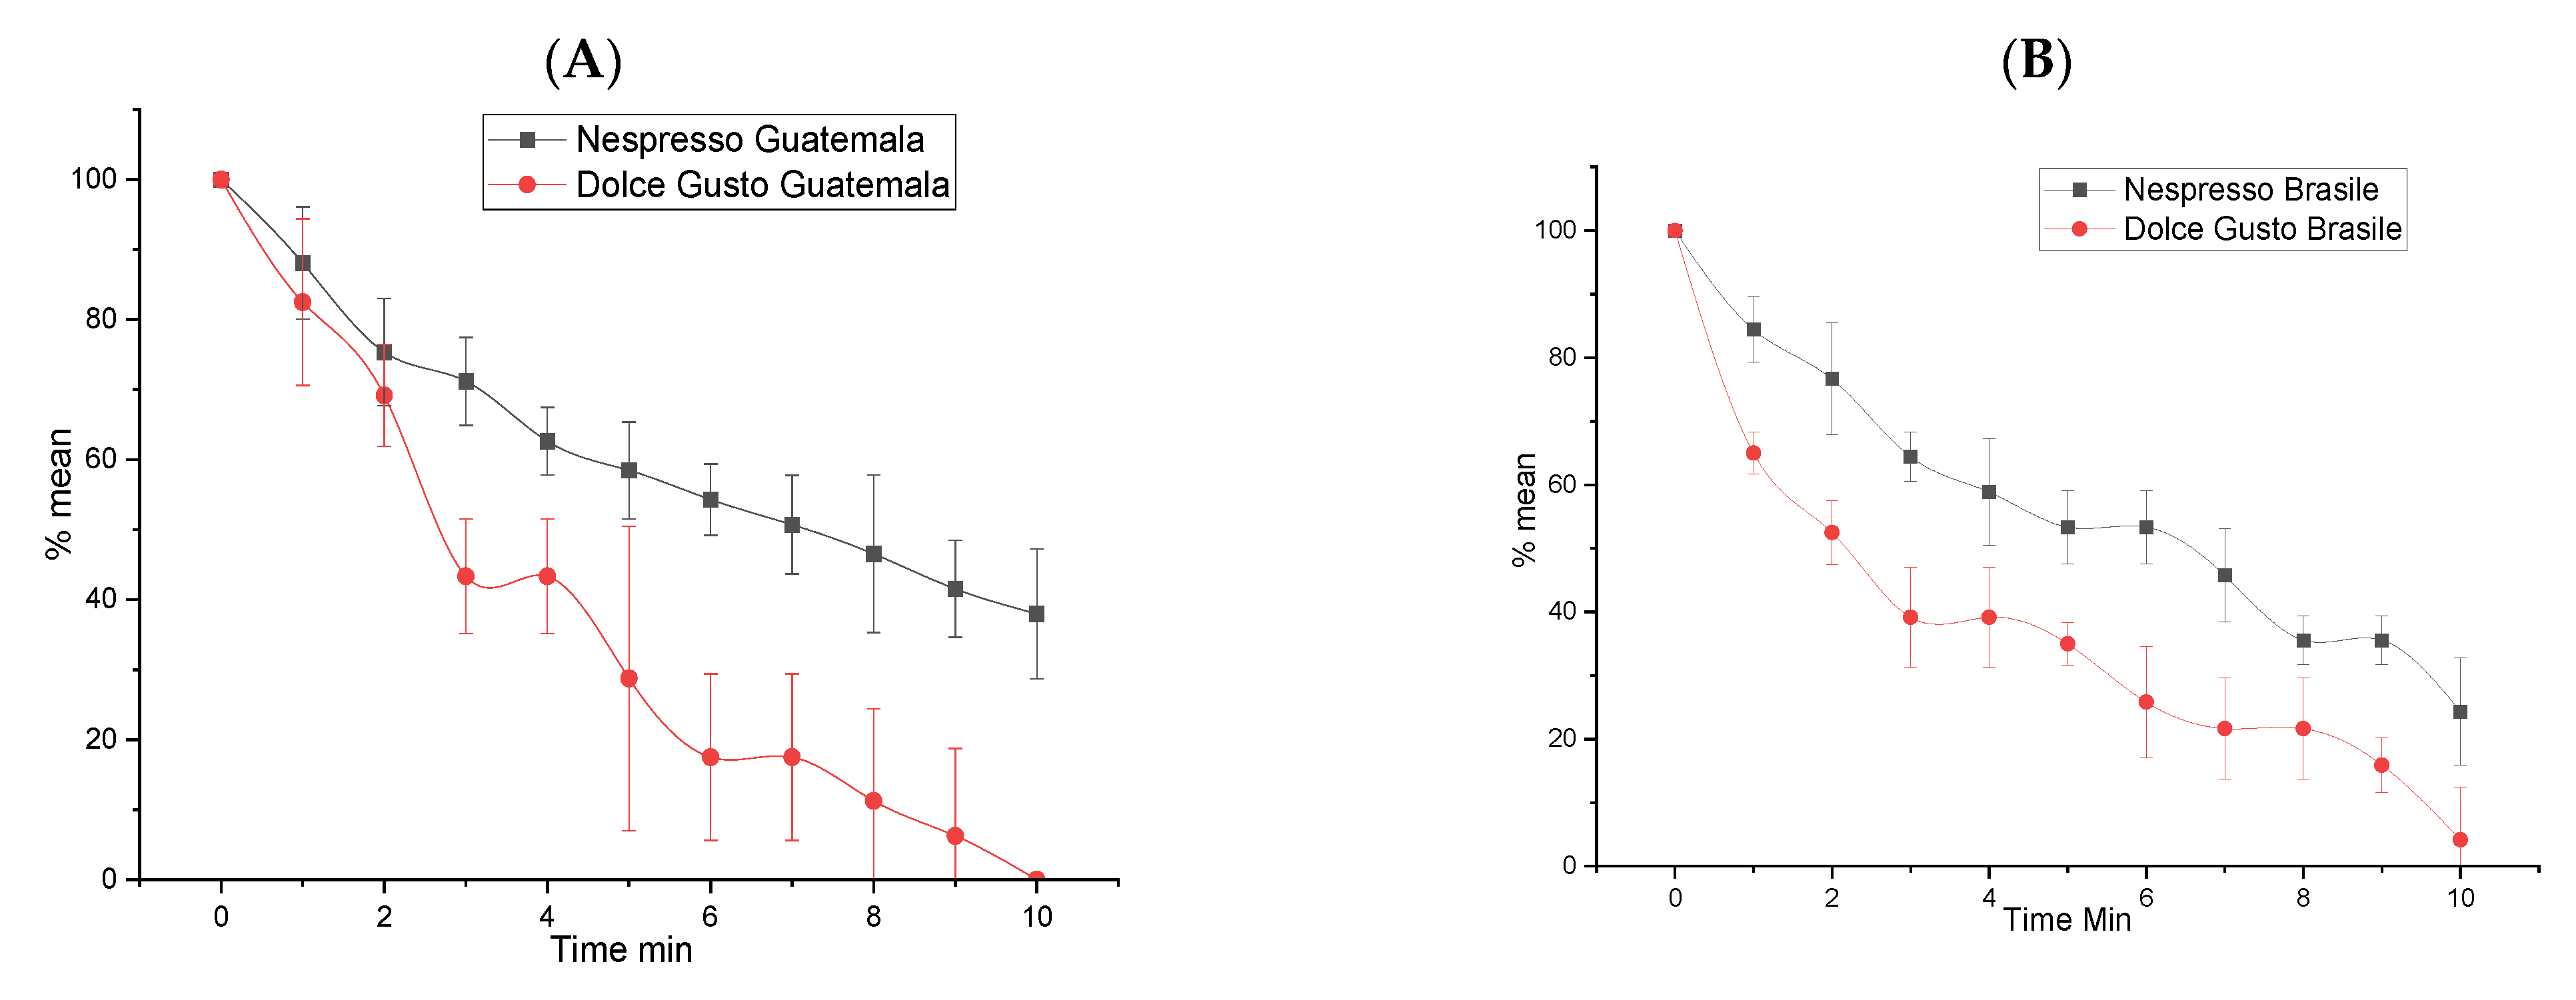
As reported in Figure 1, the foam of the Guatemala and Brazil coffees seemed more stable when obtained with the extraction method at 19 bar (N) compared to the same selections extracted at 15 bar (DG).
Therefore, when a higher pressure (19 bar, N) is used in the extraction of the coffee from the capsules, a more stable foam is obtained; on the contrary, at 15 bar (DG), the lower extraction pressure is responsible for a greater instability of the foam, which after 10 min tends to disappear completely regardless of Guatemala (DGG) and/or Brazil (DGB) coffee origins. However, as shown in Figure 1, NG coffee (washed Guatemala) has greater persistence than Brazil coffee extracted under the same conditions, and this could be due to the different composition of soluble carbohydrates, proteins, and lipids present in the composition of washed Guatemala coffee (data not shown). These molecules could affect the greater stability of the foam, which remains stable at 40% of the initial value even after 10 min of observation. Therefore, as shown in Figure 1, the extraction of the capsules at 19 bar (N) allows to obtain a more stable foam, and this feature is more present in washed Guatemala coffee.
Coffee crema could be defined as a continuous liquid phase surrounding a dispersed phase of gas bubbles. Each bubble belonging to the foam has a shape that gives a minimal surface area and depends, for thermodynamic reasons, on the presence of nearby bubbles. The liquid phase solubilizes biopolymers, with the function of surfactants, which participate in the formation of lamellae, i.e., the liquid films that trap the gas phase and stabilize the bubbles against coalescence [18]. 
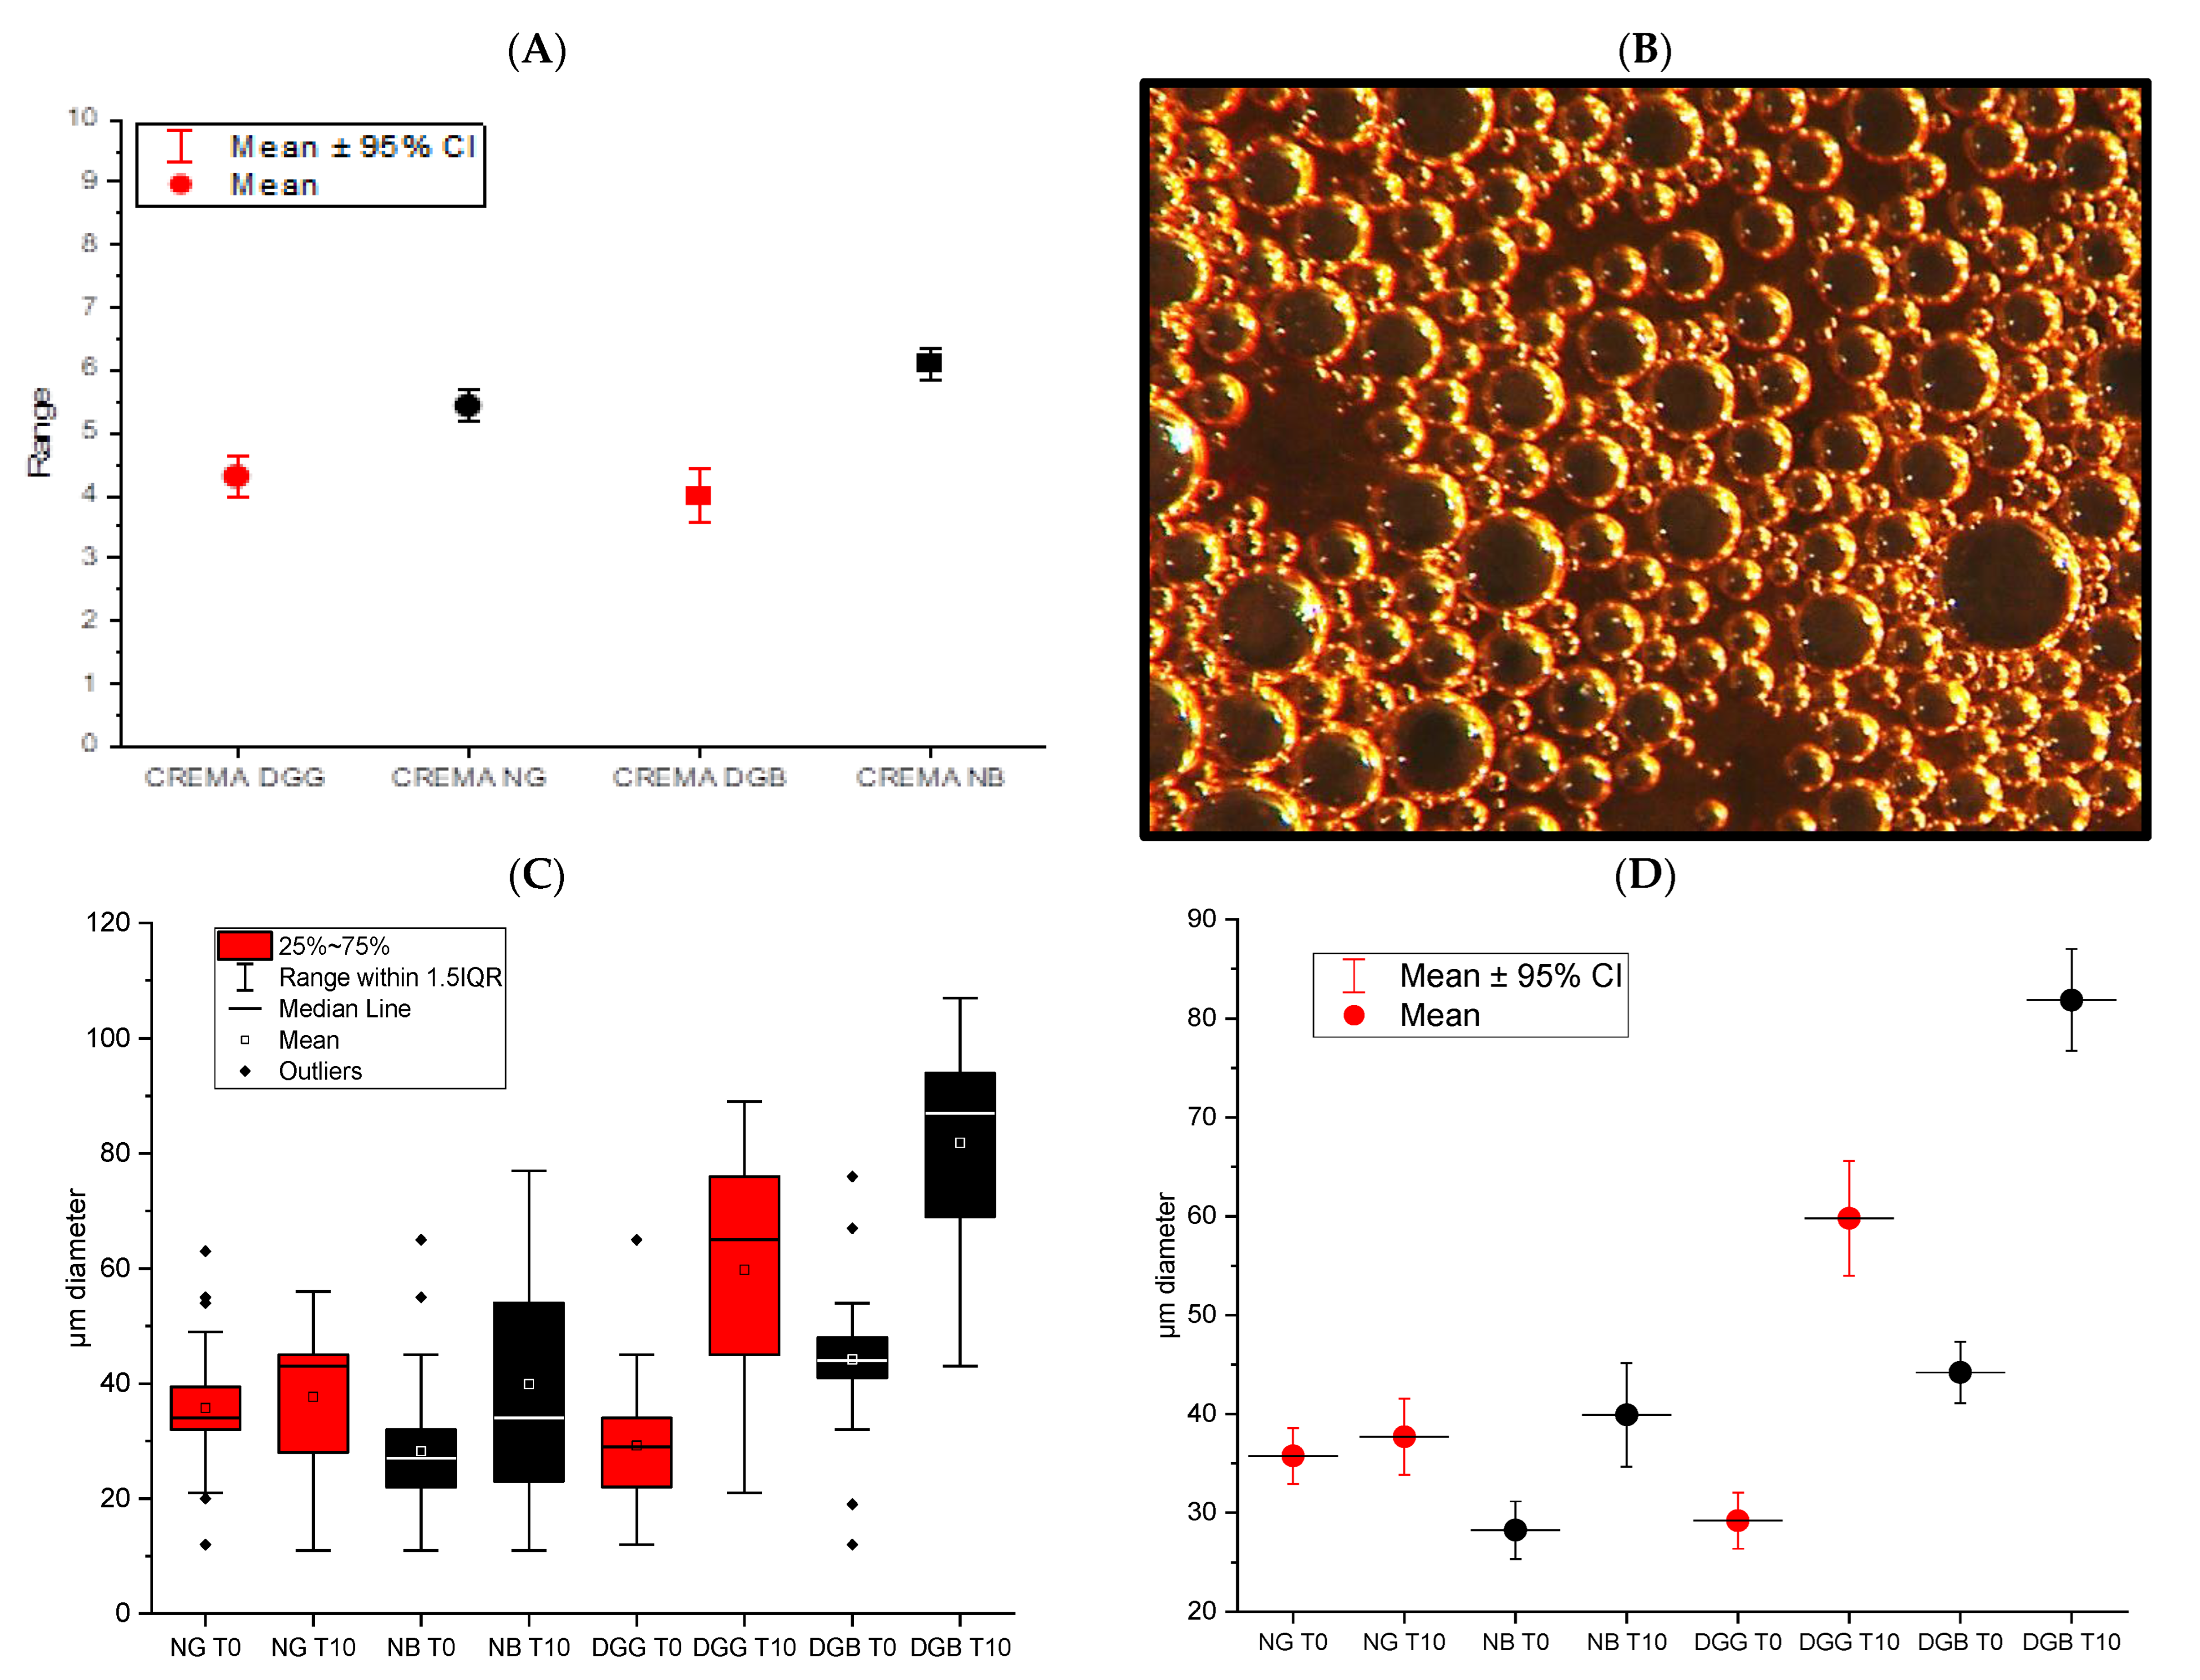
Figure 2A shows the average score obtained by means of sensory analysis on the appearance of the crema (foam), expressed as a visual attribute linked to fineness, appearance, uniformity, and fine creaminess. The Guatemala (NG) and Brazil (NB) coffees extracted from the capsules at 19 bars showed a crema with greater finesse; on the contrary, DGG and DGB cremas had a coarser texture with a lower average score than the one extracted from the capsules at higher pressure (average score around 4–4.5).
As reported by Luidwig (2014) [19] and Angeloni (2019) [20], not only could the characteristics related to the varieties and geographical origin of the coffee affect the quality of the beverage but also physical variables, such as extraction time, temperature, etc. The molecules responsible for the formation of foam present in coffee and that stabilize the interfacial layer of bubbles and emulsions are mostly lipids and proteins that create a surface physical network. Therefore, the main differences found in the stability and drainage of the foam depend on the structural characteristics of the bubbles. Figure 2B shows a stereomicroscope image of the coffee crema at T0 (in this case, the NG sample). Considering that the foams of the other coffees observed under the stereomicroscope did not show evident differences, the other images are not shown.
As shown in Figure 2B, the bubbles are spherical, and at sight, they are apparently uniform. As reported by Chen and Dickinson (1995) [21] and McClements (2005) [22], the high pressure during the extraction of the coffee from the capsules emulsifies part of the oils, which are responsible for the creamy perception; in addition, during the extraction of the espresso, the foam is stabilized by the interactions between surfactants and biopolymers, which, as a whole, affect the entire structure and are closely linked to the perception of mouthfeel and the flavor of the coffee.
Since foams are transient systems, which tend to collapse over time, the stereomicroscope images were studied at T0 and after 10 min (T10), with the aim of observing the microscopic variations of the foam bubbles during drainage. In fact, in the initial stage, the bubbles are spherical, and it is more objective to measure their diameter. Later, bubbles increase their size and acquire a polyhedral shape due to the coarsening of the bubbles and the drainage of the liquid [15]. Over the time, the bubbles became larger and exhibit polydispersity. This phenomenon may be due to the internal pressure of the bubbles of smaller diameter, which determines the flow of gas to the larger ones. This leads to a further reduction of the diameter of the smaller bubbles until they disappear and a consequent increase of the big ones [15].
For all statistical analyses on each experimental condition (coffee variety and extraction conditions), the diameter of about 450 bubbles of coffee foam were measured (150 bubbles for three proofs). Statistically, the greater the number of bubbles, the lower the variability (many research papers report on very high bubbles number analyzed, also thousands). However, Barik et al. [15], to determine the minimum number of bubbles required for the statistical analysis, studied d32 for 50, 100, 150, 200, 250, 300, 350, and 400 bubbles obtained from the optical images. As reported by the author, the value of d32 does not change for the bubbles number over 200. In this experiment, 150 bubbles sizes of the coffee foam from capsule extraction were considered for each proof; the statistical analysis carried out on the bubbles size was useful to study the foam systems of the espresso coffees obtained by capsules.
As shown in Figure 2C, the distributions of the bubble diameters change from T0 to T10. In all the observed cases, the box plots at T0 show a rather contained interquartile gap as well as the width of the range. This rather limited variability of the diameter of the coffee bubbles at T0 indicates that the foam is rather uniform even at a microscopic level, with small bubbles and diameters similar to each other. However, if the mean diameters are observed (Figure 2D), the NB sample presents bubbles, on average, very small (26 µm) at T0, statistically similar to the DGG sample (27 µm, T0); statistically higher values are observed in NG (36 µm, T0), while the highest value is present in the DGB sample (44 µm, T0). Therefore, in general, it can be stated that at T0, the bubbles of the coffee foam, at a microscopic level, are of uniform size in the different samples; moreover, the means of the diameters present significant differences for NG and DGB coffees that show larger bubbles. Furthermore, at T0, it is not possible to distinguish the effect of the coffee and the extraction pressure from the capsules.
After 10 min of observation (T10), the diameters of the bubbles change in size; large and small bubbles coexist in the foams, a phenomenon that leads to disproportionation of the bubbles and their instability. In all cases observed at T10 (Figure 2C), the interquartile gap of the box plots is much larger than T0, and the mean values are far apart from the median ones. Furthermore, the ranks are very broad. This graphic/statistical elaboration highlights that after 10 min from its formation, the coffee foam collapses, showing its dynamic and transitory character. In the observed coffee foam, large and small bubbles coexist, which make it unstable; furthermore, following Oswald’s maturation [15], the large bubbles grow at the expense of the small ones, and the system collapses, as observed also in Figure 1A,B. Therefore, the values of the bubbles diameters change greatly, and thus, the behavior of the coffee foam differs in function of the applied pressure.
In Figure 2C, the differences at T10 can be observed on the various samples; in particular, the coffee foam that has less variability is NG, while the other three samples have quite similar variability in terms of dispersibility of the size of the bubbles and therefore of the width of the box plots. The average diameters at T10 (Figure 2D) show higher values than at T0. Except for NG, which does not show statistically significant differences in the two observation times (T0 36 µm and T10 38 µm), all the other samples have mean values at T10 that are statistically higher than T0. In particular, NB at T10 has a diameter of about 39 µm and DGG 59 µm, while DGB has the highest value (81 µm). In summary, it can be stated that the coffees extracted at 15 bars after 10 min of observation have a much higher mean value of the bubbles; this is an indication of disproportionation and greater instability of the foam, a result also confirmed by the observation of stability (Figure 1A,B). It could be stated that the lower extraction pressure of the coffee solubilizes those molecules responsible for the stability of the foam bubbles, such as proteins and polysaccharides, to a lesser extent. Thus, even if at first, the beverage has a uniform foam with small bubbles, in a short time, they collapse, probably because they are not stabilized by the surfactant molecules, which in this case, would be in a lower concentration than the extraction that took place at 19 bars.

3.2. Sensory Analysis

The sensory parameters were chosen to cover many important quality criteria for a good cup of coffee. The first impression of a cup of espresso coffee is the crema, evaluated in terms of volume/firmness and texture. The next impression is the smell perceived directly on the nose and measured through the analysis of the head space of the coffee infusion [23,24,25].
It is known that the volatile organic compounds in coffee, identified so far, are more than 1000 (VOC), but only 20 represent the relevant aromatic compounds that identify the smell of coffee [26,27,28]. The other descriptors concern the flavor, which corresponds to a combination of the impression of post-nasal aroma and taste. The coffee body is another very important descriptor and is often due to the presence of total solids and occasionally also the lipids or fatty acid content. Both caffeine and chlorogenic acids are often related to bitter taste. The astringency may be due to the chlorogenic acids extracted from coffee [29] although other molecules could also cause the astringent sensation [30]. Table 1 shows sensory parameters of the six coffee samples (NG, NB, DGG, DGB, MG, and MB); as reported in the Table 1, the two coffees (Brasile and Guatemala) differ significantly in a few parameters, such as “sour” and “body”. Additionally, in this case, the difference between perceptions is dictated by the three methods of coffee extraction; in fact, many of the significant differences in the sensory parameters are due to the extraction, with the espresso technique at 19 bars and 15 bars, and to the method with the moka. The values of the sensory parameters, shown in Table 1, were plotted in two spider plots (the comments on the two graphs in Figure 3 refer to the mean values of the parameters in Table 1; Tukey HSD test was applied).
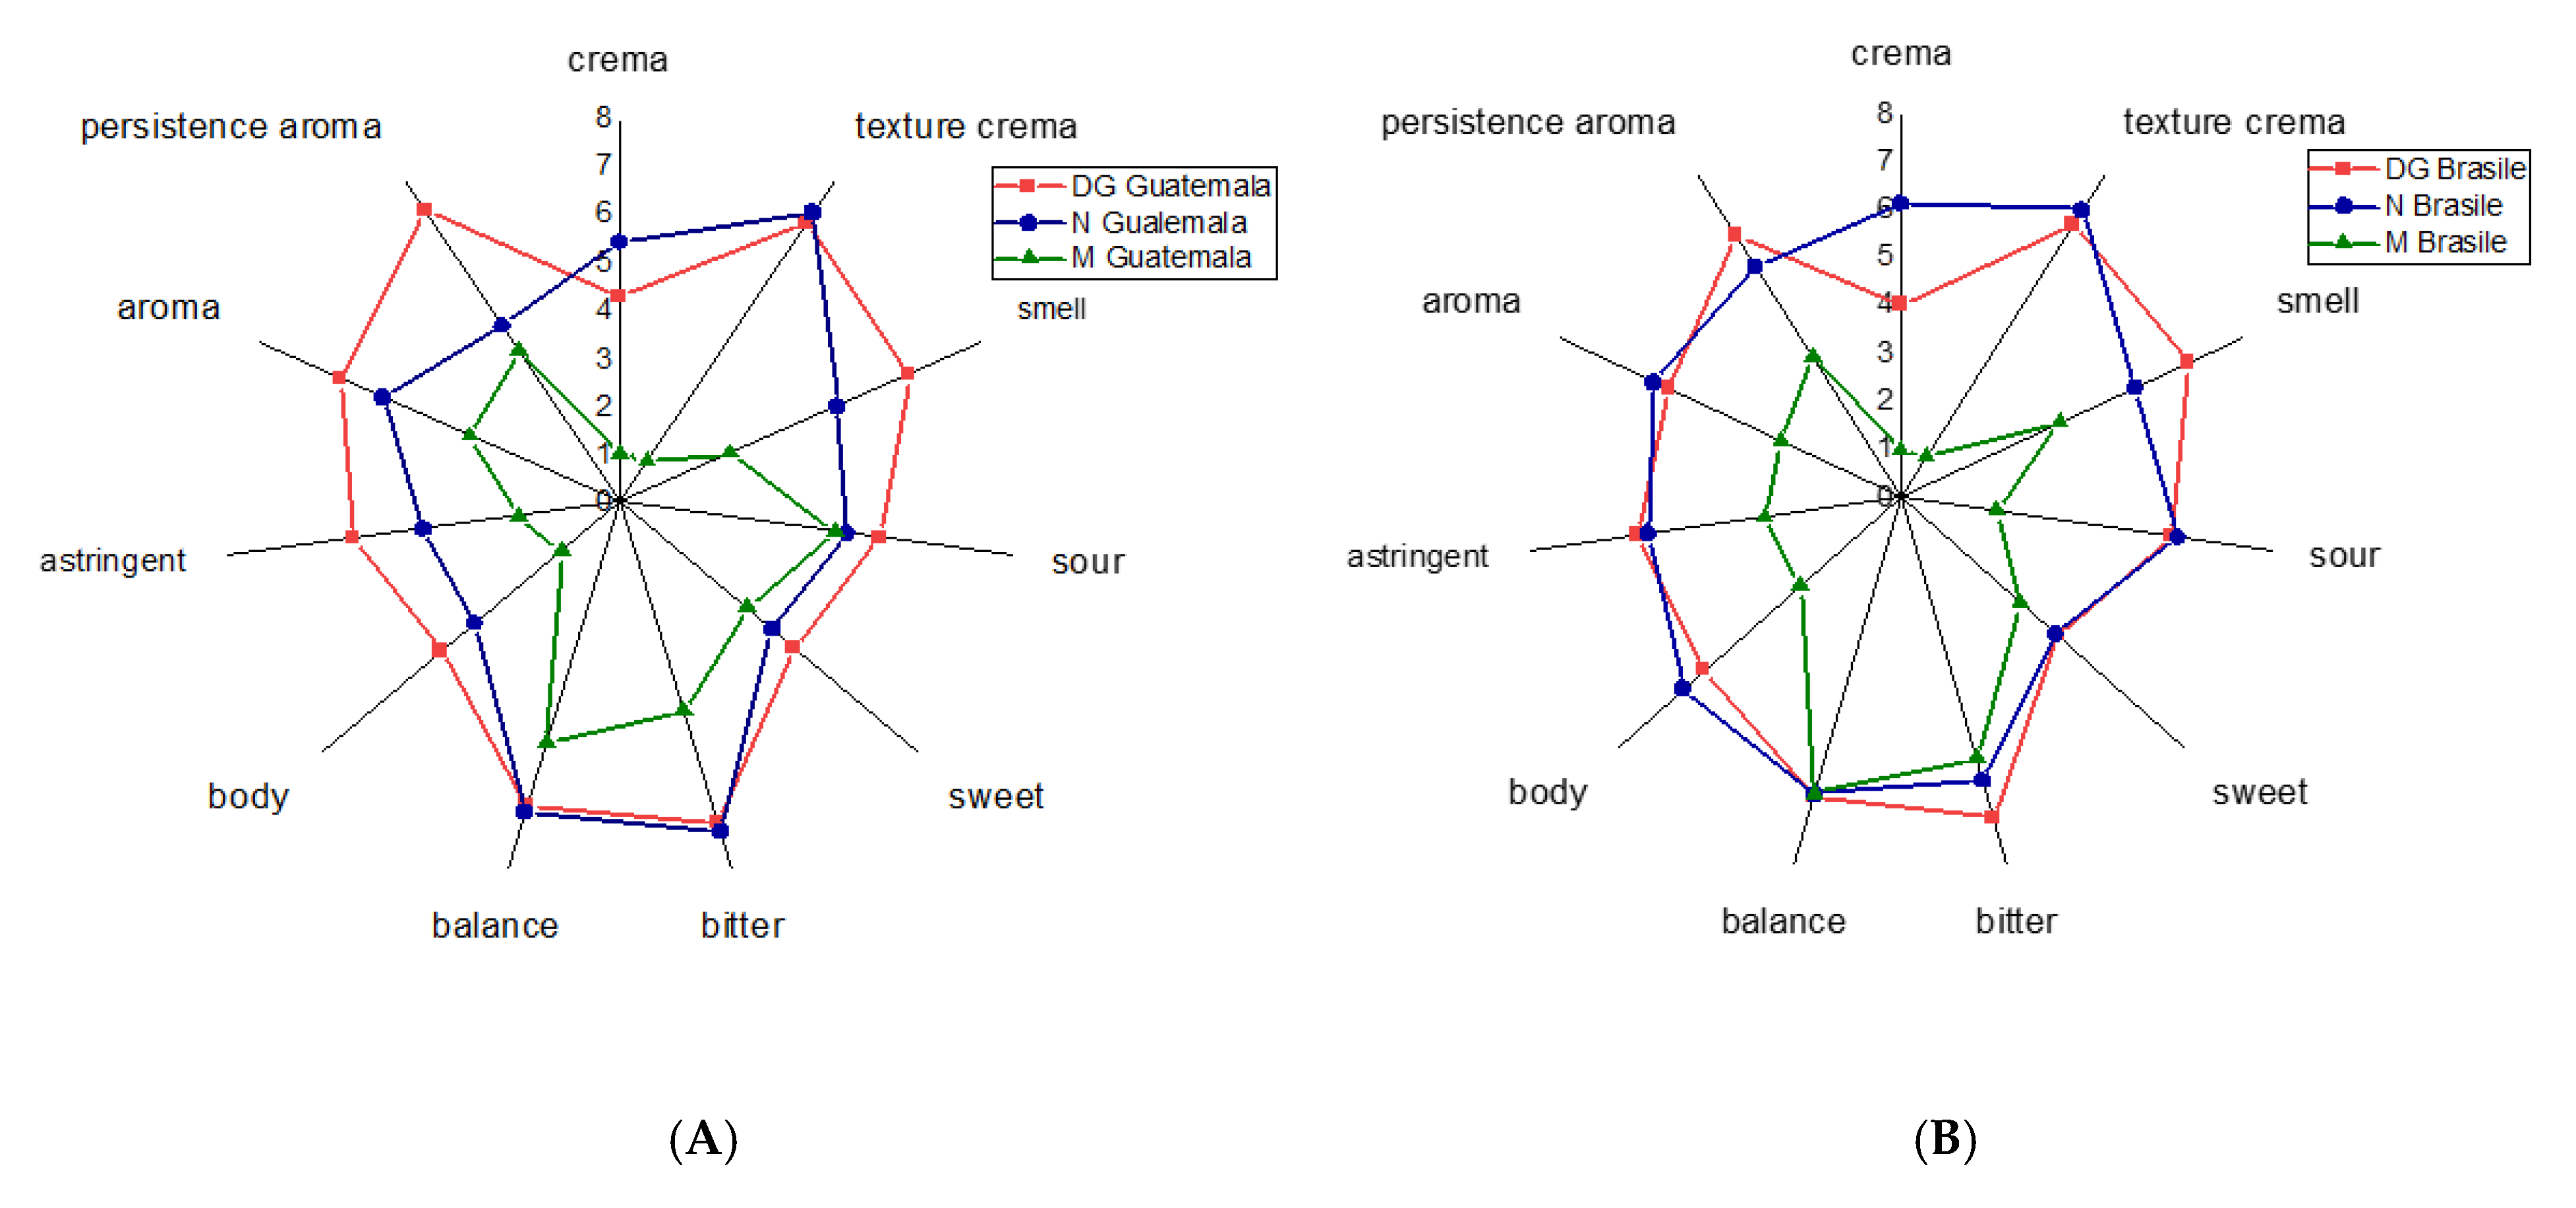
Figure 3A,B shows the sensory profiles of the two coffees, Guatemala (G) (Figure 3A) and Brazil (B) (Figure 3B), extracted at 15 bar (DG) and 19 bar (N) and with the moka. As shown in Figure 3 A,B, the extraction of coffee with the moka generates a sensory profile with generally lower values of the descriptors than the other two extractions.
Considering the spider plot of Guatemala coffee (G), it can be observed that the descriptors vary in intensity depending on the pressure used (15 and 19 bars). In particular, the appearance of the texture of the crema, sour, sweetness, bitterness, balance, and body do not seem to be influenced by the extraction pressure in DGG and NG, in accordance with Gloess et al. (2013) [31].
On the contrary, the thickness of the crema is higher in NG, while DGG has a more intense smell as well as the perception of astringency, aromatic intensity, and persistence.
In this context, the Guatemalan sample extracted with the moka method (MG) is an exception, which presents most of the different descriptors with respect to DGG and NG, and the values are clearly lower; in this last case, the extraction method is responsible for a lower number of compounds in the coffee [31].
The sensory analysis of Brazil coffee, obtained with the three extractions (NB, DGB, and MB) also showed some differences (Figure 3B). Analyzing the spider plot, the DGB and NB samples have statistically similar sensory profiles except for the “crema” and “odor” parameters. Moreover, in this case, the extraction of coffee with the moka (MB) had lower scores and a less expanded sensory profile than the other two. The only similar parameters in the three extractions are “balance” and “bitter”, which were not affected by the coffee preparation method used.
Therefore, as can be observed in Figure 3A,B, the sensory profiles of the coffees obtained at 19 and 15 bars (N and DG, respectively) generally show high and more similar values. Figure 3 A,B also shows that, if the sensory profiles of the coffees extracted with the capsules at different pressures are analyzed, they show differences related to the origin of the coffee, too (Guatemala and Brazil). In particular, the Guatemala variety changes the sensory profiles according to the extraction method in all three cases (DG, N, and M), while the Brazil coffee extracted at 15 and 19 bars maintains roughly the same sensory characteristics.
As reported by Andueza et al. (2007) [3] and Adhikari et al. (2019) [32], even with slightly varying the coffee parameters (extraction method, consumption temperature, etc.) there is a quantitative and qualitative variation of volatile and organoleptically active molecules, with consequences for the sensory characteristics of the beverage. In this research, the observed differences are probably due to the distinct extraction of some molecules responsible for the flavor and the characteristic volatility of some odorous molecules following the three methods applied. All of this leads to sensory profiles with distinct shapes (Figure 3) and statistically significant differences in many of the sensory parameters studied (Table 1).
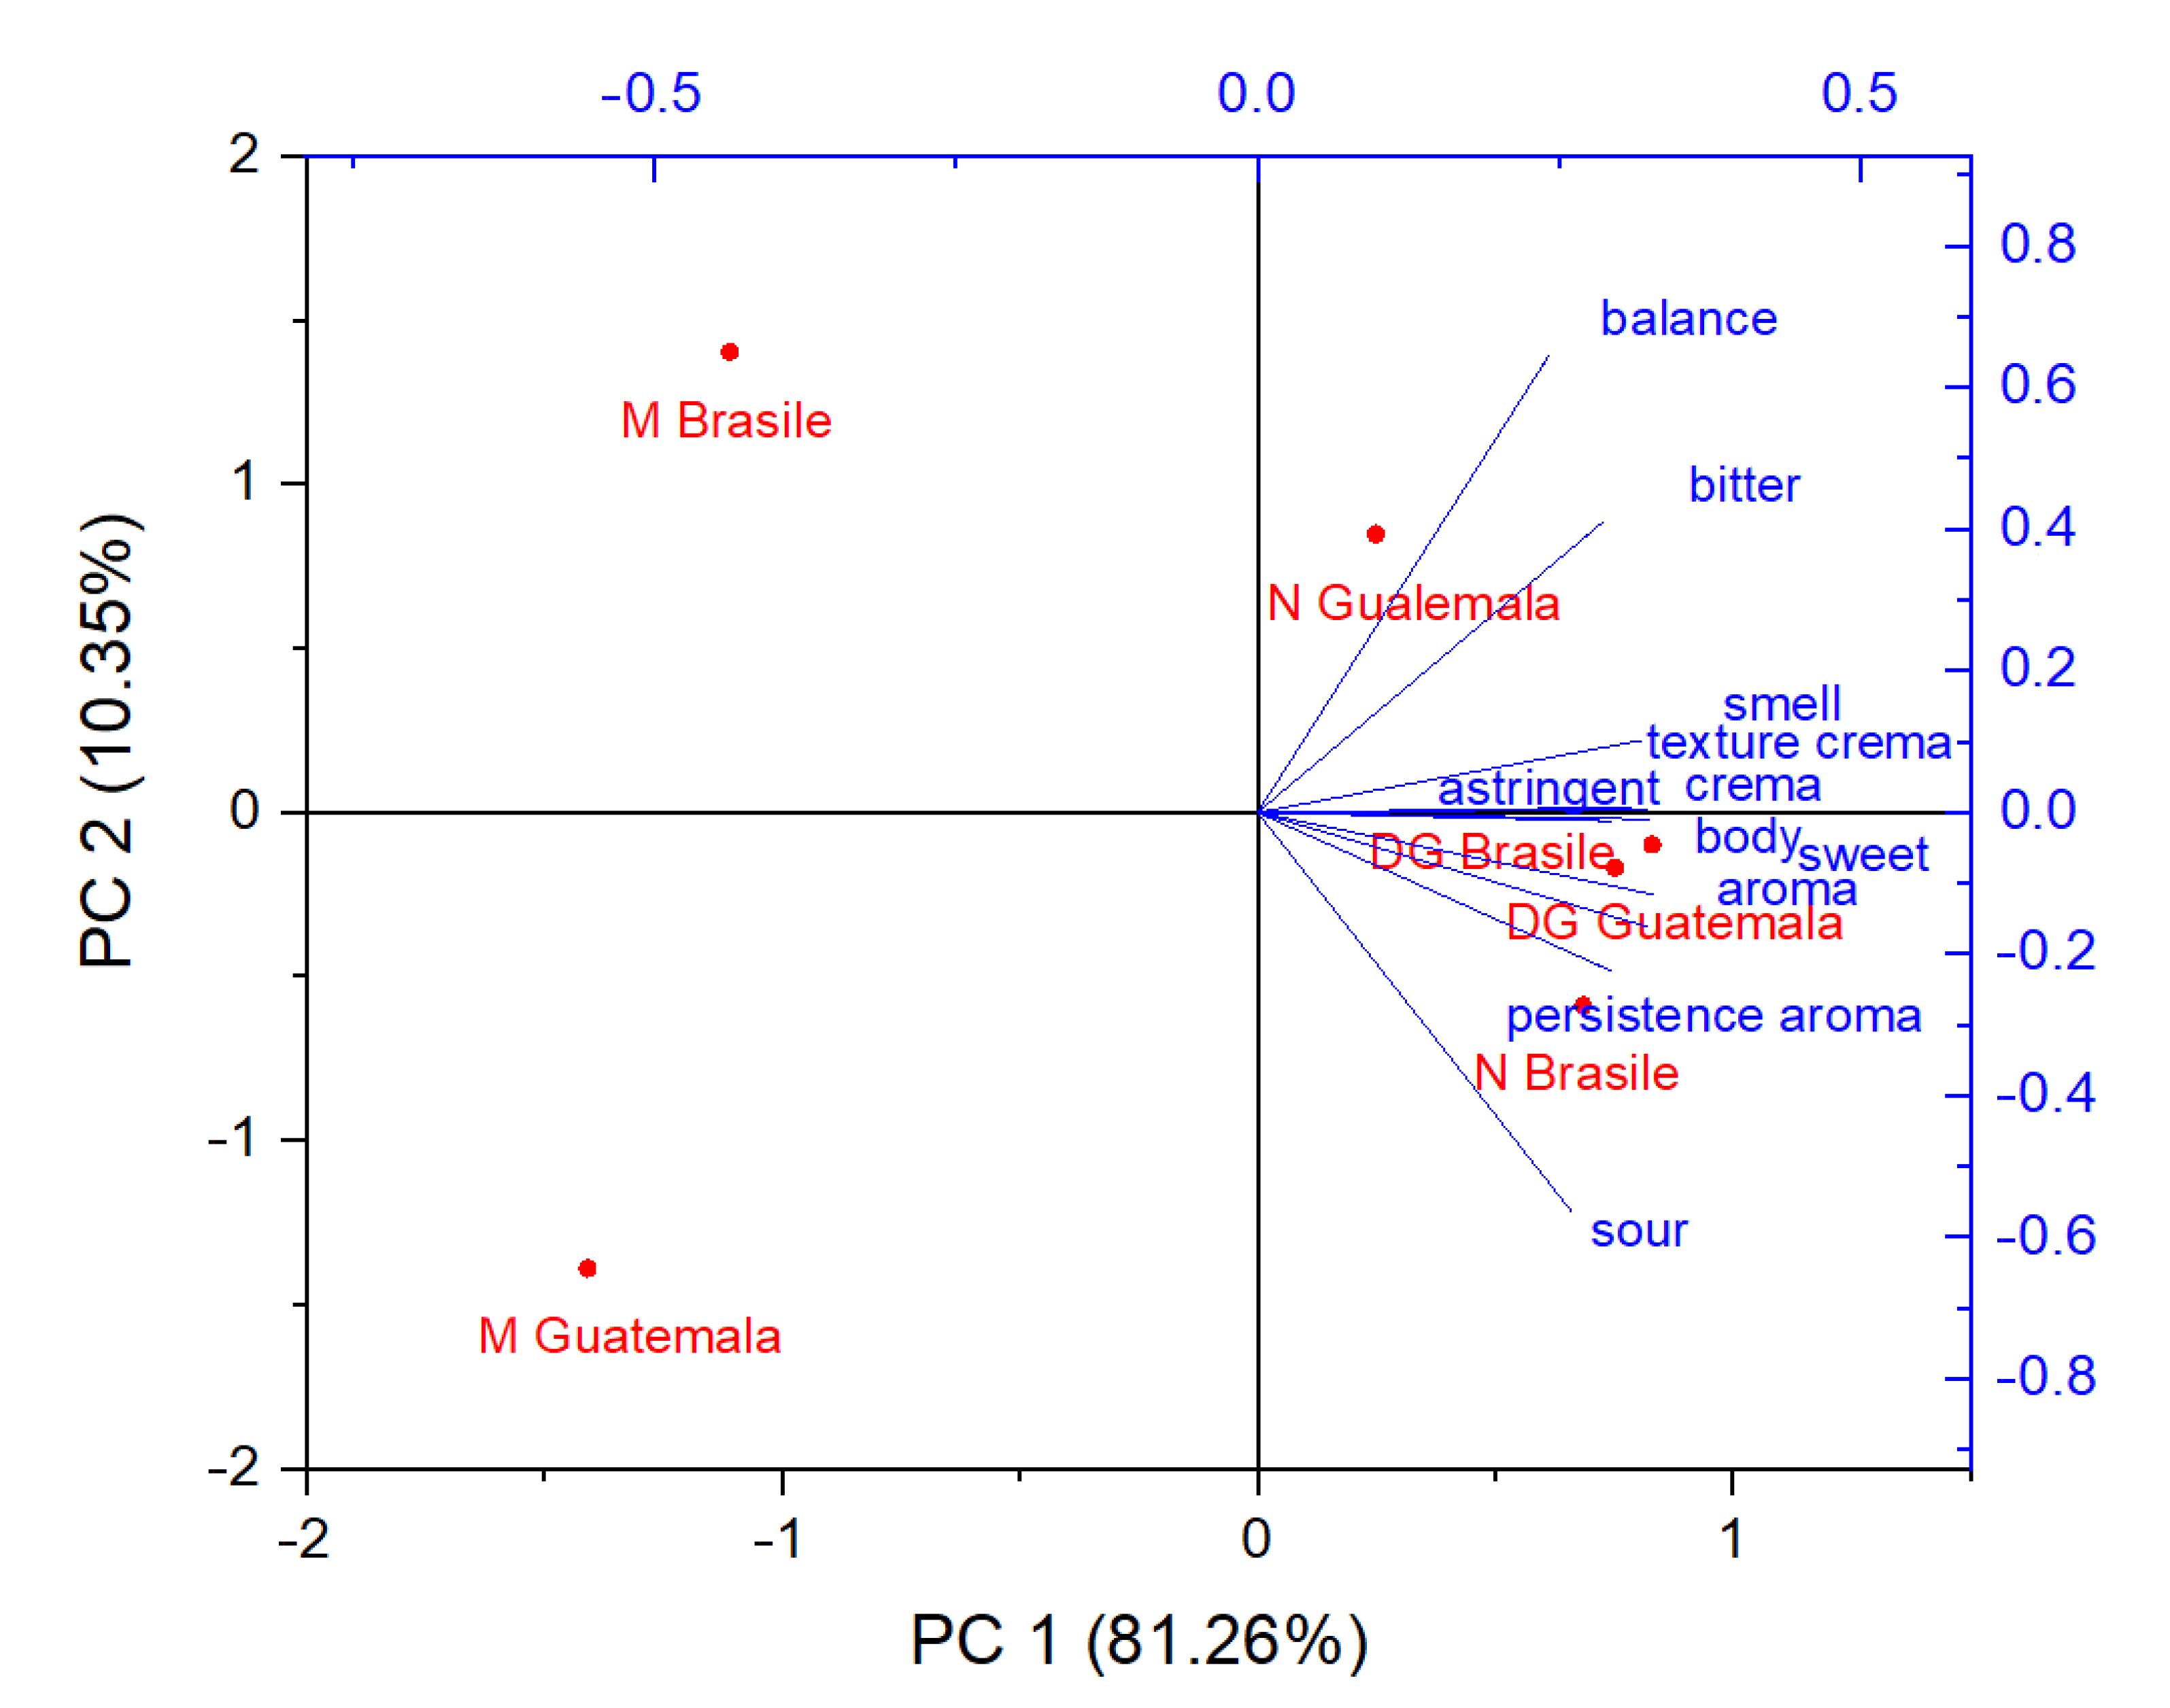
The principal component analysis (PCA) summarizes and synthesizes the differences relating to the two selections of Arabica coffee extracted in the three ways and the sensory characteristics. Figure 4 shows that more than 91.6% of the total variance is explained by the first (81.26%) and second (10.35%) components. The multivariate analysis was able to separate the espresso coffees extracted with the two types of pressure in the first positive PC 1 quadrant compared to the negative quadrant, in which the two coffees extracted with the moka are present. Furthermore, PC 2 highlights how NG is placed on the positive part of the quadrant together with the sensory characteristics of bitter, balance, and smell. Furthermore, NB, DGG, and DGB coffees are placed in the negative quadrant of PC 2 and are more associated with the sensory characteristics of sour, aromatic persistence, and sweetness, while the texture character of the crema is located between the positive and negative quadrant of PC 2.
In summary, the PCA (Figure 4) shows how M Brasile and M Guatemala extracted with moka differ from those obtained by capsules at higher pressures (N and DG). With the extraction by moka, it is also possible to distinguish the two varieties (M Brazil, quadrant PC2 positive and M Guatemala, quadrant PC2 negative).
Furthermore, N Guatemala (PC2 positive quadrant) differs from N Brazil (PC2 negative quadrant), highlighting different sensory characteristics of the two varieties of Arabica with the same extraction method. N Guatemala stands out for its sensory parameters of aroma and balance, while N Brasile stands out for sourness, persistence of the aroma, for sweetness, and for its aromatic intensity.
On the contrary, the two varieties, Guatemala and Brazil, when extracted with the DG method (15 bar), are superimposed in the PC2 negative quadrant (between the negative and positive quadrants, PC2); they also share the parameters of texture, sweetness, body, astringency, and aroma intensity. In this last case, the DG extraction method (15 bar) makes the two coffees very similar to each other.

4. Conclusions

The visual aspect of the coffee crema (foam) offers the first information on the sensory and hedonic aspect of the beverage. Espresso coffee in capsules has foam stability, which depends on the pressure applied during the extraction of the beverage. High pressures ensure greater stability, and this is also confirmed by the macroscopic and microscopic analysis. In fact, at higher pressures, the crema is finer, and the bubbles are smaller, uniform, and stable over time. On the contrary, lower pressures are responsible for disproportionation of the size of the bubbles and, in general, for instability.
The sensory analysis of the espresso and moka coffees seemed to confirm that for the same coffee, the extraction method changes the profile of the beverage’s perceptions. Coffee with moka, extracted at low pressures, has much lower sensory profiles than the two espresso coffees obtained at high pressures.
However, the choice of coffee and the assessment of acceptability remain subjective aspects: the texture of the crema but also its absence, as in moka coffee; the release of complex aromas; the bitter taste; and the more or less intense astringency (parameters quantified in this research) represent factors to be analyzed through further investigations by consumer tests.
Although these two coffees in comparison represent a limited number of samples, in this research, by considering the variety of Arabica used, it seems that Guatemala responds differently to the extraction method used; in particular, the finer grain of the bubbles could be responsible for a lower aromatic release when the coffee is extracted at higher pressures. This behavior could be due to the different composition in lipids, proteins, and carbohydrates, and the different composition responds differently according to the applied pressure during the coffee extraction.
In conclusion, coffee is confirmed as an extremely complex beverage, in which even the modification of a parameter can bring different physical and sensory characteristics.

Author Contributions

Conceptualization, G.L. and V.D.Z.; methodology, G.L., S.Z. and V.D.Z.; software, G.L.; validation, G.L.; formal analysis, A.D.I., G.L. and V.D.Z.; investigation, V.D.Z. and A.D.I.; resources, V.D.Z. and A.D.I.; data curation, G.L.; writing—original draft preparation, G.L.; writing—review and editing, A.D.I. and S.Z.; visualization, G.L., A.D.I. and V.D.Z.; supervision, G.L. and A.D.I.; project administration, G.L.; funding acquisition, G.L. All authors have read and agreed to the published version of the manuscript.

Funding

This research was supported by University of Padova, with the funding DOR1847072 (2018) and BIRD165379 (2016).

Informed Consent Statement

Informed consent was obtained from all subjects involved in the study.

Data Availability Statement

The data that support the findings of this study are available from the corresponding author upon reasonable request.

Acknowledgments

The authors thank the sensory panel for their work on this project.

Conflicts of Interest

The authors declare no conflict of interest.

References

  1. Nunes, F.M.; Coimbra, M.A.; Duarte, A.C.; Delgadillo, I. Foamability, foam stability, and chemical composition of espresso coffee as affected by the degree of roast. J. Agric. Food Chem. 1997, 45, 3238–3243. [Google Scholar] [CrossRef]
  2. Yeretzian, C.; Jordan, A.; Badoud, R.; Lindinger, W. From the green bean to the cup of coffee: Investigating coffee roasting by on-line monitoring of volatiles. Eur. Food Res. Tech. 2002, 214, 92–104. [Google Scholar] [CrossRef]
  3. Andueza, S.; Vila, A.M.; De Peña, M.P.; Cid, C. Influence of coffee/water ratio on the final quality of espresso coffee. J. Sci. Food Agric. 2007, 87, 586–592. [Google Scholar] [CrossRef]
  4. Illy, A.; Viani, R. Espresso Coffee: The Science of Quality; Academic Press: Cambridge, MA, USA, 2005. [Google Scholar]
  5. Bazzara, F.; Bazzara, M. The Espresso Coffee Production System; Planet Coffee: Trieste, Italy, 2008. [Google Scholar]
  6. Petracco, M. Technology IV: Beverage preparation: Brewing trends for the new millennium. In Coffee: Recent Developments; Wiley-Blackwell: Hoboken, NJ, USA, 2001; pp. 140–164. [Google Scholar]
  7. Illy, E.; Navarini, L. Neglected food bubbles: The espresso coffee foam. Food Biophys. 2011, 6, 335–348. [Google Scholar] [CrossRef] [Green Version]
  8. Barron, D.; Pineau, N.; Matthey-Doret, W.; Ali, S.; Sudre, J.; Germain, J.C. Impact of crema on the aroma release and the in-mouth sensory perception of espresso coffee. Food Funct. 2012, 3, 923–930. [Google Scholar] [CrossRef]
  9. Dold, S.; Lindinger, C.; Kolodziejczyk, E.; Pollien, P.; Santo, A.; Germain, J.C.; Hartmann, C. Influence of foamstructure on the release kinetics of volatiles from espresso coffee prior to consumption. J. Agric. Food Chem. 2011, 59, 11196–11203. [Google Scholar] [CrossRef]
  10. Labbe, D.; Sudre, J.; Dugas, V.; Folmer, B. Impact of crema on expected and actual espresso coffee experience. Food Res. Intern. 2016, 82, 53–58. [Google Scholar] [CrossRef]
  11. Vanni, A. Sealed Capsule for the Preparation of a Beverage, in Particular Espresso Coffee. European Patent 1,886,942 b1 (12), 13 February 2008. [Google Scholar]
  12. Toscani, E.; Soletti, F. L’Italia del Caffè; Touring Club Italiano: Milano, Italy, 2006. [Google Scholar]
  13. Parenti, A.; Guerrini, L.; Masella, P.; Spinelli, S.; Calamai, L.; Spugnoli, P. Comparison of espresso coffee brewing techniques. J. Food Engin. 2014, 121, 112–117. [Google Scholar] [CrossRef]
  14. Masella, P.; Guerrini, L.; Spinelli, S.; Calamai, L.; Spugnoli, P.; Illy, F.; Parenti, A. A new espresso brewing method. J. Food Engin. 2015, 146, 204–208. [Google Scholar] [CrossRef]
  15. Barik, T.K.; Roy, A. Statistical distribution of bubble size in wet foam. Chem. Eng. Sci. 2009, 64, 2039–2043. [Google Scholar] [CrossRef]
  16. Nicoli, M.C.; Savonitti, O. Storage and packaging. In Espresso Coffee. The Science of Quality, 2nd ed.; Viani, R., Illy, A., Eds.; Academic Press: London, UK, 2005. [Google Scholar]
  17. Piazza, L.; Gigli, J.; Bulbarello, A. Interfacial rheology study of espresso coffee foam structure and properties. J. Food Engin. 2008, 84, 420–429. [Google Scholar] [CrossRef]
  18. Dickinson, E. Adsorbed protein layers at fluid interfaces: Interactions, structure and surface rheology. Colloids Surf. B. 1999, 15, 161–176. [Google Scholar] [CrossRef]
  19. Ludwig, I.A.; Sanchez, L.; Caemmerer, B.; Kroh, L.W.; De Peña, M.P.; Cid, C. Extraction of coffee antioxidants: Impact of brewing time and method. Food Res. Int. 2012, 48, 57–64. [Google Scholar] [CrossRef]
  20. Angeloni, G.; Guerrini, L.; Masella, P.; Bellumori, M.; Selvaggia Daluiso, S.; Alessandrom, P.; Innocenti, M. What kind of coffee do you drink? An investigation on effects of eight different extraction methods. Food Res. Int. 2019, 116, 1327–1335. [Google Scholar] [CrossRef]
  21. Chen, J.; Dickinson, E. Surface shear viscosity and protein–surfactant interactions in mixed protein films adsorbed at the oil–water interface. Food Hydrocoll. 1995, 9, 35–42. [Google Scholar] [CrossRef]
  22. McClements, D.J. Food Emulsions, 2nd ed.; Principles practices and techniques; CRC Press: Boca Raton, FL, USA, 2005; pp. 128–130. [Google Scholar]
  23. Yeretzian, C.; Pollien, P.; Lindinger, C.; Ali, S. Individualization of flavor preferences: Toward a consumer-centric and individualized aroma science. Comp. Rev. Food Sci. Food Saf. 2004, 31, 152–159. [Google Scholar] [CrossRef]
  24. Roberts, D.D.; Pollien, P.; Antille, N.; Lindinger, C.; Yeretzian, C. Comparison of nosespace, headspace, and sensory intensity ratings for the evaluation of flavor absorption by fat. J. Agric. Food Chem. 2003, 51, 3636–3642. [Google Scholar] [CrossRef]
  25. Roberts, D.D.; Pollien, P.; Lindinger, C.; Yeretzian, C. Nosespace analysis with proton-transfer reaction mass spectrometry: Intra- and Interpersonal Variability. In Handbook of Flavor Characterization: Sensory Analysis, Chemistry, and Physiology; CRC Press: Boca Raton, FL, USA, 2003. [Google Scholar]
  26. Grosch, W. Chemistry III volatile compounds. In Coffee: Recent Developments; Blackwell Science: London, UK, 2001. [Google Scholar]
  27. Semmelroch, P.; Grosch, W. Studies on character impact odorants of coffee brews. J. Agric. Food Chem. 1996, 44, 537–543. [Google Scholar] [CrossRef]
  28. Mayer, F.; Czerny, M.; Grosch, W. Sensory study of the character impact aroma compounds of a coffee beverage. Eur. Food Res. Technol. 2000, 211, 272–276. [Google Scholar] [CrossRef]
  29. Clifford, M.N.; Ohiokpehai, O. Coffee astringency. Anal. Proceed. 1983, 20, 83–86. [Google Scholar] [CrossRef]
  30. Schwarz, B.; Hofmann, T. Is there a direct relationship between oral astringency and human salivary protein binding? Eur. Food Res. Technol. 2008, 227, 1693–1698. [Google Scholar] [CrossRef]
  31. Gloess, A.N.; Schönbächler, B.; Babette Klopprogge, B.; D’Ambrosio, L.; Chatelain, K.; Annette Bongartz, A.; Strittmatter, A.; Rast, M.; Yeretzian, C. Comparison of nine common coffee extraction methods: Instrumental and sensory analysis. Eur. Food Res. Technol. 2013, 236, 607–627. [Google Scholar] [CrossRef] [Green Version]
  32. Adhikari, J.; Chambers, E.; Koppel, K. Impact of consumption temperature on sensory properties of hot brewed coffee. Food Res. Int. 2019, 115, 95–104. [Google Scholar] [CrossRef] [PubMed]
Figure 1. Foam stability of NG and DGG (A) and NB and DGB (B) coffees. The foam was measured every minute for 10 min in a graduated cylinder, and the cm of thickness were then expressed in %. All observations were conducted in triplicate, and the data reported on the graphs represent the mean of the values and the standard deviation.
Beverages 08 00028 g001
Figure 2. Image of the coffee crema obtained at 19 bars and 15 bars. (A) Visual sensory evaluation on the foam layer of the DGG, NG, DGB, and NB coffee samples, performed by the panel of expert (the evaluation was performed in triplicate). (B) Stereomicroscope analysis of NG coffee crema at 80×. (C) Box plot of the d32 values of the foam bubble diameters of the espresso coffees at T0 and T10. (D) HSD (Tukey test), p < 0.05, of the d32 values of the bubbles of the espresso coffee samples.
Beverages 08 00028 g002
Figure 3. Spider plots of the Guatemala and Brazil varieties extracted with the Nespresso®, Dolce Gusto®, and mocha method. The two frames show the sensory profiles of (A) NG, DGG, and MG and (B) NB, DGB, and MB.
Beverages 08 00028 g003
Figure 4. Principal Component Analysis (PCA) of the six coffee samples (NG, NB, DGG, DGB, MG, and MB) in relation to the sensory characteristics.
Beverages 08 00028 g004
Table 1. Sensory parameters of the six coffee samples (NG, NB, DGG, DGB, MG, and MB). Sensory tests were conducted in triplicate, and the Tukey HSD statistical test was performed, p < 0.05. Values followed by the same letter are not significantly different.
ParametersDG
Guatemala
N
Guatemala
M
Guatemala
DG
Brasile
N
Brasile
M
Brasile
crema4.3 b5.4 a1.0 c4.0 b6.1 a1.0 c
texture crema6.9 a7.2 a1.0 b6.8 a7.1 a1.0 b
smell6.4 a4.8 b2.4 c6.7 a5.5 b3.7 c
sour4.9 b4.7 b4.9 b5.8 a5.9 a2.1 c
sweet4.9 a4.1 b3.4 c4.4 b4.4 b3.4 c
bitter7.0 a7.2 a4.5 b7.0 a6.5 a6.2 a
balance6.6 a6.8 a5.5 a6.5 a6.5 a6.5 a
body4.8 b3.9 b1.8 d5.7 a6.1 a2.8 c
astringent5.4 a4.0 b2.1 c5.6 a5.4 a2.9 c
aroma6.4 a5.3 b3.3 c5.3 b5.9 b2.8 c
persistence aroma7.2 a4.4 b3.8 b6.7 a6.1 a3.7 b
Publisher’s Note: MDPI stays neutral with regard to jurisdictional claims in published maps and institutional affiliations.

