Review

An Interdisciplinary Review of Camera Image Collection and Analysis Techniques, with Considerations for Environmental Conservation Social Science

by
Coleman L. Little
1,
Elizabeth E. Perry
1,*,
Jessica P. Fefer
2,
Matthew T. J. Brownlee
1 and
Ryan L. Sharp
2
1
Department of Parks, Recreation, and Tourism Management, Clemson University, 263 Lehotsky Hall, Clemson, SC 29634, USA
2
Horticulture and Natural Resources Department, Kansas State University, 2021 Throckmorton, Manhattan, KS 66506, USA
*
Author to whom correspondence should be addressed.
Submission received: 13 May 2020 / Revised: 2 June 2020 / Accepted: 3 June 2020 / Published: 6 June 2020
(This article belongs to the Special Issue Machine Learning in Image Analysis and Pattern Recognition)

Abstract

:
Camera-based data collection and image analysis are integral methods in many research disciplines. However, few studies are specifically dedicated to trends in these methods or opportunities for interdisciplinary learning. In this systematic literature review, we analyze published sources (n = 391) to synthesize camera use patterns and image collection and analysis techniques across research disciplines. We frame this inquiry with interdisciplinary learning theory to identify cross-disciplinary approaches and guiding principles. Within this, we explicitly focus on trends within and applicability to environmental conservation social science (ECSS). We suggest six guiding principles for standardized, collaborative approaches to camera usage and image analysis in research. Our analysis suggests that ECSS may offer inspiration for novel combinations of data collection, standardization tactics, and detailed presentations of findings and limitations. ECSS can correspondingly incorporate more image analysis tactics from other disciplines, especially in regard to automated image coding of pertinent attributes.

1. Introduction

Camera usage is a valuable research tool, particularly due to the breadth of data collection and analysis facilitated by camera technology and related software [1]. In the discipline of environmental conservation social science (ECSS), cameras and associated image data are frequent methods in collecting information on human interactions with the environment [2,3]. Cameras are well suited to examine ECSS concepts and contexts, as image data and associated analyses can be wide ranging and capture similarly broad information. However, camera usage often requires careful attention to detail, a substantial timeframe, and significant researcher involvement, indicating opportunity for more efficient implementation.
Inspiration for more efficient implementation may come from any of the many disciplines that use cameras, yet camera usage and image analysis as a general method has yet to be systematically explored for cross-disciplinary insight and advancement. In this regard, the lens on camera methods remains smudgy. Because lessons from within and beyond ECSS could aid ECSS researchers in better employing camera methods, we present a systematic literature review of camera use and image analysis, framed by the theory of interdisciplinary learning, to examine trends and extract guiding principles for ECSS researchers.

2. Interdisciplinary Learning

There are substantial research benefits to looking beyond a particular discipline for context, inspiration, and new advancements [4]. Examining cross-disciplinary approaches can advance discipline-specific methods by identifying both singular methods and combinations of them applicable to new contexts.
Interdisciplinary learning provides a framework for understanding how and why cross-disciplinary knowledge can benefit a particular discipline [5,6]. The theory of interdisciplinary learning states that combining similar aspects of differing disciplines to reflect ideas and approaches both known and novel to a context is beneficial and effective for promoting rigorous intradisciplinary advancements [6].
Many studies have examined the benefit of looking beyond a particular discipline for context inspiration and new advancements [7,8,9]. Fewer have examined methods transferability across disciplines, though ones that have done so have been transformative. One example is the work of Alden, Laxton, Patzer, and Howard [10] on incorporating marketing methods into scientific research to better enact scientific policy advancement. Even fewer have examined camera methods in a cross-disciplinary or interdisciplinary manner, suggesting an area for further development. In ECSS in particular, interdisciplinary knowledge about camera methods remain rather underdeveloped outside of the general references to wildlife cameras being adapted and applied in visitor use management studies [11]. Therefore, we focus on synthesizing camera methods (data collection and resulting image analysis techniques) beyond wildlife and fisheries studies across disciplines to foster interdisciplinary learning in ECSS.

3. Camera Usage as a Research Method

Many types of cameras are used in research, such as handheld digital, field mounted, infrared, underwater, LAN-based, CCTV security, motion-sensing, airplane-affixed, and satellite-based cameras [12]. Analysis methods are correspondingly diverse, including manual coding, digital coding, automated coding, feature detection, and time-lapse sequencing, depending on the research aim [1]. There has been an increasing reliance on camera use as a research method in disciplines including natural, social, and technology sciences [1]. Two themes of camera usage are prominent across the literature: methodological similarities and differences across disciplines and time periods.

3.1. Methods Are Discipline Specific and Discipline Transcending

Camera-related research has both discipline-specific and discipline-transcending methodologies. Specifically, while certain methods are considered reliable practices solely in a particular discipline, others are considered reliable practices (with context-specific modifications) across several disciplines. For example, marine geological research uses boat-mounted cameras to map seafloor features, but other disciplines rarely report using these cameras [13]. However, the remote-sensing camera method of LiDAR is a major component of many environmental subdisciplines, such as agriculture, land use, and climate change research [14].
Discipline-transcending camera methods are typically those that have a longer history of use (an indicator of their reliability), are able to function alongside newer technologies, and are amenable to adaptations for specific contexts and questions [15]. Within ECSS, camera methods are both discipline specific and discipline transcending [15,16]. For example, participant-worn cameras to examine park-based recreation are unique to ECSS but camouflaging field cameras to examine park use has been adapted from other disciplines [15,17,18]. Indeed, many applications of camera methods in ECSS were originally adapted from studies centered on studying wildlife and other non-human animals [19].

3.2. Methods Have Evolved in Diversity and Complexity

Cameras have evolved from centering on large equipment with film and hardcopy photographs into small devices capable of digital images accessible by many computer-based interfaces [20]. As with other technological advancements, the shift in cameras from manual to automated processes and related capability to digitally capture, edit/enhance, and analyze images has increased the utility of cameras to research [20,21]. Manual coding involves someone examining the image data and assigning codes to attributes of interest, whereas automated coding uses analysis software and artificial intelligence to code these attributes [22]. YOLO: Real-time Object Detection [23], WUEPIX [24], and Amazon Rekognition [25] are a few examples of automated image analysis software.
Advancements in technology have had a noticeable impact on how cameras are used in research [20,26]. Early camera usage in research focused on providing visuals to complement evidence described in text format and not necessarily derived from the visual itself [27]. In recent decades, camera usage has shifted to become a method itself [26]. Pre-1995, camera methods focused on film [28] and manual coding [29]. Post-1995, the emphasis has shifted to digital images and automated coding [21], as well as a proliferation of the types of cameras used (e.g., satellite, surveillance). Recent advancements in computer technologies, such as cellular and satellite technologies, and automated image analysis software have further extended the utility of cameras from a research method in small case studies to a tool for big data investigations [30].

4. Research Questions

Despite the numerous research publications showcasing the diversity and complexity of camera methods, and the method’s future applicability, there has not been a synthesis of this breadth and its evolution to document patterns of novelty and commonality [31] to facilitate interdisciplinary learning broadly or in ECSS in particular. It appears that inquiry into the subject has focused on a subset of the broad methodology, such as reviewing techniques within facial recognition [32] or remote sensing [33], analyses based on neural network segmentations [34] or classification systems [35], or medical database retrieval accuracy for image data [36]. A review across techniques, analyses, and disciplines appears to be lacking. We address this general need for camera method interdisciplinary learning and devote particular attention to ECSS by focusing on four primary questions:
  • In what contexts have cameras been used in general?
  • In what contexts have cameras been used in ECSS?
  • What are common image collection techniques for image data?
  • What are common analysis techniques for image data?
In synthesizing general and ECSS-specific patterns, we aim to draw conclusions for interdisciplinary learning and related recommendations [37,38].

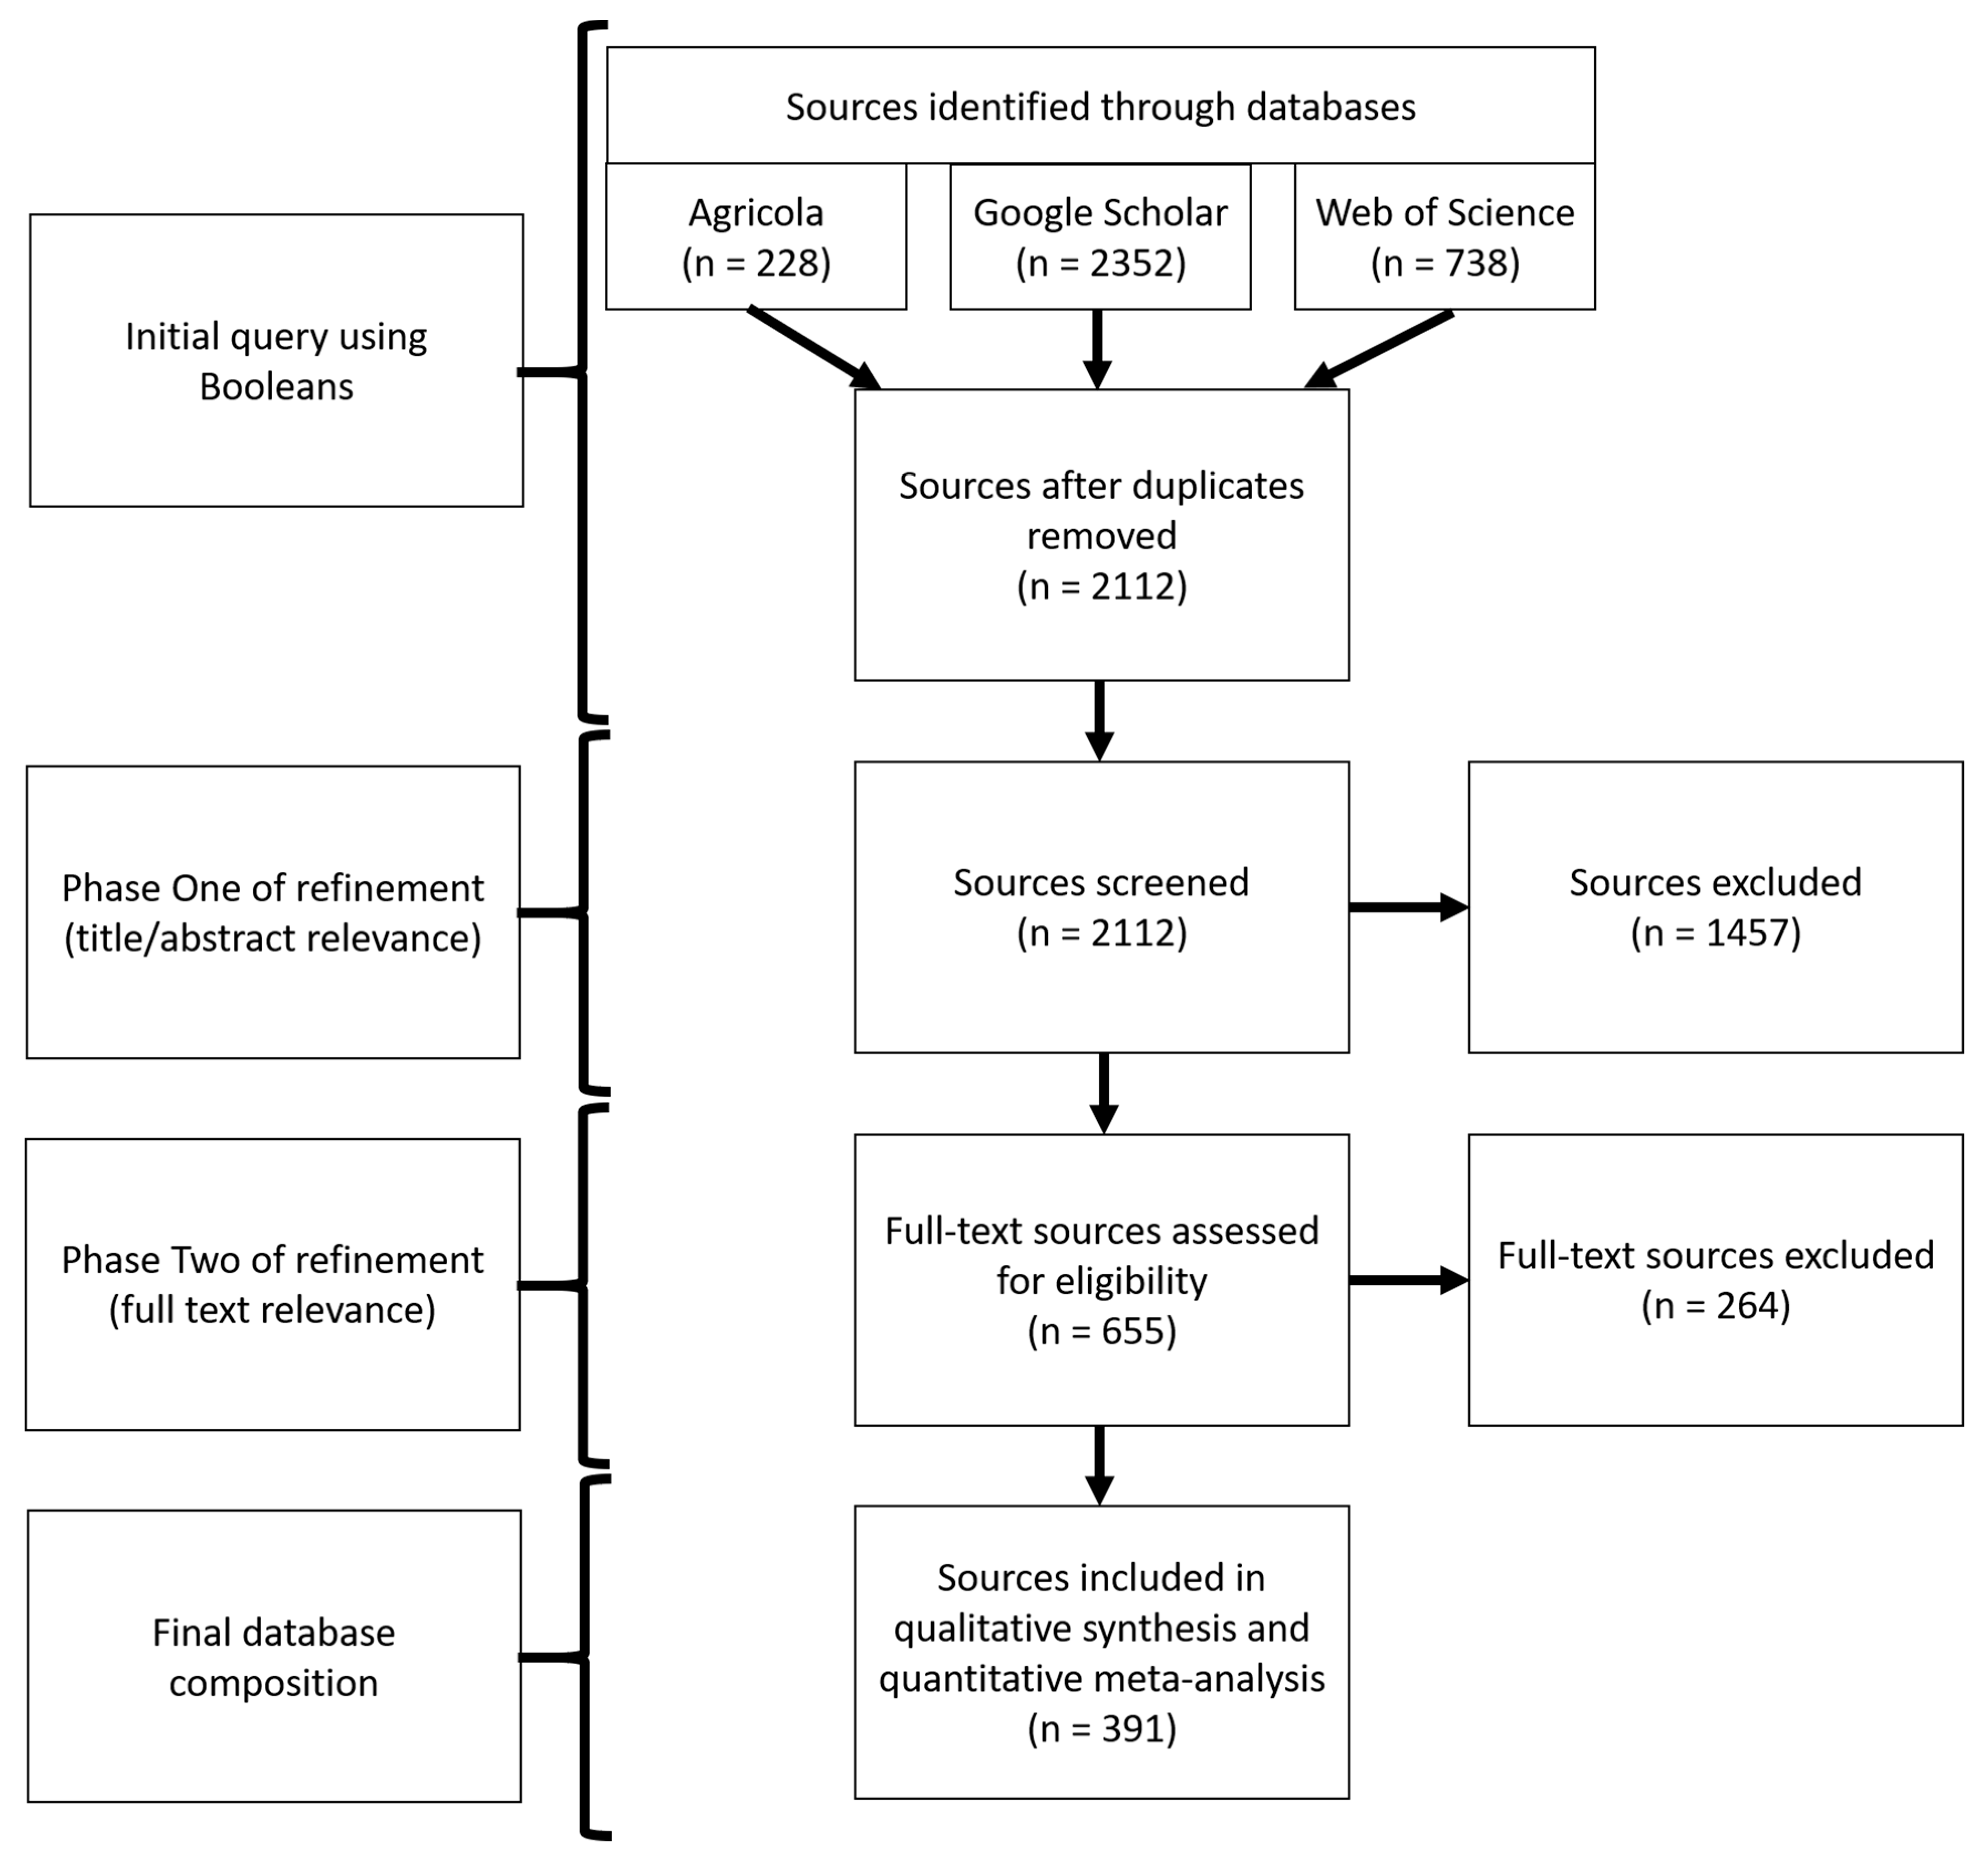
5. Materials and Methods

We performed a systematic literature review [39], examining studies that used camera methods and image analysis. Our review conformed to PRISMA guidelines [40], modified slightly for study-specific aims (Figure 1). PRISMA guidelines list standard and transparent steps in the harvesting, analyzing, and reporting of data. We followed all steps for the harvesting of data (Figure 1) and reporting on all section/topics in the PRISMA checklist [40]. Modifications to the PRISMA process were in the analyzing of these specific data, as we qualitatively coded a variety of sources and some features of PRISMA’s primarily quantitative evaluations of randomized trials did not directly apply to this particular context or framing (e.g., source bias, meta-regressions). This methodology yielded thousands of documents that were systematically sifted to create a subset of documents relevant to our research questions.
The author team defined keyword criteria for inclusion. After gaining general content familiarity through searches for publications, we refined the inquiry to four primary search terms using Boolean operators: “camera*” AND “image*” AND “image analysis*” AND “image data*”. To filter the general results from this first broad search, we conducted a series of 15 additional searches, each with an added keyword phrase to these four primary search terms, to focus the inquiry. The additional keyword phrases (e.g., common image analysis software platforms) and key terms related to ECSS used in conjunction with these four primary search terms were “Amazon Rekognition*”, “activit*”, “artificial intelligence*”, “attribute*”, “cod*” [for coding-related terms], “distribution*”, “Google Vision”, “park”, “protected area*”, “recreation*”, “timelapse*”, “use level*”, “visitor*”, “Wuepix*”, and “YOLO*”.
After an initial query into the utility of multiple databases, three were selected: Agricola, Google Scholar, and Web of Science (Figure 1). These databases were purposefully selected to capture a breadth of sources from peer-reviewed journals to theses/dissertations to management reports. We then conducted the final literature search from November 2018 to January 2019.
Exclusion criteria were used to capture the breadth of sources and disciplines but retain parameters. An overarching exclusion criterion was wildlife and fisheries discipline sources, as the high volume of sources pertaining to camera traps in that discipline would have otherwise overshadowed the sources pertaining to camera and image data in other disciplines. Furthermore, because cameras are a well-established methodology in wildlife and fisheries, reviews of these techniques have already been published [38,41,42,43,44]. Therefore, so as to not take away from the ECSS focus of this literature review, 102 sources screened but relating to wildlife and fisheries research were excluded from the final dataset. Relatedly, we did not include “camera trap” or other wildlife-specific terminology in our search terms. Beyond this general criterion, three additional exclusion criteria filtered the results from the remaining relevant sources. Sources must be: (1) published in peer-reviewed journals, as theses/dissertations, as conference proceedings, or as technical reports; (2) written in English; and (3) available to the researchers via full-text online or through Interlibrary Loan.
The assessment of relevance detailed in Figure 1 refined the thousands of sources for study inclusion to 391 (see Supplementary Materials). First, the title and abstract (or similar information if an abstract was not provided) of 3318 keyword search results were examined for initial relevance (i.e., does the title/abstract actually discuss issues germane to the keyword search?). A subset of the author team methodically assessed which specific search terms and related phrasings best fit the scope of the sources, determined the categorization of these sources, and employed consistent practices to systematically assess relevance. Three criteria characterized this process for potential inclusion at this stage: 1. each source had to mention both camera use in research and a corresponding image analysis in its title and/or abstract; 2. each source had to describe research from an image dataset (i.e., no reviews or syntheses); and 3. each source had to consist of more than just a title and abstract (i.e., an actual source had to accompany the title/abstract). The majority of the sources returned via the keyword searches did not contain all three of these characteristics (e.g., camera usage was merely a subsection of a certain procedure outlined rather than a detailed explanation regarding the collection and processing of camera data) and thus were excluded.
This first phase, plus removing duplicates, reduced the relevant sources to 655 for potential inclusion. In the second phase, these sources were downloaded and read in full. The author team divided reading these sources, assessing their relevance, and, if relevant, entering them into the study database. Intercoder reliability measures were employed to minimize discrepancies among data entries [45], with two members of the author team acting as the primary and secondary data enterers, respectfully, and performing checks on the others’ work. This approach helped increase standardization and decrease individual bias, ensuring that each coder was following a substantially similar approach to entering sources into the database and eliminating non-relevant ones. It did not fundamentally alter the number of sources inputted, but rather the consistent quality of metadata entered about each source. Upon full review, 391 sources (62%) were deemed relevant and entered in the study database. This database captured source metadata (e.g., citation information), camera(s) details used in the research, image analysis technique(s), key study findings related to the topic, and key study findings related to camera use and image analysis. The 264 sources omitted as irrelevant were excluded mainly because they only made tangential reference to cameras and their application, rather than as a method for the study itself.
Following the team’s entry of the 391 relevant references into the database, the resulting dataset was coded and analyzed. This analysis was led by the primary and secondary data enterers, as they were most familiar with the data corpus, with assistance from the full team. Six attributes of database entries were qualitatively coded into key themes within each attribute [45]: research discipline, country and continent of study, camera type, camera placement, data collection method, and data analysis method. Other database categories (e.g., publication year, number of image attributes examined) lent themselves to purely quantitative analysis. Descriptive statistics were generated and comprise most of our analysis.
The Supplementary Materials accompanying this manuscript lists the 391 sources analyzed in this systematic literature review, including their citation information and permanent access links (e.g., DOI). Each source has a unique ID: S (for “source”) 001–391. Hereon, we reference examples of sources by their unique IDs. This format highlights examples across the breadth of this large dataset while constraining superfluous in-text citations. We encourage readers to examine the supplementary file for citation information for a particular example or across the entire corpus of sources.

6. Results

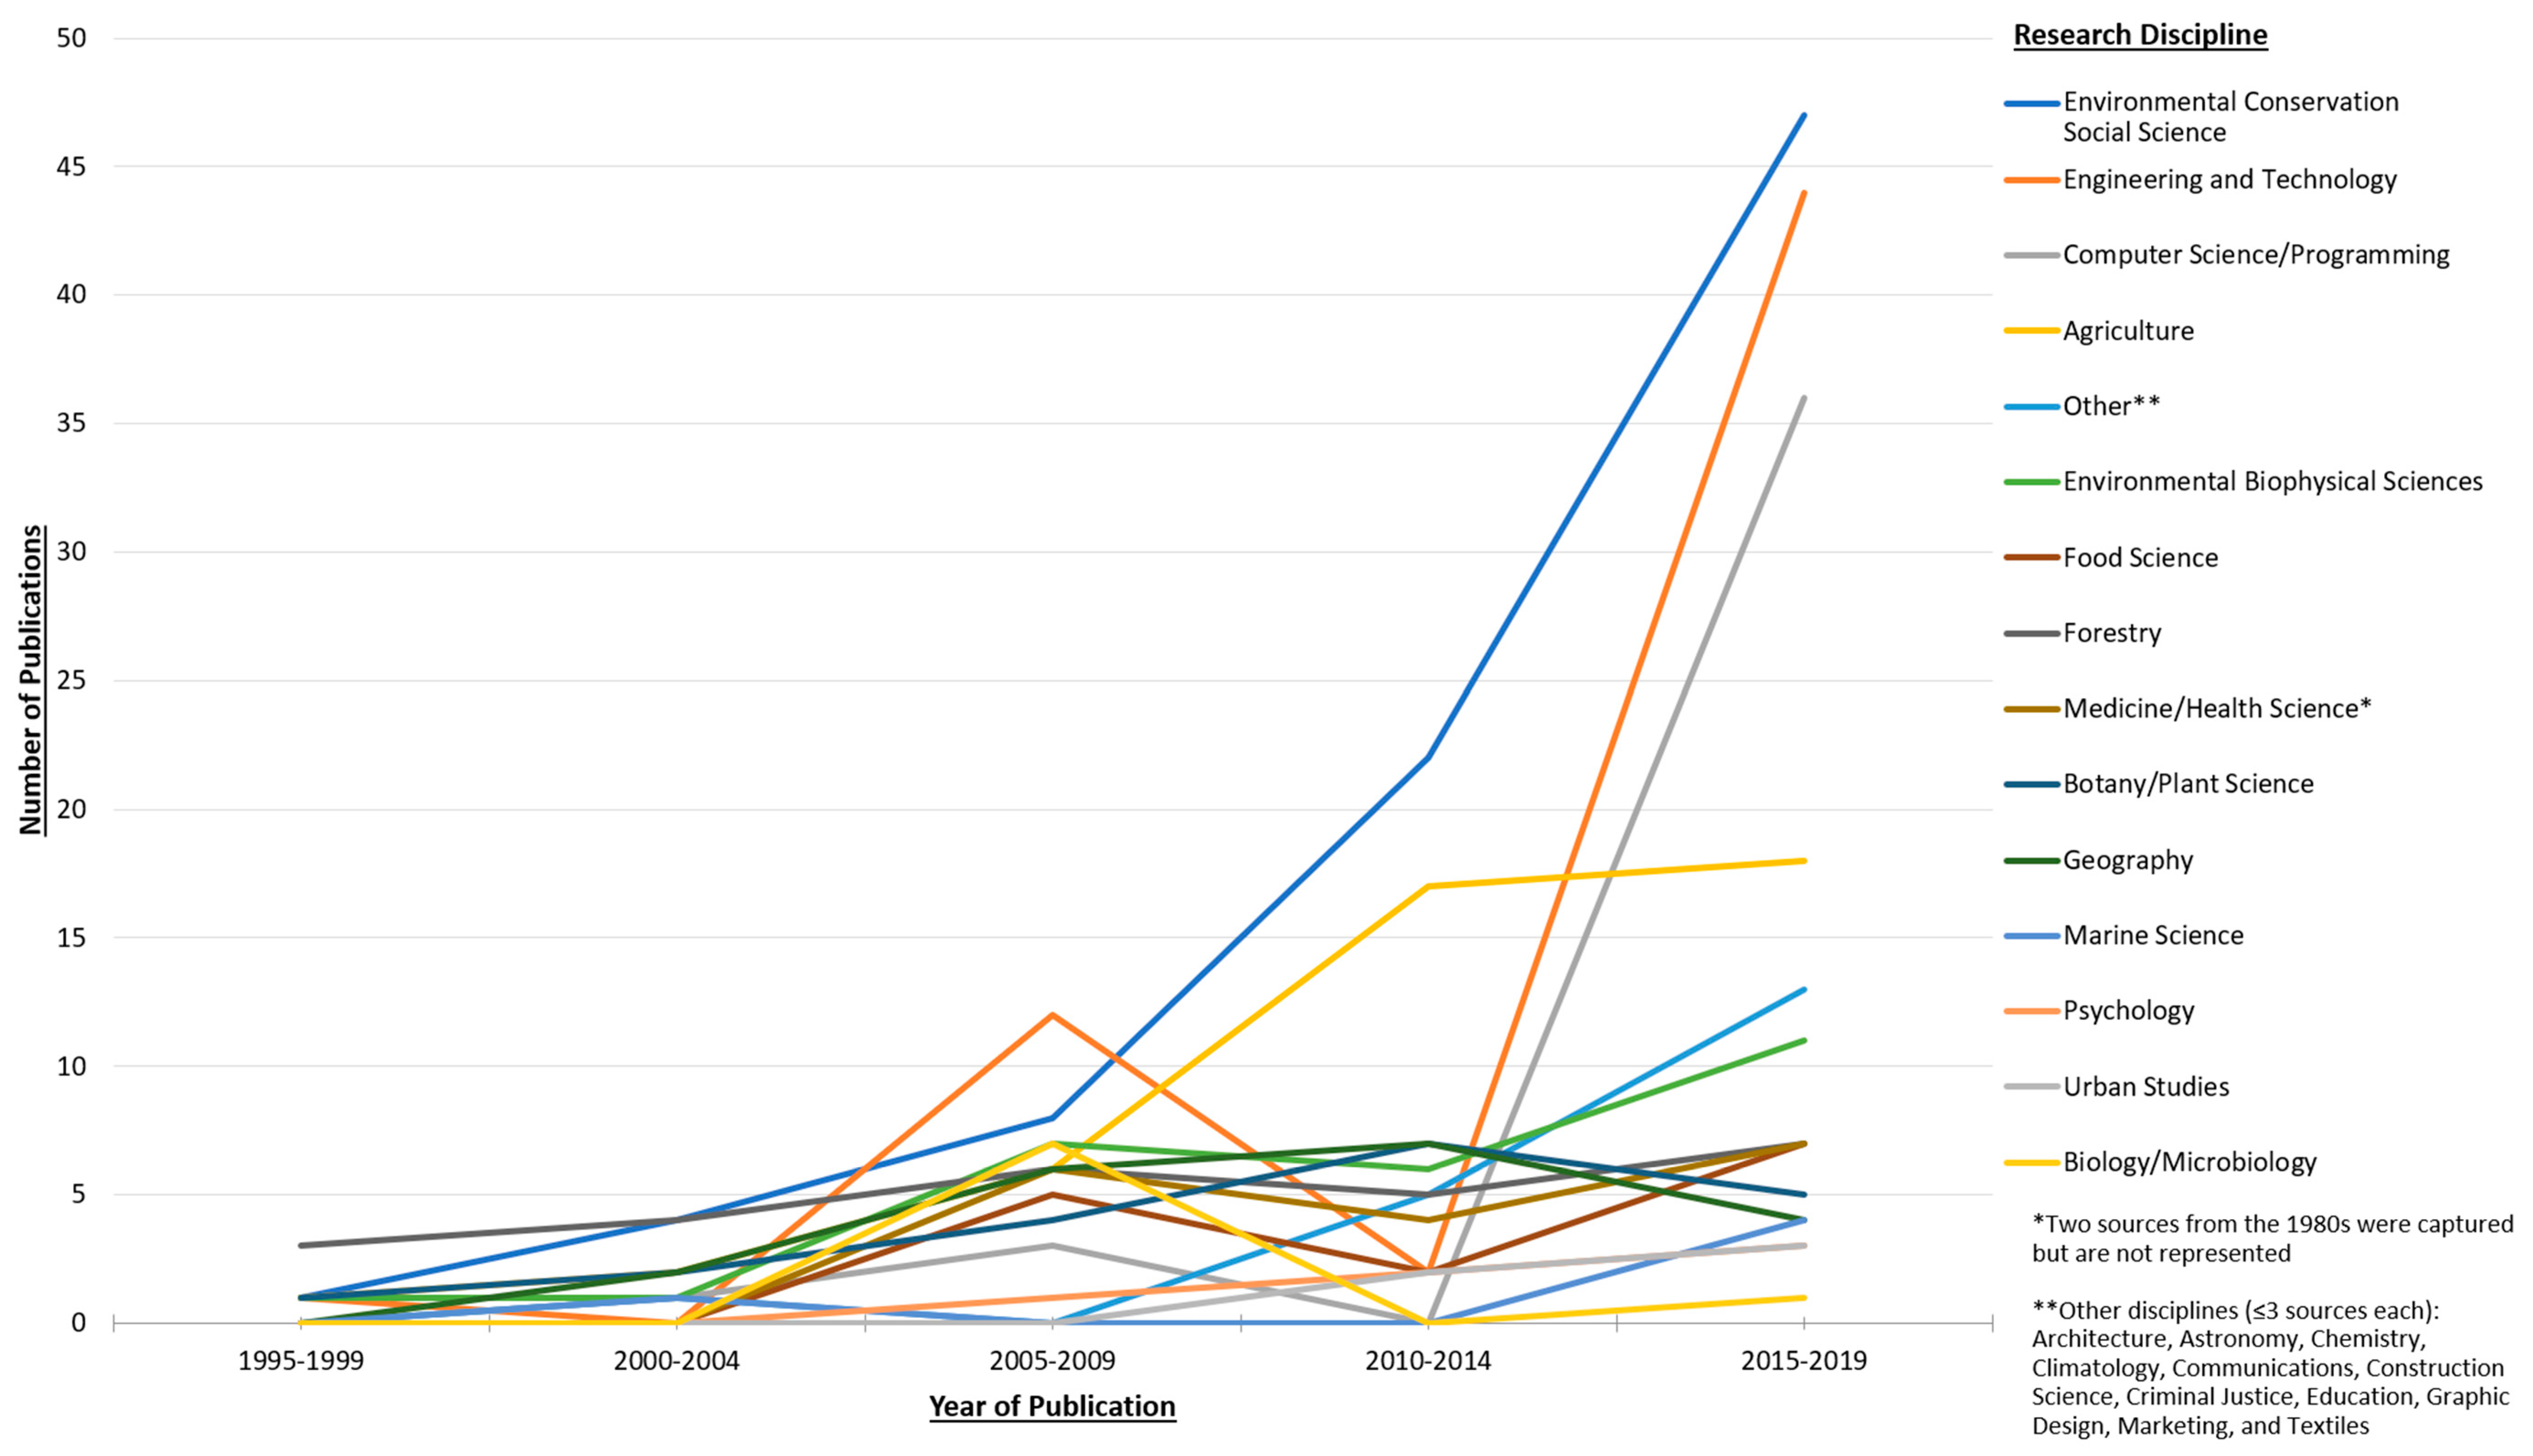
6.1. Contexts of Camera Use in General

Cameras have been used and discussed in a variety of contexts: research disciplines, years, and continents (Table 1). The majority of the sources (74%) were peer-reviewed articles, followed by dissertations and theses (20%), reports (5%), and conference proceedings (1%). Fifteen general research disciplines were apparent, which are used as our main grouping criteria throughout this study (Table 1). The four most prevalent were ECSS (21% of the sources), Engineering and Technology (15%), Agriculture (11%), and Computer Science/Programming (10%). The other 11 each accounted for <6% of the publications (Table 1). Examples of the more prevalent disciplines include an ECSS study that used images from drones in England and Portugal to classify sections of protected areas by main use (e.g., wildlife habitat, ecotourism, law enforcement) (S203) and an Engineering and Technology study also using drones, but to test image quality software and facial recognition technology at varying distances and lighting conditions (S140).
Camera use in research has increased substantially in the past 25 years. Publication distribution over time (Figure 2) depicts this increase, especially in the past 10 years for ECSS, Engineering and Technology, Agriculture, and Computer Science/Programming.
The locations for these studies span countries on six continents and some international collaborations (Table 1). Study locations across research disciplines were most common in North America (37%), particularly in the USA, followed by Europe (22%), Asia (19%), Australia and Oceania (6%), multinational/cross-continental (4%), South America (4%), and Africa (3%).
Most of the sources (77%) focused on a sole attribute (e.g., counts or percentage cover of a particular species or landscape formation, detection/recognition of human faces or a particular person). The remainder focused on two (17%), three (2%), 4–10 (3%), or >10 (1%) attributes. The studies that examined 2–10 attributes focused mainly on presence/absence or percent cover of these attributes (e.g., categories of ecosystem services, frequency of chemical compositions). The five publications that focused on >10 attributes mostly concerned different vegetation or land use classes. Although almost all publications listed the year(s) in which these attributes were collected, only 25% listed specific sampling times. These were mainly those in Botany/Plant Science examining vegetation with seasonal foliage (e.g., S199) and those in ECSS examining peak visitor use times (e.g., S239, S362). The number of attributes considered in camera-based studies is an important measure given the opportunities and challenges associated with analysis strategies. The more attributes to characterize in an image, the more difficult and time-consuming analysis becomes, whether manual or automated.

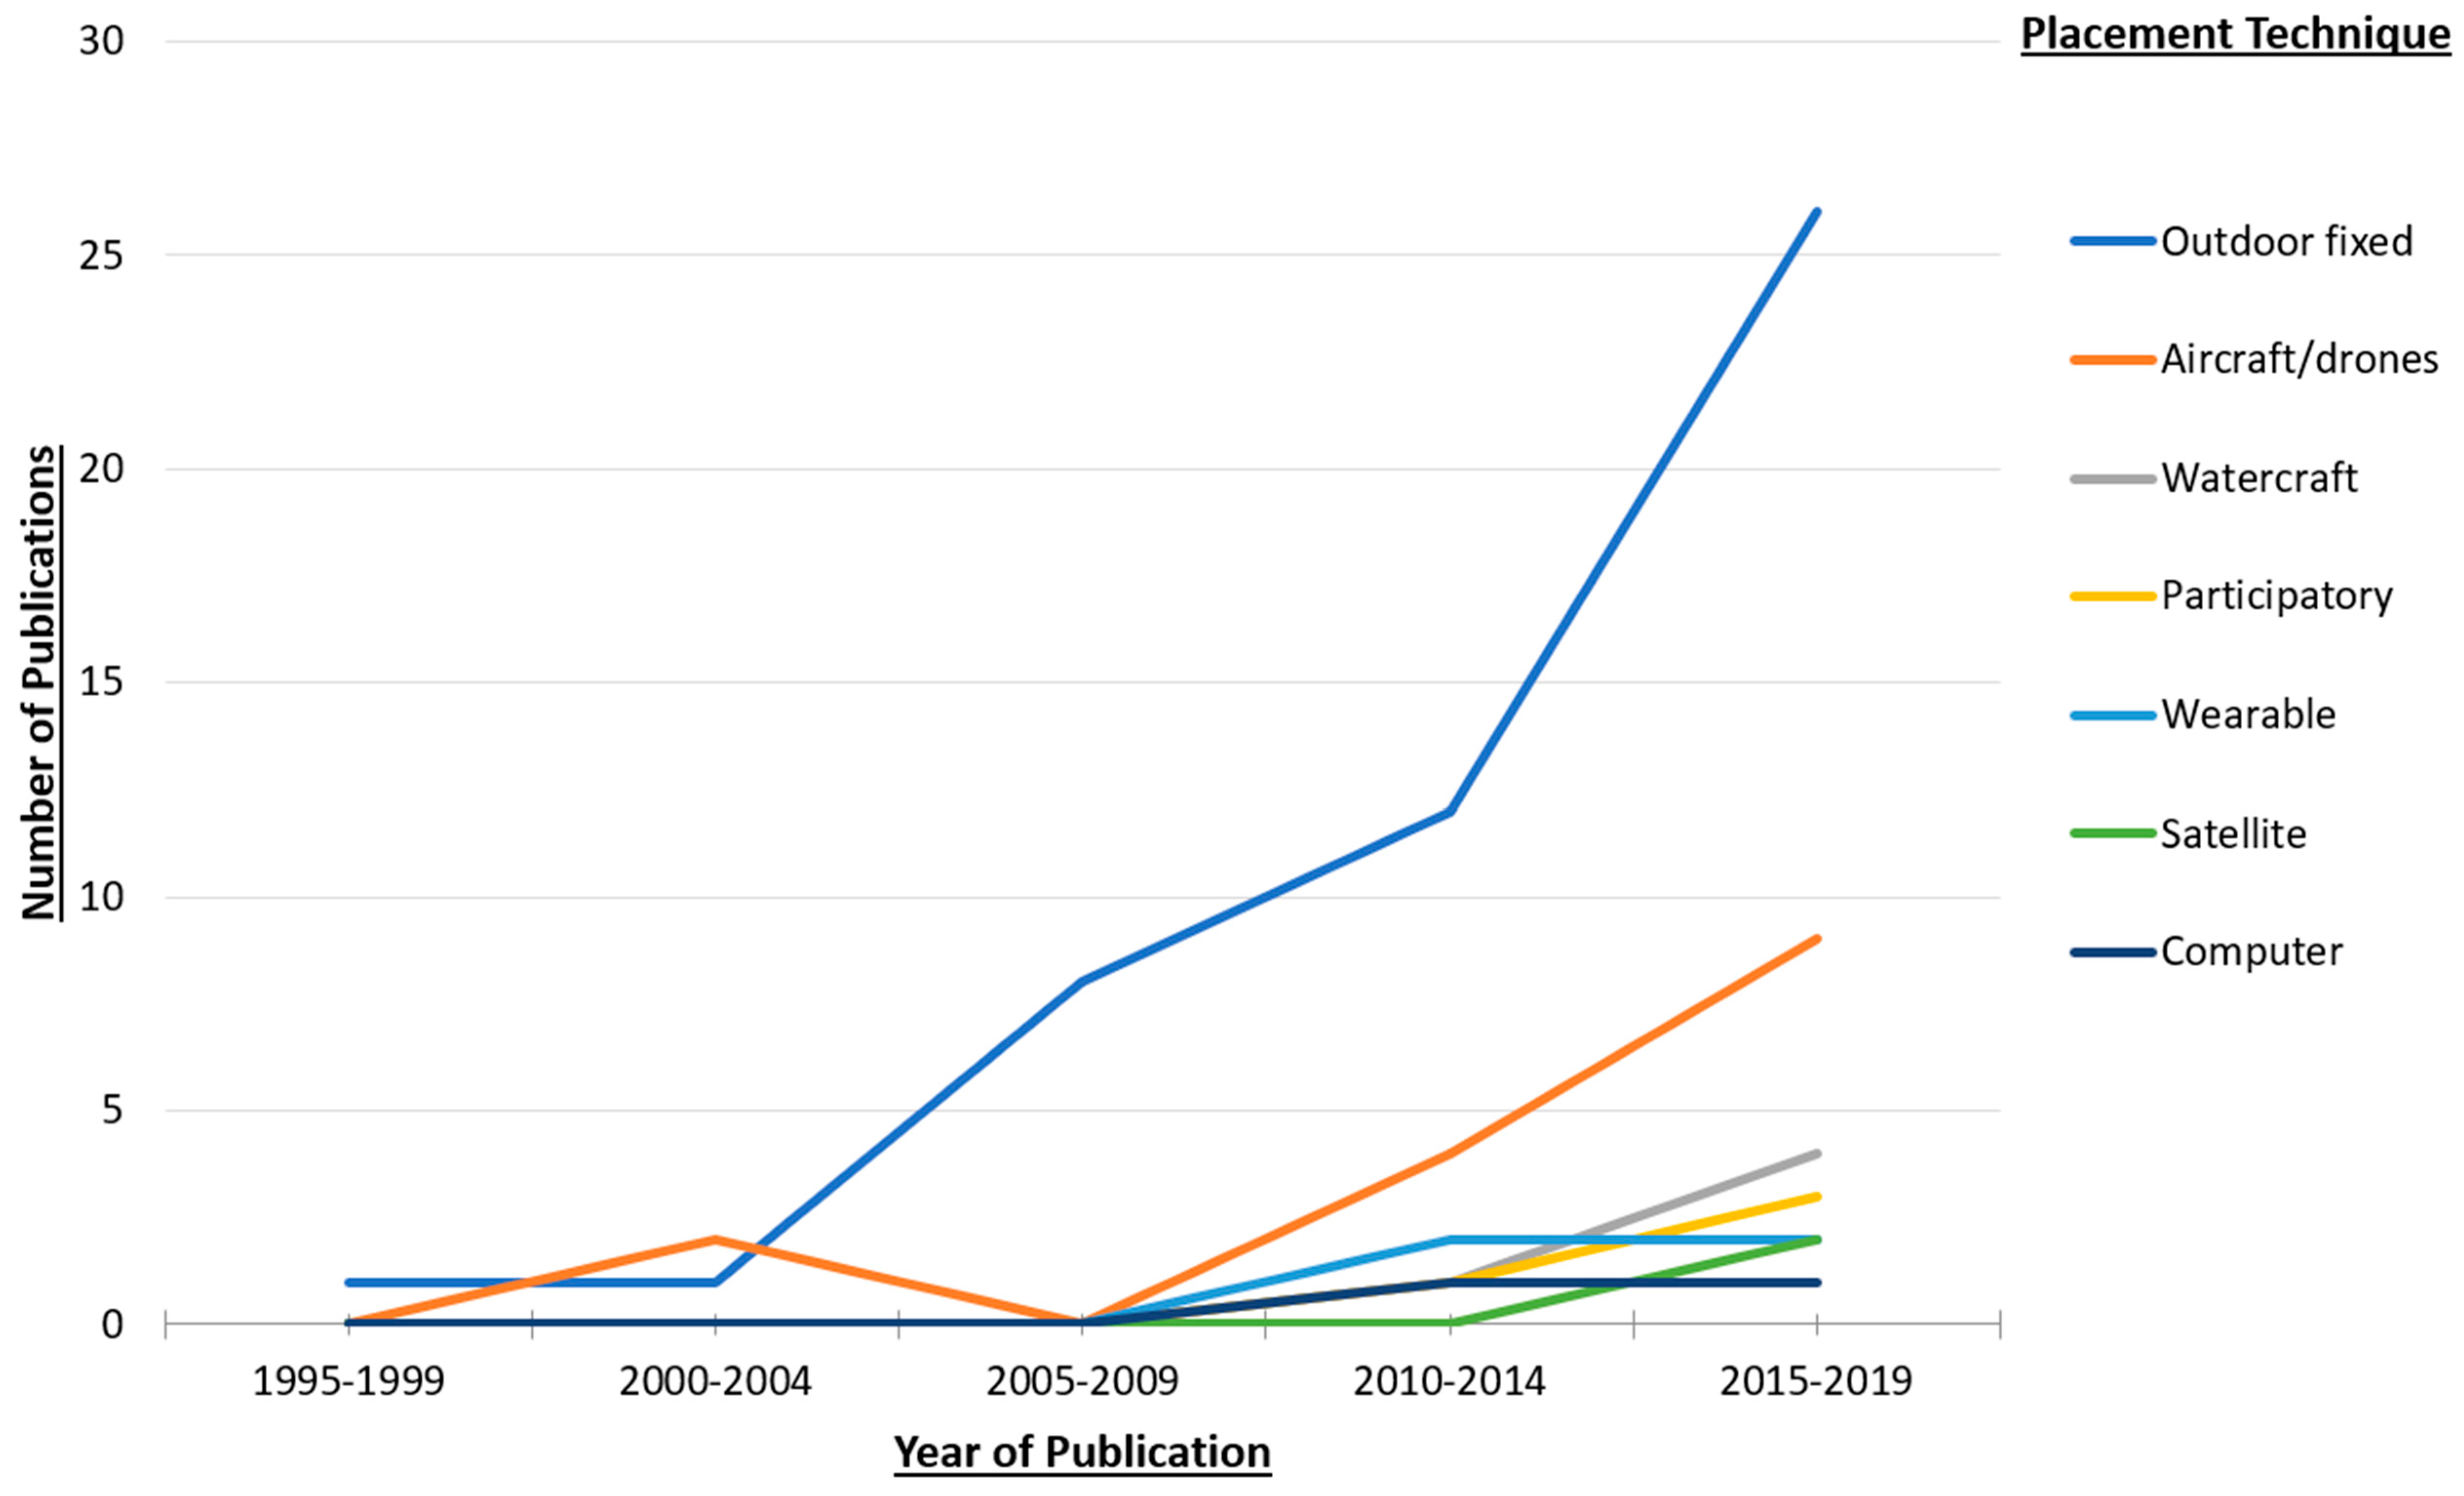
6.2. Contexts of Camera Use in ECSS

Environmental conservation social science sources were the most numerous by a few different metrics. They were the most frequently represented across articles, conference proceedings, and dissertations/theses (Table 1). The production rate of these publications has been pronounced, especially in the last decade (Figure 2). For example, ECSS publications comprised 31% of the total sources included from 2010–2014 and 23% since 2015. Of the 15 research disciplines represented, ECSS was the only one to have publications concerning all six continents (Antarctica had no studies), as well as international/multinational domains. It was also the most numerous across each continent and context, except in South America where Food Science had one more publication. Almost a quarter (23%) of all the ECSS publications focused on studies in the USA.
Categorical codes were applied to attributes within ECSS studies, to examine the major areas within ECSS that are using camera image analysis. Ten categories emerged: park visitor use management (24%), human–wildlife interactions (22%), recreation ecology (17%), general tourism (9%), public participatory GIS-PPGIS (6%), recreational behavior (6%), sports tourism (including extractive sports, e.g., hunting, fishing) (6%), urban tourism (6%), climate change (2%), and environmental education (1%). Because ECSS is an inherently applied science, all of the categories also encompass a “planning” aspect for managerial use (e.g., park managers, urban planners).

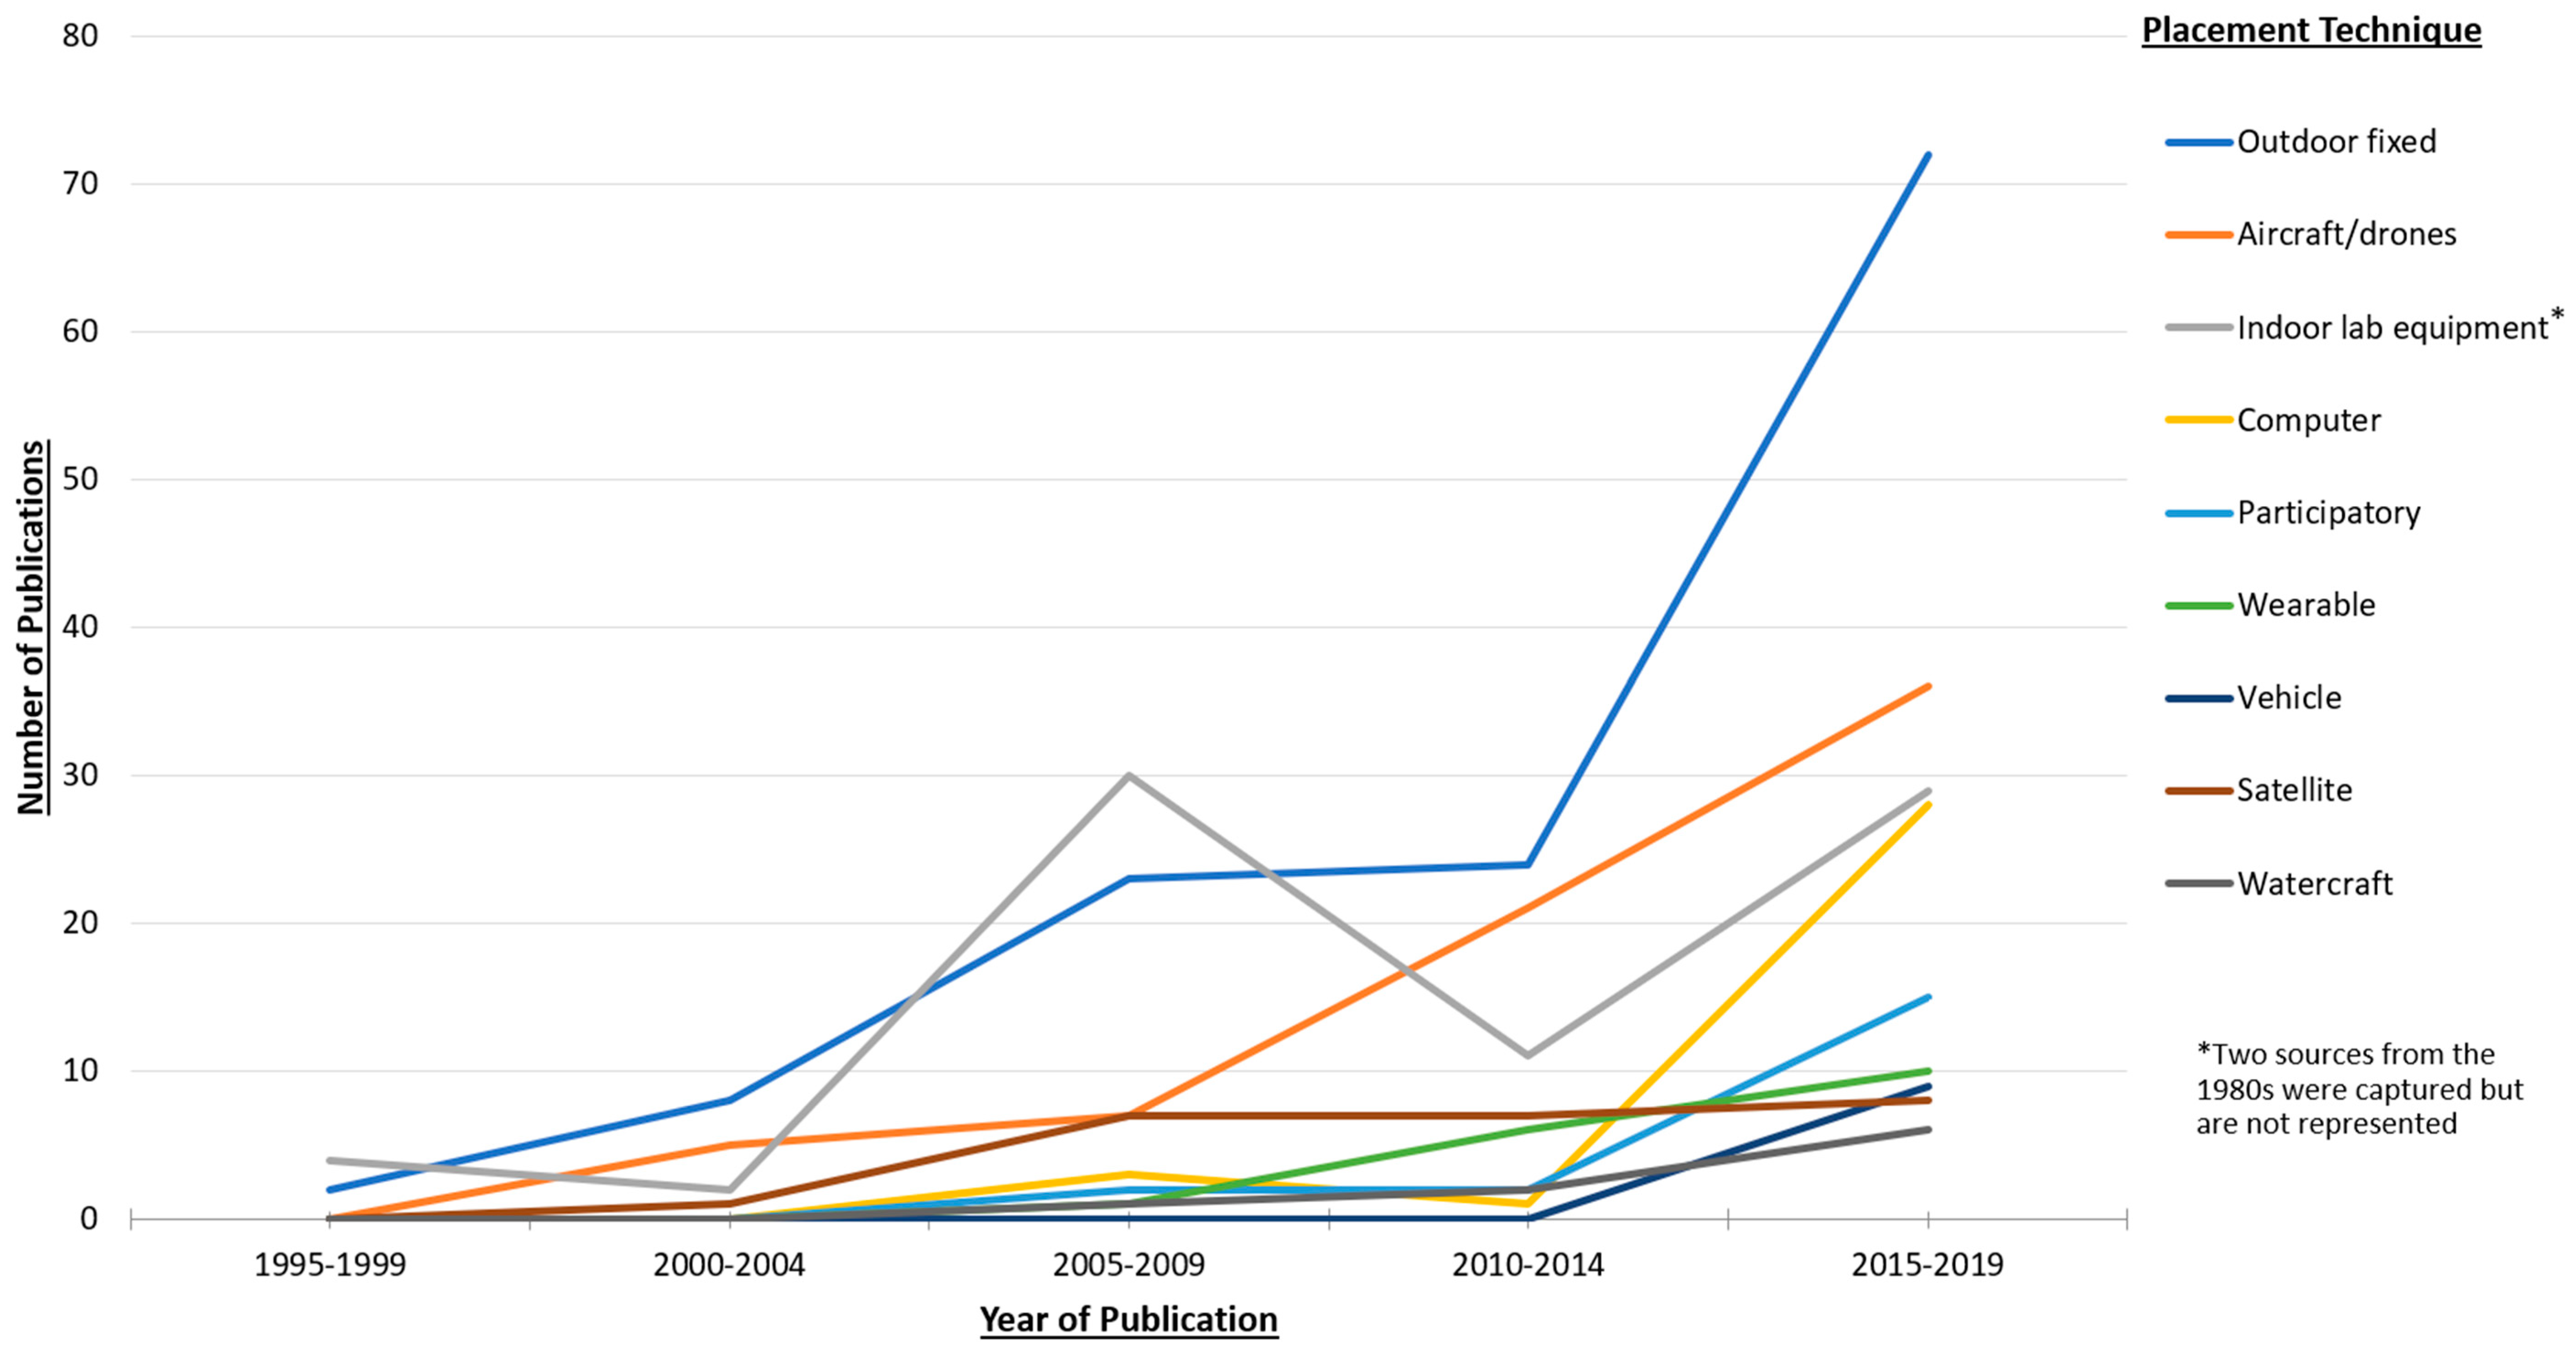
6.3. Common Data Collection Techniques

Almost all, 97% (n = 380), of the sources stated at least a general camera type (e.g., webcam, two thermal cameras) and 49% of these detailed the specific camera make and model. For ECSS publications in particular, 41% specified a camera make and model.
Words used to describe the quality of the images obtained in each study were indifferent to positive (e.g., fair, average, decent, good, great, precise, high resolution), with 11% (n = 42) of those with a description of image quality forgoing an adjective in favor of listing the pixel resolution. ECSS publications were more apt to describe variability in the images. Whereas this was mostly absent from descriptions in other disciplines, 16% of the ECSS sources with a description noted fuzziness, shakiness, weather-related clarity issues, or, in the case of participatory research, variability according to the user (e.g., S022, S148, S367).
Data were collected through a variety of camera placement techniques. Most of the publications, 92% (n = 361), mentioned the primary camera placement technique in their methods: mounted to outdoor fixed location (32%), indoor lab equipment (20%), aircraft/drones (18%), computer (9%), satellite (6%), participatory (participant used in-person or online) (5%), wearable (researcher worn) (5%), watercraft (2%), or vehicle (2%). Of the 80 ECSS publications listing the primary camera placement, 60% were in outdoor fixed locations and 19% used aerial imagery. The aerial imagery for ECSS was mainly obtained through drones (e.g., S137, S160), whereas aerial imagery across the whole dataset was mainly obtained from aircraft-affixed cameras (e.g., S019, S065, S096, S255). ECSS also had the most sources using participant-worn cameras (e.g., S082, S120, S345, S348).
While all placement techniques have generally increased over the past 25 years (Figure 3), increases over the past 10 years are especially pronounced for outdoor fixed, aircraft/drones, and computer mounted techniques. In some cases, data from multiple scales and placements were used. For example, aerial or satellite imagery was paired with ground-truthed transect line images to examine: leafy spurge in wildland areas (S040), proportions of live versus burned or cut vegetation across the western USA (S146), and sources of impact (including recreation) to coral reefs in a marine protected area (S253). Although many camera placement technique usage rates still occupy a relatively small proportion, the general trend is that placement technique diversity is growing, with multiple data collection formats represented. ECSS sources illustrate this trend (Figure 4), with diversity increasing over the past decade even without indoor lab equipment or vehicle placement techniques represented.
The majority (78%; n = 304) of sources contained at least one recommendation related to camera-based data collection. Across disciplines, the most common recommendations concerned best practices for using digital cameras when researchers were using fixed/mounted cameras (46%), with a specific recommendation to standardize distance between the camera and object/phenomenon of interest being paramount. Beyond this, specific camera features were noted. For example, an Engineering and Technology paper on combustion behaviors in a coal furnace found that quality high-speed camera features were crucial (S185). The second and third most common recommendations also concerned digital cameras, but specifically those in fixed locations that took automated images outdoors publicly (12%) and covertly (9%), respectfully. Recommendations for publicly located fixed cameras were present in 11 disciplines, indicating interdisciplinary salience, whereas recommendations for covertly located fixed cameras were only present in six disciplines and were especially concentrated (61%) in ECSS. Common examples of recommendations for publicly located cameras included having capacity for nighttime and infrared image capture (e.g., S226, S307), considering the stability of the mount’s substrate (e.g., S237, S271), and embedding metadata including GPS location into each image captured (e.g., S018).
An observed pattern in key recommendations by discipline is that some disciplines are highly specialized in a subset of particular camera data collection methods whereas others are more dispersed. We coded 46 different types of camera data collection recommendations. ECSS and Engineering and Technology addressed at least half of these types. At the other end, Biology/Microbiology, Geography, Psychology, Marine Science, and Urban Studies had sources addressing <20% of these types. We collapsed these 46 types into six overarching categories: fixed/mounted (14 methods; 211 sources), held/worn (7 methods; 78 sources), alternate/modified image capture (8 methods; 42 sources), moving (9 methods; 91 sources), multiple (3 methods; 8 sources), and security/surveillance (5 methods; 37 sources) (Table 2). As the distribution in each category suggests, some data collection methods (e.g., multiple cameras) have many recommendations centralized on a few techniques and others (e.g., fixed/mounted cameras) have more dispersed recommendations across many techniques.

6.4. Common Image Analysis Techniques

Only 142 sources (36%) offered data analysis recommendations (Table 2). We coded these recommendations into 44 different analysis procedures, grouped within five more general categories: automated (23 techniques; 46 sources), geospatial (2 techniques; 29 sources), LiDAR (1 technique; 3 sources), manual (12 techniques; 41 sources), and mixed-methods (6 techniques; 23 sources) analyses. Automated techniques included analyses with customizable software such as YOLO, Google Vision, Amazon Rekognition, and eCognition. An example of this is combining a new method of active learning in YOLO with an incremental learning scheme to accurately code vehicle-mounted video camera images (S185). Geospatial techniques focused on particular spatial data attributes, such as types and resolutions of satellite imagery that adequately captured forested, urban, and benthic features (e.g., S014, S035, S129). LiDAR highlights the utility of remote sensing in monitoring long-term impacts of natural processes like the time-lapsed mapping of vegetation growth in forest habitats using LiDAR surveying methods (S280). Manual analysis was concentrated in the labor-intensive process of human coding of primary and secondary (e.g., social media images) data. Although labor-intensive, many sources cited the increased accuracy of the manual coding as preferable over current, accessible automated techniques (e.g., S130, S351) and some offered novel ways for coding large datasets, such as utilizing citizen scientists (e.g., S335). Finally, mixed-methods analyses combined automated and manual techniques, a “human-in-the-loop” approach, to validate automated methods with a sample of human-coded images from the same dataset. A common example used human-in-the-loop approaches to test whether facial recognition software could accurately recognize people, human features, and/or emotions (e.g., S024, S113, S162, S275, S349). As the distribution of techniques and sources across categories implies, some analysis techniques (e.g., geospatial) have many recommendations centralized on a few procedures and others (e.g., automated) are more dispersed across procedures.
The majority of disciplines exhibited concentration of analyses within particular methods. Ten disciplines had at least half of their sources within one category of analysis. Medicine/Health Science was most concentrated, with 75% of its recommendations concerning manual analysis. Many disciplines were concentrated within two analysis categories: Environmental Biophysical Sciences (50% geospatial, 50% manual), Geography (57% automated, 43% geospatial), Marine Science (33% automated, 67% geospatial), Medicine/Health Science (25% automated, 75% manual), and Psychology (50% automated, 50% manual). Agriculture, Computer Science/Programming, and ECSS had all five analysis categories represented. In ECSS, half of the sources had manual coding recommendations (relatively high for the dataset) and only 10% had automated coding recommendations (relatively low for the dataset).

7. Discussion

Our systematic review indicates an increase in the use of camera methods over the past 20 years, and a related proliferation in types of image analyses. However, camera data collection and image analysis techniques have largely developed within disciplines, limiting the ability for collaboration and interdisciplinary learning. Framed by interdisciplinary learning theory, the following synthesizes patterns in camera usage and image analysis, as well as overall best practices and ECSS-specific recommendations.
Although discipline and study-specific contexts will require adaptations, standardized data collection methods and automated analyses can assist in interdisciplinary learning. Technological advancements have facilitated increased camera use and complexity of analyses. Manual coding is more time consuming but requires less sophisticated knowledge of complex software and computer scripts. Several disciplines are utilizing automated analyses and researchers in these disciplines could provide cross-disciplinary guidance for further usage of these analyses. As ECSS uses camera-based data collection but rarely uses automated analysis methods, this discipline in particular could benefit from interdisciplinary collaborations on types of automation and relative benefits and costs.

8. Camera Usage

Few sources make recommendations about camera usage. Those that do tend to focus on standardization techniques for manually taken images. Beyond this specific type of recommendation, our review suggests three areas for best practices: (1) harness the capability of digital datasets to examine multiple locations and attributes, which may be across disciplines; (2) be intentional and specific about documenting study and camera details for other researchers; and (3) examine camera research outside of your own discipline for inspiration.
Although the purposes for image use and study contexts vary across and within disciplines, studies tended to focus on a single attribute obtained from outdoor mounted cameras and in locations concentrated in Europe and North America. Within ECSS, studies most commonly focused on park visitor use management, human–wildlife interactions, and recreation ecology. These patterns suggest an opportunity to expand in geographic settings and to harness automated analysis methods to code beyond a sole attribute. LiDAR and satellite-based camera technology have gained prominence and may offer a means to collect data from more locations without the associated researcher costs of geographic expansions. These techniques also suggest opportunity for researchers in different disciplines to share a common dataset while focusing on attributes of discipline-specific interest. For example, satellite-based image data covering a designated cultural landscape could provide information pertinent to Agriculture and ECSS.
Camera usage should be detailed further to enhance replicability. This could be through additions as simple as stating the specific camera model used and specific data collection timeframe. Metadata could detail image quality beyond simple adjectives, so that other researchers could assess method utility to their contexts. Few papers detailed specific image quality aspects, indicating that a baseline for comparison across camera types might be warranted for standardization (e.g., defined scales and notations).
Some disciplines are more specialist, and some are more generalist. This provides an opportunity to examine novel designs. For example, although ECSS uses the largest diversity of camera placement methods, these tend to be concentrated in fixed and mounted designs. Other disciplines may offer inspiration for using other combinations of methods and placements. Differential LiDAR use across disciplines provides a specific instance of interdisciplinary learning for ECSS. LiDAR is mostly applied in large landscape contexts to classify vegetation growth for natural resources and agricultural studies. Although ECSS has the fastest growth rate of camera method use compared to other disciplines (Figure 2), it has yet to incorporate LiDAR. To date, ECSS largely uses cameras for counting attributes within an image (e.g., visitors, vehicles, boats) to understand types and frequencies of human behaviors in an environment. ECSS also uses cameras to understand place-based experiences through participatory camera methods. Both applications tend to occur on the site, rather than landscape, scale. Sub-disciplines within ECSS, such as recreation ecology, might benefit from using LiDAR to detect landscape level differences in ground cover over recreational uses and longer temporal scales.

9. Image Analysis

Sources used a range of image analysis techniques within automated, geospatial, manual, LiDAR, and mixed methods but only approximately one-third (35%) offered recommendations for image analysis. We offer three fundamental practices for researchers to enhance interdisciplinary learning opportunities: (1) list and provide critical analysis of image analysis methods; (2) examine image analysis techniques beyond those typically utilized in a particular discipline; and (3) standardize guidelines for certain analysis techniques, particularly ones that are discipline specific but may have applicability across disciplines.
Disciplines favor particular categories of image analysis. This concentration implies disciplinary expertise but also areas for more creative interdisciplinary insight. Several disciplines continue to rely on manual coding techniques (e.g., ECSS, Medicine/Healthcare), while others have developed automated processes (e.g., Agriculture). This discrepancy reflects a lack of interdisciplinary sharing and but also a necessary emphasis on case study approaches. For example, many ECSS studies that use outdoor fixed cameras to estimate visitor use would benefit from automated analyses of image attributes across these large datasets, while other ECSS studies that use participant-worn cameras to gain in-depth visitor experience information would be better off manually coding their images. Although these differences depend on the study purpose and approach, software to facilitate automated coding and guidelines for manual coding of image data are both needed.
Just as multiple disciplines have benefited from guidelines for qualitative data coding and statistical analysis software use, guidelines for both manual and automated image coding would provide interdisciplinary standards and efficiencies. ECSS is still primarily dependent on manual coding. Although there have been attempts within ECSS to codify guidelines for manual image coding [46,47], these sources have yet to be cited regularly within ECSS or at all in other disciplines. Examining methods of automated image analysis and forming partnerships with those who have employed such methods or understand the technology behind them could open up further relevant inquiries on ECSS image datasets. The diversity of automated analysis techniques captured in this study suggests another area for interdisciplinary collaboration, guidelines development, and standards definition, so that researchers can more easily recognize which techniques are best suited for study purposes. This again underscores the importance of interdisciplinary learning, where examining multiple means of image analysis may lend creative insight into how one discipline could learn techniques from another.

10. Limitations

Keyword searches were crafted by this team of ECSS researchers and criteria for source inclusion in this review may reflect biases that would not be apparent if conducted by other researchers. However, we took steps to minimize subjectivity such as using an established method for systematic literature reviews and validating reliability among the research team. Discipline-specific camera usage and analysis jargon and knowledge may have been inadvertently omitted on account of the ECSS researchers’ unfamiliarity with these technical terms and thus led to an underrepresentation of particular areas in our findings. Again, we have attempted to lessen this concern through a standardized keyword search using basic, non-technical terms that transcend disciplines and by examining sources for multiple points of relevance.

11. Future Research

The findings of this review highlight four pertinent avenues of future research in general and within ECSS. First, a streamlined method for calculating and reporting the distance between a camera and the attributes of interest would be an interdisciplinary contribution to standardization. Second, ECSS researchers using cameras in studies could test the applicability of LiDAR to questions and contexts within the ECSS discipline. Third, a review of analysis strategies for images posted on online platforms (e.g., social media) could also be conducted and more reliable analysis strategies, particularly the development of a program that would reduce the burden of manual analysis and allow for more images to be included in the analysis, could be developed. Thus far, studies centered on social media images mostly involved geo-tagged images or captions rather than actual image content. Fourth, participant-generated image data should be examined independently, as this data collection technique is uniquely and intentionally less under researcher control.

12. Conclusions

This study assessed a large dataset of sources for enhanced methods pertaining to camera usage and image analysis in general and in ECSS in particular. Using a systematic literature review and interdisciplinary learning theory, this study identified areas of disparity and areas for enhanced collaboration. Six best practices for camera usage and image analysis emerged: examining multiple attributes/phenomena, being intentionally specific in documenting camera details and placement, sourcing methods beyond a specific discipline for novel approaches, critiquing image analysis methods used, examining possibilities for interdisciplinary analysis techniques, and standardizing analysis methods at least within disciplines. The ECSS focus of the study revealed that the discipline is well positioned to be a center of standardization in some regards (e.g., manual coding guidelines) but could benefit from interdisciplinary collaborations (e.g., use of LiDAR). This review provides a snapshot of the wide lens of camera-based methods in research and underscores the need for assessing the diversity of this method, especially as it continues to diversify and proliferate across disciplines and contexts.

Supplementary Materials

The following are available online at https://0-www-mdpi-com.brum.beds.ac.uk/2306-5729/5/2/51/s1, Data: Corpus of Sources with Citation Metadata.

Author Contributions

C.L.L. conducted the initial inquiry and phase one of the review, was task manager of all components of phase two (including leading source input into the database), assisted in data analysis, and drafted major portions of the manuscript. E.E.P. was project manager of all components, co-led inputting sources, led the data analysis, drafted major portions of the manuscript, and edited the final manuscript. J.P.F. inputted sources, drafted major portions of the manuscript, and edited the final manuscript. M.T.J.B. conceptualized the project, inputted sources, drafted minor portions of the manuscript, and provided guidance on framing the manuscript. R.L.S. inputted sources and provided guidance on framing the manuscript. All authors have read and agreed to the published version of the manuscript.

Funding

This research received no external funding.

Conflicts of Interest

The authors declare no conflict of interest.

References

  1. Al-Rousan, T.; Masad, E.; Tutumluer, E.; Pan, T. Evaluation of image analysis techniques for quantifying aggregate shape characteristics. Constr. Build. Mater. 2007, 21, 978–990. [Google Scholar] [CrossRef]
  2. Anderson, K.; Gaston, K.J. Lightweight unmanned aerial vehicles will revolutionize spatial ecology. Front. Ecol. Environ. 2013, 11, 138–146. [Google Scholar] [CrossRef] [Green Version]
  3. Cox, M. A basic guide for empirical environmental social science. Ecol. Soc. 2015, 20. [Google Scholar] [CrossRef]
  4. Hazen, D.; Puri, R.; Ramchandran, K. Multi-camera video resolution enhancement by fusion of spatial disparity and temporal motion fields. In Proceedings of the Fourth IEEE International Conference on Computer Vision Systems (ICVS’06), New York, NY, USA, 4–7 January 2006; p. 38. [Google Scholar] [CrossRef]
  5. Mansilla, V.B. Interdisciplinary learning: A cognitive-epistemological foundation. In The Oxford handbook of Interdisciplinarity, 2nd ed.; Frodeman, R., Ed.; Oxford University Press: Oxford, UK, 2017. [Google Scholar] [CrossRef] [Green Version]
  6. Spelt, E.J.H.; Biemans, H.J.A.; Tobi, H.; Luning, P.A.; Mulder, M. Teaching and learning in interdisciplinary higher education: A systematic review. Educ. Psychol. Rev. 2009, 21, 365. [Google Scholar] [CrossRef] [Green Version]
  7. Liu, J.-S.; Huang, T.-K. A project mediation approach to interdisciplinary learning. In Proceedings of the Fifth IEEE International Conference on Advanced Learning Technologies (ICALT’05), Kaohsiung, Taiwan, 5–8 July 2005; pp. 54–58. [Google Scholar] [CrossRef]
  8. Johnson, D.T.; Neal, L.; Vantassel-Baska, B.J. Science curriculum review: Evaluating materials for high-ability learners. Gift. Child Q. 1995, 39, 36–44. [Google Scholar] [CrossRef]
  9. Haigh, W.; Rehfeld, D. Integration of secondary mathematics and science methods courses: A model. Sch. Sci. Math. 1995, 95, 240. [Google Scholar] [CrossRef]
  10. Alden, D.S.; Laxton, R.; Patzer, G.; Howard, L. Establishing cross-disciplinary marketing education. J. Mark. Educ. 1991, 13, 25–30. [Google Scholar] [CrossRef]
  11. Dimitropoulos, G.; Hacker, P. Learning and the law: Improving behavioral regulation from an international and comparative perspective. J. Law Policy 2016, 25, 473–548. [Google Scholar]
  12. Kucera, K.; Harrison, L.M.; Cappello, M.; Modis, Y. Ancylostoma ceylanicum excretory–secretory protein 2 adopts a netrin-like fold and defines a novel family of nematode proteins. J. Mol. Biol. 2011, 408, 9–17. [Google Scholar] [CrossRef] [Green Version]
  13. Menzie, C.; Ryther, J.; Boyer, L.; Germano, J.; Rhodes, D. Remote methods of mapping seafloor topography, sediment type, bedforms, and benthic biology. OCEANS 1982, 82, 1046–1051. [Google Scholar] [CrossRef]
  14. Schuckman, K.; Raber, G.T.; Jensen, J.R.; Schill, S. Creation of digital terrain models using an adaptive Lidar vegetation point removal process. Photogramm. Eng. Remote Sens. 2002, 68, 1307–1314. [Google Scholar]
  15. An, F.-P. Pedestrian re-recognition algorithm based on optimization deep learning-sequence memory model. Complexity 2019, 2019, 1. [Google Scholar] [CrossRef] [Green Version]
  16. Su, C.; Zhang, S.; Xing, J.; Gao, W.; Tian, Q. Deep attributes driven multi-camera person re-identification. In Computer Vision—ECCV 2016; Lecture Notes in Computer Science; Springer: Cham, Switzerland, 2016; Volume 9906. [Google Scholar] [CrossRef] [Green Version]
  17. Marion, J.L. A review and synthesis of recreation ecology research supporting carrying capacity and visitor use management decisionmaking. J. For. 2016, 114, 339–351. [Google Scholar] [CrossRef]
  18. Peterson, B.; Brownlee, M.; Sharp, R.; Cribbs, T. Visitor Use and Associated Thresholds at Buffalo National River. In Fulfillment of Cooperative Agreement No. P16AC00194; Technical report submitted to the U.S. National Park Service; Clemson University: Clemson, SC, USA, 2018. [Google Scholar]
  19. Schmid Mast, M.; Gatica-Perez, D.; Frauendorfer, D.; Nguyen, L.; Choudhury, T. Social sensing for psychology: Automated interpersonal behavior assessment. Curr. Dir. Psychol. Sci. 2015, 24, 154–160. [Google Scholar] [CrossRef]
  20. Kharrazi, M.; Sencar, H.T.; Memon, N. Blind source camera identification. In Proceedings of the 2004 International Conference on Image Processing, ICIP ’04, Singapore, 24–27 October 2004; Volume 1, pp. 709–712. [Google Scholar] [CrossRef]
  21. Huang, A.S.; Bachrach, A.; Henry, P.; Krainin, M.; Maturana, D.; Fox, D.; Roy, N. Visual odometry and mapping for autonomous flight using an RGB-D Camera. In Robotics Research; Christensen, H.I., Khatib, O., Eds.; Springer: Berlin/Heidelberg, Germany, 2017; Volume 100, pp. 235–252. [Google Scholar] [CrossRef]
  22. Bente, G. Facilities for the graphical computer simulation of head and body movements. Behav. Res. Methods Instrum. Comput. 1989, 21, 455–462. [Google Scholar] [CrossRef]
  23. Alvar, S.R.; Bajić, I.V. MV-YOLO: Motion vector-aided tracking by semantic object detection. arXiv 2018, arXiv:1805.00107. [Google Scholar]
  24. Staab, J. Applying Computer Vision for Monitoring Visitor Numbers—A Geographical Approach. Master’s Thesis, University of Wurzburg, Heidelberg, Germany, 2017. Available online: https://www.researchgate.net/publication/320948063_Applying_Computer_Vision_for_Monitoring_Visitor_Numbers_-_A_Geographical_Approach (accessed on 7 June 2020).
  25. Chouinard, B.; Scott, K.; Cusack, R. Using automatic face analysis to score infant behaviour from video collected online. Infant Behav. Dev. 2019, 54, 1–12. [Google Scholar] [CrossRef]
  26. Fraser, C.S. Digital camera self-calibration. ISPRS J. Photogramm. Remote Sens. 1997, 52, 149–159. [Google Scholar] [CrossRef]
  27. Tatsuno, K. Current trends in digital cameras and camera-phones. Sci. Technol. Q. Rev. 2006, 18, 35–44. [Google Scholar]
  28. English, F.W. The utility of the camera in qualitative inquiry. Educ. Res. 1988, 17, 8–15. [Google Scholar] [CrossRef]
  29. Park, J.-I.; Yagi, N.; Enami, K.; Aizawa, K.; Hatori, M. Estimation of camera parameters from image sequence for model-based video coding. IEEE Trans. Circuits Syst. Video Technol. 1994, 4, 288–296. [Google Scholar] [CrossRef]
  30. Velloso, E.; Bulling, A.; Gellersen, H. AutoBAP: Automatic coding of body action and posture units from wearable sensors. In Proceedings of the 2013 Humaine Association Conference on Affective Computing and Intelligent Interaction, Geneva, Switzerland, 2–5 September 2013; pp. 135–140. [Google Scholar] [CrossRef] [Green Version]
  31. Rust, C. How artistic inquiry can inform interdisciplinary research. Int. J. Des. 2007, 1, 69–76. [Google Scholar]
  32. Zhao, W.; Chellappa, R.; Phillips, P.J.; Rosenfeld, A. Face recognition: A literature survey. ACM Comput. Surv. 2003, 35, 399–459. [Google Scholar] [CrossRef]
  33. Blaschke, T. Object based image analysis for remote sensing. ISPRS J. Photogramm. Remote Sens. 2010, 65, 2–16. [Google Scholar] [CrossRef] [Green Version]
  34. Pal, N.R.; Pal, S.K. A review of image segmentation techniques. Pattern Recognit. 1993, 26, 1277–1294. [Google Scholar] [CrossRef]
  35. Lu, D.; Weng, Q. A survey of image classification methods and techniques for improving classification performance. Int. J. Remote Sens. 2007, 28, 823–870. [Google Scholar] [CrossRef]
  36. Muller, H.; Michoux, N.; Bandon, D.; Geissbuhler, A. A review of content-based image retrieval systems in medical applications—Clinical benefits and future directions. Int. J. Med. Inform. 2004, 73, 1–23. [Google Scholar] [CrossRef]
  37. Kelly, P.; Marshall, S.J.; Badland, H.; Kerr, J.; Oliver, M.; Doherty, A.R.; Foster, C. An ethical framework for automated, wearable cameras in health behavior research. Am. J. Prev. Med. 2013, 44, 314–319. [Google Scholar] [CrossRef]
  38. Meek, P.D.; Ballard, G.; Claridge, A.; Kays, R.; Moseby, K.; O’Brien, T.; Townsend, S. Recommended guiding principles for reporting on camera trapping research. Biodivers. Conserv. 2014, 23, 2321–2343. [Google Scholar] [CrossRef]
  39. Pickering, C.M.; Byrne, J. The benefits of publishing systematic quantitative literature reviews for PhD candidates and other early career researchers. High. Educ. Res. Dev. 2014, 33, 534–548. [Google Scholar] [CrossRef] [Green Version]
  40. Moher, D.; Liberati, A.; Tetzlaff, J.; Altman, D.G.; PRISMA Group. Preferred reporting items for systematic reviews and meta-analyses: The PRISMA Statement. PLoS Med. 2009, 6, e1000097. [Google Scholar] [CrossRef] [PubMed] [Green Version]
  41. Burton, A.C.; Neilson, E.; Moreira, D.; Ladle, A.; Steenweg, R.; Fisher, J.T.; Boutin, S. Wildlife camera trapping: A review and recommendations for linking surveys to ecological processes. J. Appl. Ecol. 2015, 52, 675–685. [Google Scholar] [CrossRef]
  42. Rovero, F.; Marshall, A.R. Camera trapping photographic rate as an index of density in forest ungulates. J. Appl. Ecol. 2009, 46, 1011–1017. [Google Scholar] [CrossRef] [Green Version]
  43. Scotson, L.; Johnston, L.R.; Iannarilli, F.; Wearn, O.R.; Mohd-Azlan, J.; Wong, W.M.; Frechette, J. Best practices and software for the management and sharing of camera trap data for small and large scales studies. Remote Sens. Ecol. Conserv. 2017, 3, 158–172. [Google Scholar] [CrossRef]
  44. Trolliet, F.; Vermeulen, C.; Huynen, M.C.; Hambuckers, A. Use of camera traps for wildlife studies: A review. Biotechnologie Agronomie Société et Environnement 2014, 18, 446–454. [Google Scholar]
  45. Saldana, J. The Coding Manual for Qualitative Researchers, 2nd ed.; Sage Publishing: Los Angeles, CA, USA, 2013. [Google Scholar]
  46. Balomenou, N.; Garrod, B. Photographs in tourism research: Prejudice, power, performance, and participant-generated images. Tour. Manag. 2019, 70, 201–217. [Google Scholar] [CrossRef]
  47. Rose, J.; Spencer, C. Immaterial labour in spaces of leisure: Producing biopolitical subjectivities through Facebook. Leis. Stud. 2016, 35, 809–826. [Google Scholar] [CrossRef]
Figure 1. Steps followed to refine the corpus of sources included in this systematic literature review, from initial query to final database. Following this process, citation metadata and six attributes were thematically coded for each of the 391 included sources: research discipline, country and continent of study, camera type, camera placement, data collection method, and data analysis method.
Data 05 00051 g001
Figure 2. Publication distribution over time (5 year increments from 1995 to 2019) for each research discipline. The research discipline key is presented in the same order as sources, from top to bottom, most to least (i.e., from Environmental Conservation Social Sciences having the highest percentage to Biology/Microbiology having the least).
Data 05 00051 g002
Figure 3. Publication distribution over time (5 year increments from 1995 to 2019) for each camera placement technique. The placement technique key is presented in the same order as sources, from top to bottom most to least (i.e., from outdoor fixed having the highest number to Watercraft having the least).
Data 05 00051 g003
Figure 4. Environmental conservation social science publication distribution over time (5 year increments from 1995 to 2019) for each camera placement technique. The placement technique key is presented in the same order as sources, from top to bottom most to least (i.e., from outdoor fixed having the highest number to Computer having the least).
Data 05 00051 g004
Table 1. Source metrics by research discipline, source type, year published, and continent of study. Cells are listed as valid percentages (%) of the total sources for each research discipline.
AgricultureBiology/MicrobiologyBotany/Plant ScienceComputer Science/ProgrammingEngineering and TechnologyEnvironmental Biophysical SciencesEnvironmental Conservation Social ScienceFood ScienceForestryGeographyMarine ScienceMedicine/Health ScienceOther *PsychologyUrban StudiesTotal
Source Type
Article96100845868697210080324079891006075
Conference Proceedings00000040000000201
Dissertation/Thesis201133241924016682011502019
Report20510812004040115005
Year
1985–198900000000000110000
1990–19940000000000000000
1995–199920502410120000002
2000–200450113045016112005005
2005–20091488218202710362432032017019
2010–20143903703232714203702126334021
2015–201941132690754257502821803768506053
Continent
Africa0008047000000003
Asia110262534121521321620161102018
Australia/Oceania4011088117402055007
Europe3338112822192272450213217021
North America18633738325032293674205326678037
South America70002053600005004
International700304700540051704
Not Mentioned2001602410400516005
* Other are research disciplines with ≤3 sources: Architecture, Astronomy, Chemistry, Climatology, Communications, Construction Science, Criminal Justice, Education, Graphic Design, Marketing, and Textiles
Table 2. Source metrics by camera placement method and data collection and analysis recommendations. Cells are listed as valid percentages (%) of the total sources for each research discipline.
AgricultureBiology/MicrobiologyBotany/Plant ScienceComputer Science/ProgrammingEngineering and TechnologyEnvironmental Biophysical SciencesEnvironmental Conservation Social ScienceFood ScienceForestryGeographyMarine ScienceMedicine/Health ScienceOther *PsychologyUrban StudiesTotal
Camera Placement
Aircraft381327516211914293800120018
Computer307252383700066008
Indoor lab equipment167533133040431400783533020
Outdoor fixed38133335142960294865001217034
Participatory00015285050001817255
Satellite00002213055625060756
Vehicle3005740000060002
Watercraft00000460002500002
Wearable3003705700011123304
Camera Data Collection Recommendations
Alternate/Modified6211921435291180810009
Fixed/Mounted4557485936435043362367502960046
Held/Worn614517261315191800193320017
Moving27014717332210296933814010019
Multiple3052002040045002
Security/Surveillance1271014776040012102007
Camera Data Analysis Recommendations
Automated2200555501029175733252950032
Geospatial2203359502703343670007120
LiDAR11005003000000003
Manual22033101850505733007529501429
Mixed methods22033251801014170004301416
* Other are research disciplines with ≤3 sources: Architecture, Astronomy, Chemistry, Climatology, Communications, Construction Science, Criminal Justice, Education, Graphic Design, Marketing, and Textiles.

