A Dataset to Evaluate IEEE 802.15.4g SUN for Dependable Low-Power Wireless Communications in Industrial Scenarios

 ,
,  , , , and
Abstract
:1. Introduction
2. Related Work
2.1. Overview of IEEE 802.15.4g
2.1.1. SUN-FSK
2.1.2. SUN-OQPSK
2.1.3. SUN-OFDM
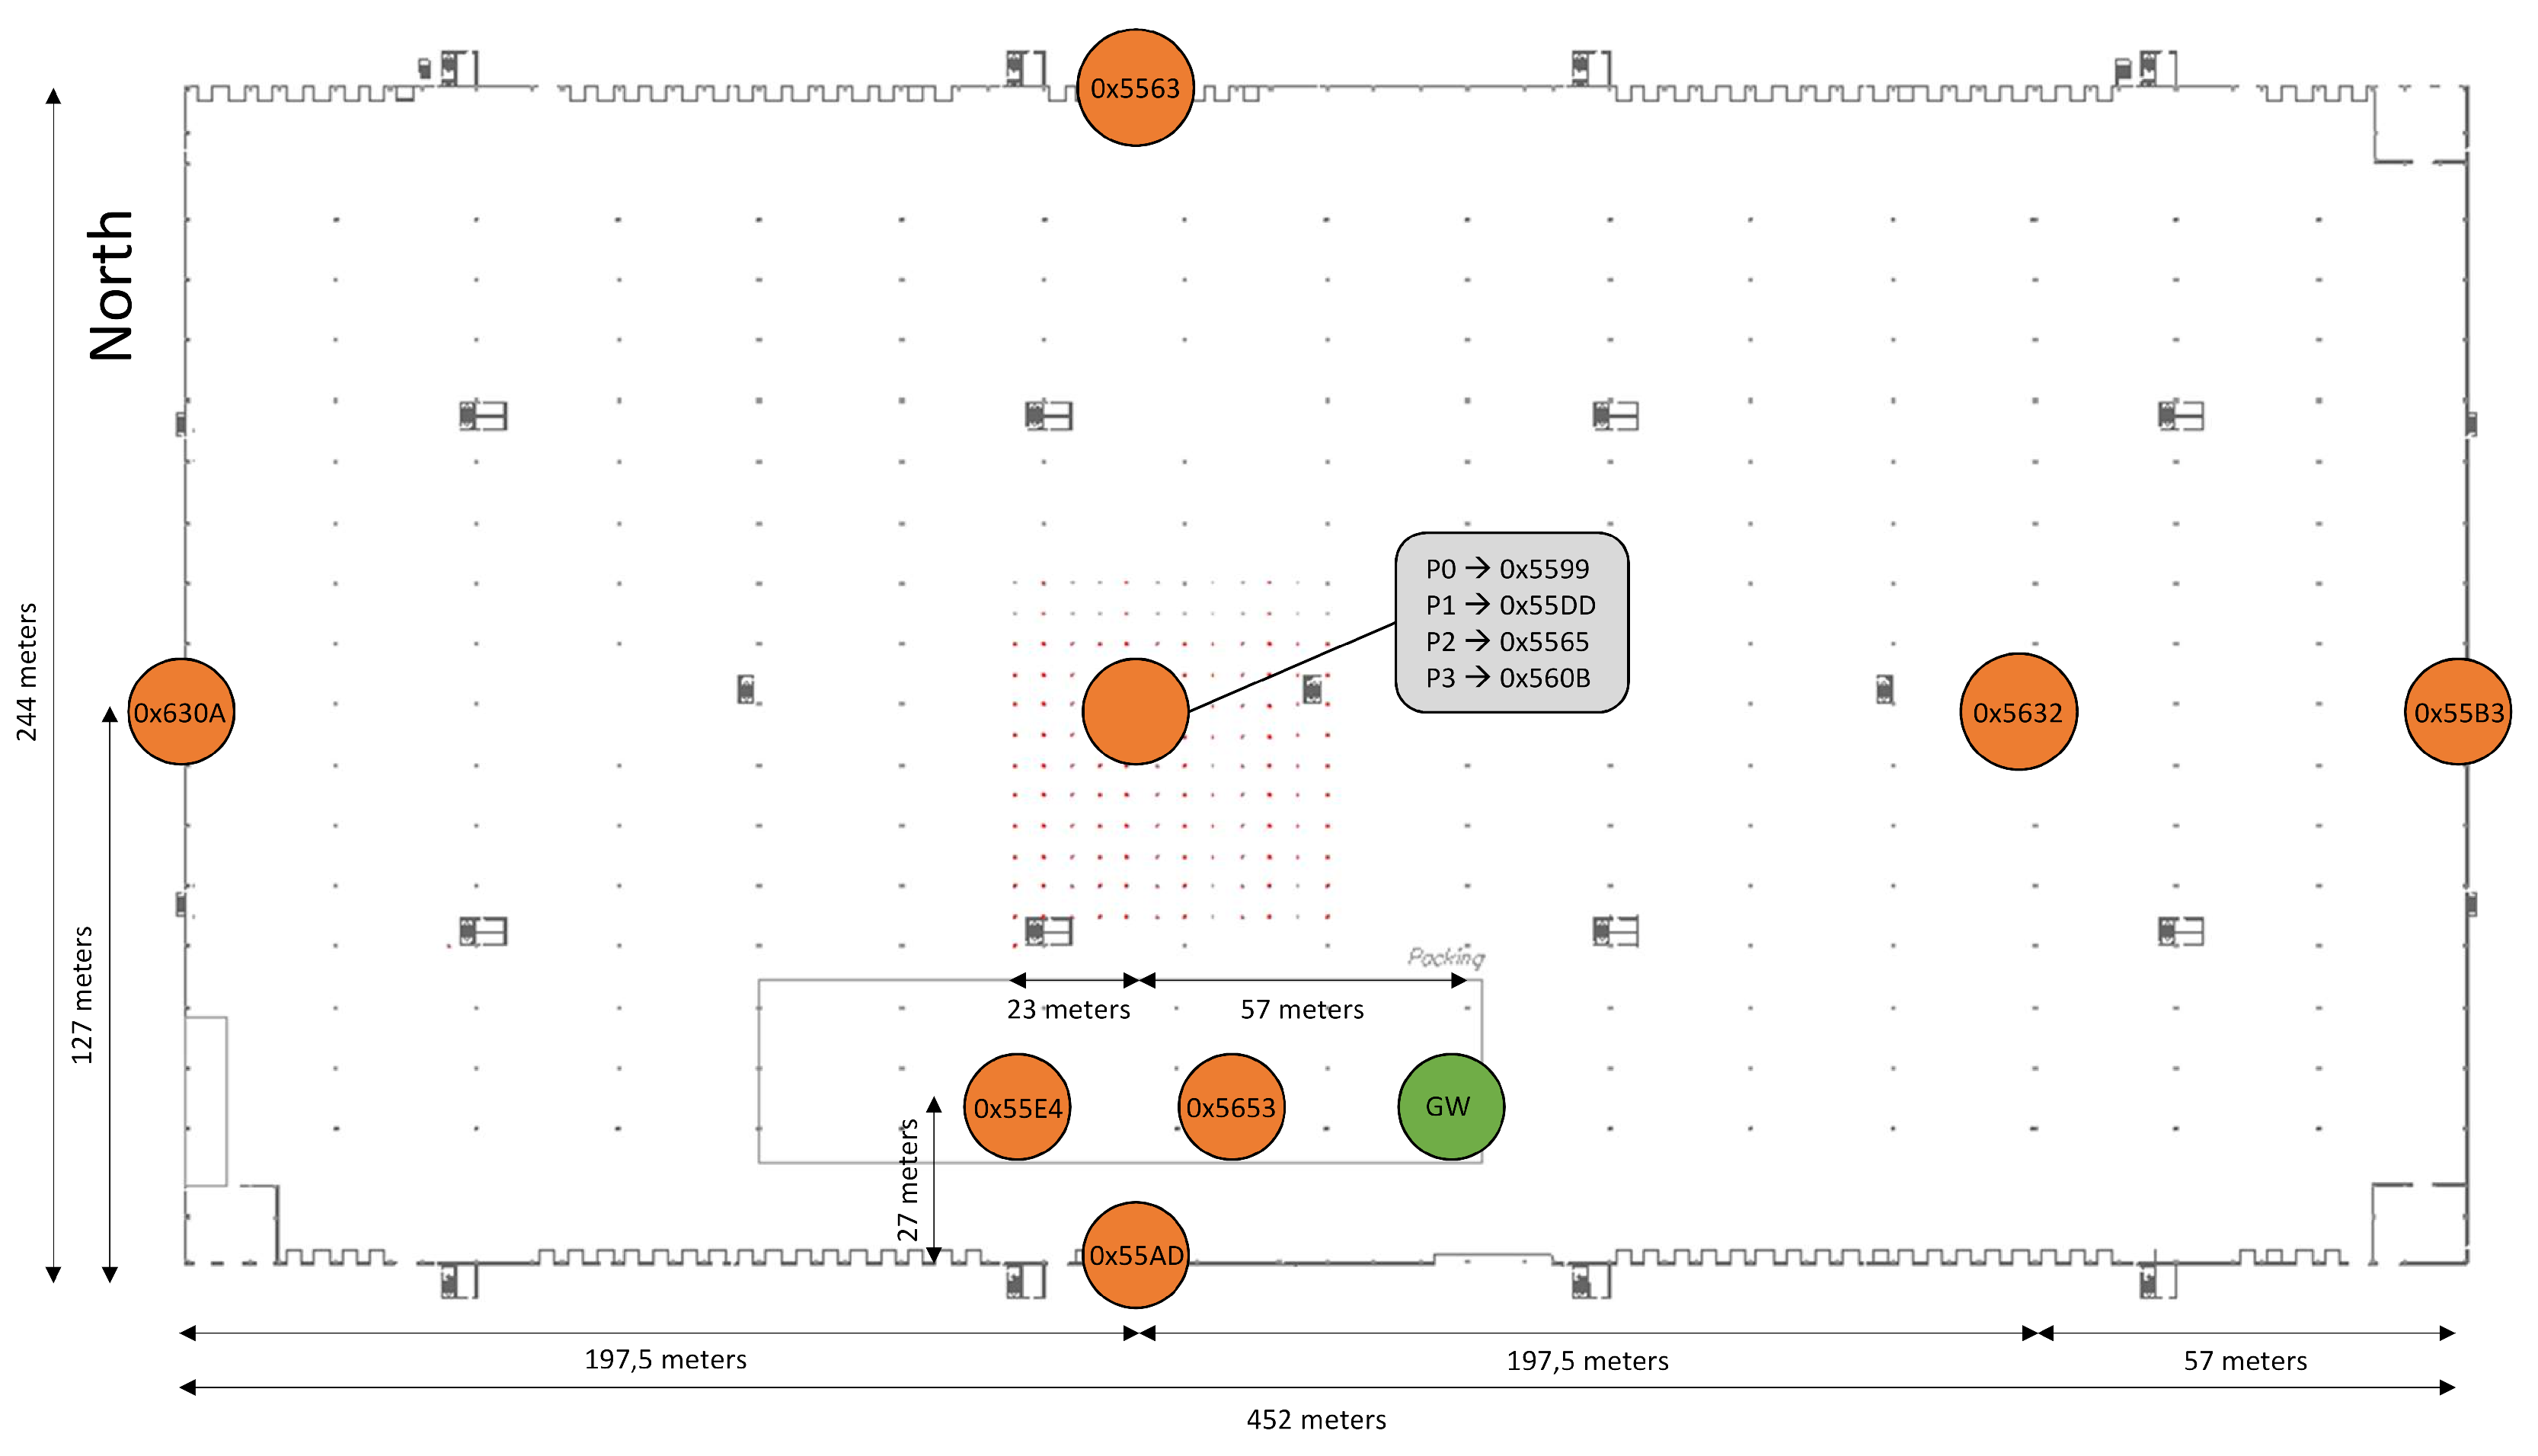
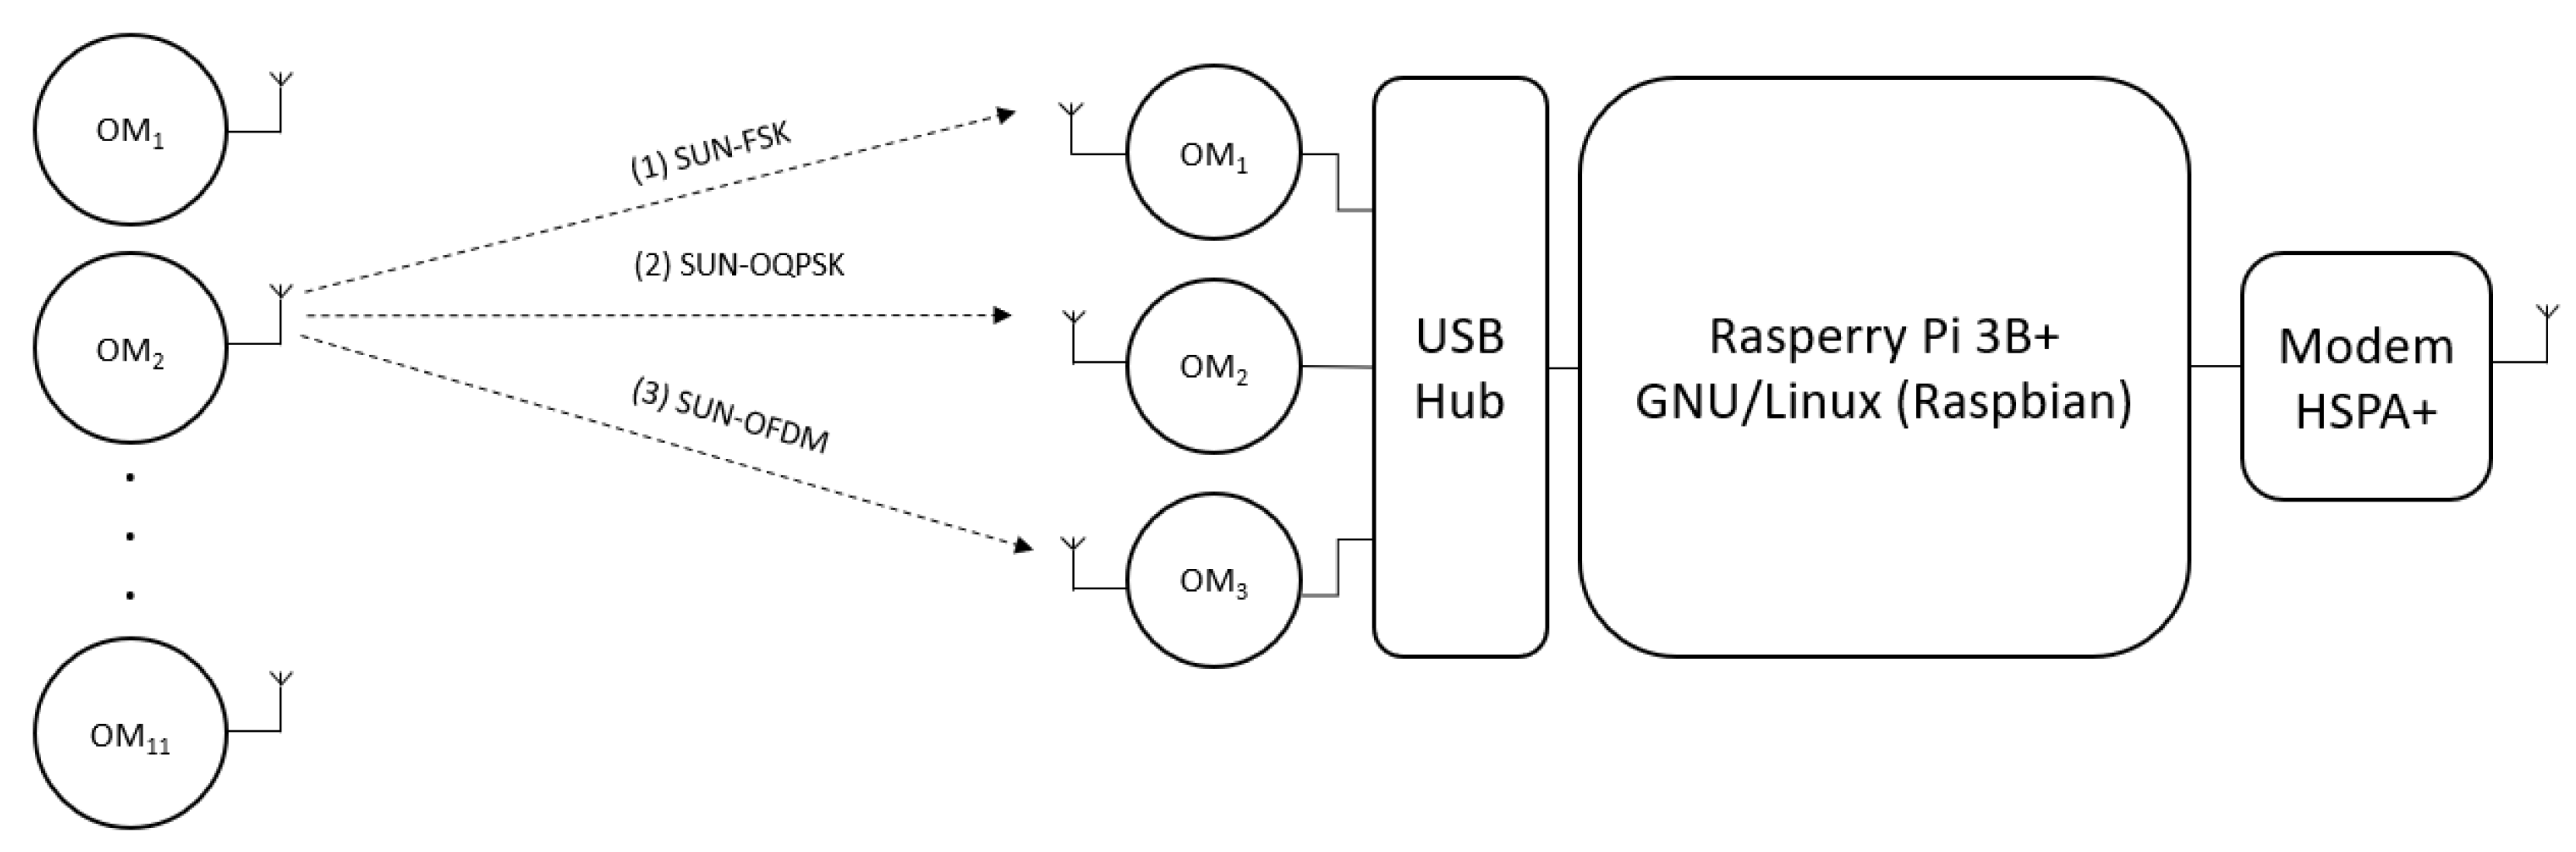
3. Deployment Overview
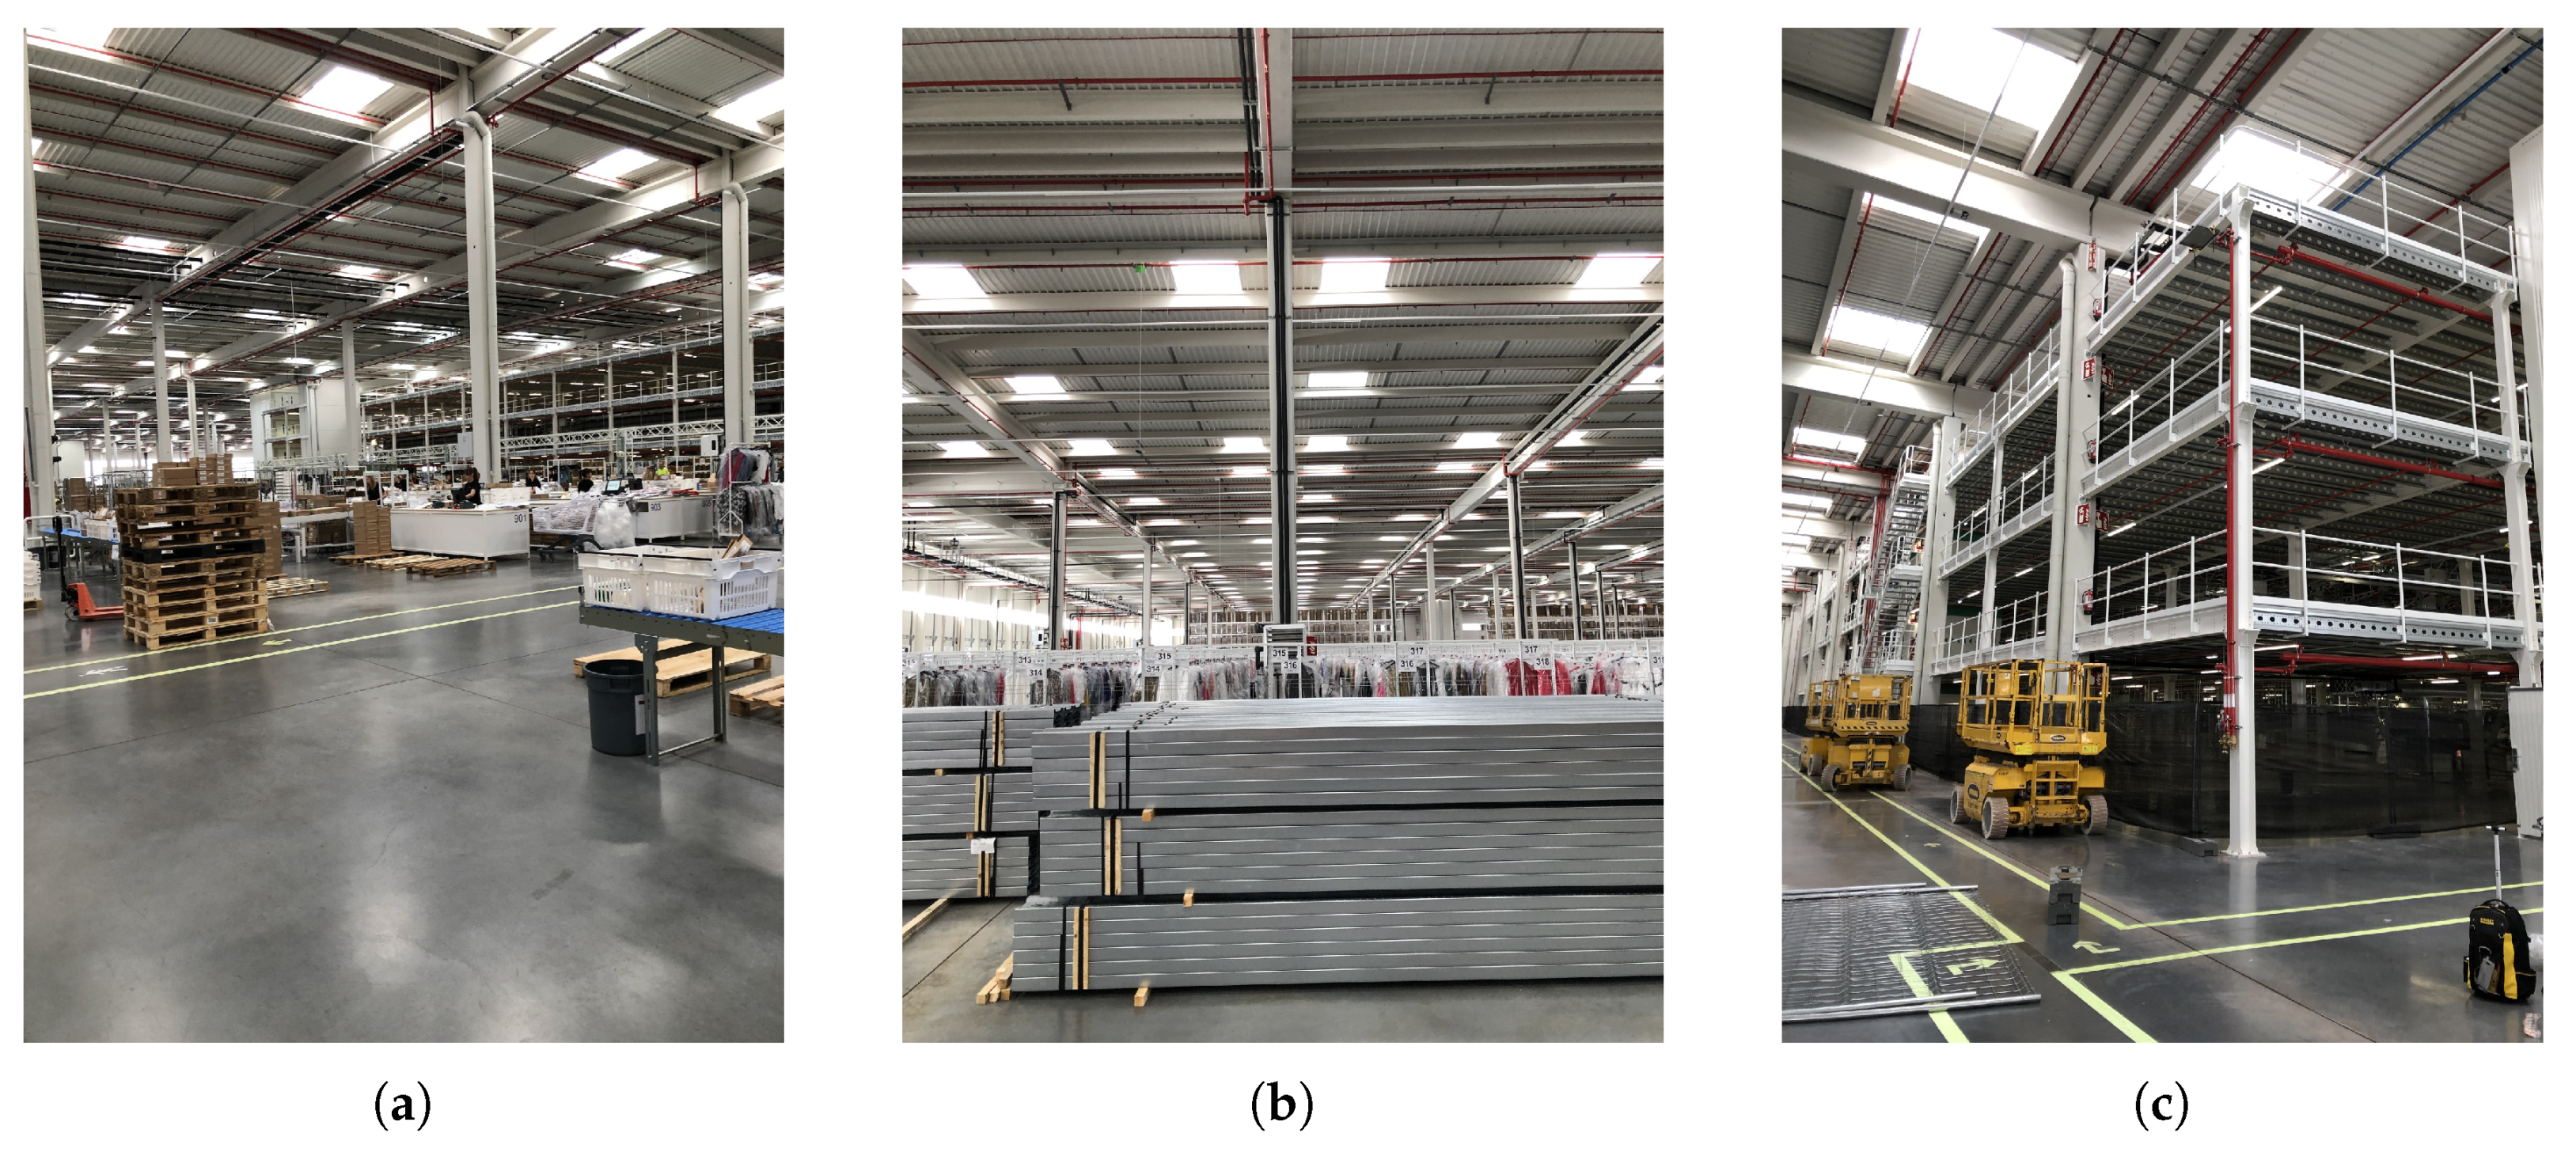
3.1. Overview
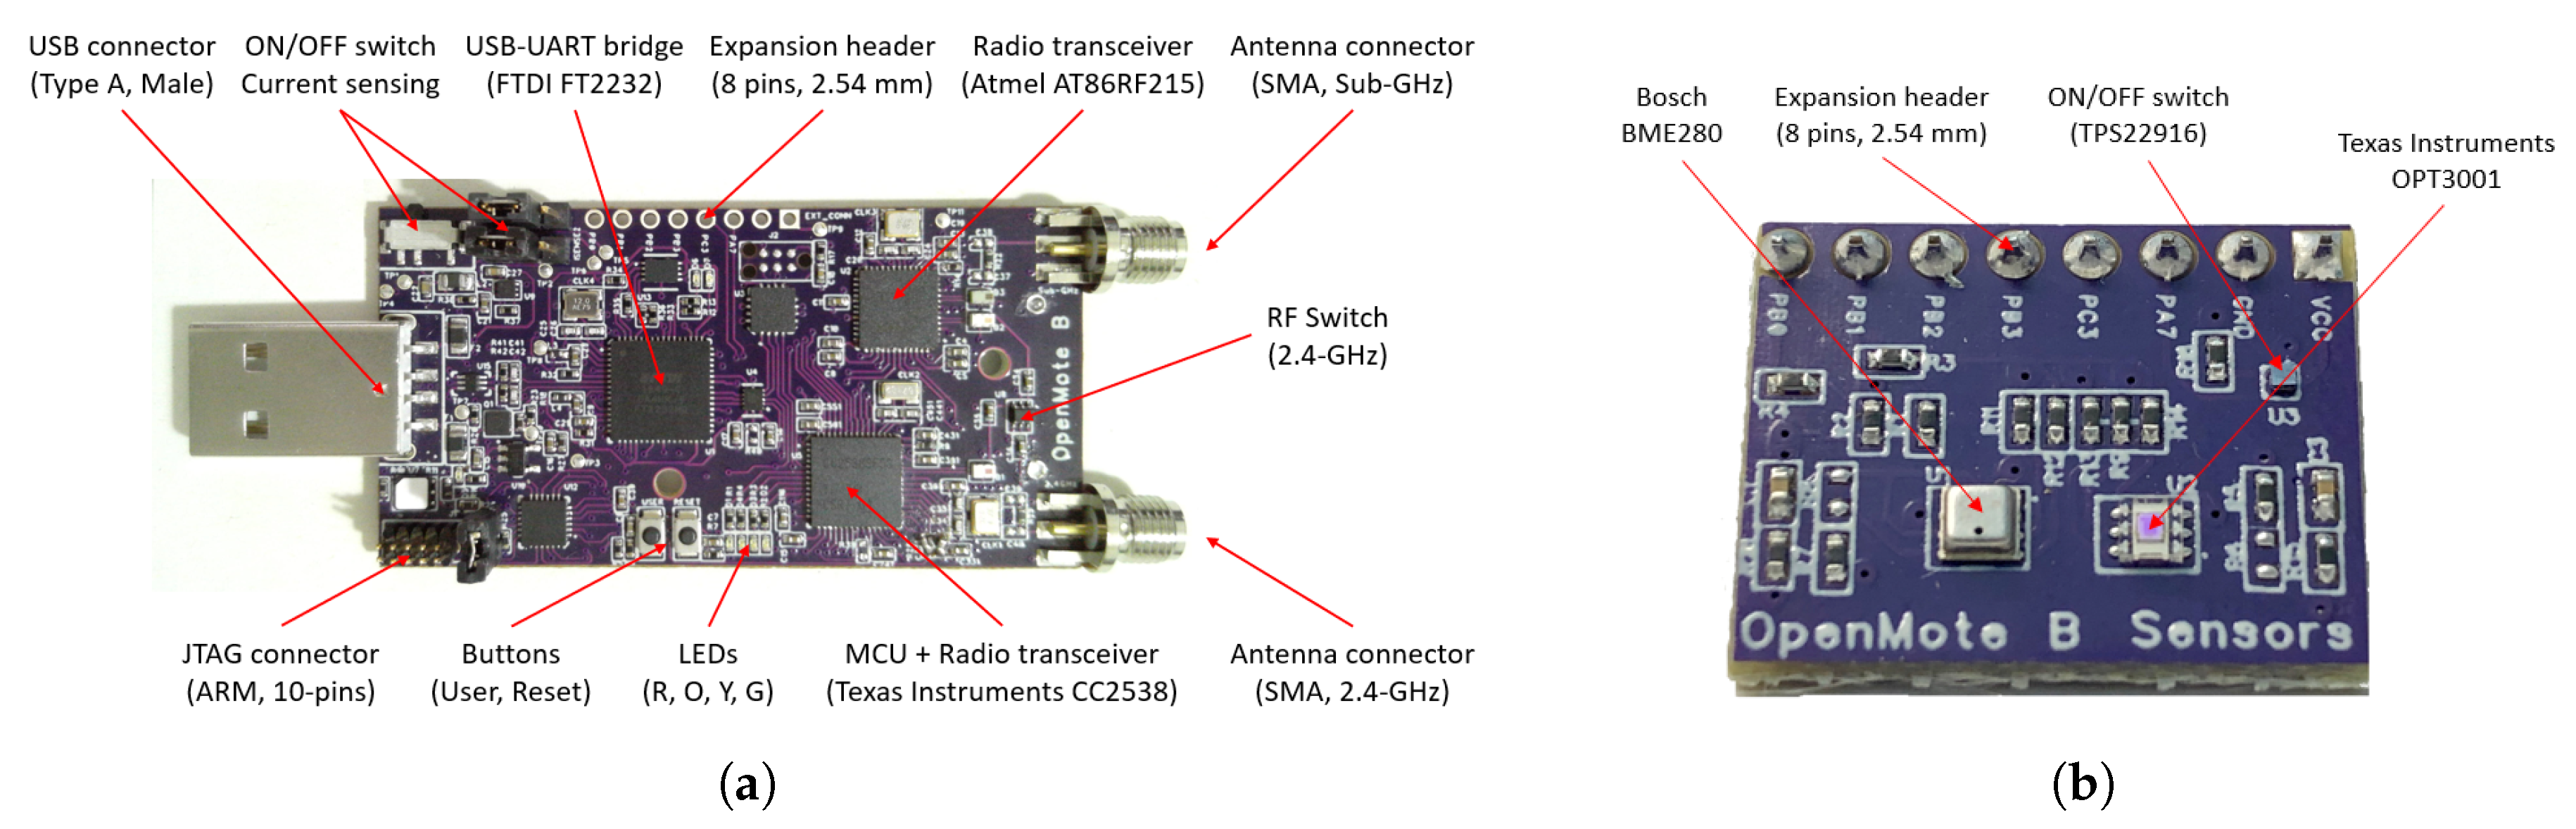
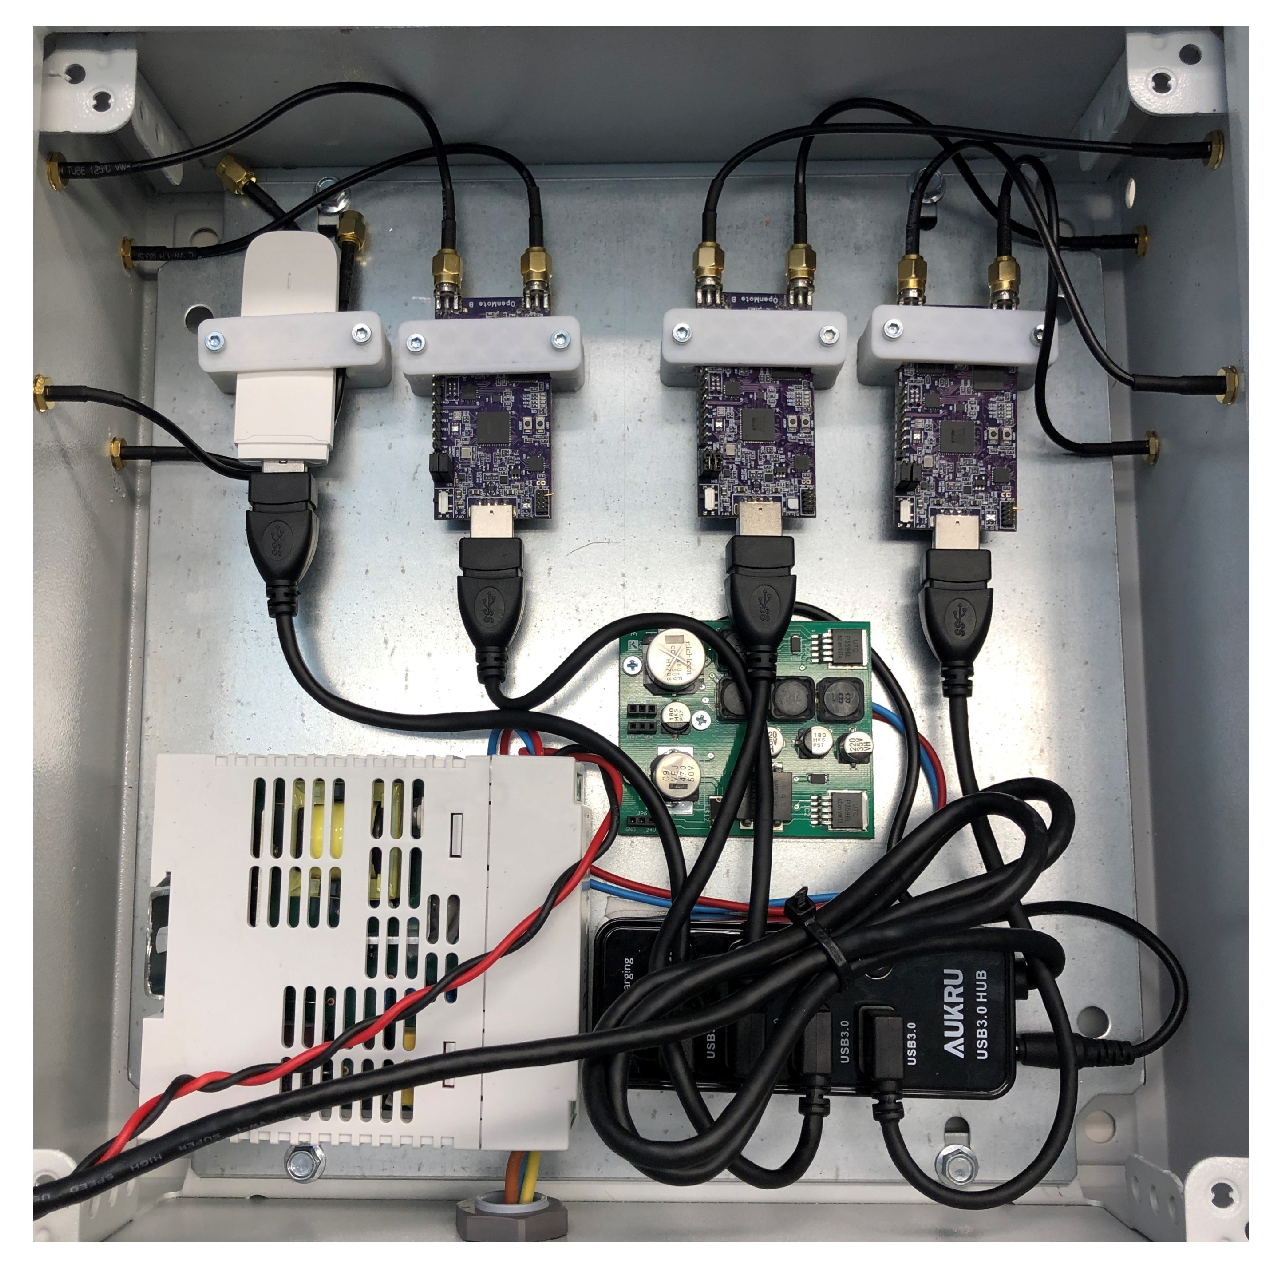
3.2. Hardware
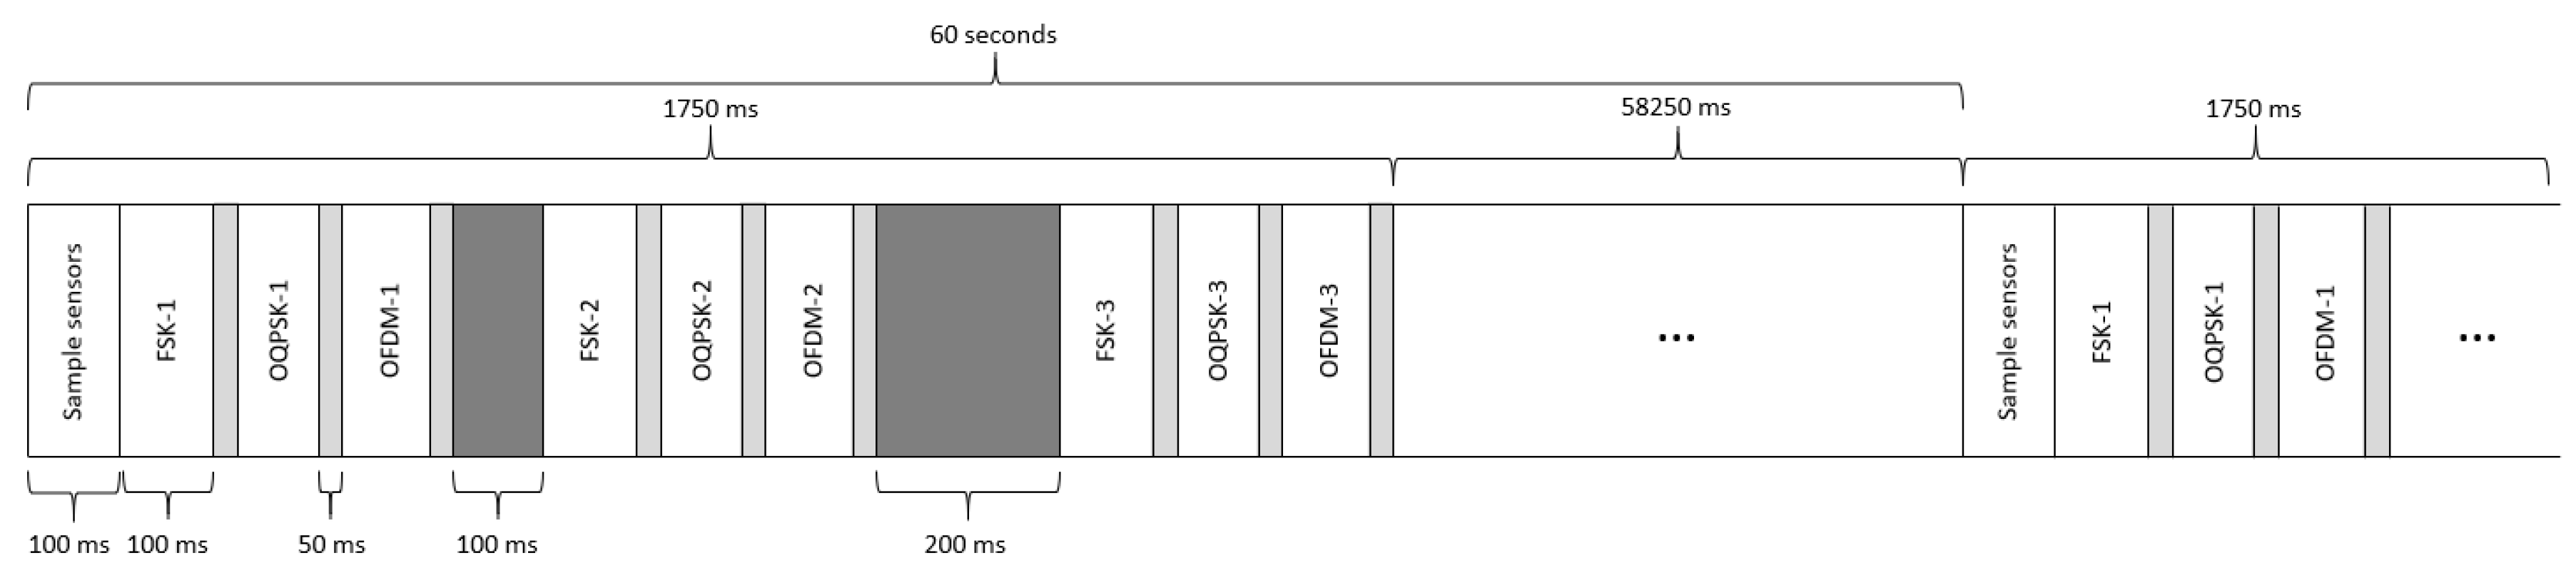
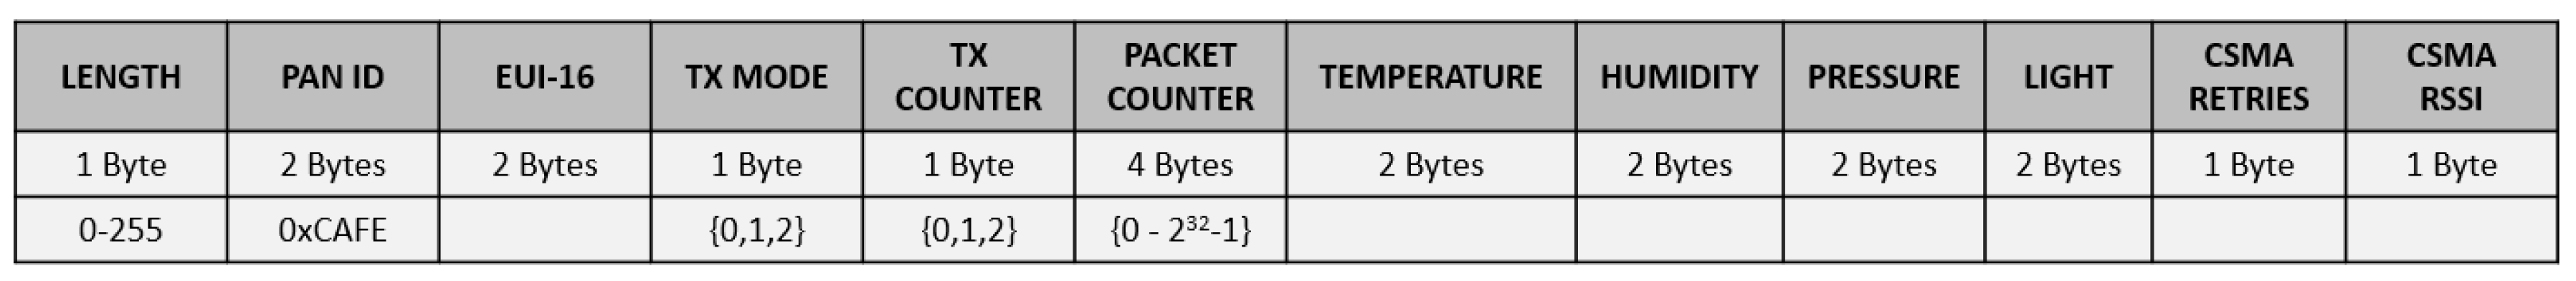
3.3. Network Operation
- The PAN_ID field is 2 bytes and is set to 0xCAFE for all packets being transmitted. The gateway filters all packets that are not received with such a value to avoid received packets from other networks;
- The EUI_16 field is 2 bytes and contains the last 2 bytes of the EUI-64 address of the nodes transmitting the packet;
- The TX_MODE field is 1 byte and refers to the modulation being used to transmit the packet: SUN-FSK (0), SUN-OQPSK (1), and SUN-OFDM (2);
- The TX_COUNTER field is 1 byte and indicates the packet repetition within the current period (i.e., 1, 2, or 3);
- The PACKET_COUNTER field is 4 bytes and is an absolute sequence number to allow for packet identification and eventual node resets;
- The TEMPERATURE, HUMIDITY, PRESSURE, and LIGHT fields are 2 bytes each and are devoted to storing the sensor measurements. Prior to transmitting, the raw values are converted to their respective physical values and multiplied by 10 to provide single-digit decimal resolution;
- The CSMA_RETRIES value is 1 byte and indicates the number of times that the CSMA/CA process has been repeated before the transmission is allowed;
- The CSMA_RSSI value is 1 byte and indicates the RSSI level (dBm) that has been measured during the CSMA/CA process.
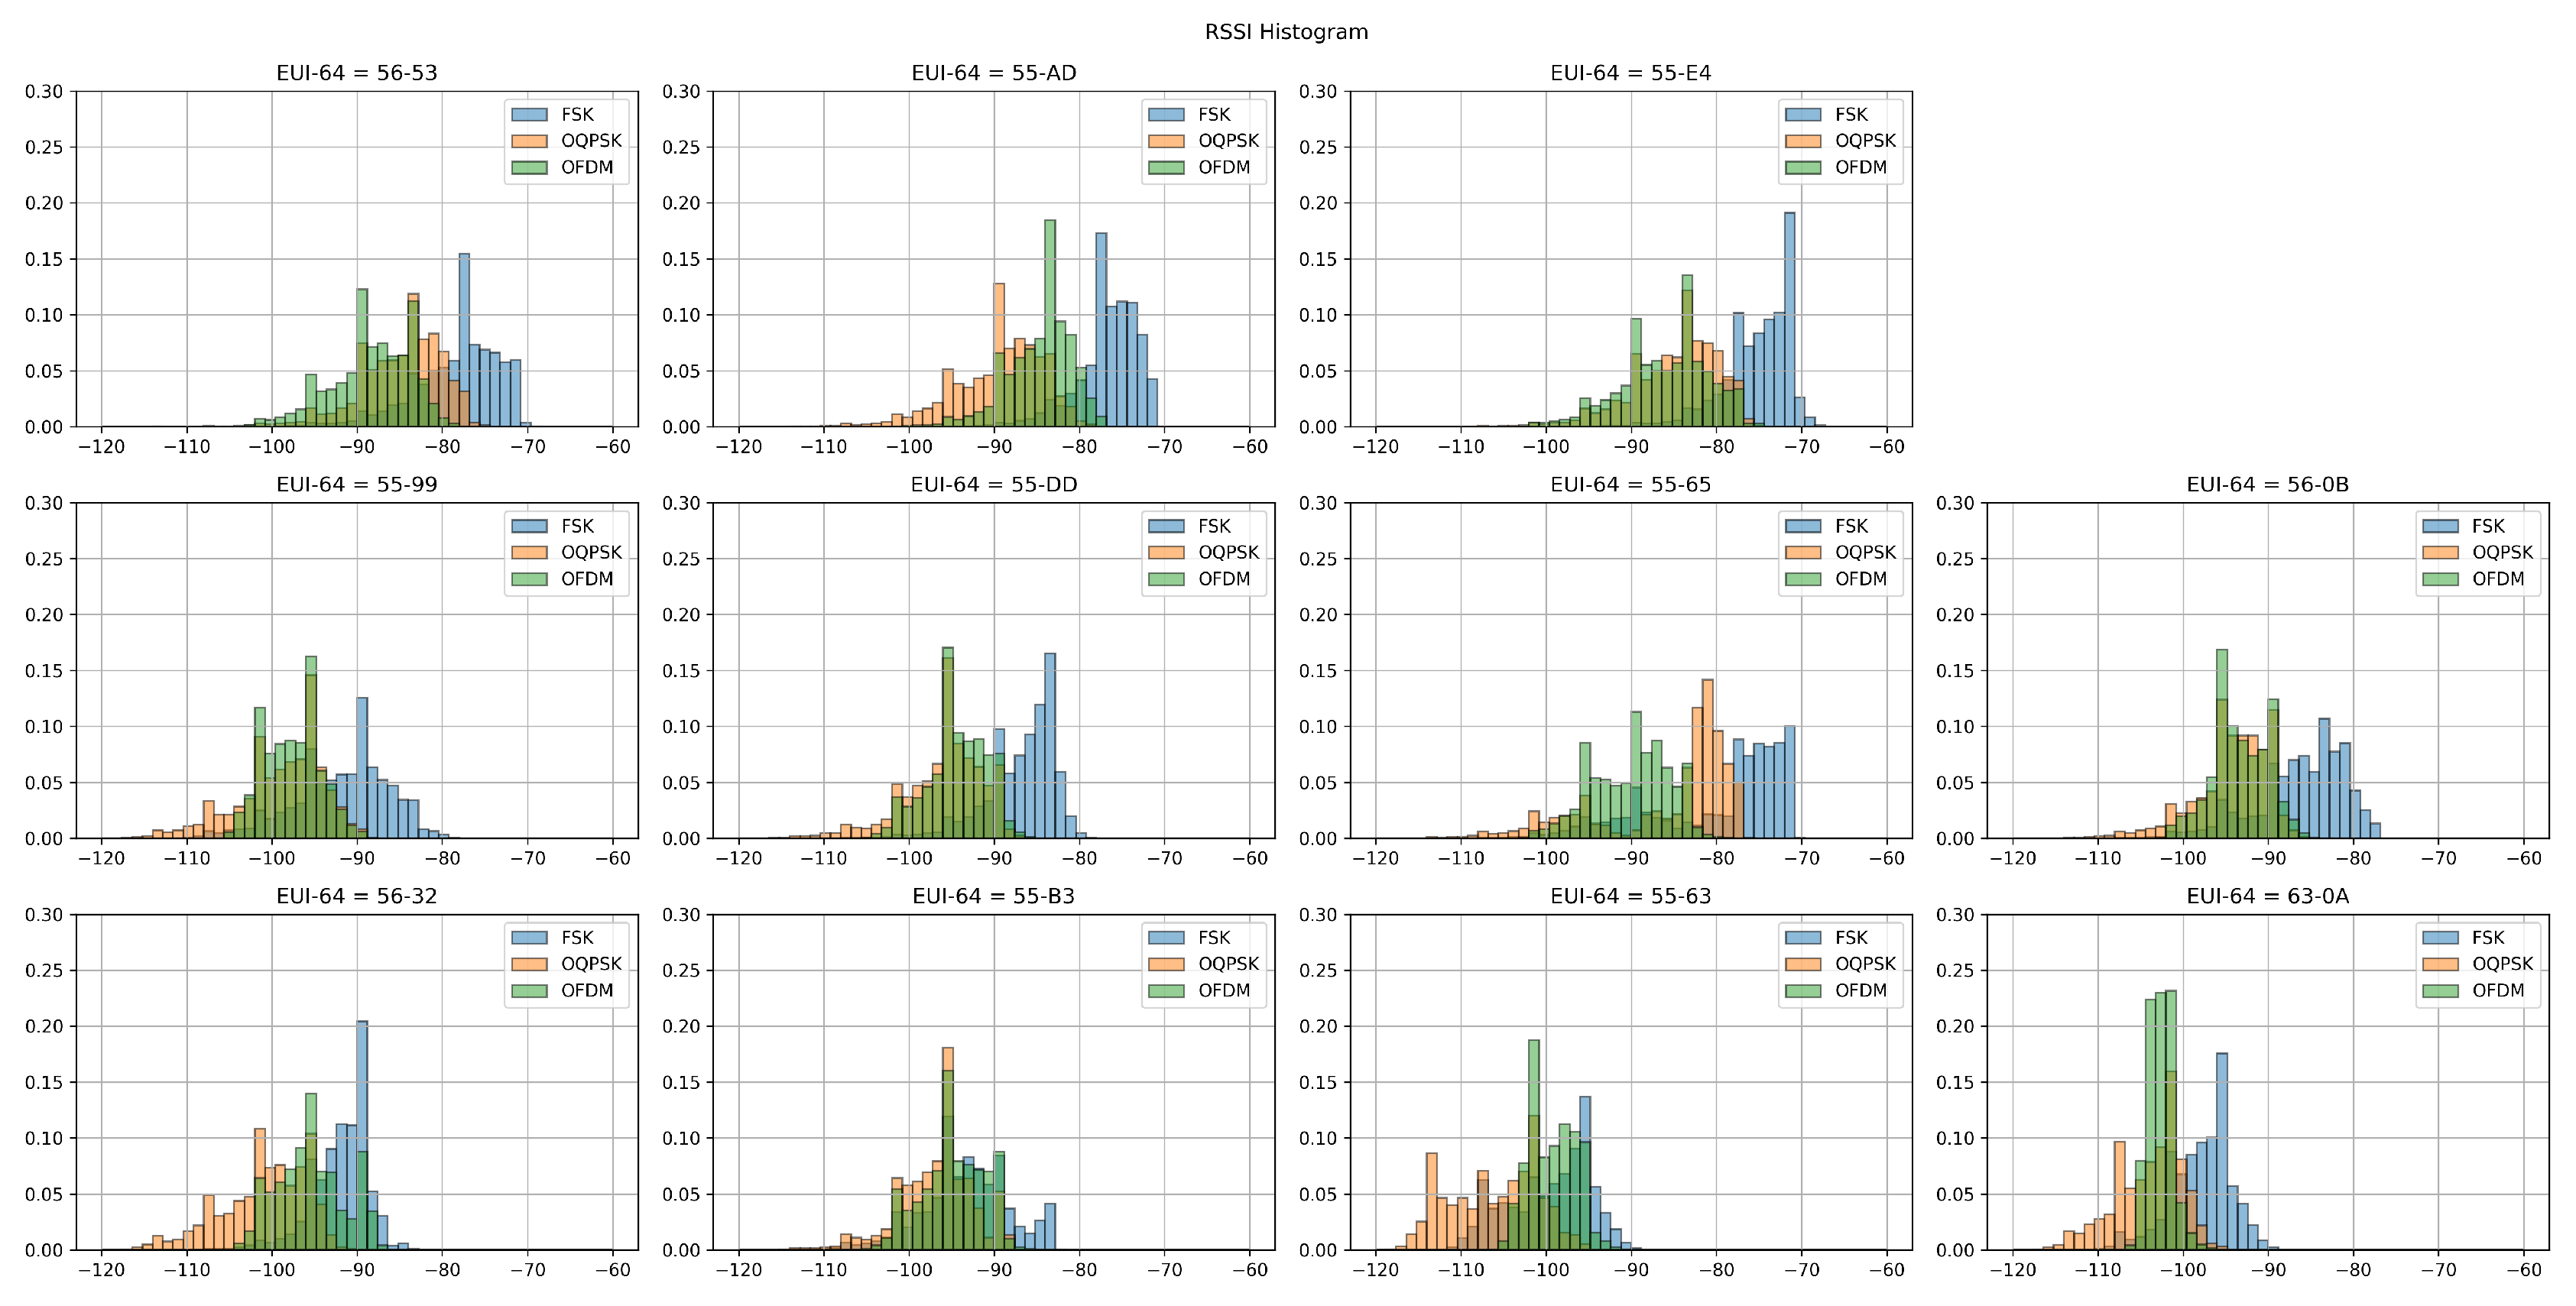
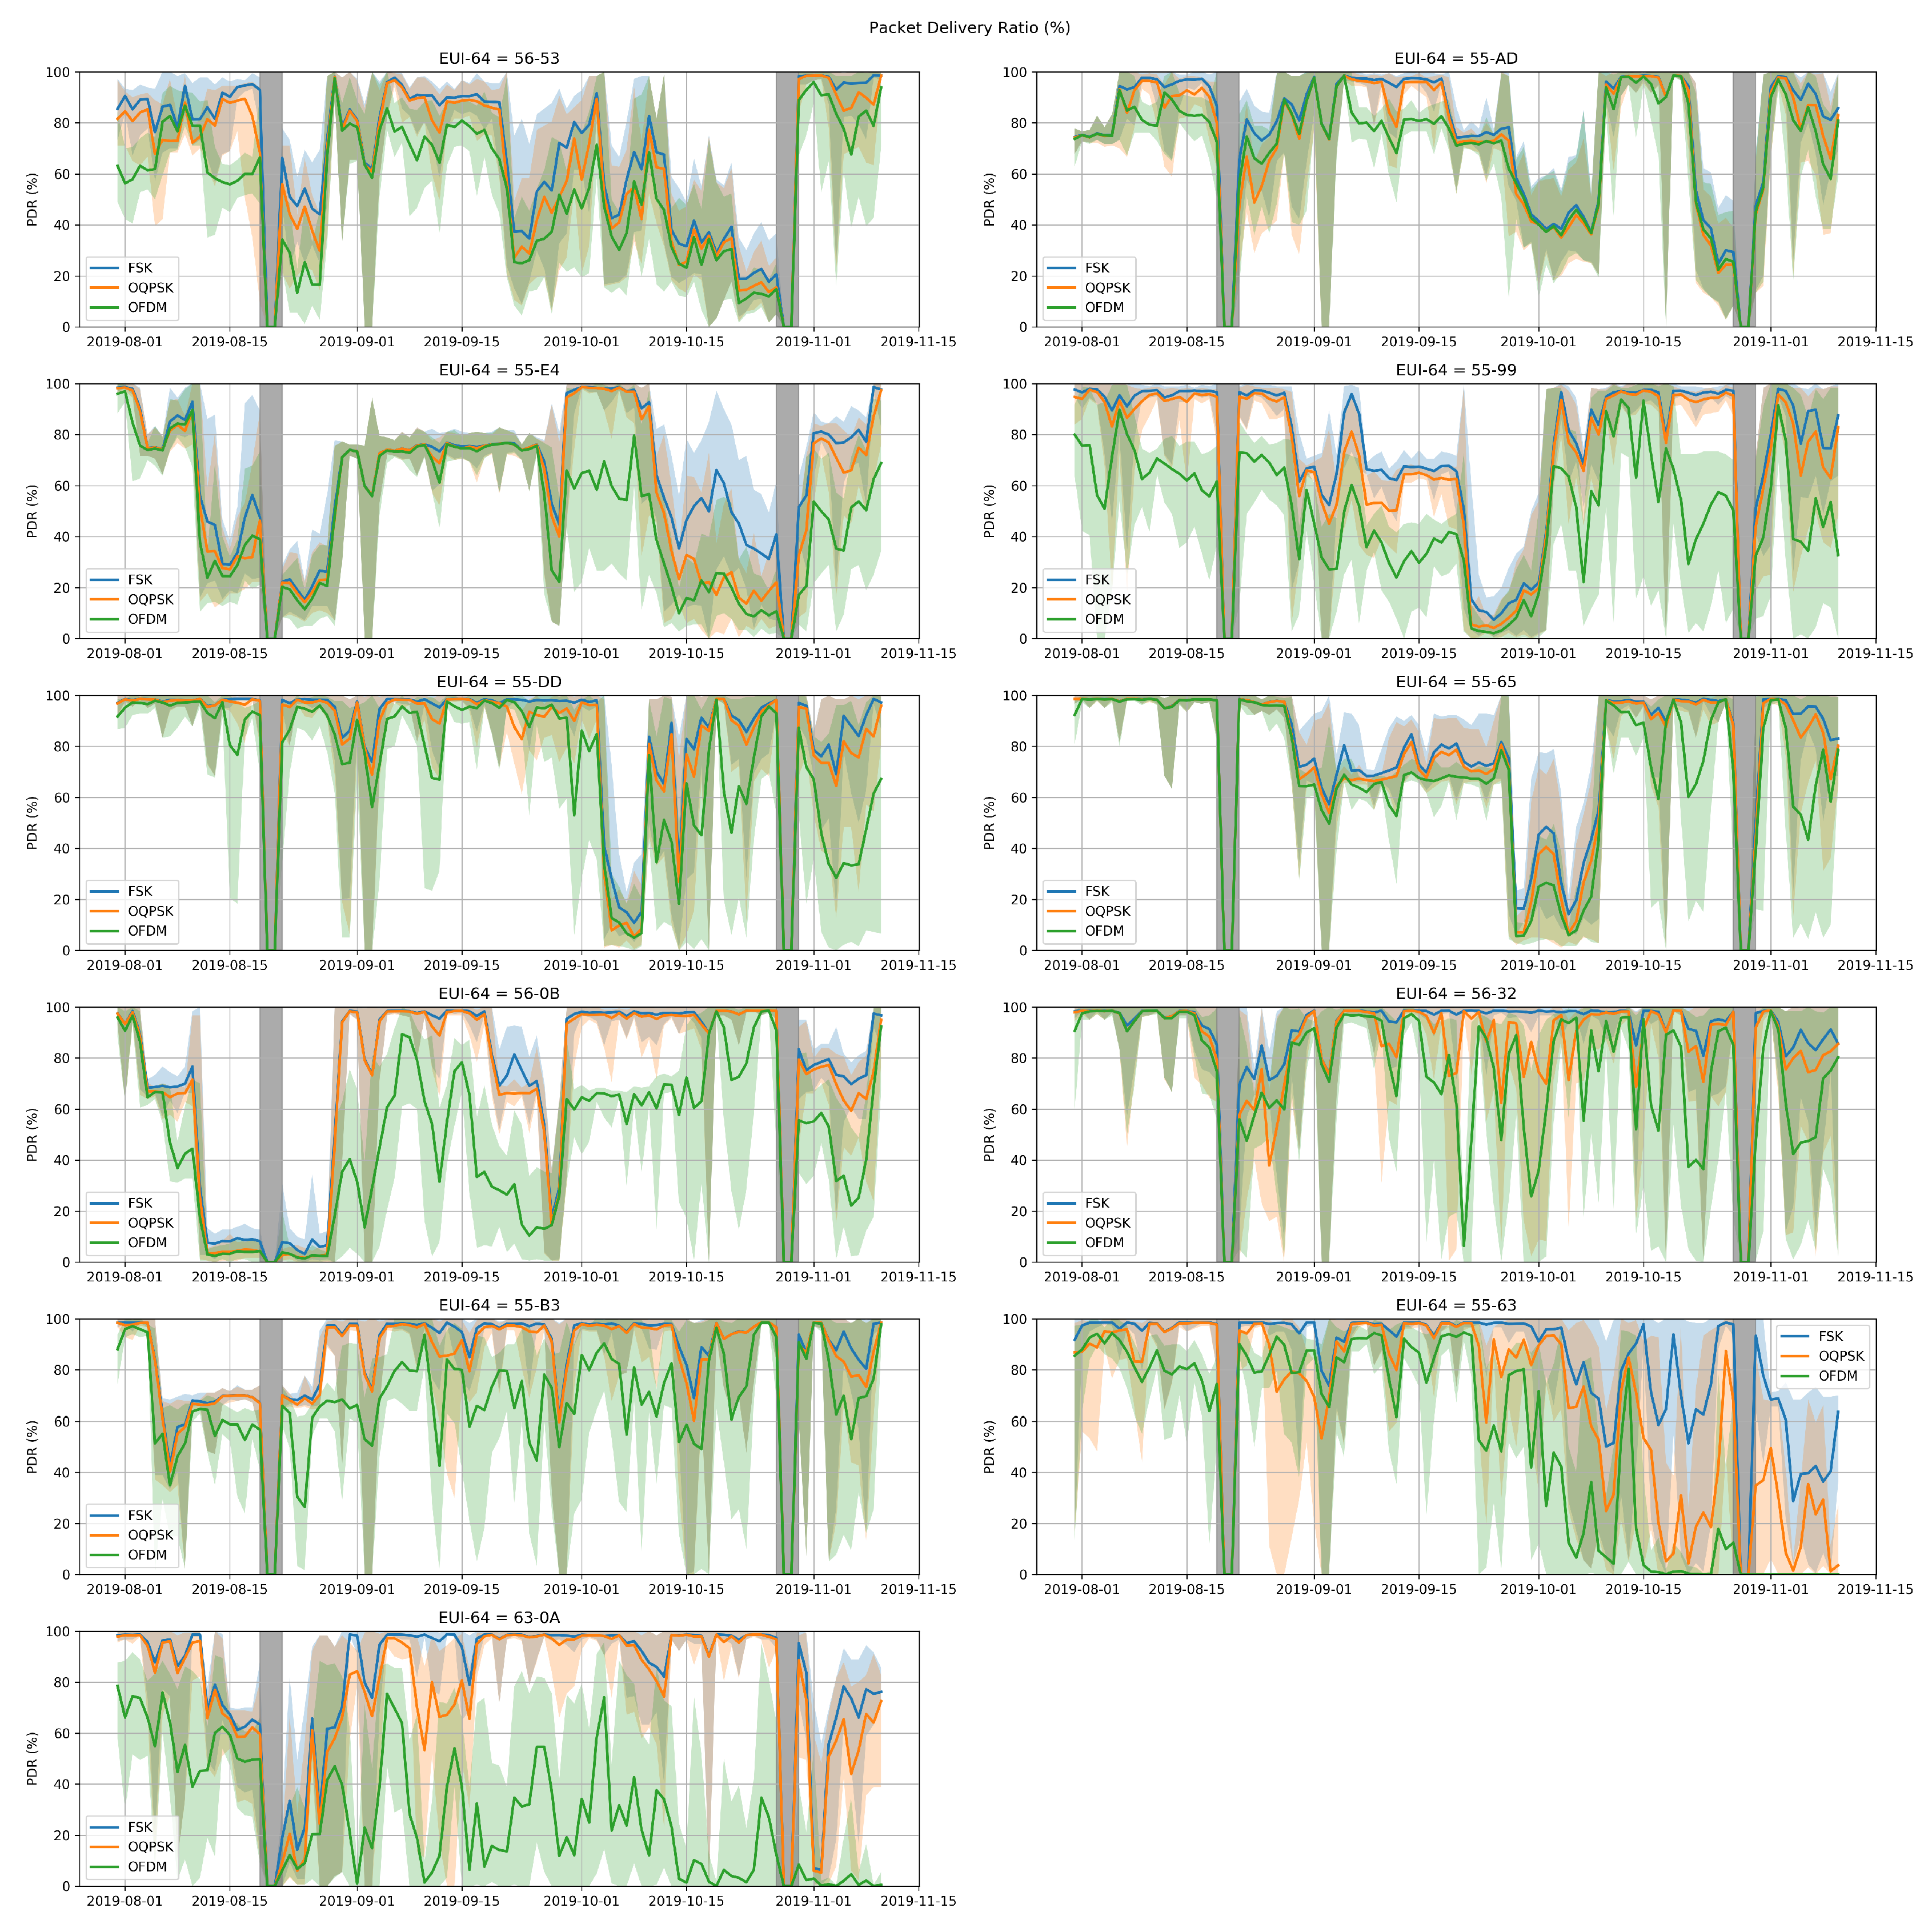
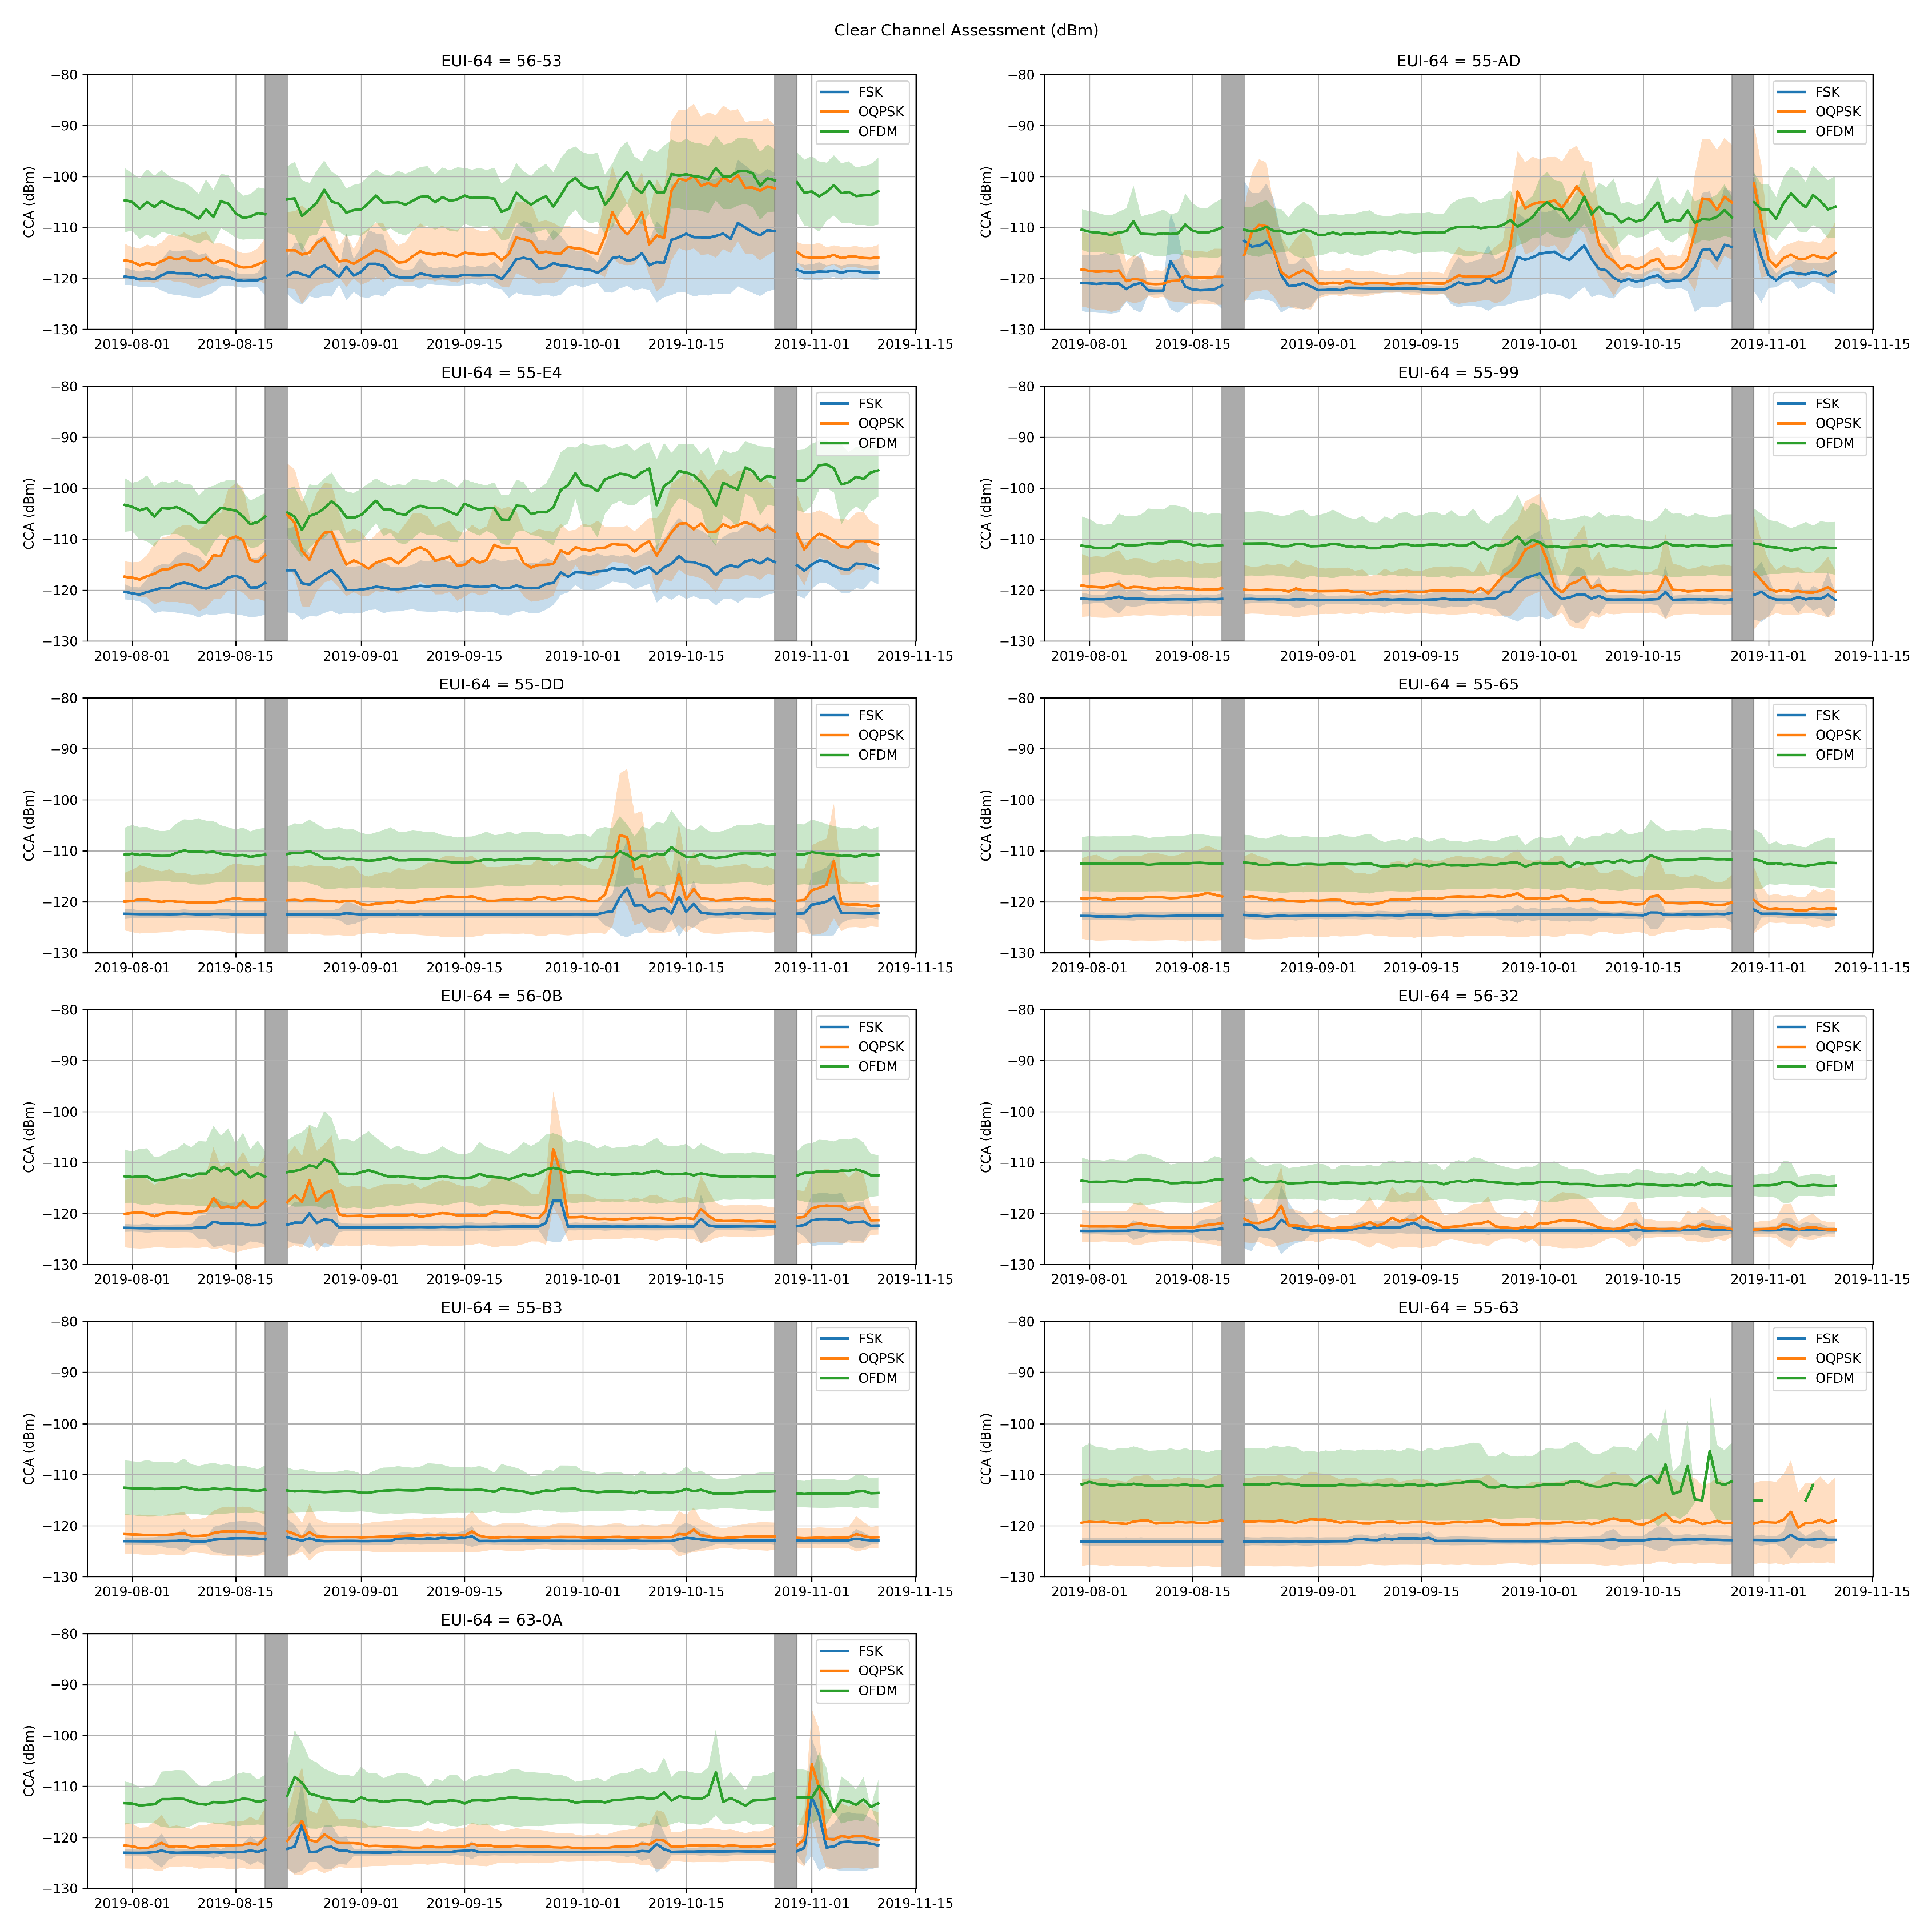
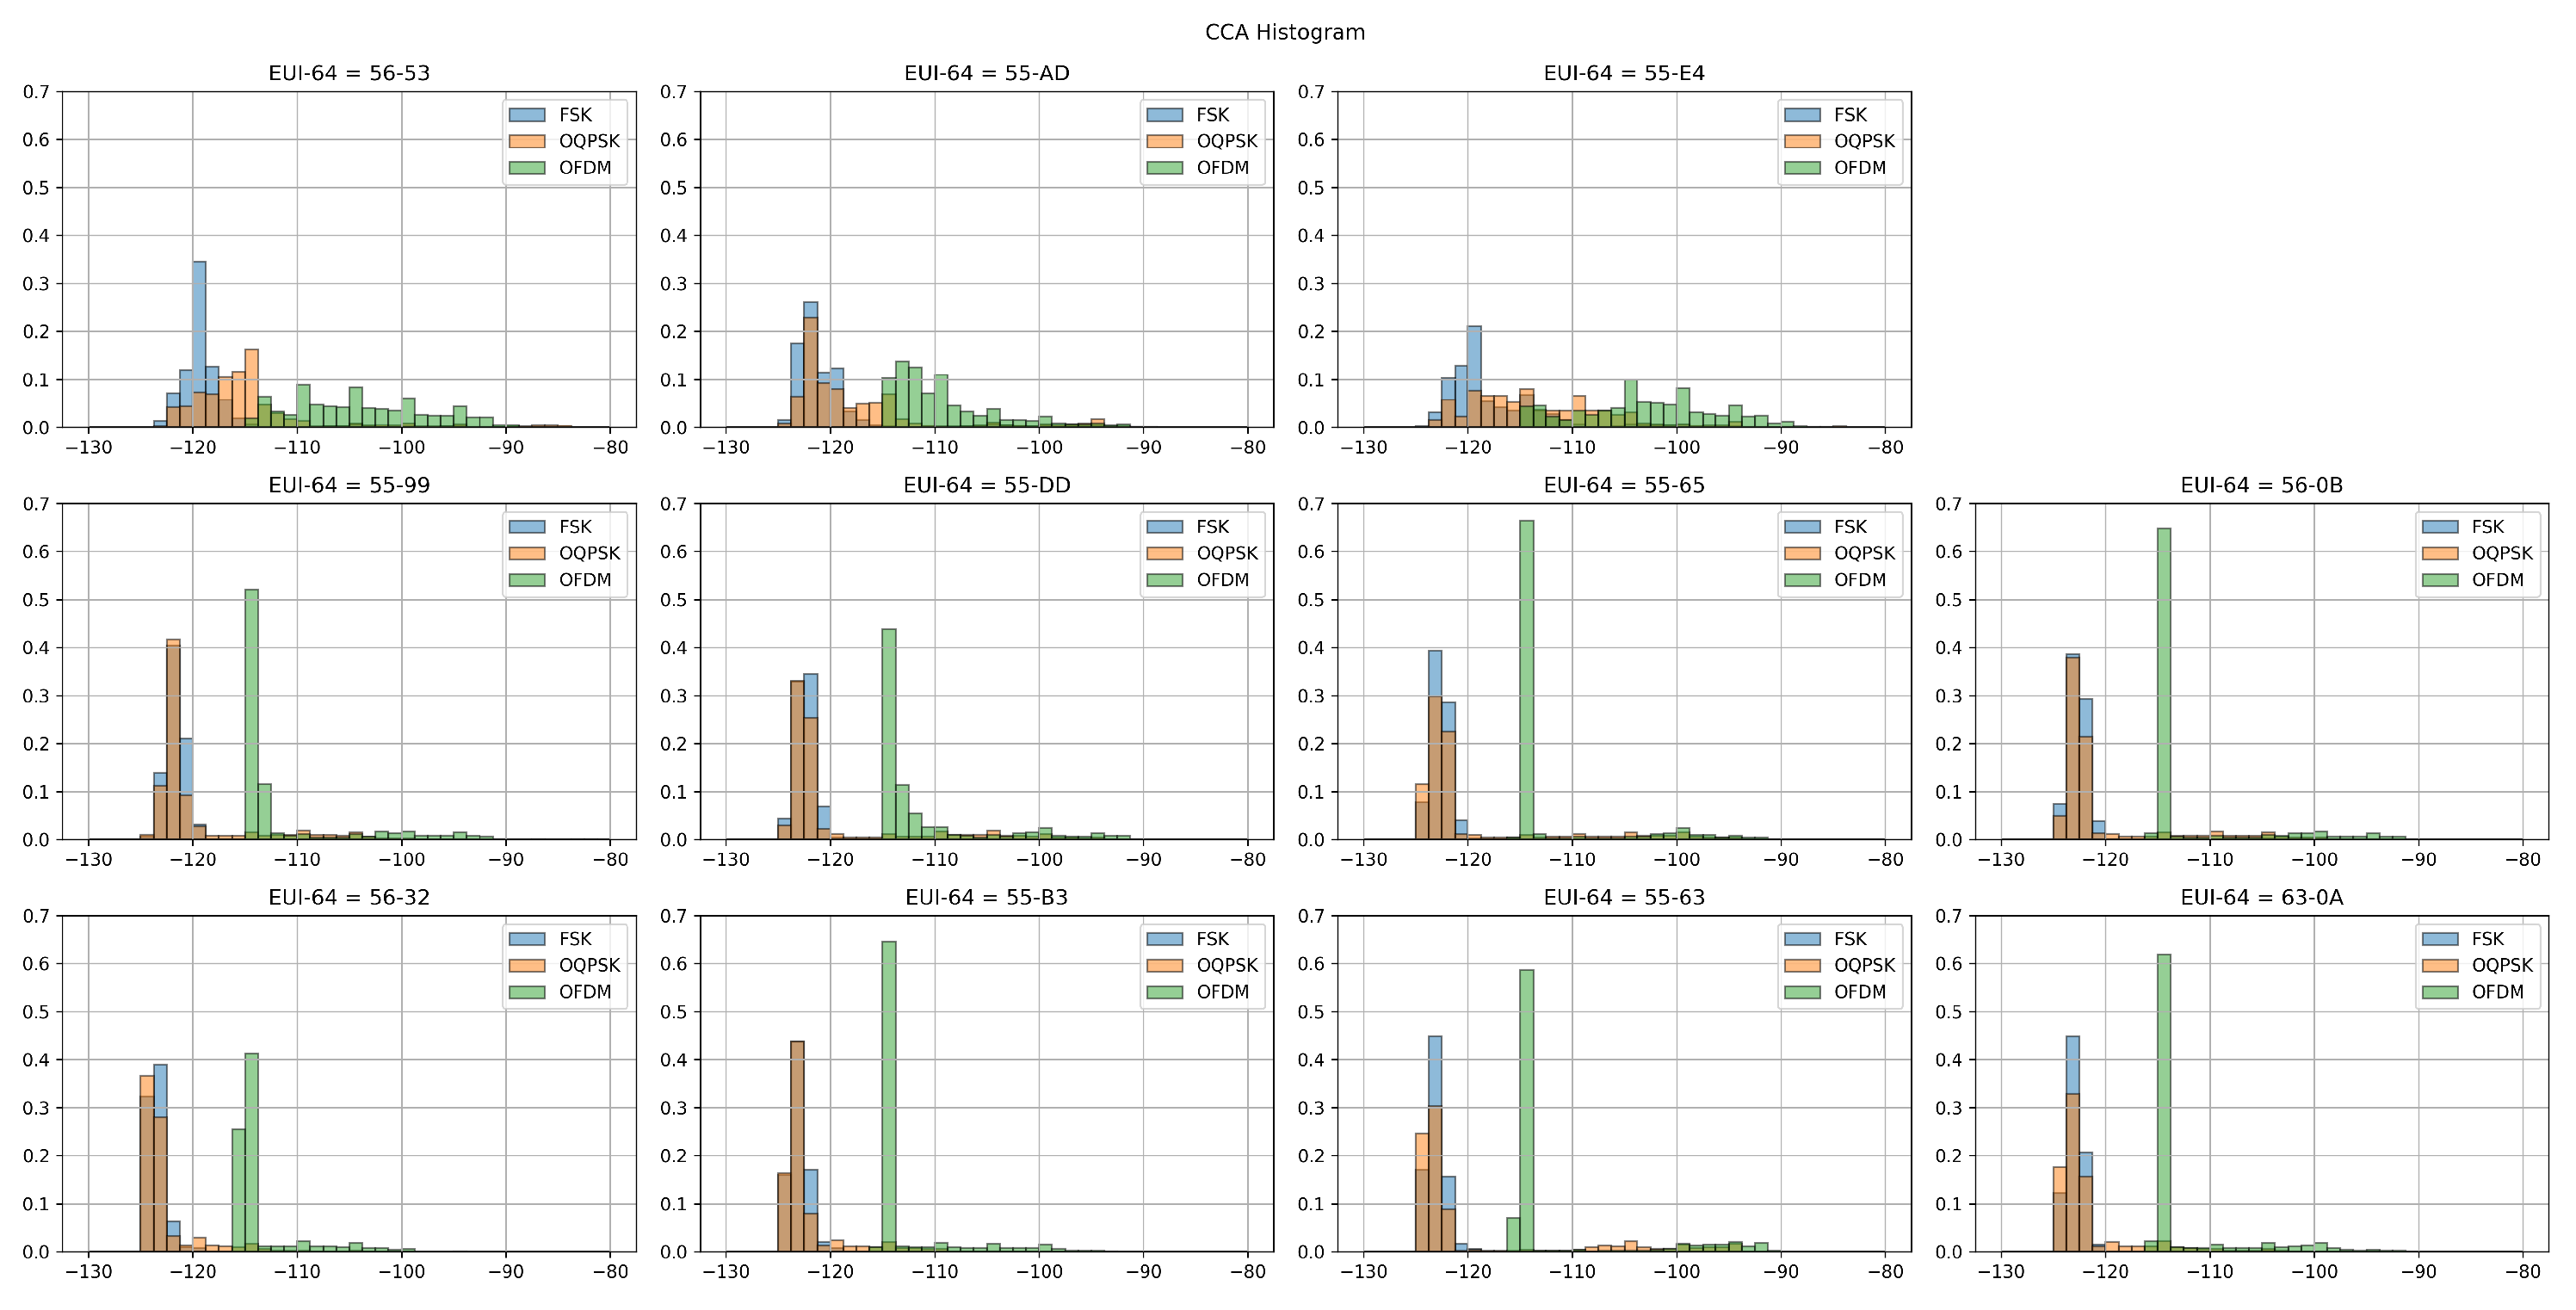
4. Performance Evaluation
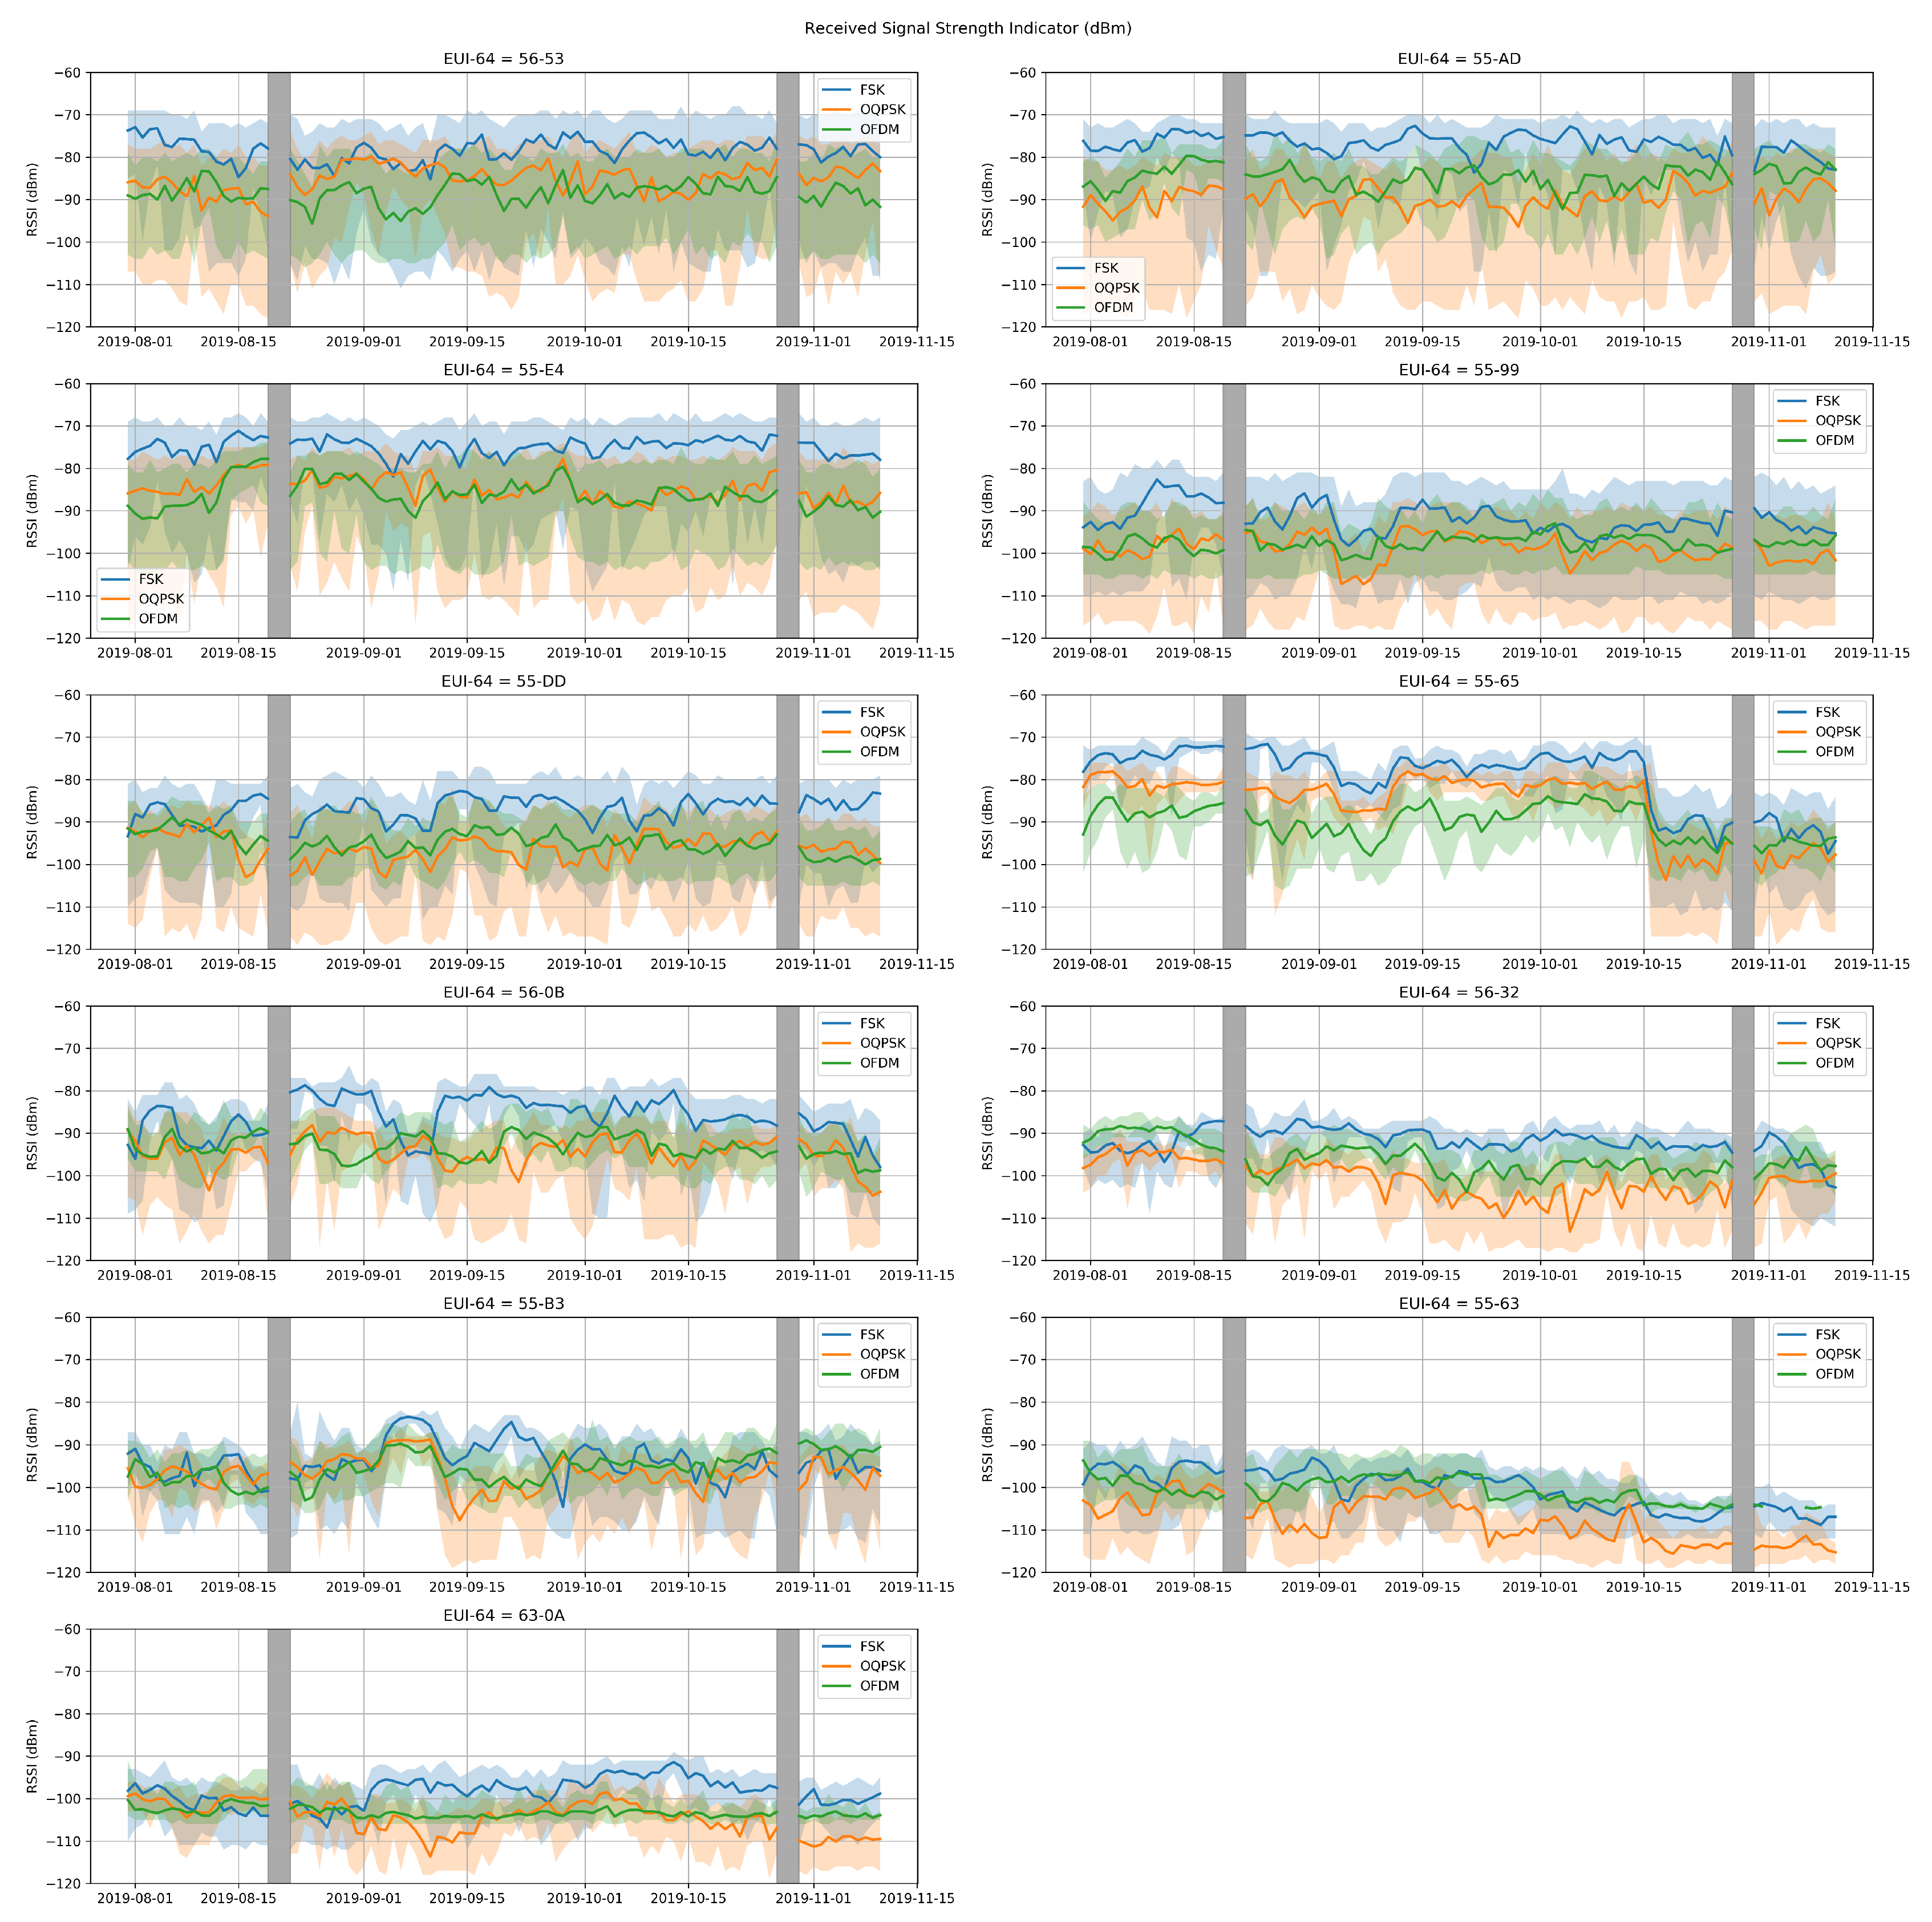
- RSSI (Received Signal Strength Indicator): average power (dBm) of a packet that has been received by the gateway;
- CCA (Clear Channel Assessment): average power (dBm) that a transmitter has sampled before transmitting a packet;
- PDR (Packet Delivery Ratio): percentage of packets that have been successfully received by the gateway within a given period of time.
4.1. Overview
- day: the day that the data packet was received in yyyy/mm/dd format;
- hour: the hour that the data packet was received in hh/mm/ss format;
- pkt_number: the number of the data packet received;
- pkt_retry: the number of the data packet retries (i.e., 0, 1, 2).
- rssi: The RSSI value (dBm) for the current data packet received;
- cca: The CCA value (dBm) sampled before the current data packet was transmitted;
- cca_retries: The number of retries before the transmission passed the CCA check and the data packet was transmitted.
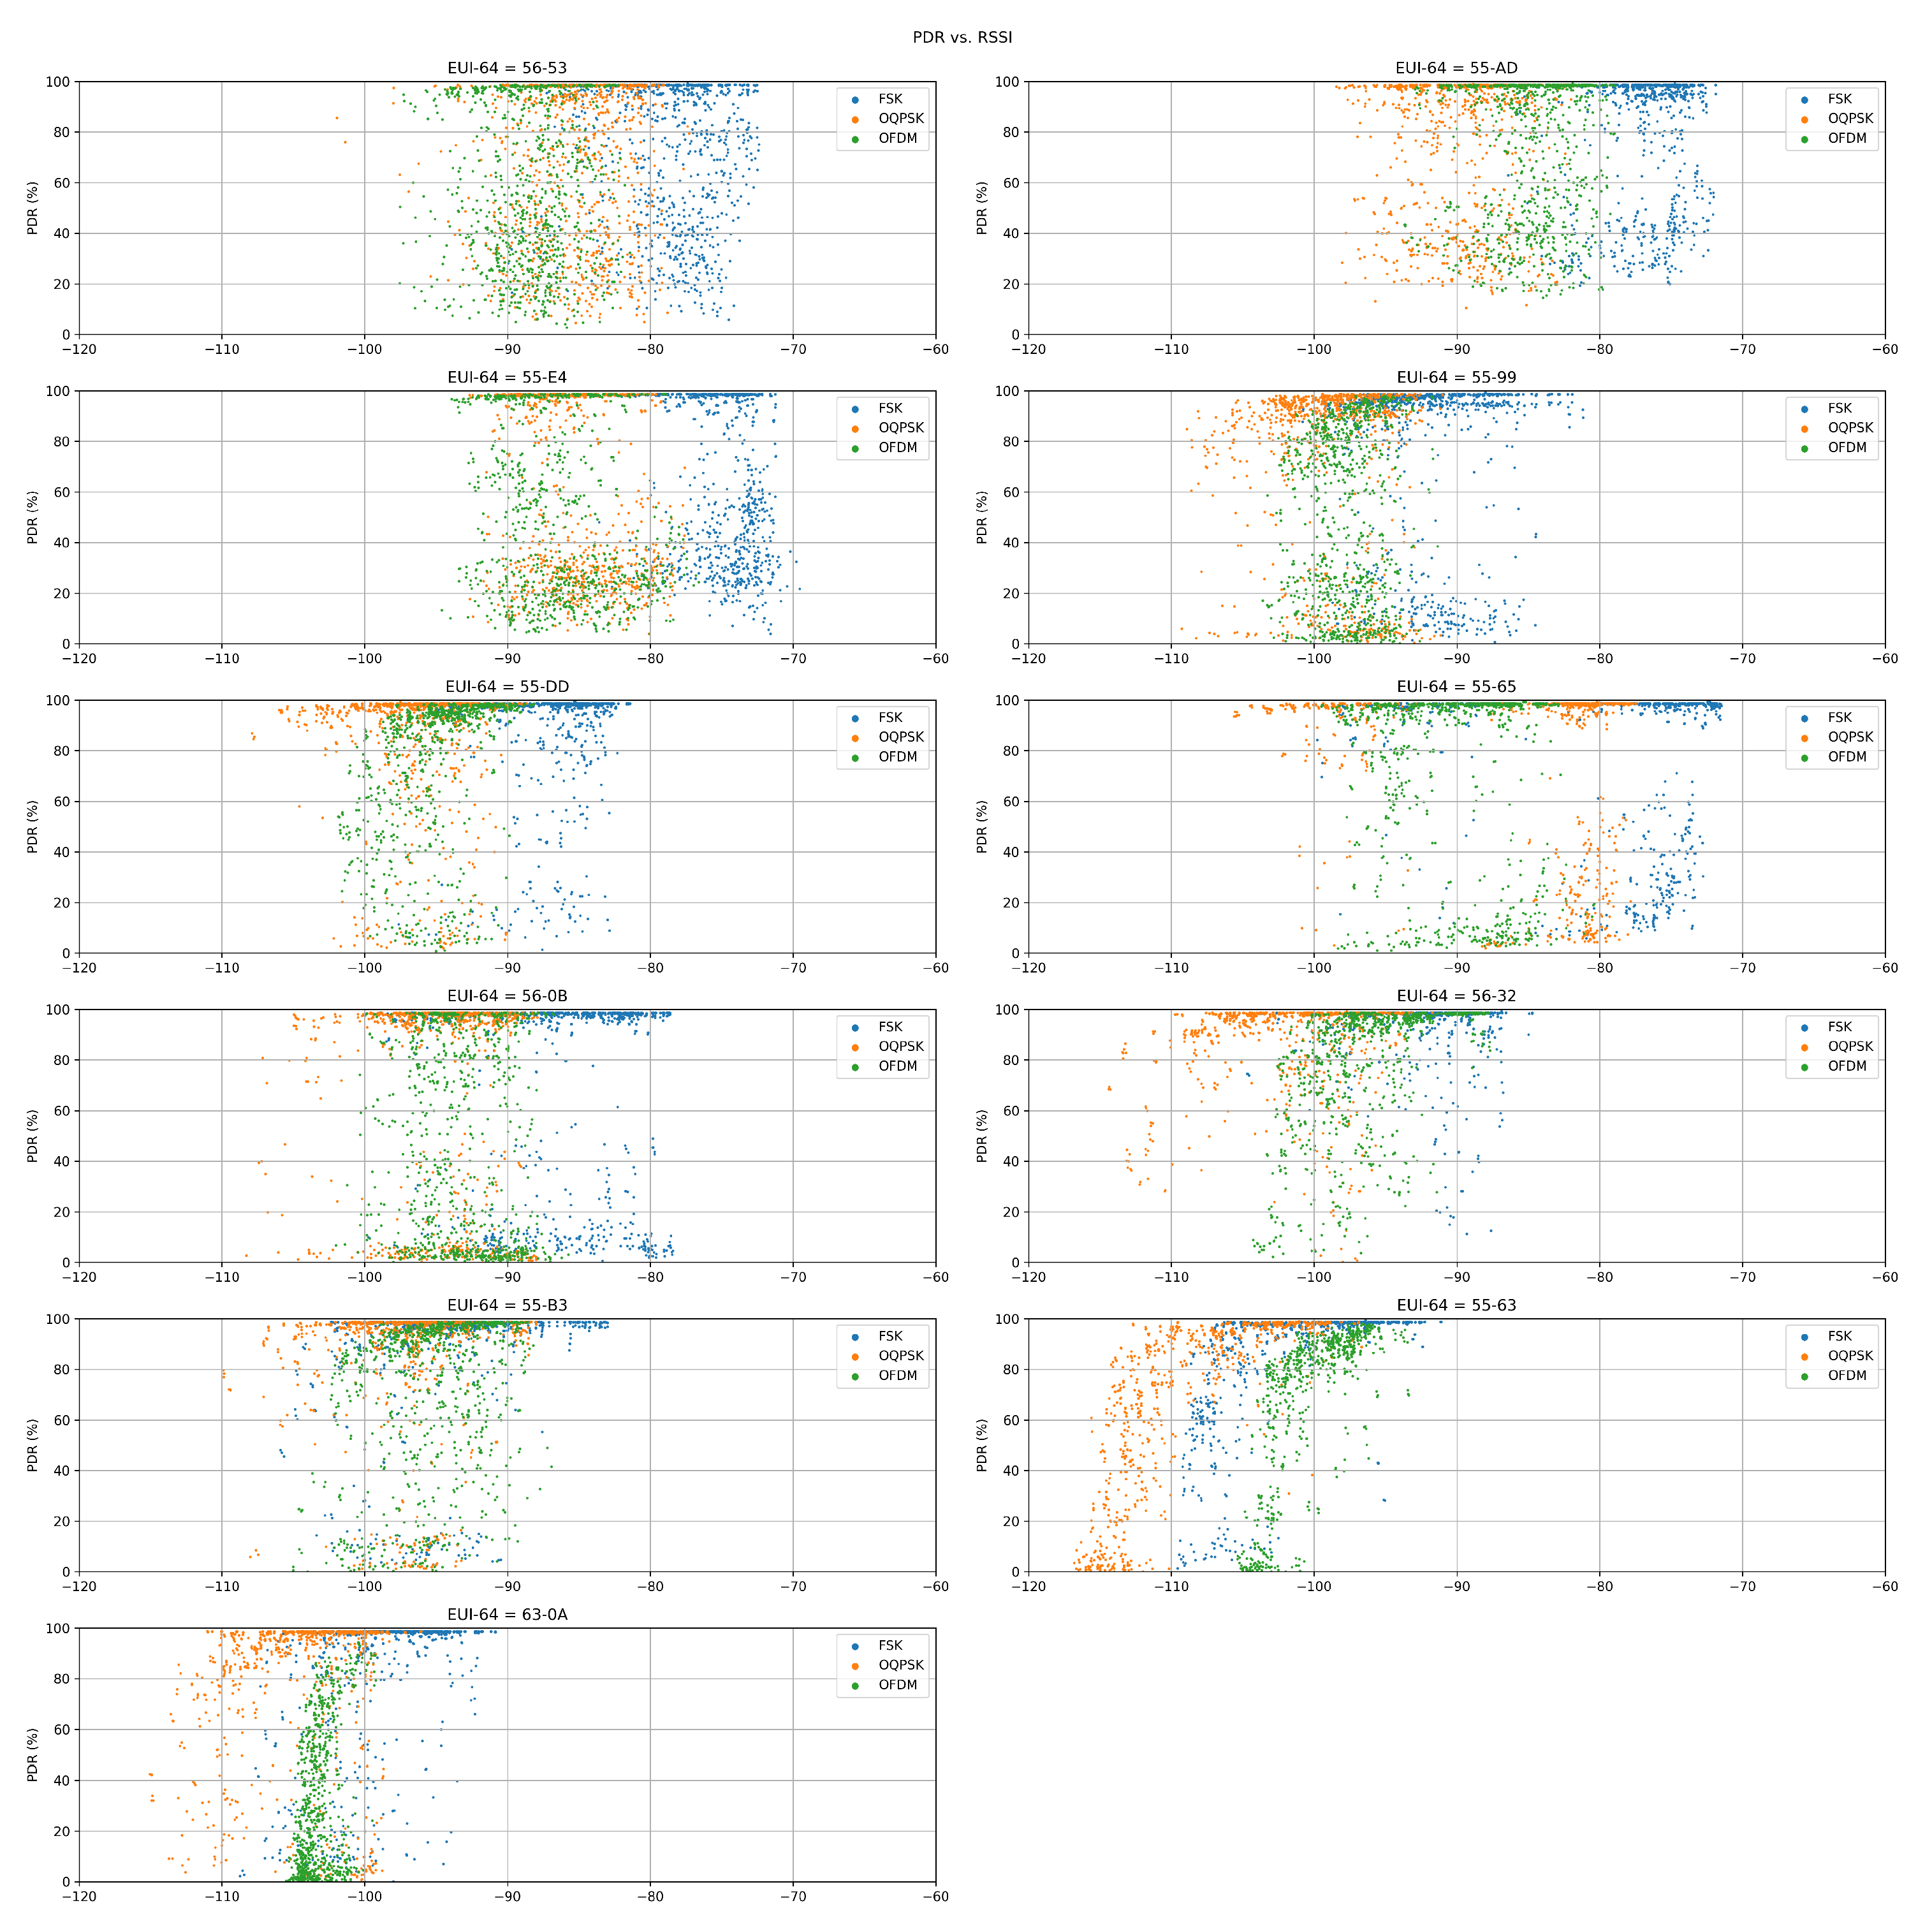
4.2. Data Analysis
5. Discussion
6. Conclusions
Author Contributions
Funding
Acknowledgments
Conflicts of Interest
References
- Bartolomeu, P.; Alam, M.; Ferreira, J.; Fonseca, J.A. Supporting Deterministic Wireless Communications in Industrial IoT. IEEE Trans. Ind. Informat. 2018, 14, 4045–4054. [Google Scholar] [CrossRef]
- Baccour, N.; Koubundefineda, A.; Mottola, L.; Zúñiga, M.A.; Youssef, H.; Boano, C.A.; Alves, M. Radio Link Quality Estimation in Wireless Sensor Networks: A Survey. ACM Trans. Sen. Netw. 2012, 8. [Google Scholar] [CrossRef]
- Thubert, P.; Cavalcanti, D.; Vilajosana, X.; Schmitt, C. Reliable and Available Wireless Technologies. Internet-Draft Draft-Thubert-Raw-Technologies-04, IETF Secretariat, 2020. Available online: https://datatracker.ietf.org/doc/draft-thubert-raw-technologies (accessed on 7 July 2020).
- Koutsiamanis, R.A.; Papadopoulos, G.; Jenschke, T.L.; Thubert, P.; Montavont, N. Meet the PAREO Functions: Towards Reliable and Available Wireless Networks. In Proceedings of the 2020 IEEE International Conference on Communications (ICC), Dublin, Ireland, 7–11 June 2020. [Google Scholar]
- IEEE Standard for Low-Rate Wireless Networks. In IEEE Std 802.15.4-2015 (Revision of IEEE Std 802.15.4-2011); IEEE: Piscataway, NJ, USA, 2016; pp. 1–709. [CrossRef]
- Chang, K.-H.; Mason, B. The IEEE 802.15.4g standard for smart metering utility networks. In Proceedings of the 2012 IEEE Third International Conference on Smart Grid Communications (SmartGridComm), Tainan, Taiwan, 5–8 November 2012; pp. 476–480. [Google Scholar] [CrossRef]
- Mochizuki, K.; Obata, K.; Mizutani, K.; Harada, H. Development and field experiment of wide area Wi-SUN system based on IEEE 802.15.4g. In Proceedings of the 2016 IEEE 3rd World Forum on Internet of Things (WF-IoT), Reston, VA, USA, 12–14 December 2016; pp. 76–81. [Google Scholar] [CrossRef]
- Sum, C.S.; Zhou, M.T.; Kojima, F.; Harada, H. Experimental Performance Evaluation of Multihop IEEE 802.15.4/4g/4e Smart Utility Networks in Outdoor Environment. Wirel. Commun. Mob. Comput. 2017, 2017, 1–13. [Google Scholar] [CrossRef] [Green Version]
- Muñoz, J.; Chang, T.; Vilajosana, X.; Watteyne, T. Evaluation of IEEE802.15.4g for Environmental Observations. Sensors 2018, 18, 3468. [Google Scholar] [CrossRef] [PubMed] [Green Version]
- Muñoz, J.; Riou, E.; Vilajosana, X.; Muhlethaler, P.; Watteyne, T. Overview of IEEE802.15.4g OFDM and its applicability to smart building applications. In Proceedings of the 2018 Wireless Days (WD), Dubai, UAE, 3–5 April 2018; pp. 123–130. [Google Scholar] [CrossRef] [Green Version]
- IEEE Standard for Local and Metropolitan Area Networks–Part 15.4: Low-Rate Wireless Personal Area Networks (LR-WPANs) Amendment 1: MAC sublayer. In IEEE Std 802.15.4e-2012 (Amendment to IEEE Std 802.15.4-2011); IEEE: Piscataway, NJ, USA, 2012; pp. 1–225. [CrossRef]
- IEEE Standard for Local and Metropolitan Area Networks–Part 15.4: Low-Rate Wireless Personal Area Networks (LR-WPANs) Amendment 3: Physical Layer (PHY) Specifications for Low-Data-Rate, Wireless, Smart Metering Utility Networks. In IEEE Std 802.15.4g-2012 (Amendment to IEEE Std 802.15.4-2011); IEEE: Piscataway, NJ, USA, 2012; pp. 1–252.
- Vilajosana, X.; Tuset, P.; Watteyne, T.; Pister, K. OpenMote: Open-Source Prototyping Platform for the Industrial IoT. In Ad Hoc Networks; Mitton, N., Kantarci, M.E., Gallais, A., Papavassiliou, S., Eds.; Springer International Publishing: Cham, Switzerland, 2015; pp. 211–222. [Google Scholar]
- Tuset-Peiró, P.; Vilajosana, X.; Watteyne, T. OpenMote+: A Range-Agile Multi-Radio Mote. In Proceedings of the 2016 International Conference on Embedded Wireless Systems and Networks (EWSN ’16), Graz, Austria, 15–17 February 2016; Junction Publishing: Junction, TX, USA, 2016; pp. 333–334. [Google Scholar]
- Texas Instruments. CC2538 Powerful Wireless Microcontroller System-On-Chip for 2.4-GHz IEEE 802.15.4, 6LoWPAN, and ZigBee® Applications (Rev. SWRS096D); 2015; Available online: https://www.digikey.com/catalog/en/partgroup/cc2538/37841 (accessed on 7 July 2020).
- Atmel. AT86RF215 Device Family: Sub-1GHz/2.4GHz Transceiver and I/Q Radio for IEEE Std 802.15.4-2015 (Rev. 42415E); 2016; Available online: http://ww1.microchip.com/downloads/en/devicedoc/atmel-42415-wireless-at86rf215_datasheet.pdf (accessed on 7 July 2020).
- Bosch. BME280: Combined Humidity and Pressure Sensor (BST-BME280-DS002-15); 2018; Available online: https://www.bosch-sensortec.com/products/environmental-sensors/humidity-sensors-bme280/ (accessed on 7 July 2020).
- Texas Instruments. OPT3001: Ambient Light Sensor (SBOS681C); 2017; Available online: https://datasheetspdf.com/pdf/1411531/etcTI/OPT3001/1 (accessed on 7 July 2020).
- De Armas, J.; Tuset, P.; Chang, T.; Adelantado, F.; Watteyne, T.; Vilajosana, X. Determinism through Path Diversity: Why Packet Replication Makes Sense. In Proceedings of the 2016 International Conference on Intelligent Networking and Collaborative Systems (INCoS), Ostrawva, Czech Republic, 7–9 September 2016; pp. 150–154. [Google Scholar] [CrossRef]
- Haxhibeqiri, J.; De Poorter, E.; Moerman, I.; Hoebeke, J. A Survey of LoRaWAN for IoT: From Technology to Application. Sensors 2018, 18, 3995. [Google Scholar] [CrossRef] [PubMed] [Green Version]


| EUI-64 (Last 2 bytes) | Distance (m) | Height (m) | Cluster Group |
|---|---|---|---|
| 56-53 | 34.0 | 12.0 | Close |
| 55-AD | 63.0 | 2.0 | Close |
| 55-E4 | 80.0 | 6.0 | Close |
| 55-99 | 115.1 | 2.0 | Medium |
| 55-DD | 115.1 | 6.0 | Medium |
| 55-65 | 115.1 | 10.0 | Medium |
| 56-0B | 115.1 | 14.0 | Medium |
| 56-32 | 172.5 | 2.0 | Far |
| 55-B3 | 221.4 | 2.0 | Far |
| 55-63 | 224.4 | 2.0 | Far |
| 63-0A | 273.5 | 2.0 | Far |
| SUN-FSK | SUN-OQPSK | SUN-OFDM | |
|---|---|---|---|
| Name | Mode 1 | Mode 3 | Option 2 MCS0 |
| Data rate (kbps) | 50 | 50 | 50 |
| Modulation type | BFSK | OQPSK | BPSK |
| Modulation index | 1.0 | N/A | N/A |
| Chip rate (kchips/s) | N/A | 100 | N/A |
| Spreading mode | N/A | SHR:(32,1)-DSSS PHR:(8,1)-DSSS PSDU: none | N/A |
| Pilots Total/Data/Pilot | N/A | N/A | 52/48/4 |
| Center frequency (MHz) | 863.125 | 868.3 | 863.425 |
| Channel spacing (kHz) | 200 | 1300 | 800 |
| Available channels | 34 | 3 | 8 |
| Transmit power (dBm) | 15 | 15 | 9 |
| Sensitivity (dBm) | −114 | −116 | −111 |
| CCA Threshold (dBm) | −94 | −93 | −91 |
| Notes | FEC: yes | Coding rate: 1/2 Interleaver: yes | Coding rate: 1/2 Freq.repetition: 4× |
| EUI-64 (2 bytes) | Received Packets | RSSI (dBm) | CCA (dBm) | PDR (%) |
|---|---|---|---|---|
| 56-53 | 924574 | −84.0 | −112.4 | 72.1 |
| 55-AD | 1024664 | −83.7 | −115.5 | 79.9 |
| 55-E4 | 872200 | −82.1 | −111.2 | 68.0 |
| 55-99 | 897718 | −96.2 | −117.5 | 70.0 |
| 55-DD | 1091950 | −92.5 | −117.3 | 85.1 |
| 55-65 | 1058746 | −85.3 | −118.3 | 82.5 |
| 56-0B | 871477 | −91.3 | −118.4 | 67.9 |
| 56-32 | 1121696 | −96.1 | −119.9 | 87.4 |
| 55-B3 | 1076572 | −95.0 | −119.3 | 83.9 |
| 55-63 | 926221 | −101.7 | −118.1 | 72.2 |
| 63-0A | 845050 | −101.6 | −119.0 | 65.9 |
| Mean | 10710868 | −91.8 | −117.0 | 75.9 |
| EUI-64 (2 bytes) | SUN-FSK | SUN-OQPSK | SUN-OFDM | ||||||
|---|---|---|---|---|---|---|---|---|---|
| RSSI (dBm) | CCA (dBm) | PDR (%) | RSSI (dBm) | CCA (dBm) | PDR (%) | RSSI (dBm) | CCA (dBm) | PDR (%) | |
| 56-53 | −78.5 | −118.5 | 71.7 | −85.0 | −114.6 | 75.7 | −88.4 | −104.0 | 68.8 |
| 55-AD | −76.8 | −120.0 | 79.8 | −89.6 | −117.4 | 78.5 | −84.7 | −109.2 | 81.2 |
| 55-E4 | −75.3 | −117.6 | 66.8 | −84.9 | −113.2 | 70.3 | −86.1 | −102.8 | 66.8 |
| 55-99 | −91.9 | −121.6 | 77.6 | −99.0 | −119.7 | 77.0 | −97.7 | −111.3 | 55.2 |
| 55-DD | −86.9 | −122.2 | 88.9 | −96.1 | −119.5 | 88.1 | −94.5 | −111.1 | 78.4 |
| 55-65 | −79.8 | −122.6 | 81.5 | −85.9 | −119.8 | 88.1 | −90.1 | −112.4 | 78.0 |
| 56-0B | −86.2 | −122.5 | 74.4 | −94.4 | −120.4 | 74.7 | −93.4 | −112.4 | 54.6 |
| 56-32 | −92.0 | −123.2 | 93.9 | −101.0 | −122.4 | 89.4 | −95.5 | −114.0 | 79.0 |
| 55-B3 | −93.4 | −122.8 | 88.3 | −96.8 | −122.0 | 89.0 | −94.9 | −113.1 | 74.4 |
| 55-63 | −99.6 | −122.9 | 86.7 | −106.2 | −119.3 | 74.7 | −99.4 | −112.0 | 55.1 |
| 63-0A | −97.9 | −122.7 | 84.8 | −104.1 | −121.5 | 82.2 | −102.8 | −112.7 | 30.6 |
| Mean | −87.1 | −121.5 | 81.3 | −94.8 | −119.1 | 80.7 | −93.4 | −110.5 | 65.7 |
| Std. Dev. | 8.2 | 1.8 | 7.8 | 7.2 | 2.8 | 6.6 | 5.3 | 3.5 | 14.7 |
| EUI-64 (2 bytes) | SUN-FSK | SUN-OQPSK | SUN-OFDM | ||||||
|---|---|---|---|---|---|---|---|---|---|
| P | P | P | P | P | P | P | P | P | |
| 56-53 | 68.2 | 77.1 | 69.8 | 70.6 | 79.8 | 76.6 | 70.0 | 71.9 | 64.7 |
| 55-AD | 83.4 | 81.2 | 74.9 | 81.6 | 80.2 | 73.8 | 87.9 | 83.5 | 72.2 |
| 55-E4 | 75.4 | 70.9 | 54.2 | 78.0 | 75.2 | 57.7 | 69.7 | 66.4 | 64.4 |
| 55-99 | 80.4 | 71.8 | 80.6 | 79.7 | 71.1 | 80.2 | 68.3 | 59.2 | 38.2 |
| 55-DD | 89.3 | 88.5 | 88.8 | 87.4 | 88.0 | 88.9 | 78.5 | 77.8 | 78.8 |
| 55-65 | 68.3 | 88.3 | 87.9 | 80.0 | 92.4 | 91.8 | 63.1 | 85.1 | 85.7 |
| 56-0B | 68.4 | 80.1 | 74.7 | 69.6 | 79.6 | 75.1 | 64.5 | 63.4 | 35.9 |
| 56-32 | 94.7 | 92.0 | 95.0 | 90.3 | 87.4 | 90.4 | 80.3 | 77.3 | 79.5 |
| 55-B3 | 94.4 | 94.0 | 76.7 | 94.8 | 94.2 | 77.9 | 78.0 | 84.7 | 60.6 |
| 55-63 | 82.4 | 88.7 | 89.1 | 71.7 | 75.5 | 77.1 | 55.8 | 55.9 | 53.7 |
| 63-0A | 86.6 | 83.5 | 84.3 | 84.2 | 80.5 | 81.9 | 31.7 | 28.1 | 31.9 |
| Mean | 81.0 | 83.3 | 79.6 | 80.7 | 82.2 | 79.2 | 68.0 | 68.5 | 60.5 |
| Std. Dev. | 9.5 | 7.5 | 10.9 | 7.8 | 7.0 | 9.1 | 14.3 | 16.1 | 17.7 |
© 2020 by the authors. Licensee MDPI, Basel, Switzerland. This article is an open access article distributed under the terms and conditions of the Creative Commons Attribution (CC BY) license (http://creativecommons.org/licenses/by/4.0/).
Share and Cite
Tuset-Peiró, P.; Gomes, R.D.; Thubert, P.; Cuerva, E.; Egusquiza, E.; Vilajosana, X. A Dataset to Evaluate IEEE 802.15.4g SUN for Dependable Low-Power Wireless Communications in Industrial Scenarios. Data 2020, 5, 64. https://0-doi-org.brum.beds.ac.uk/10.3390/data5030064
Tuset-Peiró P, Gomes RD, Thubert P, Cuerva E, Egusquiza E, Vilajosana X. A Dataset to Evaluate IEEE 802.15.4g SUN for Dependable Low-Power Wireless Communications in Industrial Scenarios. Data. 2020; 5(3):64. https://0-doi-org.brum.beds.ac.uk/10.3390/data5030064
Chicago/Turabian StyleTuset-Peiró, Pere, Ruan D. Gomes, Pascal Thubert, Eva Cuerva, Eduard Egusquiza, and Xavier Vilajosana. 2020. "A Dataset to Evaluate IEEE 802.15.4g SUN for Dependable Low-Power Wireless Communications in Industrial Scenarios" Data 5, no. 3: 64. https://0-doi-org.brum.beds.ac.uk/10.3390/data5030064