Data Descriptor

A State-Level Socioeconomic Data Collection of the United States for COVID-19 Research

1
NSF Spatiotemporal Innovation Center, George Mason University, Fairfax, VA 22030, USA
2
Department of Geography and GeoInformation Science, George Mason University, Fairfax, VA 22030, USA
*
Author to whom correspondence should be addressed.
Submission received: 21 November 2020 / Revised: 9 December 2020 / Accepted: 10 December 2020 / Published: 11 December 2020
(This article belongs to the Special Issue Data-Driven Modelling of Infectious Diseases)

Abstract

:
The outbreak of COVID-19 from late 2019 not only threatens the health and lives of humankind but impacts public policies, economic activities, and human behavior patterns significantly. To understand the impact and better prepare for future outbreaks, socioeconomic factors play significant roles in (1) determinant analysis with health care, environmental exposure and health behavior; (2) human mobility analyses driven by policies; (3) economic pressure and recovery analyses for decision making; and (4) short to long term social impact analysis for equity, justice and diversity. To support these analyses for rapid impact responses, state level socioeconomic factors for the United States of America (USA) are collected and integrated into topic-based indicators, including (1) the daily quantitative policy stringency index; (2) dynamic economic indices with multiple time frequency of GDP, international trade, personal income, employment, the housing market, and others; (3) the socioeconomic determinant baseline of the demographic, housing financial situation and medical resources. This paper introduces the measurements and metadata of relevant socioeconomic data collection, along with the sharing platform, data warehouse framework and quality control strategies. Different from existing COVID-19 related data products, this collection recognized the geospatial and dynamic factor as essential dimensions of epidemiologic research and scaled down the spatial resolution of socioeconomic data collection from country level to state level of the USA with a standard data format and high quality.
Dataset:https://github.com/stccenter/COVID-19-Data/tree/master/Socioeconomic%20Data is the data repository link to access the latest data collection with well-formatted documents.
Dataset License: CC-BY.

1. Summary

The once-in-a-100-year Coronavirus Disease 2019 (COVID-19) pandemic has resulted in over 44 million confirmed cases and 1.2 million deaths by the end of October 2020 [1]. Due to the airborne human-to-human transmission of the infectious disease, global governments issued restriction orders of social distancing, self-isolation and travel bans to reduce transmission risk, and consequently caused crucial impacts. In particular, the labor requirements decreased across all economic sectors and unemployment numbers increased [2,3]. To record, measure, and reduce the negative influence on the society and economy caused by the pandemic, a comprehensive socioeconomic factor collection for the pandemic period is urgently needed for comparing, modeling, and predicting the socioeconomic impact of COVID-19.
There are numerous scientific papers on modelling the mechanisms of disease spreading in a spatiotemporal perspective [4,5,6]. In such studies, geography matters in that place, both absolute location and relative spatial relationships, have been widely recognized as an essential dimension of epidemiologic research [7]. The region-based characteristics and the interconnection among spaces have attracted more attention from both public health experts and policy makers for understanding the mechanisms and controlling the spread of disease. The interdependent processes of health, political, economic, and social issues work together and construct the complex social system. Many scholars have attempted to discover the correlation and determination factors of the novel disease from the socioeconomic aspects [8,9].
Under the background of regional or global epidemic events, the affected countries always have social and economic issues. For example, during the Spanish flu, the SARS pneumonia, and the Ebola virus, areas including Europe, various parts of China and West Africa experienced different degrees of recession, including dropped GDP, population, and even sparked diplomatic conflicts and local wars [10,11]. During the severe acute respiratory syndrome coronavirus (SARS-CoV) in 2002, there were serious economic consequences, including a collapse of stock markets in Asia, Europe and the United States, disruption of trade and tourism, stagnation and recession in manufacturing, and reduced supplies of goods, food and medicine [12]. Similarly, a large number of studies have shown that socioeconomic conditions have a strong relationship with the COVID-19 pandemic, and strong interrelations exist among the internal social and economic factors of geographic regions [5,13,14,15,16]. For example, individuals with low socioeconomic status are more likely to suffer from harsher conditions with less accessibility to medical services and financial hardships. Moreover, regions with lower GDPs have limited abilities of public healthcare. Additionally, the demographic issue would also make the region more vulnerable to the pandemic. Furthermore, the mitigation-policy plays a pivotal role in the current process of pandemic control that restrict transportation, lock down cities, and shut down business, which all have great impacts for helping society combat the virus. Financial markets recorded continuous plummeting with four trading curbs in the USA stock market in March 2020 with COVID-19. International trade slowed down after international transportation limitation, businesses went bankrupt and people were left unemployed.
A variety of government departments and agencies offer datasets with raw measurements and variables, but the criteria for data publishing are very mixed. As all of the different information rushes from different sources; a precise, focused, timely, and standardized data collection distributed by a stable platform is needed urgently to provide integrated and convenient data sources for users and decision makers in different domains. Due to the diversity of socioeconomic data sources, the access pipeline and data format are not uniform over all sites. Thus, users must access raw data files through time-consuming manual manipulation or customized operational tools to integrate the multi-source information. For example, the personal income tables [17] from the Bureau of Economic Analysis (BEA) are accessed by URL links while interactive actions of selecting target options are required to obtain the unemployment insurance data from the U.S. Department of Labor [18]. Moreover, not all the indicators from the original datasets are readily meaningful for pandemic research and it is necessary to effectively screen out attributes to highlight the desired characteristics of socioeconomic measurements. For example, the Census Bureau [19] provides thousands of fields for multiple geographic scales each year, but less than 20 factors are widely recognized and used in COVID-19-related analysis and studies [11,20]. Socioeconomic factors such as the policy stringency index [21,22] are broadly accessed and utilized at country level, but not at the state-level in the USA. It is necessary to leverage the state policy as a quantitative constrain with other dynamic spatiotemporal attributes in COVID-19 data collection.
To fill the aforementioned gaps, we propose a preprocessed, filtered and standardized COVID-19 socioeconomic data collection of the USA. The data collection is validated and contains intensive quality control based on integrity, consistency and effectiveness requirements. It offers a crucial data basis for the decision makers to assess loss due to the pandemic and make further mitigation and reopening plans. Researchers can easily implement studies between COVID-19 and socioeconomic factors with the data and the public can be better informed about the crisis impacts. The paper is organized as follows: Section 2 introduces the raw data, selected attribute values, and metadata of the derived data product; Section 3 describes the methodology concerning how derived attributes are organized and produced, how data are processed and stored, and how data quality is controlled; and finally, Section 4 illustrates the data publishing methods and provides access methods.

2. Data Sources

2.1. Raw Measurement of Socioeconomic Factors

2.1.1. Qualitative Restriction Policy Orders

To date, every state of the USA has made great efforts through policies and orders to mitigate the spread of the virus and support testing and treatment of affected communities. The official emergency declaration, policy orders and law documents that allow state governors to execute emergency forces and are a valuable and straightforward data source for researchers to evaluate the policy context. Governmental policy data were originally collected by the Oxford COVID-19 Government Response Tracker program during the pandemic to serve as an indicator of governments’ responsiveness to the crisis among countries globally [21]. We also proposed and generated US state-level restriction policy orders including the social distance restriction and financial/economic supporting policies. To measure and evaluate the policy stringency index, the raw context documents and quantitative data are searched and identified from each state’s official COVID-19 website, alongside executive orders that announce related policies and authoritative news websites (e.g., CNN, New York Times) by a team of over 10 students and volunteers in the National Science Foundation (NSF) Spatiotemporal Innovation Center (STC). The collection of these policies mainly follows the categories proposed by Hale et al. [21], and only policies that either fall under these categories (e.g., mandatory stay at home orders, closures of non-essential businesses, bans on large gatherings, school closures), or have a great impact on people’s lives under COVID-19 (e.g., monetary assistance towards local business) are collected. Since the documents are available online, the original policy materials are recorded as Uniform Resource Locator (URL) in “notes” for coding and retrospect.
Collecting governmental policy data not only informs us about the actions that each government takes, but also enables us to conduct studies and analyses on the effectiveness and influence of the policies. The government’s responsive policy is directly related to the spread of COVID-19. The combination of constructive policies and practical implementation can effectively stop the spread of virus. For example, closure schools and businesses and cancellation of public events helped China control the situation successfully. Moreover, a public information campaign at an early stage can raise the public’s awareness of the pandemic and inform them of the actions that can be taken to protect them from being infected. Additionally, policies restricting national and international travel can help countries that have not had COVID-19 to stop its spread from the start. Overall, policies and executive orders issued by governments are necessary to inform and unite the whole public together to combat the current COVID-19 crisis.

2.1.2. Macroeconomic Indicators

Several macroeconomic variables are utilized to reflect overall economic conditions and play an important role in the analysis and reference of macroeconomic regulation and control during the COVID-19 pandemic from global to country scales [2,23]. Factors such as gross domestic product (GDP), personal income and international trade amount per capita could be used in analysis and to predict the mortality trend, finances and economic performance. Furthermore, the economic indices are expected to decrease with the second or third outbreak waves of COVID-19 in the USA.
GDP by state is defined as “the sum of value added from all industries in the state” and it includes all private and public consumption, investment, government outlays and net exports. The Bureau of Economic Analysis provides the state-level GDP quarterly from the first quarter of year 2016 and will release the third quarter of year 2020 on 23 December 2020. Real GDP and current-dollar GDP and Chain-type quantity indices from raw products are collected in this dataset [24].
The business shutdown and job loss affected the personal income in many industries. According to Pew Research Center, around half of the American lower income class lost jobs because of COVID-19, and only 23% of them have enough money to last three months [25]. Since the lower income class is more likely to find labor jobs or jobs that do not require an educational background, it makes more financial sense for business owners to find a replacement after the pandemic ends [26]. The personal income data are another state-level product provided by the Bureau of Economic Analysis, which has been reliably collecting U.S. personal income quarterly data since 1948. The agency has been releasing reports on a quarterly basis and also at the national, state, and local level [17]. We selected four attributes from this dataset: Overall Compensation, which refers to the compensation including all categories; Farm Compensation, which is compensation for farm related employees; Nonfarm Compensation, which is compensation for non-farm related employees; and lastly the Per capita personal income, which is a ratio-based index calculated as the total personal income of the residents in a state divided by the total population of the state. The attributes were updated to the 2nd quarter of 2020, and the 3rd quarter of 2020 data will be released on 17 December 2020.
International trade of goods and services information for the state are collected from the U.S. Census Bureau, in which the data have been tracked since 1960, every month. By examining and comparing the attribute values of the USA between 2019 and 2020, there are noticeable decreases for both exports and imports ratios starting from March to June of 2020, due to the limitation in import/export transportation policy and resource demand changing during the pandemic [27,28]. Four attributes were picked as the overall indices of international trade business, including the export and import values in the manufactured and non/manufactured commodities. The Manufactured Commodities refer to the trading amounts of manufactured commodities that export/import in millions of dollars. The Non-Manufactured Commodities cover the products from agricultural, forestry, fishery industries in million-dollar units.

2.1.3. Employment

The COVID-19 pandemic has created a major impact in the U.S. Labor Market [29]. Unlike the recession that happened in 2008 in which the labor market faced a slow hit, this pandemic impacted the labor market with an intense speed [29]. By late March 2020, the seasonally adjusted initial claims were 3,283,000, which was the highest number of initial claims filed in the history of the U.S. labor force [18]. To illustrate the impact of COVID-19 crisis in employment, we collected unemployment insurance claim and non-farm payroll datasets published by the United States Department of Labor (DOL) every week. The dataset includes initial claims, insured unemployment rate, continued claims, and covered employment. An unemployed person separated from an employer files an initial claim [4], and if the unemployed person experiences a week of unemployment, he/she will file a continued claim to claim benefits for that week of unemployment [30]. The nonfarm payroll represents the total number of paid employees in the U.S. workforce excluding farm employees, government employees, private household employees, and employees of non-profit organizations [30]. It is one of the most significant economic indicators because it shows the number of new jobs created during the reference period. Thus, it has the potential to indicate that businesses are actively hiring. Additionally, it also indicates that employees can positively contribute to the economy by consumer spending. The Bureau of Labor Statistics (BLS) publishes non-farm payroll data based on two comprehensive surveys, the Household Survey, and the Establishment Survey [18]. The Household Survey pertains to individuals and provides the unemployment rate report as well as details on employment demographics. The Establishment Survey pertains to jobs and provides the number of new nonfarm payroll jobs added within the national economy. Our nonfarm payroll dataset includes the total number of employees from major sectors which are obtained from the Establishment Survey and labor force participation rate, employed persons, and the unemployment rate obtained from the Household Survey.

2.1.4. Housing Market

The COVID-19 pandemic created an unprecedented disruption in the U.S housing market. During Spring 2020, home sales and the median housing price dropped significantly due to stay-at-home orders in comparison to a normal busiest season. This has been attributed to buyers not willing to invest huge amounts in housing and sellers not willing to list or sell their home due to the reluctance of strangers entering their home during the pandemic. However, the housing market immediately surged across metropolitan and rural areas and across house sizes in the summer and fall because of low loans rates and economy rebound triggered by the reopen and stimulus package [31]. After careful consideration, the data collection on the housing market includes the (a) Building Permits Survey (BPS), (b) Federal Housing and Finance Agency (FHFA) House Price Index (HPI), and (c) Housing Inventory (HI). These three housing factors are captured before, during, and after the pandemic period for policymakers, economists, and researchers to understand the housing market under the influence of the COVID-19 crisis. The U.S. Census Bureau and the U.S. Department of Housing and Urban Development have jointly announced building permits data since 1959 monthly and annually [32]. It provides statistical information on new privately-owned residential construction on the national, state, and local levels. The attributes of building permits include total housing units, single housing units, and multi-units (two or more). The FHFA HPI measures average price changes in repeat sales or refinancing on the same properties [32]. This index information on house prices is based on reviewing repeated mortgages that have been purchased or securitized by Fannie Mae or Freddie Mac on single-family properties [32]. The FHFA has provided house price index data since the mid-1970s. The attributes of HPI include All-Transactions, Expanded-Data, and Purchase-Only. The housing inventory focuses on the market trends and monthly statistics on active homes for-sale listings in a specified geography. The realtor.com website publishes Housing Inventory (HI) data based on accurate mapping of housing units in listing statuses at national, state, and local levels [33]. The attributes of housing inventory include Median Listing Price, Days on Market, and Price Increase Count.

2.1.5. Medical Resources

Medical resources show the capabilities of the health care system to support disease testing, diagnosing, and treatment. Three fundamental elements of ventilators, hospital beds, and medical staff were identified and widely reported as medical resources to plan for or deploy under COVID-19 [34]. A county-level dynamic medical resources deficiency index based on medical staff and intensive care unit (ICU) beds data are generated to measure the local medical burden from the accumulated active confirmed cases [35]. In this collection, hospital number, licensed and intensive care units (ICU) beds, registered nurses, and medical doctors for populations over 1000 are collected and calculated for each state. The number of hospitals and licensed/ICU beds information is provided by Definitive Healthcare consulting services via ArcGIS online repository [36] in a point-based shapefile format, which records the attributes of each unique hospital. The medical staff is separately accessed from the National Council of State Boards of Nursing (NCSBN) [37] and the National Provider Identifier Registry (NPI) database [38]. The number of registered nurses was counted by NCSBN at the end of 2019 based on the records of active nursing licensure of the electronic information system. The number of medical doctors was extracted and summarized from the NPI database (visited by 15 April 2020) based on taxonomy codes of health-care providers, which indicated the areas of specialization. Although these collected medical recourses are not a dynamic dataset that reflects the real-time medical capacity during COVID-19, they can be used as a baseline to estimate the geographic disparity of health resources in each state.

2.1.6. Census-Based Socioeconomic Data

With the changes in the economy, data from the decennial censuses are far from enough for governments and businesses to rely on for planning, as they are published too late and could be out of date. So, the Census Bureau began the American Community Survey (ACS) program, a nationwide survey that collects demographic and socioeconomic, housing, and other characteristics about the nations’ population each year. More than 3.5 million households across the country would be contacted every year by ACS. The data are published on several geographical levels, including state, metropolitan areas, as well as counties, cities, and smaller areas.
For smaller areas, like census tract or census block groups, it would take 2–5 years to acquire enough samples for estimation. So, the Census publishes three types of data for users: 1-year, 3-year, and 5-year estimates. To choose the data product, the reliability, precision, currency, and geography unit need to be considered. The 5-year estimate data are the most reliable but least current data. The ACS program was proposed in 1996 and scheduled to be fully implicated in 2003. The oldest data available for ACS 1-year estimates are in 2005 with an annual release, and 2009 for the 5-year estimates. The 3-year estimates data have been discontinued and only 2007–2013 will remain available, and no new data have been produced later [19].
Census-based socioeconomic data are widely used in COVID-19 research as determinant factors per capita to show the heterogeneity of locations. The state-level attributes for topics of population, age, sex, ethnicity, education, poverty and income, housing, and employment status are selected from the American Community Survey (ACS) in this dataset. The 2019 ACS was released recently on 17 September 2020, and the 1-year estimate data were extracted and integrated manually into the proposed data collection.

2.2. Data Description

Based on different utilization purposes and characteristics of temporal frequencies, three separately derived and aggregated datasets are provided to the public, including daily-based policy stringency index, dynamic economic indicators through the COVID-19 pandemic, and the socioeconomic determinants for U.S. states. The spatial resolution of these three datasets is state-level and the spatial coverage is the 50 states of the U.S. with the District of Columbia (D.C.). A USA base map with the standard state name, state abbreviation code, and Federal Information Processing Standards (FIPS) code is used in each derived dataset to connect the geographic regions. Figure 1 illustrates the conceptual model and its derived attributes for the state level of the USA. The FIPS column is used as the foreign key for a joint table of indicators within the same location and each attribute table is stored separately based on time frequency. The timestamp column for each table stands for the first day point of the updated time range, e.g., 1 January 2020 in the quarterly table for the first quarter of 2020. All time-series based datasets are presented in two data formats, (1) time-series summarized product, which holds historical data for every single attribute in a specific data table; and (2) periodic temporal report, which records all attributes with the same updating frequency in a different timestamp-based data table.

2.2.1. Daily Policy Stringency Index

The Government Response Stringency Index was first introduced by the Oxford COVID-19 Government Response Tracker [21]. It is an indicator of the governments’ responsiveness to the crisis of COVID-19 and the extent of lockdown in the specific region on a scale from 0 to 100. This index is used to graph the temporal dynamic policy change for both the global and the U.S. in our research. To quantitively measuring of the restriction policy inside the U.S. started from early March 2020; the Response Stringency Index for each state is recorded, coded, and calculated based on raw policy documents from the local state government. The raw data collection with original recording notes, coded scores in the specific coding division, and links to the specific policy used for coding is provided in a daily manner. Based on the global country-level index standard, the seven geographical-based categories (in Table 1) of policy are used to indicate the scope of the policy.

2.2.2. Economic Indexes for Multiple Time-Frequency

Based on the literature and data accessibility, we selected 29 features from the public dataset which have statistical values at the state level. Those data are from a variety of government and non-government agencies with relatively high reliabilities and have been widely used in different research projects. Compared with the annual report data, the aforementioned indices have higher temporal resolutions ranging from weekly to monthly and quarterly.
Those data mainly focus on economic-related statistics, such as GDP, employment, import and export in international trade, and retail. Many core indexes are included under each category, and also some expanded indices are listed with more detail. For example, the unemployment rate is a core indicator in all kinds of employment discussions, also we considered some related features such as Insured Unemployment rate, Total Non-farm Employees, Manufacturer Employees, and so on. For unemployment insurance, we also list initial claim numbers and continuous claim numbers. These features could give users a more in-depth view of the current situation when combined. More detailed descriptions of attributes are list in Table 2.

2.2.3. Socioeconomic Driven Factors/Determinants/Indicators (Control Variable)

The census data are a traditional source used to extract demographic, education, income, poverty, housing, and health resources information with geographical units. Socioeconomic determinants for the state level are mostly from Census ACS 2019 (latest) data and partially from other sources. For demographics, we extract the attributes for the total size, density, and by groups of age, gender, and race and ethnicity. For education information, the attributes contain percentages of the population with high school education, a bachelor’s degree, or a higher degree. The two types of regional information, internet accessibility, and medical resources are recorded in separate columns. All mentioned attributes (Table 3) are considered as the factor strongly related to regional health in response to the pandemic COVID-19.

3. Methods

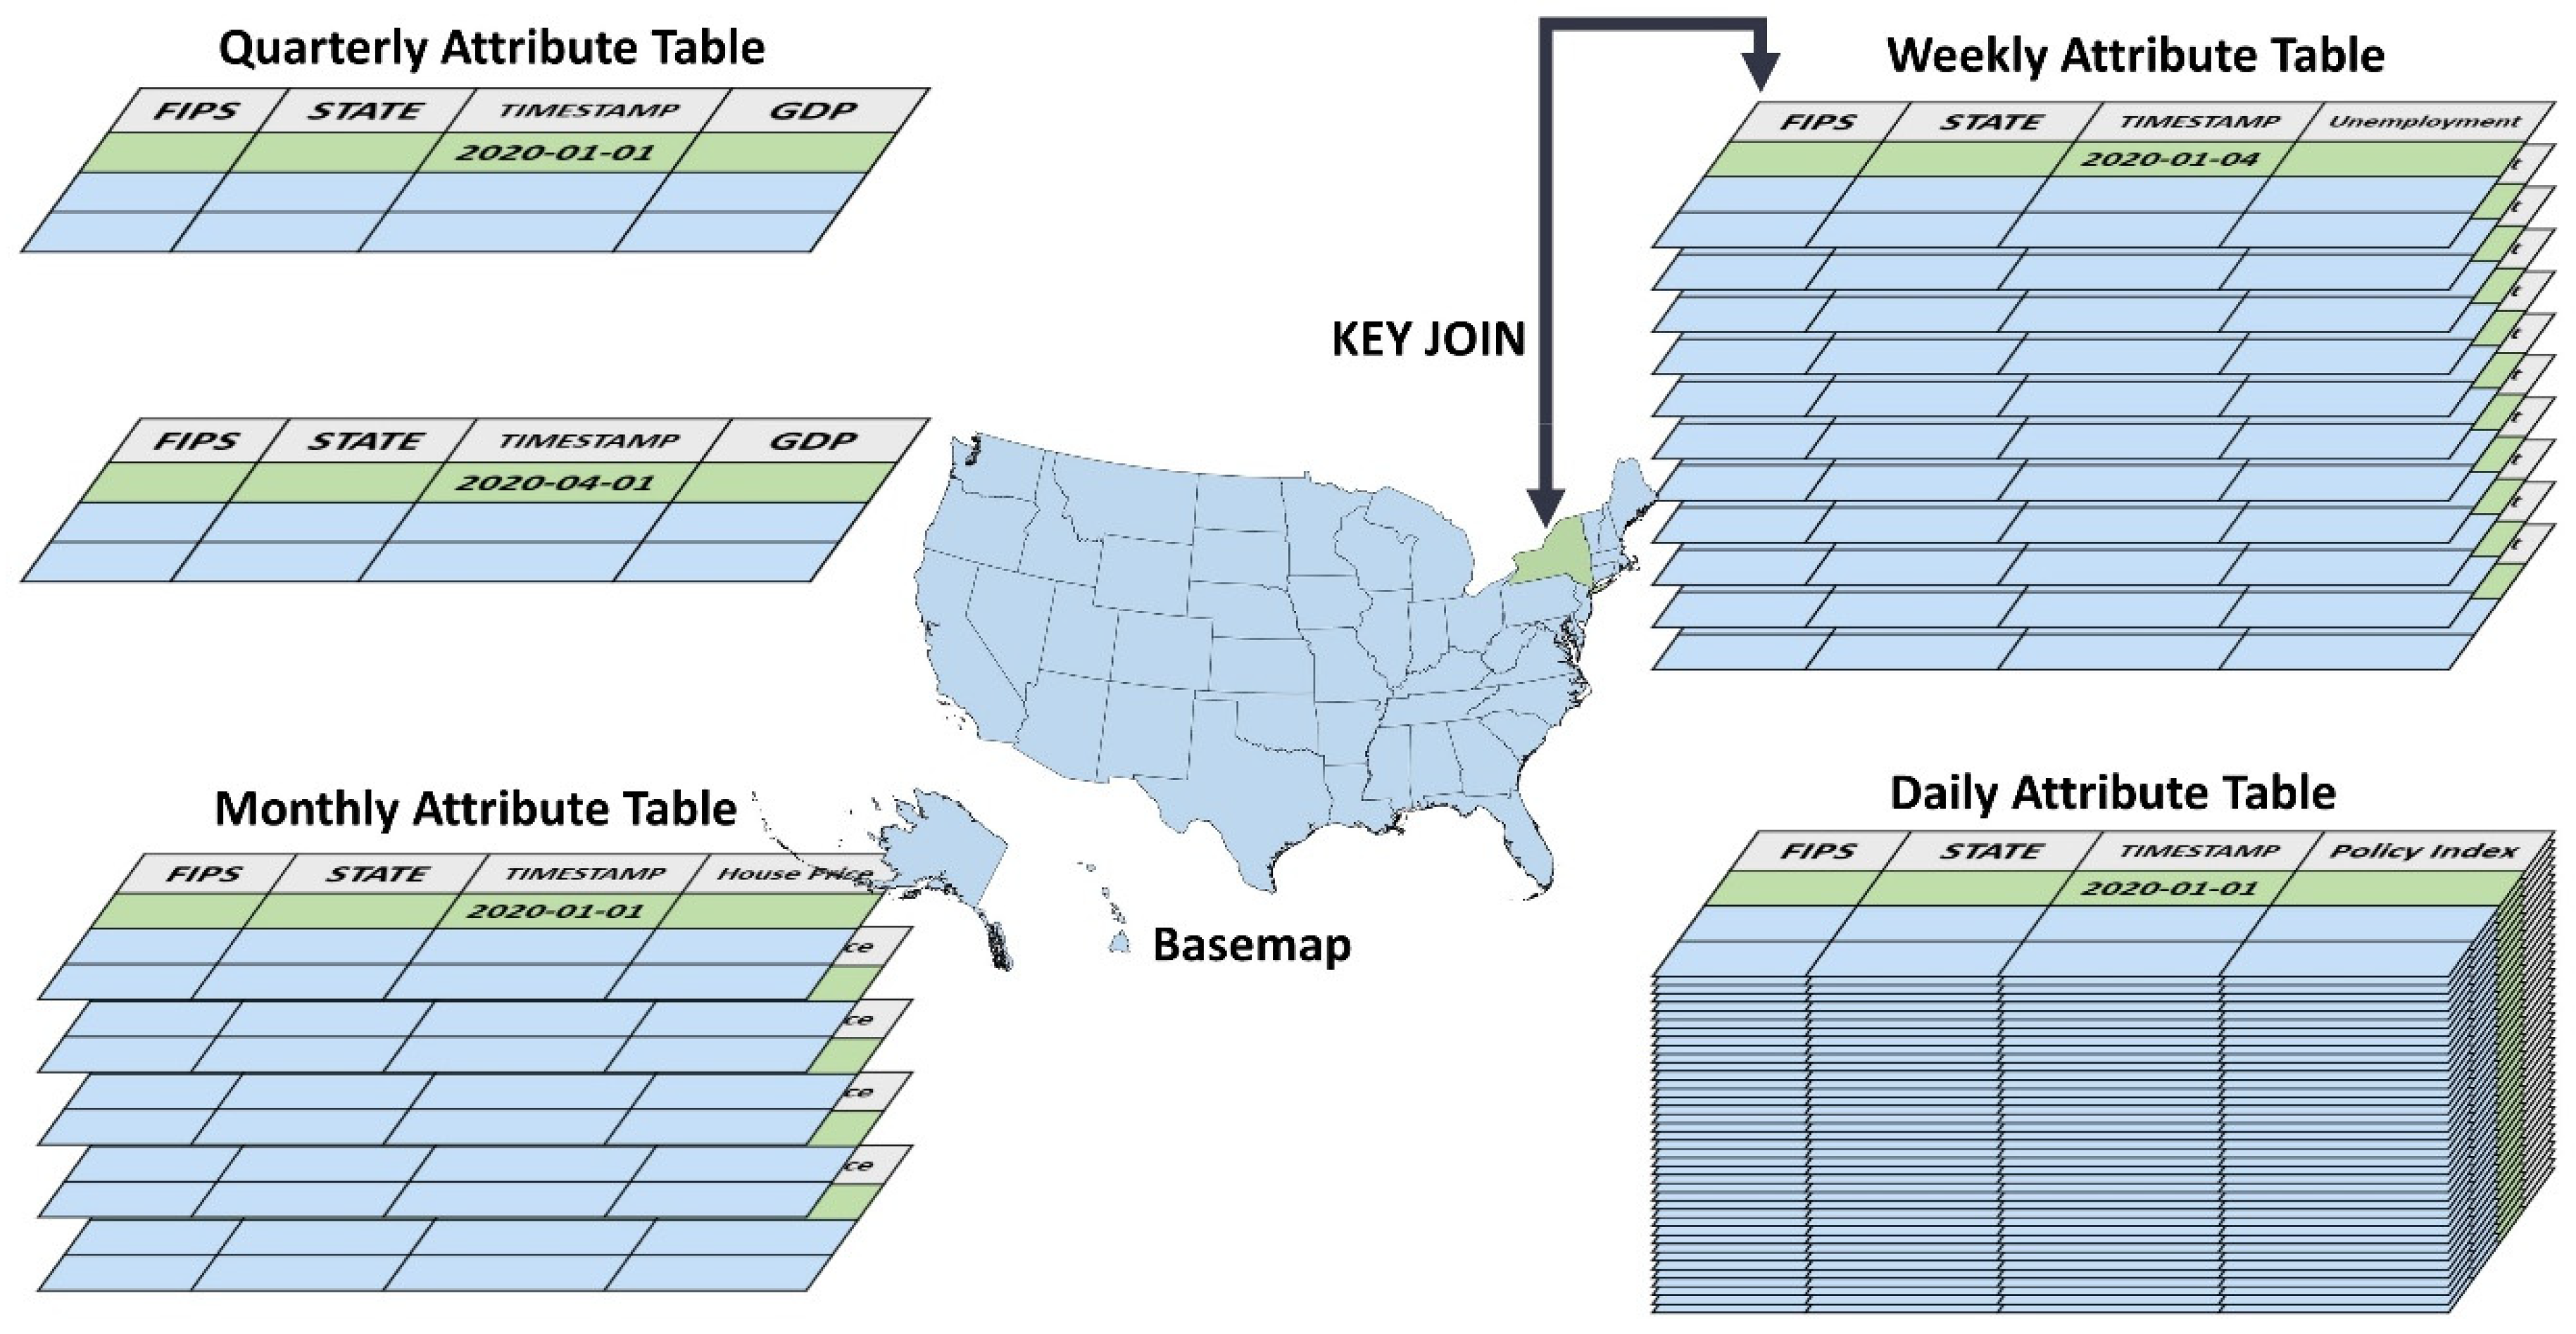
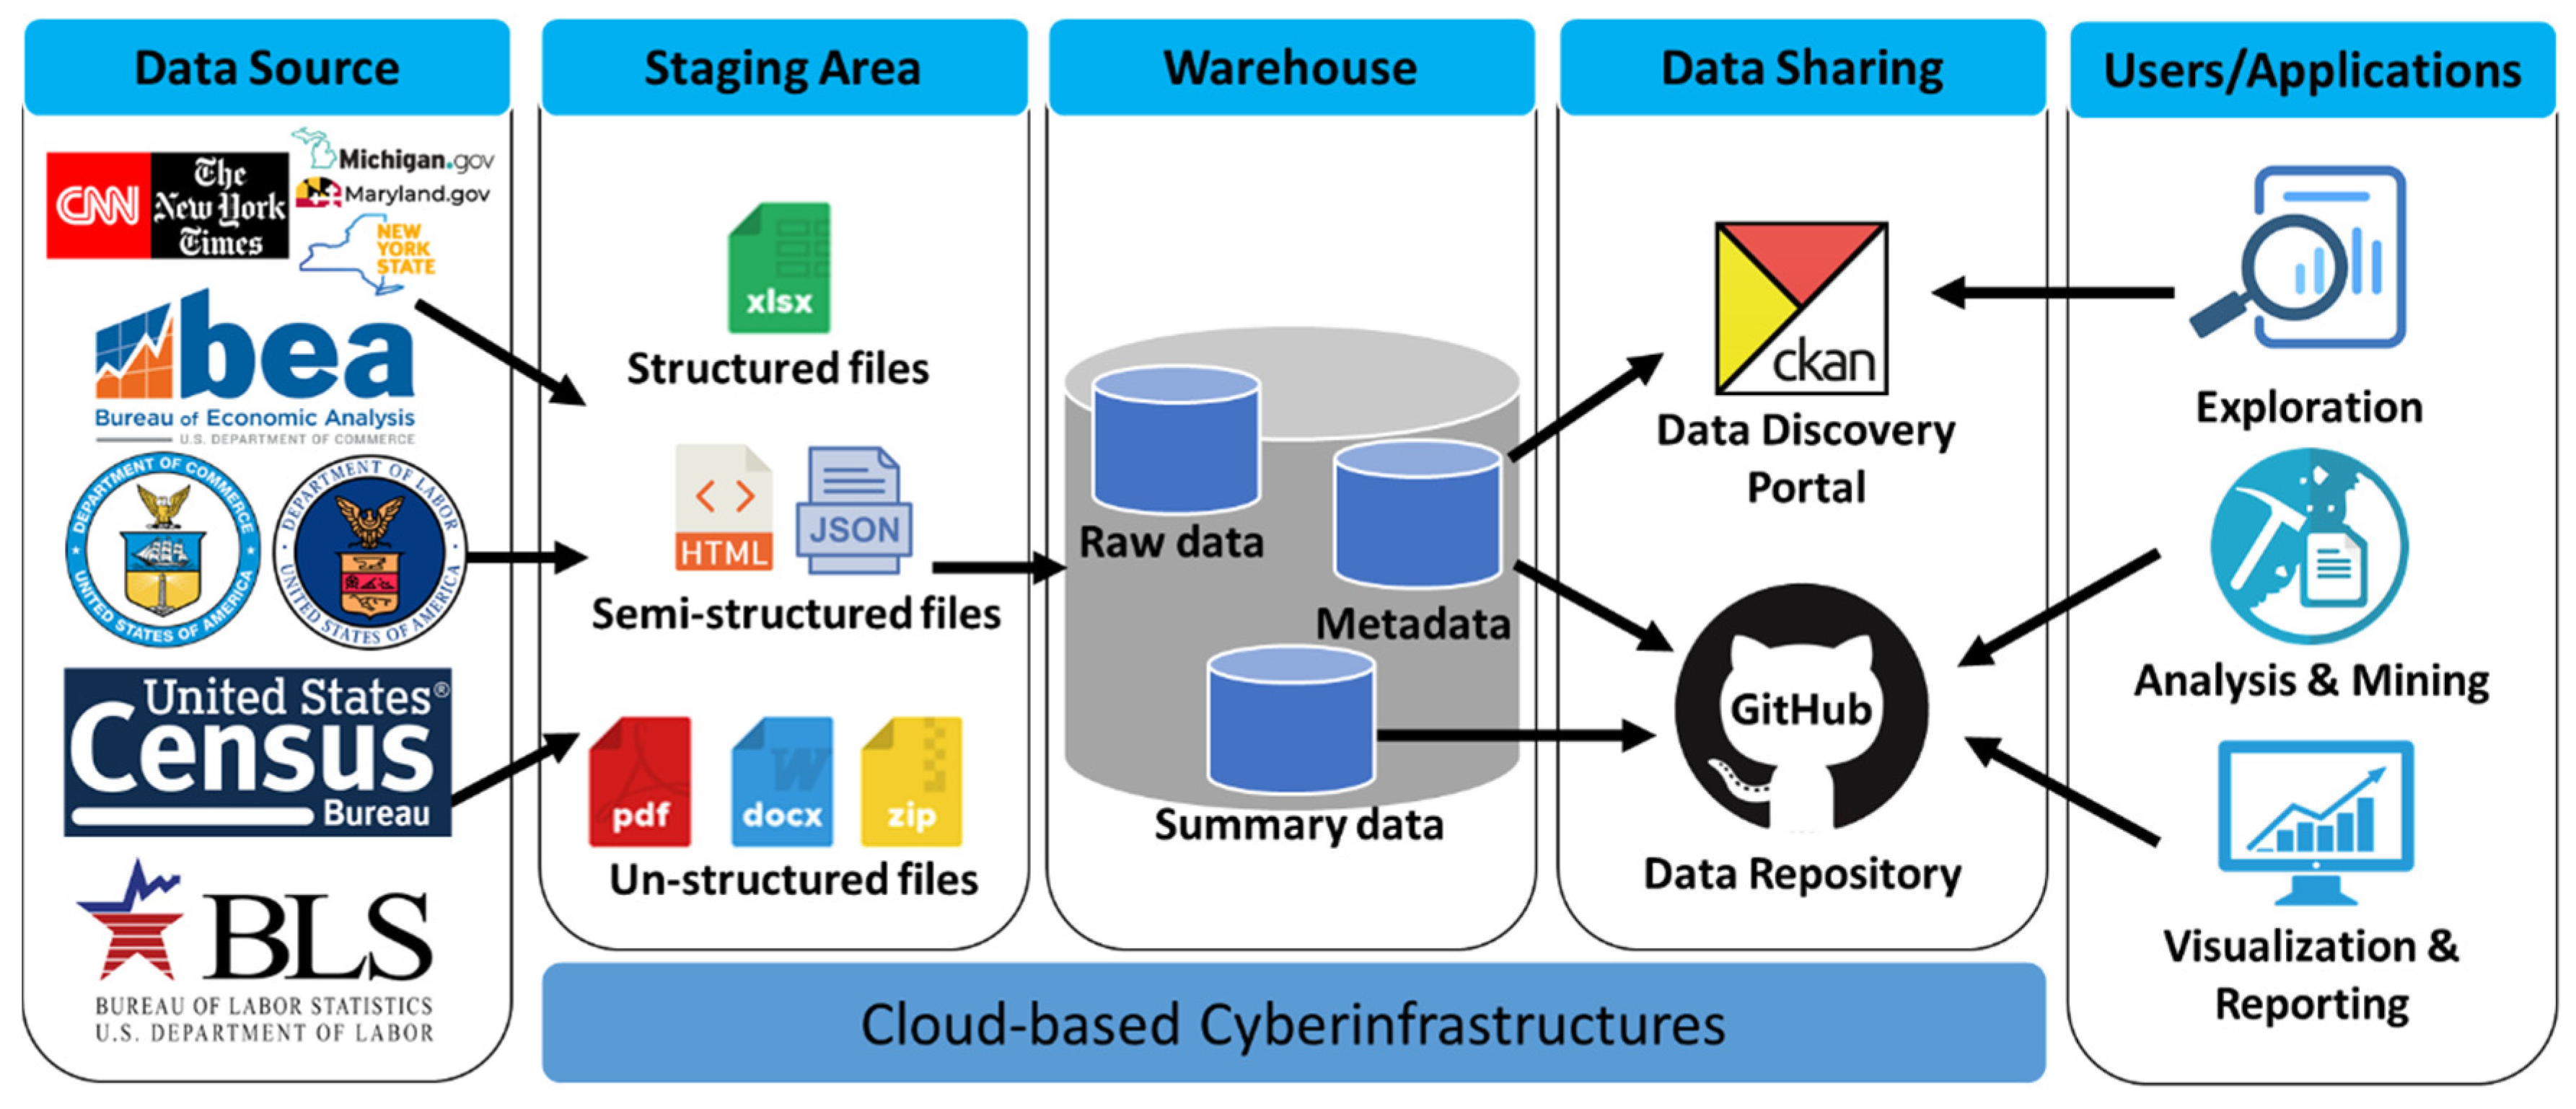
3.1. Cloud-Based Data Warehouse and Spatiotemporal Aggregation

A data warehouse (DW) is a large, centralized data repository of integrated data from one or more disparate sources [39]. In this study, we adopt the DW workflow to aggregate open-source socioeconomic datasets described in Section 2.1. As the data pipeline shows in Figure 2, data files from raw format are first obtained and stored in the staging area, then loaded into the DW as raw data manually coded or automatically converted. The processing scripts and formatted rules are developed based on a standardized spatiotemporal collection framework for COVID-19 to collocate in time and space among multiple factors [40,41]. Next, the formatted raw data are converted into summarized data products with corresponding metadata for sharing under open-source data policies. Last but not least, users will be able to visit, access, download, and leverage the proposed products for their specific analysis, mining, and reporting applications.
From a computational infrastructure perspective, cloud computing techniques are used to establish the operation system by George Mason University (GMU) NSF Spatiotemporal Innovation Center (STC). Based on the virtualization technique, cloud computing enables users to utilize computing resources on demand [39]. The operational environment of the staging area, data warehouse, and data sharing services are deployed in a private cloud. In real practice, data retrieving, and processing tasks are scheduled based on the updated frequency of original data sources in the cloud, and the script-scheduling approach could reduce the consumption of computing, storage resources.
Since the frequency of the socioeconomic factors varies from daily, weekly, monthly, to quarterly, it is necessary to establish a data framework to build the relationships among different datasets in time and space. This study takes advantage of the proposed spatiotemporal data collection cube [40] of COVID-19 to collocate spatial and temporal scales with virus cases and environmental factors. The data cube is a three-dimensional structure with locations, timestamps, and attributes to record spatiotemporal measurements and corresponding factors. All attributes with multiple topics are organized to show the spatiotemporal variation before, during, and after the pandemic period. The time update report of each factor is provided based on timestamp and summary report according to the attribute variation across time series.
Section 3.2 and Section 3.3 detail manual policy index extraction, the coding process, and the automatic web crawler in the data Extract, Transform, and Load (ETL) process.

3.2. Policy Index Extraction and Coding Standard

This stringency index by state in the USA is used to graph both the global and U.S. temporal dynamic policy changes in our research. The Response Stringency Index includes seven categories of policy as shown in Table 4, such as school closure, business closure, public event cancellation, etc., as well as a generalization code to indicate the scope of the policy. The calculation of the index includes three steps.
  • First, we code the qualitative policy into quantitative numbers (0,1,2) (0 for No measure; 1 for Recommend closing; 2 for Require closing; an additional code of “3” for the category of international travel control) according to the policy’s stringency. For instance, a government’s official announcement that recommends business closure will be coded as 1, and a strict requirement of business closure will be coded as 2. Another example is when there is no policy restricting internal movement, the code would be 0, and if governments recommended movement restrictions (recommend people to stay at home), the code would be 1, and if the government adopted and implemented the “Stay at Home Order” that requires people to stay at home, then the code for this policy’s stringency would be 2. Additionally, there is another code for the national/regional coverage of the specific policy (0 for Targeted region and 1 for General all regions). For example, the code will be 0 if the policy is only targeted at some counties/cities of the state/country, and the code would be changed to 1 if the policy targets the whole state/country.
  • Then, the code numbers of each policy category are summed up and rescaled to create a score between 0 and 100.
  • In the end, the seven scores are averaged to obtain the overall Stringency Index for that region (as Equation (1) shows). The policy index extraction is conducted manually by the NSF STC group.
    P o l i c y S t r i n g e n c y I n e x =   1 7 [ r e s c a l e d ( s c h o o l c l o s u r e + p o p u l a r i t y ) + r e s c a l e d ( w o r k p l a c e c l o s u r e + p o p u l a r i t y ) + r e s c a l e d ( p u b l i c e v e n t s c a n c e l l a t i o n + p o p u l a r i t y ) + r e s c a l e d ( p u b l i c t r a n s p o r t c l o s u r e + p o p u l a r i t y ) + r e s c a l e d ( p u b l i c i n f o r m a t i o n c a m p a i g n + p r e s e n c e ) + r e s c a l e d ( i n t e r n a l m o v e m e n t r e s t r i c t i o n + p o p u l a r i t y ) + r e s c a l e d ( i n t e r n a t i o n a l / n a t i o n a l t r a v e l c o n t r o l + p o p u l a r i t y ) ]
In order to ensure the quality and reliability of the raw policy data, it is constantly evaluated through dimensions including data selection, integrity, consistency, and validity. To ensure that the policies included in the current dataset are reliable and up to date, the initial set of state-level policies of closure are collected only through each state’s official website, and only state Governors’ executive orders or official announcements are taken into consideration. Then, the relevant USA state-level policy collection site from the well-known and reliable news platforms (e.g., CNN, New York Times), third party Non-Governmental Organization (NGO) Kaiser Family Foundation (KFF), and academic institutes (Oxford University, Oxford, UK) are tracked and considered in our collection procedure. By comparing and evaluating the relevant data products in an operational mode, the integrity and validity are guaranteed. To ensure the consistency of the state-level policy data, the policies are encoded by the same research using the same standard through the whole data-collecting process.

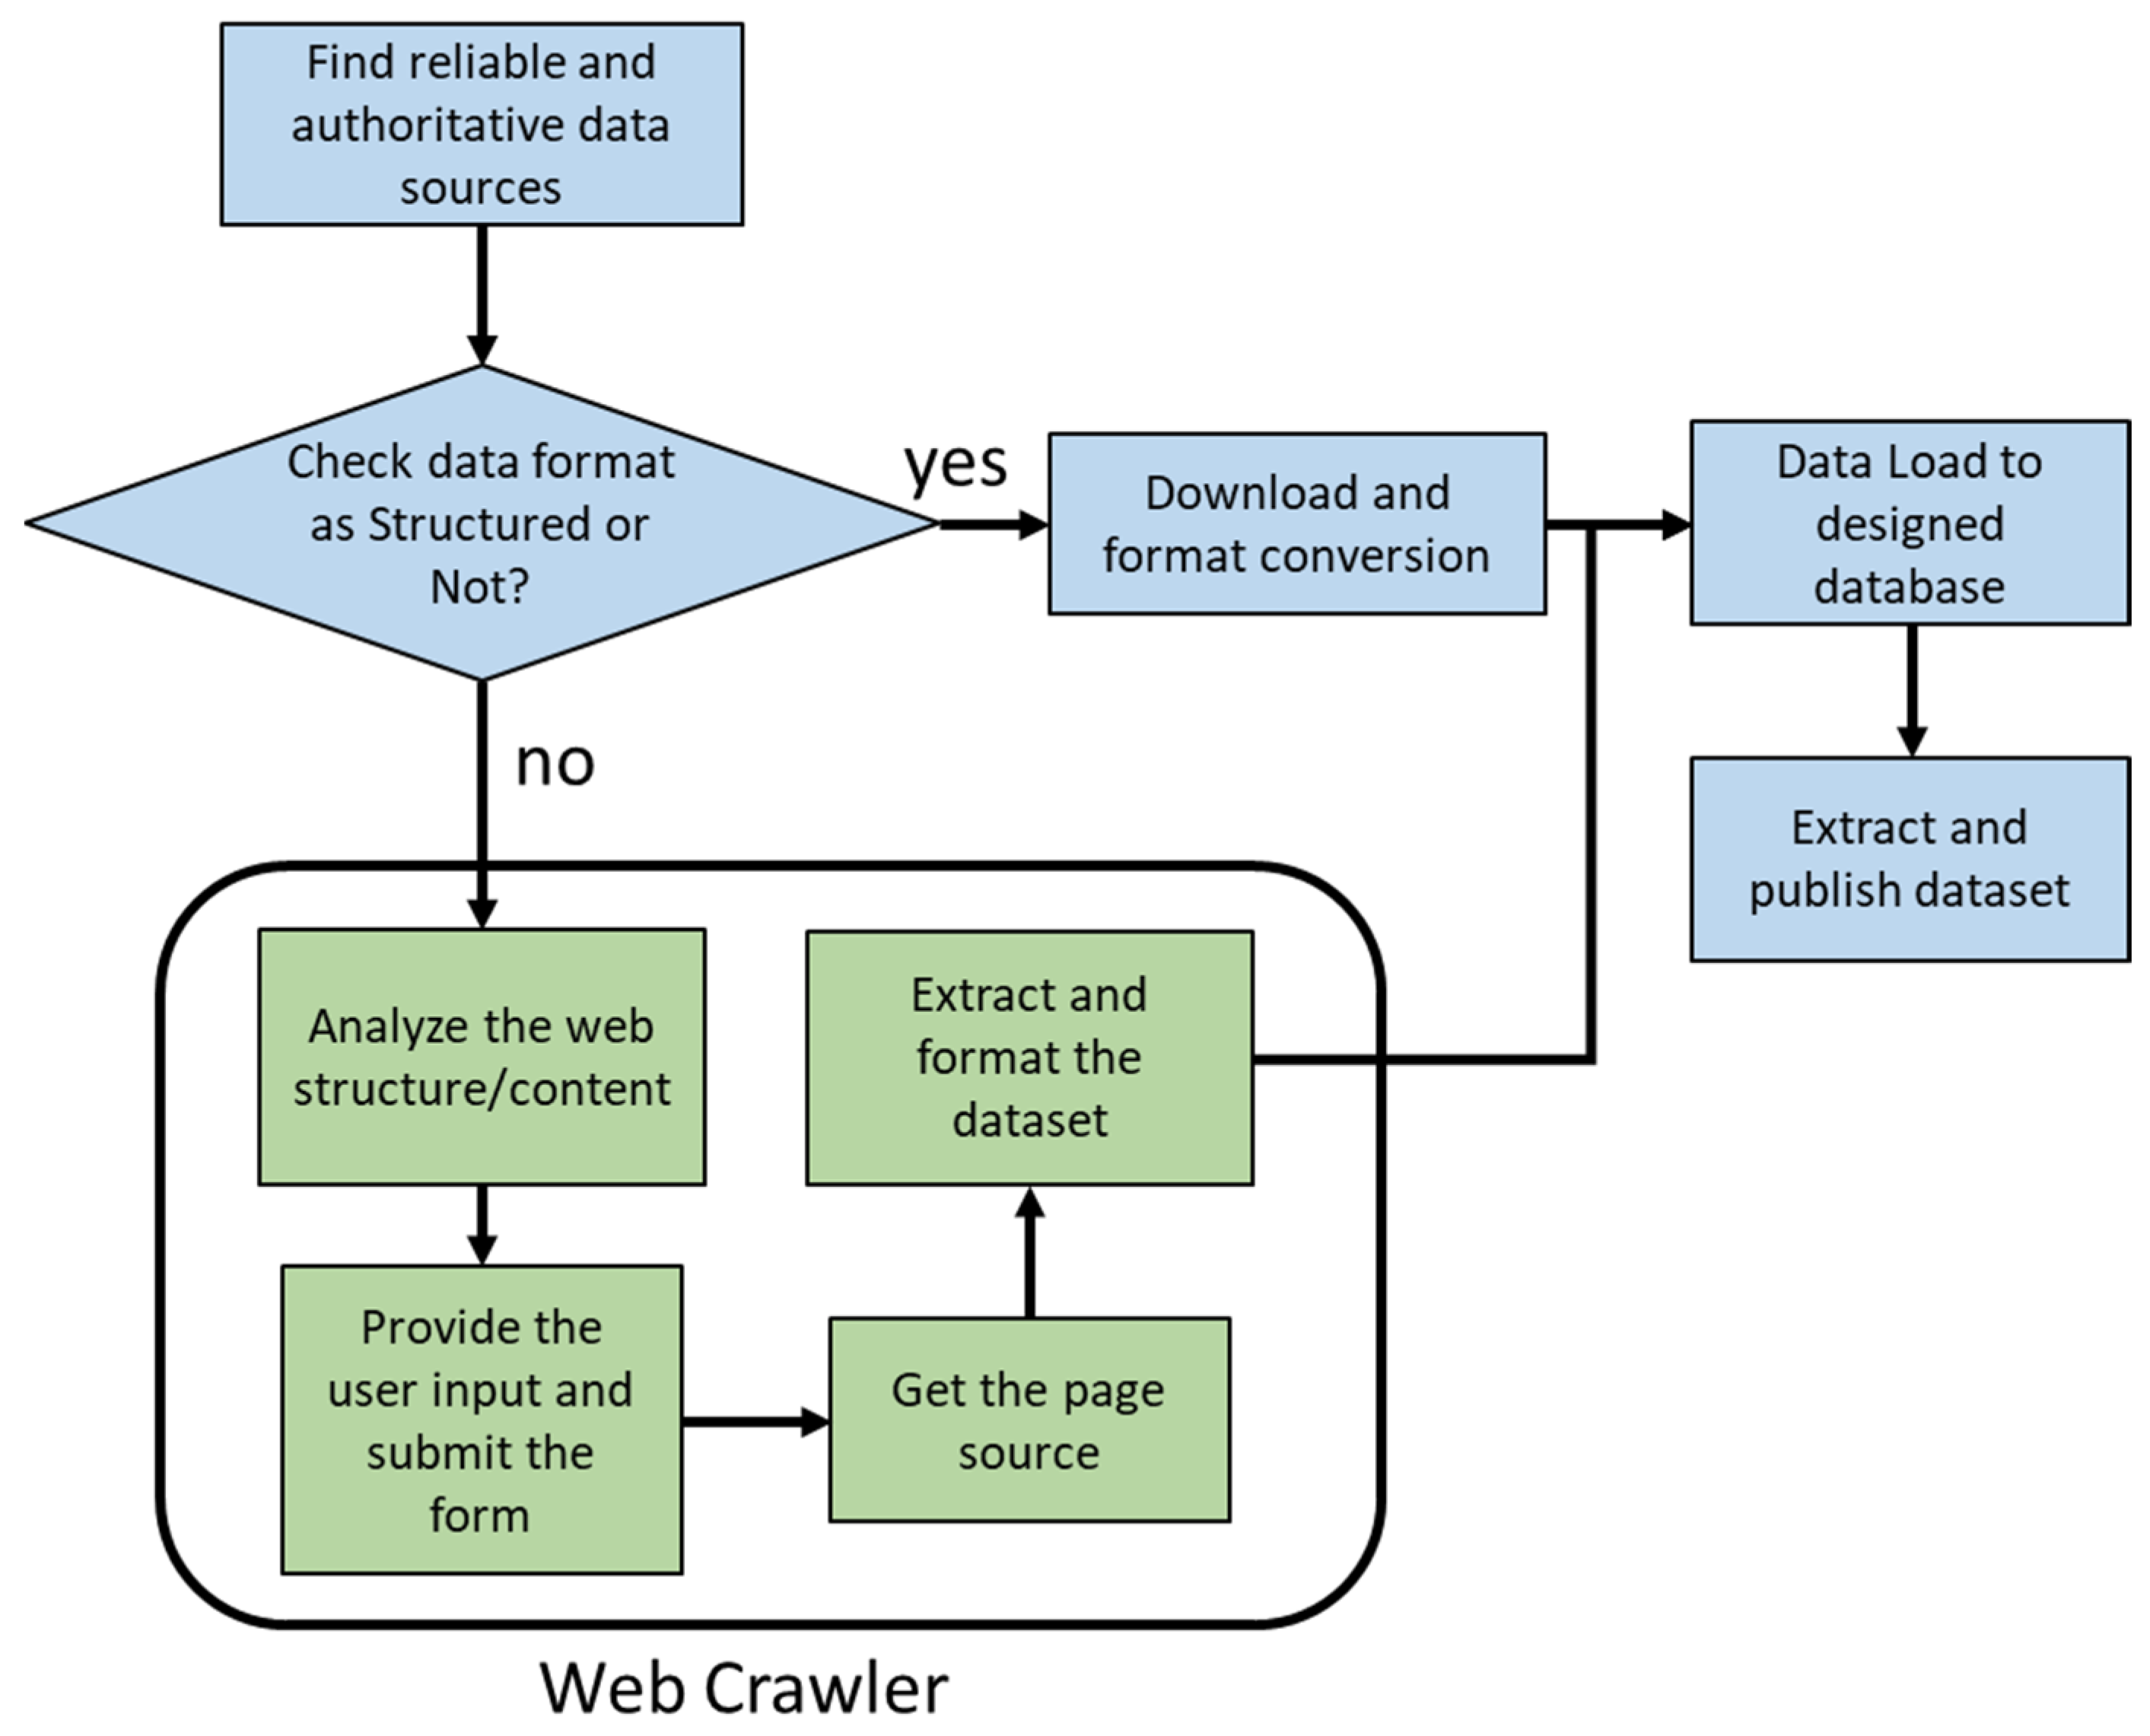
3.3. On-Demand Web Crawler

There are several ways to obtain useful information from web pages. While some websites provide an Application Program Interface (API) to extract data in the structured format, others do not contain this kind of API. In this case, web scraping can be an ideal technique to obtain web content. Web scraping includes extracting useful information from a web page by understanding the web page structure [42]. A web page is composed of Hypertext Markup Language (HTML) tags and is translated by a web browser in a human-readable format. With python packages like selenium, beautifulSoup4, urllib2, etc. we can directly extract the needed information from web pages. Understanding the Document Object Model (DOM) is essential for web content extraction because DOM defines the logical structure of a web page and provides an insight on how or what page element to access [43]. It defines the attribute of a page element such as a class, and name which is used to identify a page element for page actions.
The first step is to identify an officially authoritative and reliable website for the research demands. The website should satisfy both the spatial and temporal requirements of the dynamic socioeconomic datasets. The next step is to analyze the format and structure of useful data/content on the website. Some websites provide data in Comma Separated Values (CSV) or spreadsheet format that can be readily downloaded, processed, and converted. Additionally, few websites provide data in a semi-structured or unstructured format, such as JavaScript Object Notation (JSON) and Portable Document Format (PDF) files. Then, we need to develop and perform a customized web crawler to extract useful information. This procedure is shown in Figure 3.
The web crawler section comprises a sequence of steps to acquire information from a website.
  • First, we interpret and understand the DOM structure.
  • The next step is to provide the users with inputs in the required fields and submit the form. This is achieved by selenium API, which automatically interacts with a web page by calling browser drivers such as chrome, gecko (for Firefox), and Internet Explorer (IE). Subsequently, by inspecting the input field web elements (such as textboxes, radio buttons, dropdowns) we provide input values and submit the form using a button click.
  • The next step is to obtain the page source. For example, to extract unemployment insurance data from the United States Department of Labor (DOL) website [18], we used selenium to automatically:
    • Select the “State” radio button.
    • Select “2019” from the drop-down options for the start year.
    • Select “2020” from the drop-down options for end year.
    • and select all states from the textbox.
    • Finally, we submit the form by clicking the Submit button and obtain the page source information.
  • Once we have the page source with the required information, we use the beautifulSoup4 python package to identify the table that holds the unemployment insurance data and extract the text content from the table. The final step is to format the dataset in a standard format.

3.4. Data Quality Control

We evaluated the socioeconomic data in three dimensions including data integrity, data consistency, and validity to ensure quality datasets are delivered to geospatial researchers and policymakers.
Raw data selection, cleaning, qualification: The first step for socioeconomic data collection is to select appropriate raw input data. We implement an extensive literature review related to the impact of COVID-19 on socioeconomic factors, thereby making a factor justification of datasets we have selected. We also ensure that the selected data are of the most significance to show the economic hit in the U.S. during the pandemic. The next step is to identify reliable official websites to download the datasets that satisfy both the spatial and temporal needs of the data collection process. During the data cleaning step, we filtered or discarded the invalid attributes and values that are not included in the research domain. For example, we filtered out the U.S. territories such as the Virgin Islands and Puerto Rico as we were focused on the U.S. states and the District of Columbia. In certain cases, we faced issues in downloading datasets directly in a structured format such as in spreadsheets or CSV. We overcome the issues by first obtaining data in a text format and then converting it to a structured format.
Data integrity: Ensuring data integrity means that the collected datasets are complete, comprehensive, and accurate. This includes verifying datasets for manual errors, logical errors, and data type consistency. We stored the socioeconomic datasets in a relational database. The table constraints such as primary key ensure duplicate records are not inserted, not nullable fields prevents inserting null values, data type ensures consistent data are inserted into each field. For example, raw data for personal income farm compensation for the District of Columbia is (N/M). This is converted to 0 to satisfy the data integrity.
Data consistency: The socioeconomic dataset in the repository is required to be consistent with the other sources. This means that the collected data should be consistent with the values of data sources and should also be consistent with the dynamic change of economic factors during the pandemic. For example, the COVID-19 saw the worst hit on the U.S. economy. During the start of March in which the COVID-19 cases were at a peak, the economic factors were comparatively lower than the pre- and post-pandemic periods.
Data validity: To ensure the data reliability of socioeconomic factors, we provide data sources to the consumers along with the collected data. Consumers can investigate the collected data against the data sources, thereby ensuring the validity of the data.

4. Data Sharing

The derived data are all in CSV format which is automatically published in the GitHub data repository (https://github.com/stccenter/COVID-19-Data/tree/master/Socioeconomic%20Data) promptly based on the time-frequency and publishing timestamp. As one of the most popular open-source communities, GitHub is a solution for data consumers and application developers to share data and codes. Publishing the data cube on GitHub assures data release and sharing and facilitates the following: (1) allows data consumers to report issues/problems through the GitHub repository; (2) allows data consumers to folk or mark the repository to trace a data update for timely analysis; and (3) allows data analysis code (e.g., data visualization) to be published with data to facilitate the data cube’s utility in research and decision-making. Further notes on the usage of the dataset that will help other researchers to quickly access the dataset and work with it.
To enable public users to explore, search and quickly identify the COVID-19 relevant data features and attributes, a Comprehensive Knowledge Archive Network (CKAN) based the open resource portal is created to provide metadata for the data collection and analysis models for the spatiotemporal COVID-19 rapid response studies (https://covid19datadiscovery.stcenter.net/). Both collected and processed datasets are prepared for querying, browsing, and sharing. The COVID-19 data discovery portal also enables data owners/editors from longtail sections to register user accounts, organization pages, and create resource pages. Multiple data licenses are used for data reusing, copying, publishing, distributing, transmitting, and adapting. All datasets can be accessed and cited for non-commercial purposes. More importantly, a well-designed tagging and grouping system is constructed based on research communities, topics, and interests, and it can be used to filter out the most relevant dataset for researchers. All socioeconomic datasets in this collection can be filtered out by the “social economics” group under the “Spatiotemporal Innovation Center” organization.

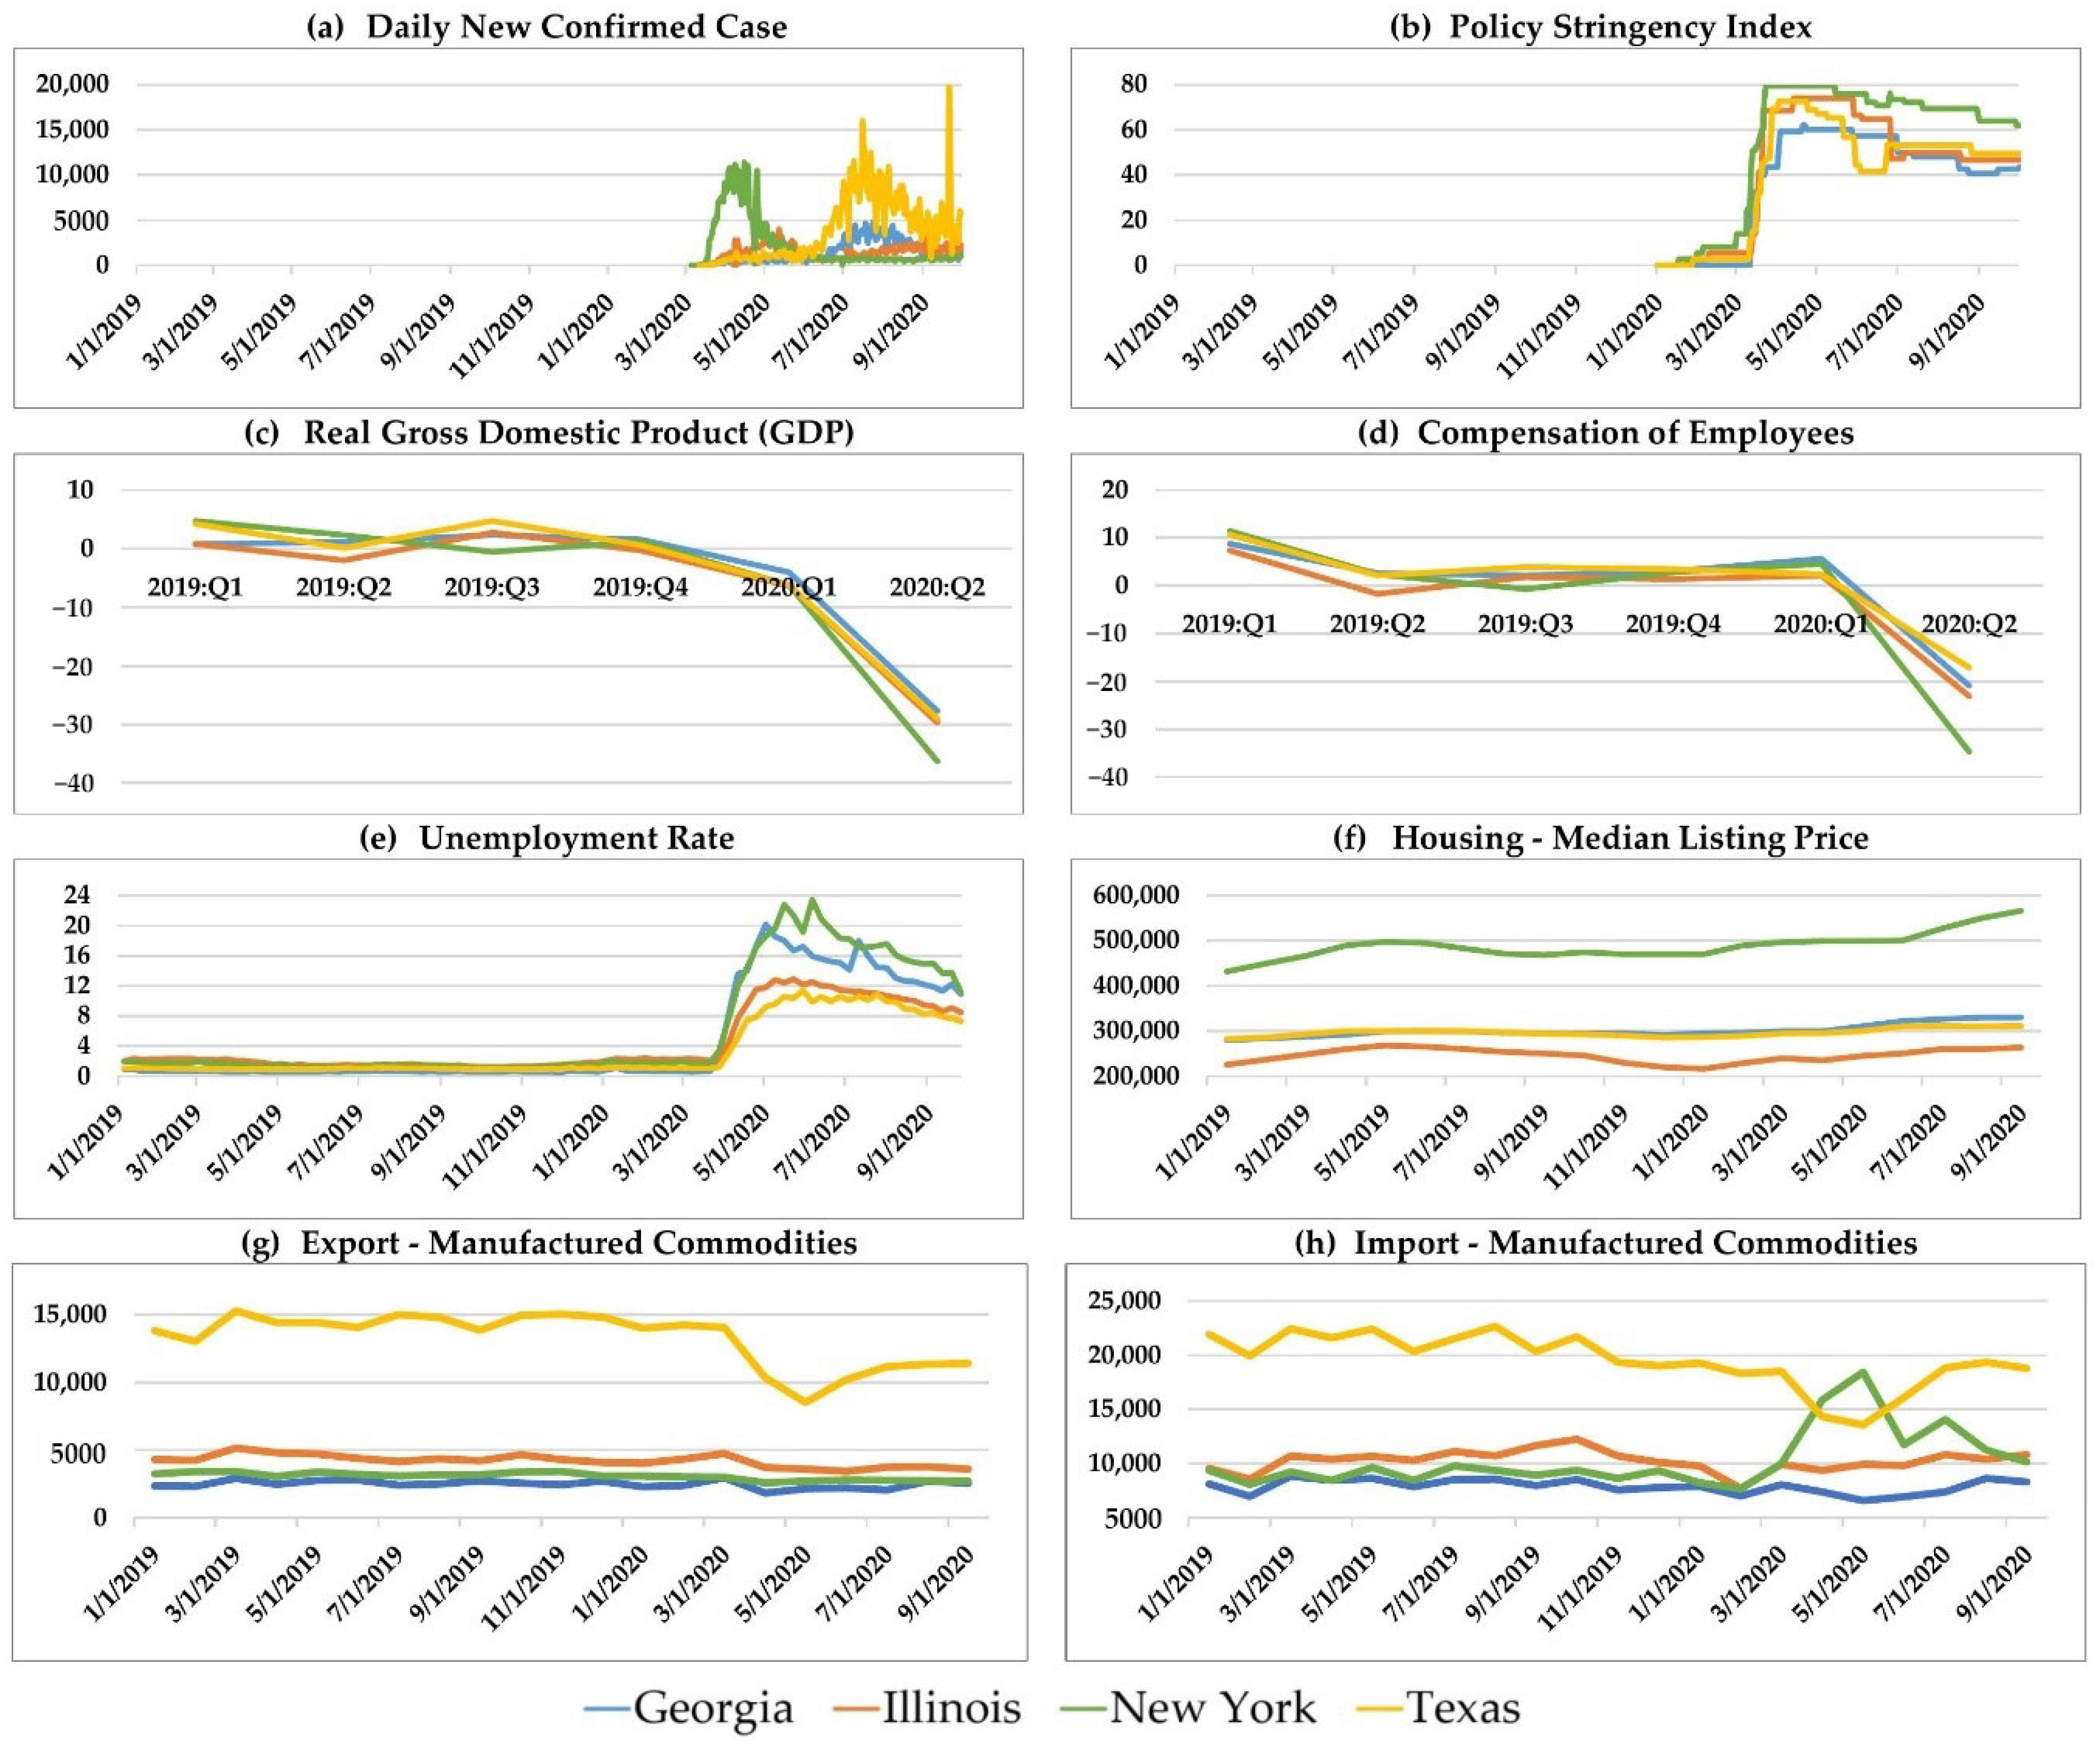
5. Time Trend Analysis of Typical Attributes

Several socioeconomic indicators are selected for visual analysis for time change patterns before and after COVID-19 pandemic, including daily new confirmed cases, policy stringency index, percentage change of real GDP and employees’ compensation, weekly unemployment rate, median listing price in housing market, as well as export and import amounts of manufactured commodities. In each plot of Figure 4, a line represents a state’s dynamic change from the period of before emergence (1 January 2019–18 January 2020 as baseline), to outbreak (first cases on 19 January 2020), and to when COVID-19 was under control (all attributes are available and up to date in October 2020). The four typical states chosen in these time series plots are New York (the first affected state), Georgia (a large portion of the African American population), Texas (the new peak affected state), and Illinois (a rust belt state). The visualization provides a straightforward way to understand the trend of the social economic situation, and corresponding significant impacts with exact time periods can also be identified.
From the new case numbers and policy index, we can find that New York has implemented and kept stricter policies which helps to decrease new infected cases of COVID-19. In addition, relaxation of restrictions causes a rebound of the new cases number in Texas and Georgia. Due to the lock down nationwide, the GDP and compensation of employees fall sharply for the 1st and 2nd quarter. At the same time the unemployment rate increases dramatically. Even though loose policy after June and July decrease the unemployment rate, it is still at a high level around 10% which was usually 3–4%. The housing market did not show a big change, and a slightly increase for the real estate listing price after June was recorded. Texas has a large portion of international trade of manufactured commodities, and the import and export rates for all states have risen back to normal amounts after the policy index trend to decrease occurred. Spatiotemporal analytics [44] can be easily conducted with the collected and published datasets.

6. Conclusions

To combat the COVID-19 pandemic, the reported socioeconomic data collection provides valuable spatiotemporal factors for research and decision support (policy making, academic research, and public awareness) by disease control experts, decision-makers, government officials, sociologists, economists, and humanists. The spatiotemporal data collection framework could be a baseline for integrating other spatial and temporal based factors. The collection includes datasets of the daily updated policy stringency index, economic attributes in multiple time-frequencies, and a socioeconomic determinant for all the states in the US. GMU’s NSF STC is maintaining data processing, quality control, storing, and sharing in an operational mode.
The raw data tables are automatically accessed from multiple authorized departments of the U.S. by customized python scripts, and the processed attributes are extracted and converted into the GitHub repository according to the quality control and framework in near real time. In the future, more metadata of data sources will be provided by a crowdsourcing approach through a CKAN-based portal and its inclusive socioeconomic factors and attributes under COVID-19 topic will be integrated into this spatiotemporal standard collection.

Author Contributions

Conceptualization, C.Y., D.S., Q.L. and S.R.; methodology and visualization, D.S., Y.Z., A.S.M., C.Y. and Y.T.; software, A.S.M.; validation, Y.T., D.S., A.S.M., Y.Z. and S.R.; investigation, H.L. and Z.W.; data curation, Y.T. and R.D.; writing—original draft preparation, D.S., A.S.M., Y.T., Y.Z. and S.R.; writing—review and editing, Q.L., K.C. and C.Y.; supervision, C.Y.; project administration, D.S.; funding acquisition, C.Y. All authors have read and agreed to the published version of the manuscript.

Funding

This research was funded by the NSF (1835507, 1841520 and 2027521).

Acknowledgments

Multiple socioeconomic factors are downloaded from United States Census Bureau; GDP and personal income data are downloaded from Bureau of Economic Analysis (https://www.bea.gov/data/); International trade data are downloaded from Census Bureau (https://www.census.gov/foreign-trade/); Employment data are downloaded from U.S. Bureau Of Labor Statistics (https://www.bls.gov/) and U.S. Department of Labor (https://www.dol.gov/); Housing Market data are downloaded from Census Bureau (https://www.census.gov/construction/bps/), realtor.com (https://www.realtor.com/research/data/) and Federal Housing Finance Agency (https://www.fhfa.gov/DataTools/Downloads).

Conflicts of Interest

The authors declare no conflict of interest.

References

  1. Dong, E.; Du, H.; Gardner, L.M. An interactive web-based dashboard to track COVID-19 in real time. Lancet Infect. Dis. 2020, 20, 533–534. [Google Scholar] [CrossRef]
  2. McKibbin, W.J.; Fernando, R. The Global Macroeconomic Impacts of COVID-19: Seven Scenarios. SSRN Electron. J. 2020. [Google Scholar] [CrossRef] [Green Version]
  3. Lenzen, M.; Li, M.; Malik, A.; Pomponi, F.; Sun, Y.-Y.; Wiedmann, T.; Faturay, F.; Fry, J.; Gallego, B.; Geschke, A.; et al. Global socio-economic losses and environmental gains from the Coronavirus pandemic. PLoS ONE 2020, 15, e0235654. [Google Scholar] [CrossRef] [PubMed]
  4. Liu, Q.; Sha, D.; Liu, W.; Houser, P.R.; Zhang, L.; Hou, R.; Lan, H.; Flynn, C.; Lu, M.; Hu, T.; et al. Spatiotemporal Patterns of COVID-19 Impact on Human Activities and Environment in Mainland China Using Nighttime Light and Air Quality Data. Remote Sens. 2020, 12, 1576. [Google Scholar] [CrossRef]
  5. Yang, C.; Sha, D.; Liu, Q.; Li, Y.; Lan, H.; Guan, W.W.; Hu, T.; Li, Z.; Zhang, Z.; Thompson, J.H.; et al. Taking the pulse of COVID-19: A spatiotemporal perspective. Int. J. Digit. Earth 2020, 13, 1186–1211. [Google Scholar] [CrossRef]
  6. Franch-Pardo, I.; Napoletano, B.M.; Rosete-Verges, F.; Billa, L. Spatial analysis and GIS in the study of COVID-19. A review. Sci. Total. Environ. 2020, 739, 140033. [Google Scholar] [CrossRef] [PubMed]
  7. Sun, F.; Matthews, S.A.; Yang, T.-C.; Hu, M.-H. A spatial analysis of the COVID-19 period prevalence in U.S. counties through June 28, 2020: Where geography matters? Ann. Epidemiol. 2020. [Google Scholar] [CrossRef]
  8. Zhang, Z.; Sha, D.; Dong, B.; Ruan, S.; Qiu, A.; Li, Y.; Liu, J.; Yang, C. Spatiotemporal Patterns and Driving Factors on Crime Changing During Black Lives Matter Protests. ISPRS Int. J. Geo-Inf. 2020, 9, 640. [Google Scholar] [CrossRef]
  9. Li, Y.; Horowitz, M.A.; Liu, J.; Chew, A.; Lan, H.; Liu, Q.; Sha, D.; Yang, C. Individual-Level Fatality Prediction of COVID-19 Patients Using AI Methods. Front. Public Health 2020, 8, 587937. [Google Scholar] [CrossRef]
  10. Fernandes, N. Economic Effects of Coronavirus Outbreak (COVID-19) on the World Economy. SSRN Electron. J. 2020. [Google Scholar] [CrossRef]
  11. Paul, A.; Englert, P.; Varga, M. Socio-Economic Disparities and COVID-19 in the USA. SSRN Electron. J. 2020. [Google Scholar] [CrossRef]
  12. Baric, R.S. SARS-CoV: Lessons for global health. Virus Res. 2008, 133, 1–3. [Google Scholar] [CrossRef] [PubMed]
  13. Fairlie, R.; Couch, K.; Xu, H. The Impacts of COVID-19 on Minority Unemployment: First Evidence from April 2020 CPS Microdata; Nabr: Cambridge, MA, USA, 2020. [Google Scholar]
  14. Norouzi, N.; De Rubens, G.Z.; Choupanpiesheh, S.; Enevoldsen, P. When pandemics impact economies and climate change: Exploring the impacts of COVID-19 on oil and electricity demand in China. Energy Res. Soc. Sci. 2020, 68, 101654. [Google Scholar] [CrossRef] [PubMed]
  15. Mukherji, N. The Social and Economic Factors Underlying the Incidence of COVID-19 Cases and Deaths in US Counties. medRxiv 2020. [Google Scholar] [CrossRef]
  16. Bartik, A.W.; Bertrand, M.; Cullen, Z.; Glaeser, E.L.; Luca, M.; Stanton, C. The impact of COVID-19 on small business outcomes and expectations. Proc. Natl. Acad. Sci. USA 2020, 117, 17656–17666. [Google Scholar] [CrossRef]
  17. U.S. Bureau of Economic Analysis Personal Income by State. Available online: https://www.bea.gov/data/income-saving/personal-income-by-state (accessed on 2 November 2020).
  18. U.S. Department of Labor Unemployment Insurance Weekly Claims. Available online: https://www.dol.gov/ui/data.pdf. (accessed on 15 September 2020).
  19. United States Census Bureau American Community Survey (ACS). Available online: https://www.census.gov/programs-surveys/acs (accessed on 10 August 2020).
  20. Rahman, M.; Ali, G.; Li, X.J.; Paul, K.C.; Chong, P.H. Twitter and Census Data Analytics to Explore Socioeconomic Factors for Post-COVID-19 Reopening Sentiment. arXiv 2020, arXiv:2007.00054. [Google Scholar] [CrossRef]
  21. Hale, T.; Angrist, N.; Cameron-Blake, E.; Hallas, L.; Kira, B.; Majumdar, S.; Petherick, A.; Phillips, T.; Tatlow, H.; Webster, S. Variation in Government Responses to COVID-19; Blavatnik School of Government: Oxford, UK, 2020. [Google Scholar]
  22. Stojkoski, V.; Utkovski, Z.; Jolakoski, P.; Tevdovski, D.; Kocarev, L. The Socio-Economic Determinants of the Coronavirus Disease (COVID-19) Pandemic. SSRN Electron. J. 2020. [Google Scholar] [CrossRef]
  23. Qiu, Y.; Chen, X.; Shi, W. Impacts of social and economic factors on the transmission of coronavirus disease 2019 (COVID-19) in China. J. Popul. Econ. 2020, 33, 1127–1172. [Google Scholar] [CrossRef]
  24. Bureau of Economic Analysis Gross Domestic Product by State. Available online: https://www.bea.gov/data/gdp/gdp-state/ (accessed on 15 October 2020).
  25. Parker, K.; Minkin, R.; Bennett, J. About Half of Lower-Income Americans Report Household Job or Wage Loss Due to COVID-19 | Pew Research Center. Available online: https://www.pewsocialtrends.org/2020/04/21/about-half-of-lower-income-americans-report-household-job-or-wage-loss-due-to-covid-19/ (accessed on 2 November 2020).
  26. Parker, K.; Minkin, R.; Bennett, J. Economic Fallout From COVID-19 Continues To Hit Lower-Income Americans the Hardest | Pew Research Center. Available online: https://www.pewsocialtrends.org/2020/09/24/economic-fallout-from-covid-19-continues-to-hit-lower-income-americans-the-hardest/ (accessed on 2 November 2020).
  27. Leibovici, F.; Santacreu, A.M. International Trade Policy During COVID-19. Econ. Synop. 2020, 2020. [Google Scholar] [CrossRef]
  28. COVID-19 and International Trade: Issues and Actions. Available online: https://www.oecd.org/coronavirus/policy-responses/covid-19-and-international-trade-issues-and-actions-494da2fa/ (accessed on 2 November 2020).
  29. Bartik, A.; Bertrand, M.; Lin, F.; Rothstein, J.; Unrath, M. Measuring the Labor Market at the Onset of the COVID-19 Crisis; Nabr: Cambridge, MA, USA, 2020. [Google Scholar] [CrossRef]
  30. U.S. Department of Labor Unemployment Insurance Data. Available online: https://oui.doleta.gov/unemploy/ (accessed on 2 November 2020).
  31. Zhao, Y. US Housing Market during COVID-19: Aggregate and Distributional Evidence. SSRN Electron. J. 2020. [Google Scholar] [CrossRef]
  32. U.S. Census Bureau New Residential Construction. Available online: https://www.census.gov/construction/nrc/index.html (accessed on 15 October 2020).
  33. Realtor.com Real Estate Data Library. Available online: https://www.realtor.com/research/data/ (accessed on 15 October 2020).
  34. Halpern, N.A.; Tan, K.S.; Biostatistician, A.A. United States Resource Availability for COVID-19. Soc. Crit. Care Med. Available online: https://www.sccm.org/Blog/March-2020/United-States-Resource-Availability-for-COVID-19 (accessed on 20 May 2020).
  35. Sha, D.; Miao, X.; Lan, H.; Stewart, K.; Ruan, S.; Tian, Y.; Tian, Y.; Yang, C. Spatiotemporal analysis of medical resource deficiencies in the U.S. under COVID-19 pandemic. PLoS ONE 2020, 15, e0240348. [Google Scholar] [CrossRef] [PubMed]
  36. Definitive Healthcare USA Hospital Beds. Available online: https://www.definitivehc.com/ (accessed on 15 October 2020).
  37. National Council of State Boards of Nursing Number of Active RN Licenses by State. Available online: https://www.ncsbn.org/6161.htm (accessed on 15 October 2020).
  38. National Plan and Provider Enumeration System NPPES NPI Registry. Available online: https://npiregistry.cms.hhs.gov/ (accessed on 15 April 2020).
  39. Kouba, Z.; Matoušek, K.; Mikšovský, P. On data warehouse and GIS integration. In Lecture Notes in Computer Science (Including Subseries Lecture Notes in Artificial Intelligence and Lecture Notes in Bioinformatics); Springer: Berlin, Germany, 2000; Volume 1873, pp. 604–613. [Google Scholar]
  40. Sha, D.; Liu, Y.; Qian, L.; Yang, C. A Spatiotemporal Viral Cases Data Collection for COVID-19 Rapid Response. Big Earth Data 2020. [Google Scholar] [CrossRef]
  41. Liu, Q.; Liu, W.; Sha, D.; Kumar, S.; Chang, E.; Arora, V.; Lan, H.; Li, Y.; Wang, Z.; Zhang, Y.; et al. An Environmental Data Collection for COVID-19 Pandemic Research. Data 2020, 5, 68. [Google Scholar] [CrossRef]
  42. Mitchell, R. Web Scraping with Python: Collecting More Data from the Modern Web; O’Reilly Media, Inc.: Sebastopol, CA, USA, 2018. [Google Scholar]
  43. Gupta, S.; Kaiser, G.; Neistadt, D.; Grimm, P. DOM-based content extraction of HTML documents. In Proceedings of the 12th International Conference on World Wide Web, WWW 2003, Budapest, Hungary, 20–24 May 2003; ACM Press: New York, NY, USA, 2003; pp. 207–214. [Google Scholar]
  44. Yang, C.; Clarke, K.; Shekhar, S.; Tao, C.V. Big spatiotemporal data analytics: A research and innovation frontier. Int. J. Geogr. Inf. Sci. 2020, 34, 1075–1088. [Google Scholar] [CrossRef] [Green Version]
Figure 1. Conceptual data form of COVID-19 socioeconomic products.
Data 05 00118 g001
Figure 2. Data warehouse and a data pipeline workflow.
Data 05 00118 g002
Figure 3. On-demand web crawler diagram.
Data 05 00118 g003
Figure 4. Dynamic trend pattern of typical attributes.
Data 05 00118 g004
Table 1. Coded index with policy records for state.
Index NameDescriptionExample
State IDState abbreviation codeMD
StateThe target state nameMaryland
DateThe record date2020/3/10
S IDThe coding dimensionS1
Ordinary scaleOrdinary scale records2
Binary scaleBinary scale for geographic scope1
NotesThe link of policy legal document or news sources as the reference.shorturl.at/ehuAO
Stringency IndexCoded stringency index for this dimension100
Table 2. Metadata of dynamic socioeconomic attributes under COVID-19 pandemic.
AttributesDescriptionUpdated FrequencyTime Range (of Raw Data Source)
Gross Domestic Product (GDP)
Real GDPInflation-adjusted measure that reflects the value of all goods and services produced by an economy in a given yearquarterly2004 Q1–2020 Q2
Current-dollar GDPGDP evaluated at current market pricesquarterly2005 Q1–2020 Q2
Chain-type quantity indexesEliminate the substitution bias found in indexes with unchanging (or “fixed”) weights, and their movements are not affected by the choice of the reference period.quarterly2006 Q1–2020 Q2
Personal Income
Overall CompensationCompensation include all categoriesquarterly1948 Q1–2020 Q2
Farm CompensationCompensation for farm relate employeesquarterly1948 Q1–2020 Q2
Nonfarm CompensationCompensation for non-farm relate employeesquarterly1948 Q1–2020 Q2
Per capita personal incomeCalculated as the total personal income of the residents of a state divided by the population of the statequarterly1948 Q1–2020 Q2
International Trade in Goods and Services
Export—Manufactured CommoditiesAmount of manufactured commodities that export in millions of dollarsmonthly2006/1–2020/9
Export—Non-Manufactured CommoditiesAmount of non-manufactured commodities that export includes agricultural, forestry, fishery products, mineral commodities, scrap, waste and used or second-hand merchandise in millions of dollarsmonthly2006/1–2020/9
Import—Manufactured CommoditiesAmount of manufactured commodities that import in millions of dollarsmonthly2006/1–2020/9
Import—Non-Manufactured CommoditiesAmount of non-manufactured commodities that import includes agricultural, forestry, fishery products, mineral commodities, scrap, waste and used or second-hand merchandise in millions of dollarsmonthly2006/1–2020/9
Employment
All employees—Total nonfarmNumber of employees in thousands which are nonfarm related jobs seasonally adjustedmonthly1990/1–2020/9
All employees—ManufacturingNumber of employees in thousands which are manufacturing related seasonally adjustedmonthly1990/1–2020/9
All employees-Education and Health ServicesNumber of employees in thousands which are education and health services related seasonally adjustedmonthly1990/1–2020/9
Unemployment rateNumber unemployed as a percent of the labor forcemonthly1976/1–2020/9
EmploymentNumber of employed personsmonthly1976/1–2020/9
Labor force participation rateProportion of the population that is in the labor forcemonthly1976/1–2020/9
Initial unemployment claimAn initial claim is a claim filed by an unemployed individual after a separation from an employerweekly1967/1/7–2020/9/26
Insured Unemployment RateThe rate computed by dividing Total Unemployed by the Civilian Labor Forceweekly1967/1/7–2020/9/26
Continued ClaimsA person who has already filed an initial claim and who has experienced a week of unemployment then files a continued claim to claim benefits for that week of unemploymentweekly1967/1/7–2020/9/26
Housing market
Total number of housing unitsTotal number of privately owned housing units unadjustedmonthly2019/1–2020/9
Single family houseTotal number of single housing units unadjustedmonthly2019/1–2020/9
Multi-family unitsTotal number of multi-unit homes (includes 2, 3, or more) unadjustedmonthly2019/1–2020/9
Days on MarketThe median number of days property listings spend on the marketmonthly2019/10–2020/10
Median listing priceThe median listing price during the specified monthmonthly2019/10–2020/10
Price increase countThe count of listings which have had their price increasedmonthly2019/10–2020/10
All-TransactionsIt is based on sales price and appraisal. Values from refinance mortgages are added to the purchase-only data. Units: Index, not seasonally adjustedquarterly1991/1–2020/9
Expanded DataIt is based on sales price information sourced from Enterprise, Federal Housing Administration (FHA), and Real Property County Recorder Data Licensed from DataQuick Units: Index, not seasonally adjustedquarterly1991/1–2020/9
Purchase OnlyIt is based on more than 6 million repeat sales transactions on the same single-family properties. Units: Index, seasonally adjustedquarterly1991/1–2020/9
Table 3. Attributes description of socioeconomic determinants.
AttributesDescriptionUnitTopic
Area Sizethe state area measurements, in square kilometerssq-kmGeographic
Population Sizeannual estimates of the total population (2019)#Demographic
Population Densitypeople per sq. km#Demographic
Senior Populationpopulation age 65+ (% of total)%Demographic—age group
Young Populationpopulation ages 0–14 (% of total)%Demographic—age group
Male Populationpopulation gender male (% of total)%Demographic—gender group
White Populationpopulation race white (% of total)%Demographic—racial group
Africa-American Populationpopulation race Africa American (% of total)%Demographic—racial group
Hispanic Populationpopulation ethnic Hispanic of any race (% of total)%Demographic—ethnic group
Internet Accesspopulation using the internet and computers (2019 data)%Computers and internet subscriptions
High School Degreepopulation with high school and equivalent degrees (% of total)%Education
Bachelor’s Degreespopulation with a bachelor’s degree or higher (% of total)%Education
Median Household Incomemedian household income$Income
Poverty Ratepoverty rate household income below the poverty line.%Poverty
Uninsuredpopulation without health care coverage in the United States (% of total)%Insurance
Household Sizeaverage number of persons in a household#Household
House Ownerowner-occupied housing (% of total household)%Household
Hospitalnumber of hospitals#Health resource
Hospital bednumber of hospital licensed beds#Health resource
ICU bednumber of Intensive Care Unit (ICU) beds#Health resource
Nursesnumber of registered nurses (RN) per 1000 population#Health resource
Medical Doctorsnumber of medical doctors per 1000 population#Health resource
Table 4. Policy Stringency Index Coding Standard.
IDNameTypeTargeted/General
S1School ClosureOrdinaryGeographic
S2Workplace closingOrdinaryGeographic
S3Cancel public eventsOrdinaryGeographic
S4Close public transportOrdinaryGeographic
S5Public information campaignsOrdinaryGeographic
S6Restrictions on internal movement (stay at home)OrdinaryGeographic
S7International National travel controlsOrdinaryGeographic
Publisher’s Note: MDPI stays neutral with regard to jurisdictional claims in published maps and institutional affiliations.

