Visual Analytics Approach to Comprehensive Meteorological Time-Series Analysis


VRVis Zentrum für Virtual Reality und Visualisierung Forschungs-GmbH, 1220 Vienna, Austria
*
Author to whom correspondence should be addressed.
Data 2020, 5(4), 94; https://0-doi-org.brum.beds.ac.uk/10.3390/data5040094
Submission received: 7 August 2020
/
Revised: 4 September 2020
/
Accepted: 29 September 2020
/
Published: 30 September 2020
(This article belongs to the Section Information Systems and Data Management)
Abstract
:In some of the domain-specific sectors, such as the climate domain, the provision of publicly available present-day high-resolution meteorological time series is often quite limited or completely lacking. This repeatedly leads to excessive deployment of synthetically generated (historical) meteorological time series (TMY) to support thermal performance assessments on both building and urban scale. These datasets are generally a misrepresentation of current weather variability, which may lead to erroneous inferences drawn from modelling results. In this regard, we outline the application potential of a visual analytics approach in the context of data quality assessment and validation of TMYs. For this purpose, we deployed a standalone visual analytics tool Visplore, enriched with interlinked dashboards, customizable visualizations, and intuitive workflows, to support continuous interaction and early visual feedback. Driven by such integrated visual representations and visual interactions to enhance the analytical reasoning process, we were able to detect critical multifaceted discrepancies, on different levels of granularity, between TMY and present-day meteorological time series and synthetize them into cohesive patterns and insights. These mainly entailed diverging temporal trends and event time lags, under- and overestimation of warming and cooling regimes, respectively, and seasonal discrepancies, in particular meteorological parameters, to name a few.
1. Introduction
1.1. Background
Constant technological advancements have brought about a new paradigm shift in the collective mindset of local governments resulting in considerable increase in open-access data policies. Since 2009 and the pioneering work done in the US, which was later extended to Europe and some individual countries [1], a wide variety of open data policies has been set in motion. Although the open data movement is essential for allowing systematic inference of new knowledge, in some of the domain-specific sectors, the provision of open data is still lagging behind due to the different priorities and objectives of individual governments [2]. This is especially evident in the climate domain where often only the aggregate weather data are being offered (e.g., daily and monthly means) in contrast to undeniably needed high-resolution long-term time series to support, for instance, the detection and attribution of climate change. Only recently, some efforts have been made to bridge this gap thus making the climate information more accessible. However, these efforts might still be considered to be in their infant state and only present in selected countries such as the US [3], Austria [4], Germany [5], to name a few. In other instances, researchers have to rely on synthetically generated meteorological time series, referred to as the typical meteorological years (TMY), representing the most characteristic long-term climatic conditions for a particular location [6]. More specifically, the TMYs are datasets of selected meteorological parameters derived for each hour of a year, whereby statistical methods are applied for each month within an observed period (usually a 30-year span) to select values, which mainly correspond to the most representative ones recorded. This results in individual representative months being combined into an artificial one-year dataset whereby January may be taken from the year 1990, February from the year 1985, etc. Guidelines on the methodology applied to generate a TMY dataset from measured climate data are described in the regulation EN ISO 15927-4: 2005 [7]. However, as the TMYs rely on the historic data, it is highly unlikely that these datasets will be an accurate representation of current weather variability. In turn, this may lead to erroneous inferences driven from these datasets with notable repercussions for local and regional climate actions led by the resulting recommendations. This is a topic that has been widely discussed and documented within the climate community [8,9]. In general, the majority of these studies consider issues related to the building energy performance applications, which are fed unrealistic meteorological boundary conditions. This can further affect the predictive capabilities of such tools leading to under- or overestimation of the annual and seasonal energy demand, with an impact on the operation and maintenance costs of building systems and, potentially, on the resulting emissions [10]. It is thus evident that the data quality assessment and the validation of TMYs are essential aspects of climate and environmental research and mandatory prerequisites to building performance assessment tools and applications.
To facilitate the analysis and visualization of such high-dimensional time-based and large datasets, a number of tools and applications (e.g., Microsoft Excel, Google Charts, RAWGraphs) are being widely deployed to solve similar tasks using diverse set of methods (e.g., standard deviation, variance, bivariate correlations, clustering techniques, visual modelling). However, these tools and applications are limited in a sense that they often offer mere charting functionalities (e.g., bar charts, scatter plots, box plots), inherently static visualization methods, or are tailored to specific use cases or workflows (e.g., statistical computing, predictive analytics, text mining) [11]. As a consequence, these computing environments are often not able to detect the intriguing multifaceted patterns and interdependencies in data under investigation. In an effort to overcome these limitations, recent advances in computing fields gave rise to the interactive graphical exploratory data analysis workflows grounded on the principle of data-driven visual representations and visual interactions to enhance the analytical reasoning process, otherwise known as visual analytics (VA). Currently, a number of commercial VA systems is being used to support multi-dimensional visual data explorations, such as, for example, Tableau, QlikView, MS Power BI [12,13,14]. These solutions are namely targeted at fulfilling diverse usage scenarios, such as exploratory and confirmatory analysis and reporting and presentation of generated results. However, as these systems were not originally built for the analysis of complex time-series datasets, their applicability in such a domain may face certain limitations, reflected through limited spectrum of data transformations and visual transformations essential for time-series analysis (e.g., aggregation, binning, filtering, sorting, faceting) [11,15]. In contrast, a VA tool called Visplore, which resulted from a multi-year research effort, was developed with comprehensive time-series analysis in mind, further complemented with high-performance analytical cockpits [16,17]. In general, the unifying concept of each of these solutions is related to the analytical reasoning facilitated by visual interactive mechanisms that allow for synthetizing the overwhelmingly large datasets into cohesive patterns and insights. However, the application potential of such an approach in the context of climate research, more specifically applied to the quality assessment of meteorological time series, has not yet been fully explored.
1.2. Overview
Given this background, the aim of this paper is to outline a visual analytics approach to a comprehensive meteorological time-series analysis. Towards this end, we deployed the above-mentioned standalone VA tool Visplore, enriched with interlinked dashboards, customizable visualizations, and intuitive workflows, to support continuous interaction and early visual feedback [16,17]. In general, our study has two focal points. Firstly, our goal is to go beyond a simple descriptive statistics evaluation, to demonstrate how advanced VA solutions can help researchers acquire deeper understanding and gain critical insights from the data at hand. Secondly, we want to validate the quality and check for completeness levels in diverse meteorological datasets. More specifically, we will carry out a comprehensive quality assessment analysis of synthetically generated meteorological datasets in respect to the real ground observations towards detection of any temporal discrepancies in two datasets. To reach both of our goals, we will explore a spectrum of use cases such as time-series diversity, pattern search and comparison, as well as anomaly detection, available through native functionalities of Visplore, and document resulting potentials and outcomes.
2. Data Sources
To carry out the envisioned analysis, we required high-resolution (hourly) time-series datasets portraying the typical and current weather conditions sampled from a particular location. For the purpose of this contribution, we focused on the city of Vienna, Austria, as a case study. The TMY composed for the city of Vienna was freely acquired from the official website of the EnergyPlus software, a console-based building energy simulation program, which is handled by the U.S. Department of Energy’s (DOE) Building Technologies Office (BTO) [18,19]. Depending on the region of interest, the datasets available at the website are being offered from different providers, usually national meteorological services. Hence, the way they are generated also differs across datasets. In the case of Vienna, these relate to the IWEC (International Weather for Energy Calculations) datasets resulting from the ASHRAE Research Project 1015 (American Society of Heating, Refrigerating and Air-Conditioning Engineers) and are derived from up to 18 years (predominantly 1982–1999) of hourly weather data originally archived at the U.S. National Climatic Data Center [20].
The present-day weather conditions originated from the Zentralanstalt für Meteorologie und Geodynamik (ZAMG) data records, the Austrian meteorological service, and are offered under the Creative Commons Attribution 3.0 Austria (CC BY 3.0 AT) license [21,22]. These hourly records can be acquired from the open government data catalogues (OGD), which are part of the open government data initiative in Vienna and are, in case of ZAMG records, updated on hourly bases directly on the website [23]. However, in order to acquire historical data—in our case, the data portraying the year 2019—we deployed an open data web application called AT-Wetter, which extracts the relevant data from the OGD into one central database using the technique of web scraping [24,25]. Using the API-key (application programming interface key) that requires no prior registration or any other authorization, the data can be retrieved for a particular station, time range, and meteorological parameter. For the purpose of our study, we focused on the urban station called Wien/Hohe Warte with unique identifier 11035.
3. Methods
As mentioned before, in the current application we relied on the use of a standalone VA tool Visplore. The principal workflow of Visplore compliments the essential aspects of a data science process: (1) data import; (2) data structure and quality check; (3) data diversity, pattern search, and anomaly detection; (4) communicating insights and findings [26]. To carry out such tasks, the tool itself provides numerous functionalities accessible through so-called analysis cockpits, which represent the collection of built-in analytics modules optimized for intuitive implementation of the envisioned application tasks (Figure 1). The encoding of each of these modules is targeted towards the interactive visual representation of the imported time series to support customizable exploratory analysis. The inter-linked nature of multiple analytics modules within each single cockpit allows for a seamless navigation and swift change between the analysis focus, achieved by applying user-defined time-based or event-based filters, and desired analysis technique. To support such interactivity during computations, Visplore system uses a multi-threading architecture. The system itself is implemented in C++ (general-purpose programming language); it uses GTK+ (cross-platform widget toolkit for creating graphical user interfaces) as GUI library and OpenGL (cross-language, cross-platform application programming interface for rendering 2D and 3D vector graphics) for rendering [17].
3.1. Data Import
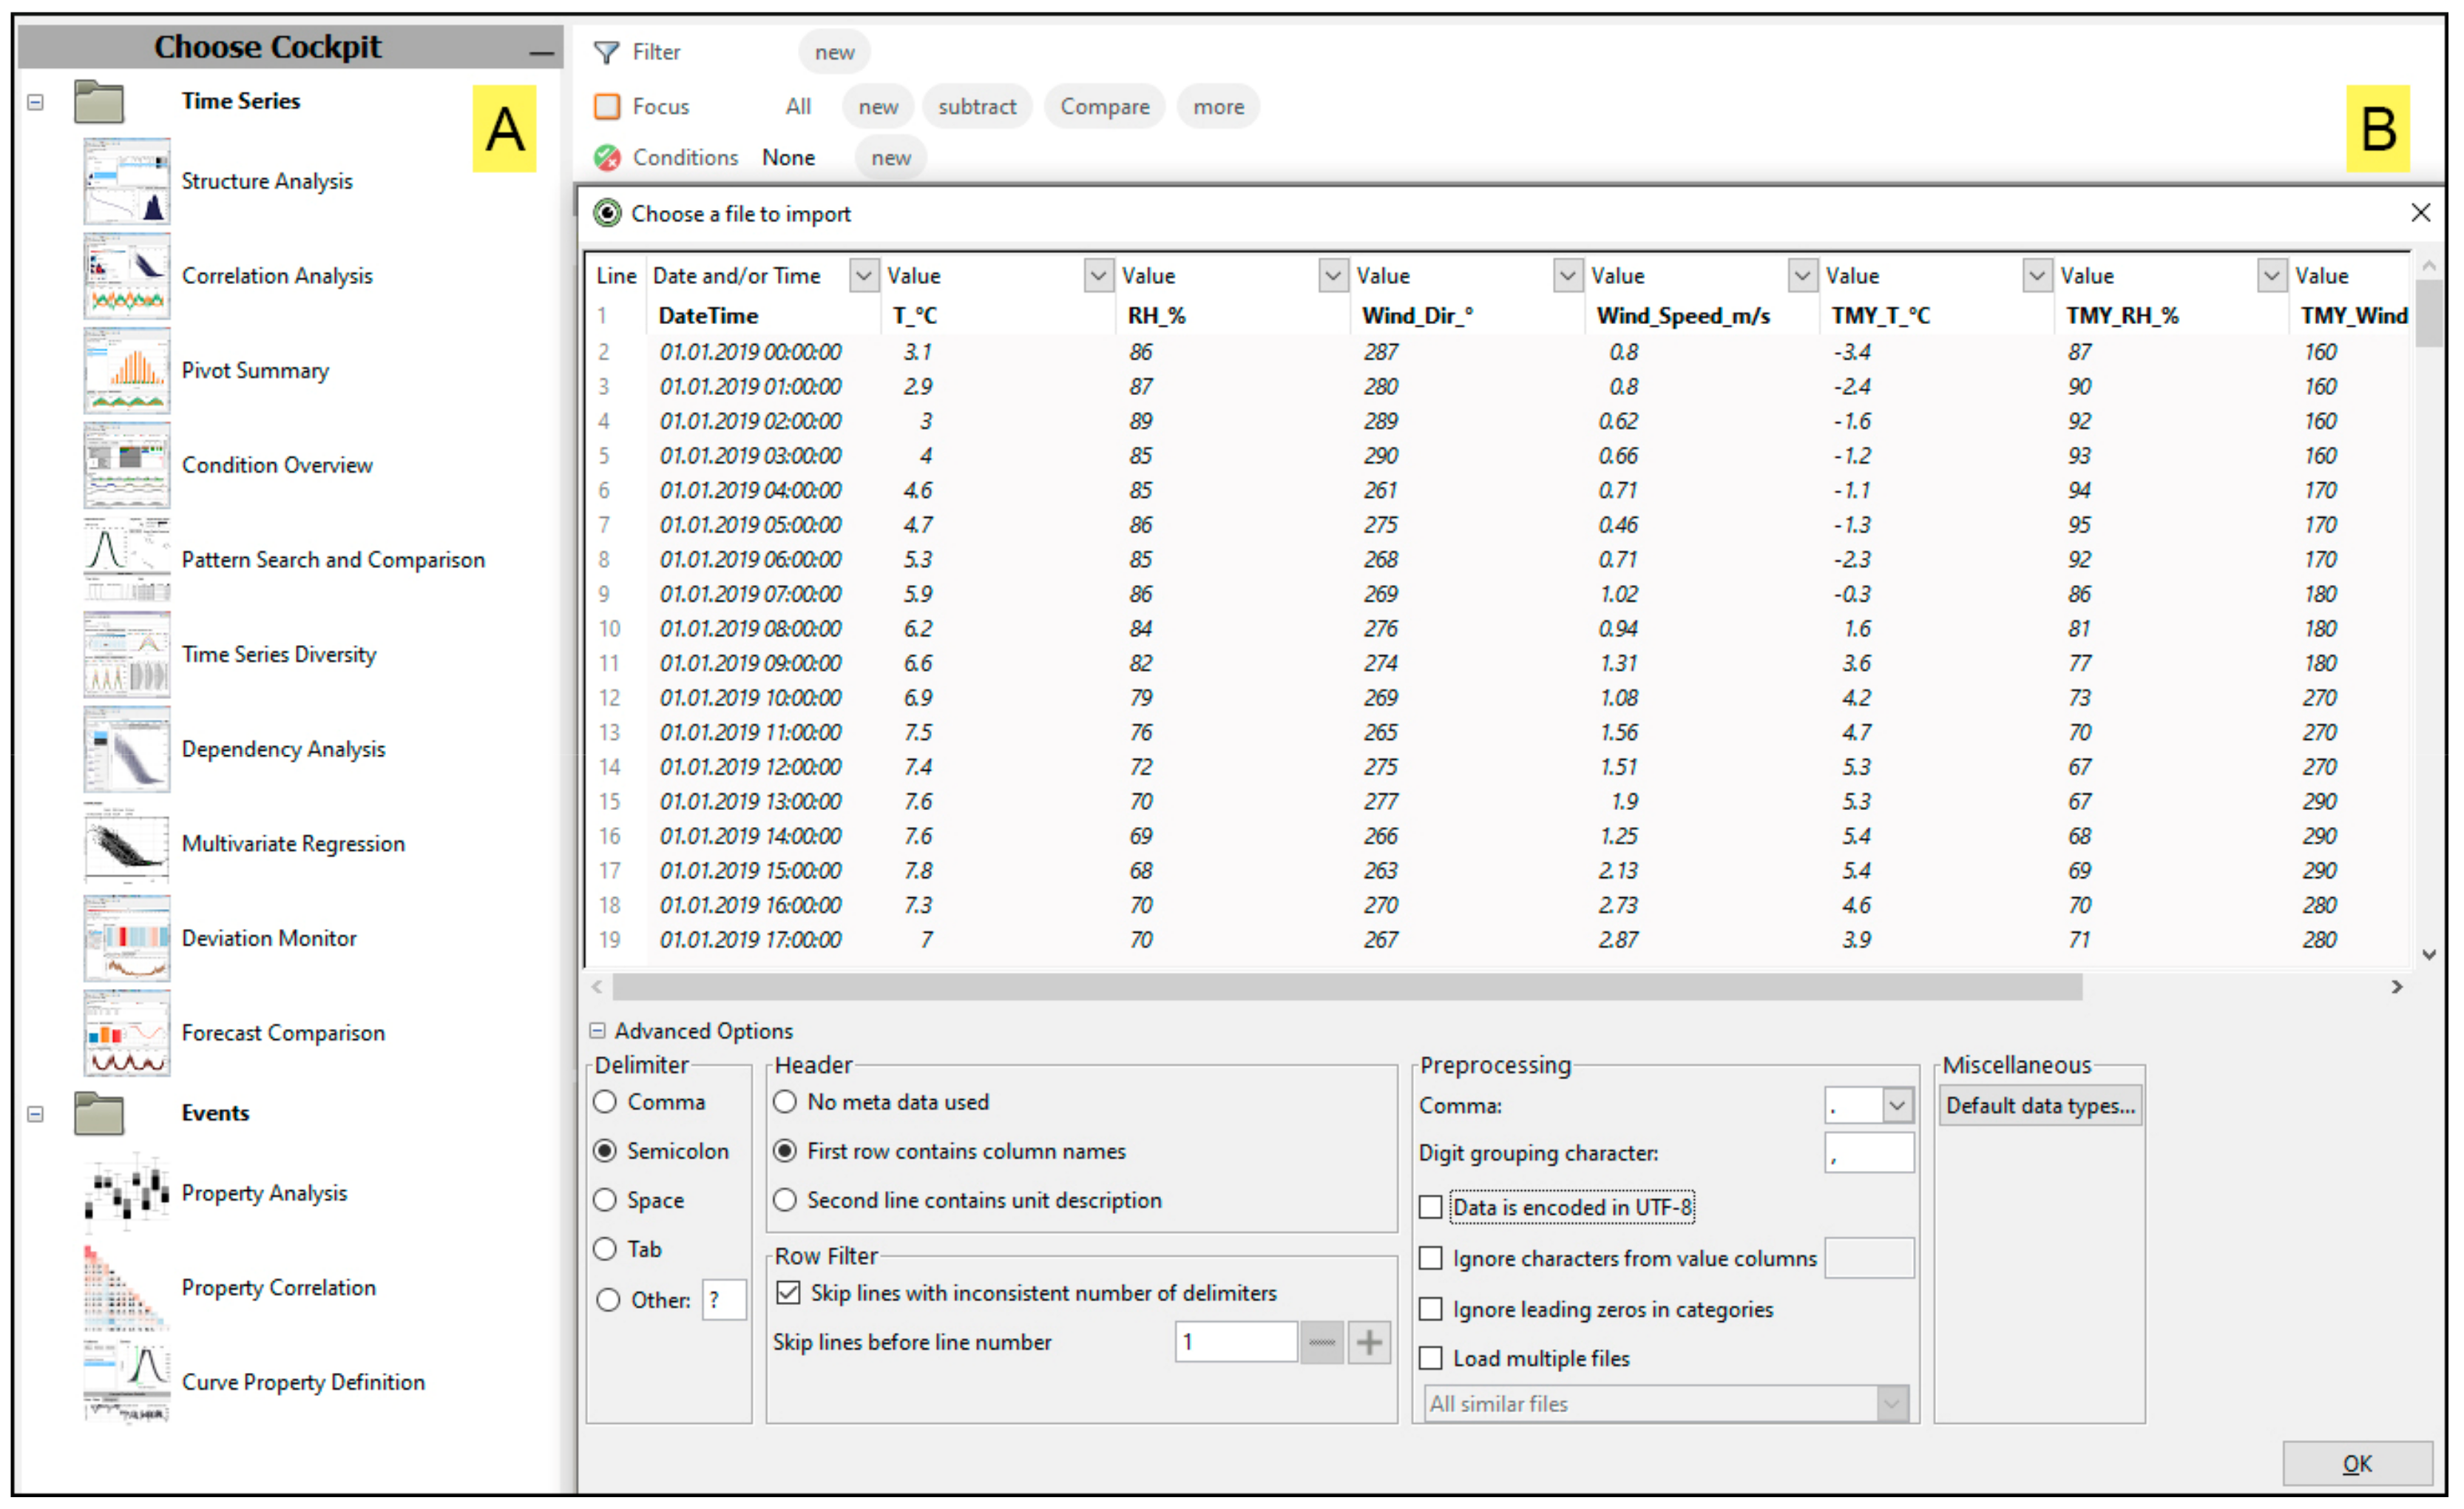
Prior to the actual analysis, it was necessary to clean and re-structure the raw datasets, a process that is known as data wrangling, bringing them into a desired file format native to the Visplore system. This called for merging of selected parameters (air temperature, relative humidity, wind speed, and wind direction) from TMY and current meteorological time series and saving them in a CSV format, whereby columns represented the parameter time series, and rows referred to the individual hourly records. As the most current version of the Visplore tool is not equipped with interactive data wrangling functionalities, we had to use other means to carry out needed transformations. Thus, we deployed R (version 4-0-2) and its open source IDE (integrated development environment) RStudio [27,28]. It was further noticed that the datasets that were acquired through API contained some missing hours, but also some NULL attributes for wind direction (43 fields in total). Three non-consecutive hours in total were missing, which was adjusted by adding the missing timestamps and adding the NULL values for all meteorological parameters. Once the CSV file is prepared, it was fed into the Visplore for further processing. During the built-in import phase, the user is offered a preview of the dataset for checking that everything is read-in properly (Figure 1). In case of erroneous import, we could manually correct the data type of any existing column, defining thus whether the data should be an integer, a categorical value, date, and/or time, etc.
3.2. Data Structure and Quality Check
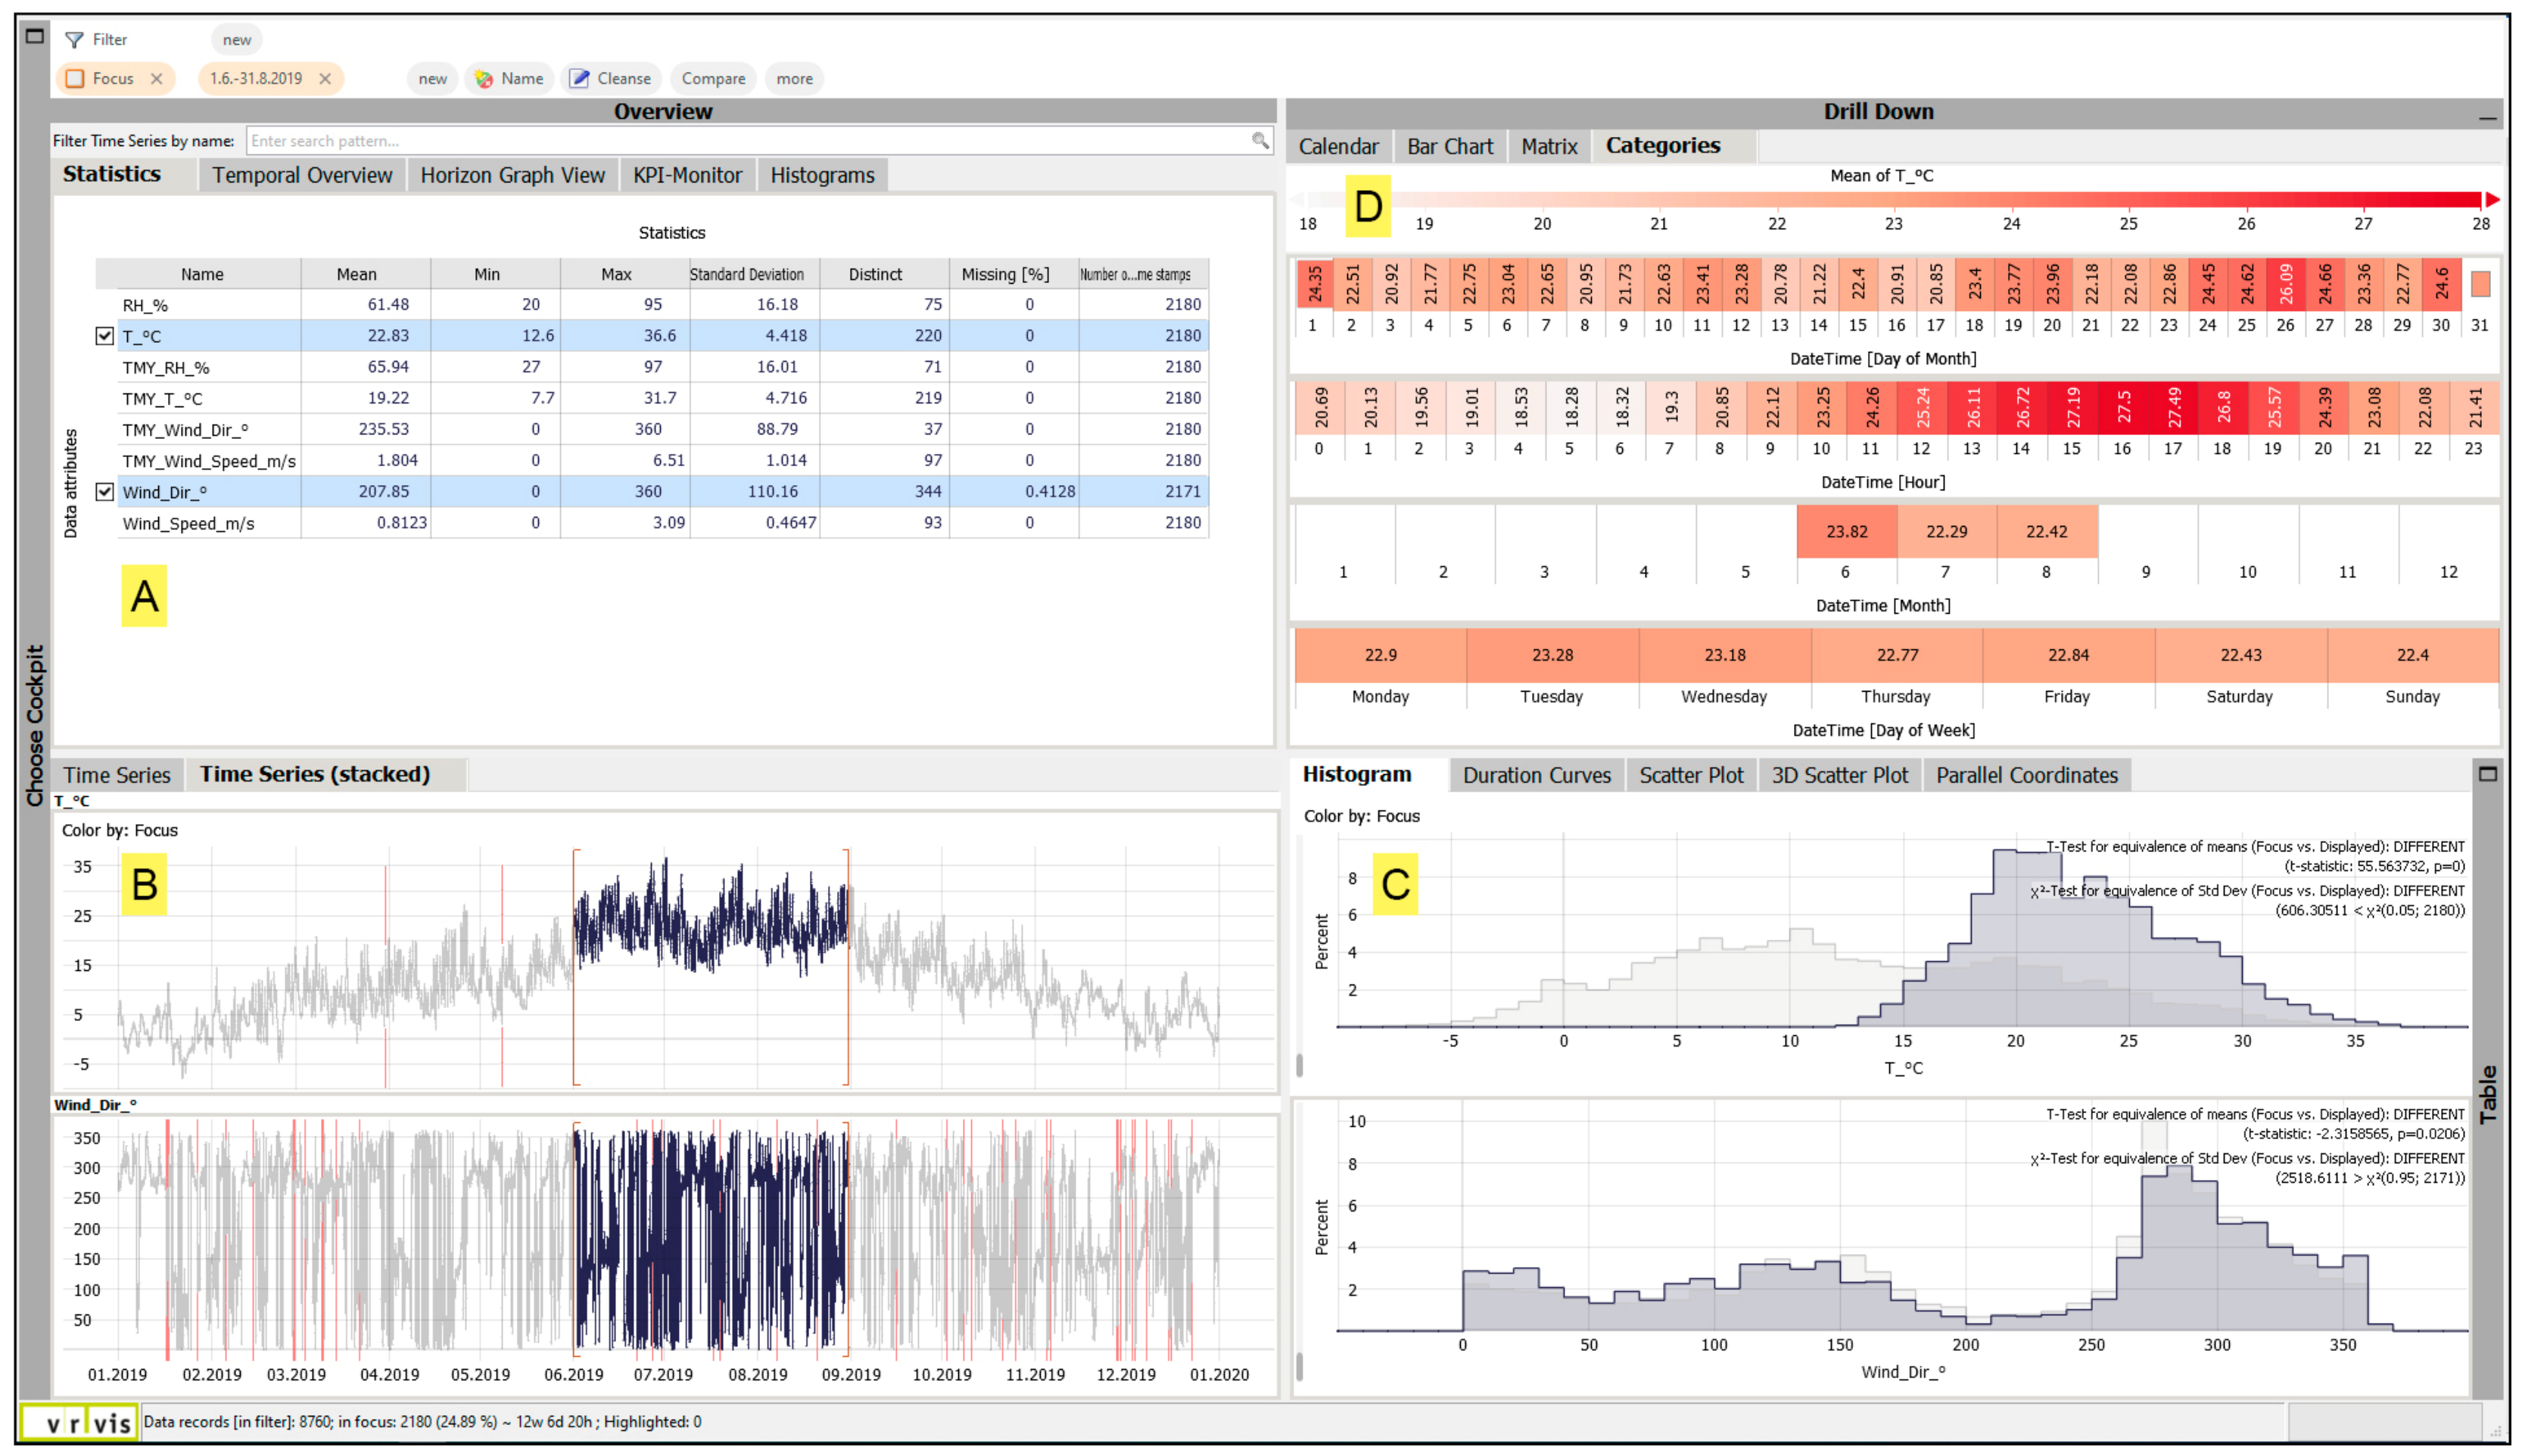
With data in place, we proceeded with the data structure and quality check. For this purpose, we selected a specific cockpit equipped with functionalities suitable for a structural data analysis. These entail insights into completeness of the time series (detection of missing values), the basic descriptive statistics of the imported time series (e.g., number of time stamps, mean, maximum, minimum, standard deviation), drill down functionality to lower granularity of the time series, and temporal and frequency distribution of data values (Figure 2). In case of any missing values, the resulting gaps are highlighted in red color in the stacked view of the line plots that provide the temporal distribution of selected time series (Figure 2B). The line plots can be further used for the intra-comparison of temporal discrepancies of different time series. By highlighting the continuous sequence of the time series directly in the line plot, we could define distinct time-based or event-based filters to be applied for further analysis, thus introducing new dimensions to our analysis, such as seasonality (Figure 2B). Additionally, once the desired filter is applied, the other metrics and visuals are instantaneously updated to reflect on this change by providing the summary for the data within the newly defined time range.
3.3. Data Diversity, Pattern Search, and Anomaly Detection
A number of existing cockpits in Visplore offer visual solutions for data diversity, pattern search, and anomaly detection. In order to identify distinct patterns and individual events of interest, such as, for example, discrepancies in peak values and daily amplitudes, diverging trends, periodic behaviors, and records time lags, especially relevant for the time series under investigation, we needed to explore data points at various levels of granularity. For this purpose, apart from investigating the full-length annual sequence, we also looked into the seasonal and diurnal feature distributions. To achieve less variation in length of individual seasons and to achieve more consistency and statistical significance in derived climatological metrics for a particular season, we focused our study on meteorological seasons. We also defined thresholds for identifying extreme events, such as periods of increased heat or cold stress, following the specifications of one of the most comprehensive indices for calculating heat stress in outdoor spaces—the universal thermal climate index (UTCI) [29]. We further adapted these specifications to encompass broader thermal perceptions. Therefore, events above the threshold of 30 °C are considered to be of moderate to strong heat stress. Events below the threshold of 0 °C are considered to be of moderate to strong cold stress.
3.4. Communicating Insights and Findings
Visplore system is primarily designed with a dynamic and intuitive visual data exploration in mind, as well as fast and rich visual feedback. However, as communication of resulting findings to relevant stakeholders, workplace superiors, or colleagues is of equal importance, Visplore system is equipped with a number of possibilities for exporting images, screenshots, and also aggregated datasets. These can be further customized to follow user preferences in regard to the font type, design elements to be displayed (i.e., legend, title), thus aligning them to the desired visual preferences. It should be noted, however, that Visplore system currently does not have automated reporting functionalities. Rather, the visuals are exported individually from a desired view and later combined using a software of user’s preference. However, in addition to exporting subsets of data and final images of diagrams, Visplore supports the state of the current analysis session to be saved and be restored at a later time. This denotes saving the current cockpit session; option to embed the underlying dataset; saving all user-defined filters, so as to be later shared with colleagues; external partners; and domain experts, who can proceed with exploring the data under investigation.
4. Results and Discussion
4.1. Advantages of Visual Analytics Approach over Traditional Descriptive Methods
We can already foresee the potential of a VA system in overcoming the inherited limitations of a simple data analysis grounded on descriptive statistics alone. Where descriptive statistics offer a very general quantitative summary of basic features of the data, VA may offer vast exploration of all the nuances of the underlying dataset across numerous scales. In principle, descriptive statistics simplifies the ways data are interpreted, often by providing a single or a limited set of metrics and numeric indicators to inform on the quite generic behavior of data across potentially wide range of multi-dimensional dependencies. With a VA system, the user is provided with a diverse set of visual, analytical, and interactive methods that extend beyond the immediate data summaries towards the detection of complex features and multi-level associations within big data. Equipped with suitable visualization techniques and parameterized algorithms, a VA system offers extensive data-foraging space with a vast spectrum of techniques for synthesizing the data into well-founded insights. There is a myriad of potential benefits of such a system, and we have already highlighted a number of those functionalities essential for the task at hand. More specifically, inferences regarding the structure, quality, and completeness of data would otherwise be totally omitted from the results of the conventional descriptive analysis. This also holds true for the identification of existing patterns and potential anomalies, which would otherwise remain unknown. In the following sections, we will exemplify these benefits using a real-world case study.
4.2. Comprehensive Analysis of Meteorological Time Series
4.2.1. Completeness Check and Anomaly Detection
With the Visplore system, we had an instantaneous overview of the very structure of the loaded time series. The most commonly used statistics metrics revealed existing disparity in annual values across all paired parameters (e.g., API-derived present-day temperature against TMY temperature). This is further outlined in Table 1, with missing values in wind direction for the API-derived dataset clearly identified (also marked in red in Figure 2). The highest inconsistency was observed for temperature time series. Often, these are the only metrics that would be given when conducting similar studies, thus masking out all the hidden and non-explicit relationships.
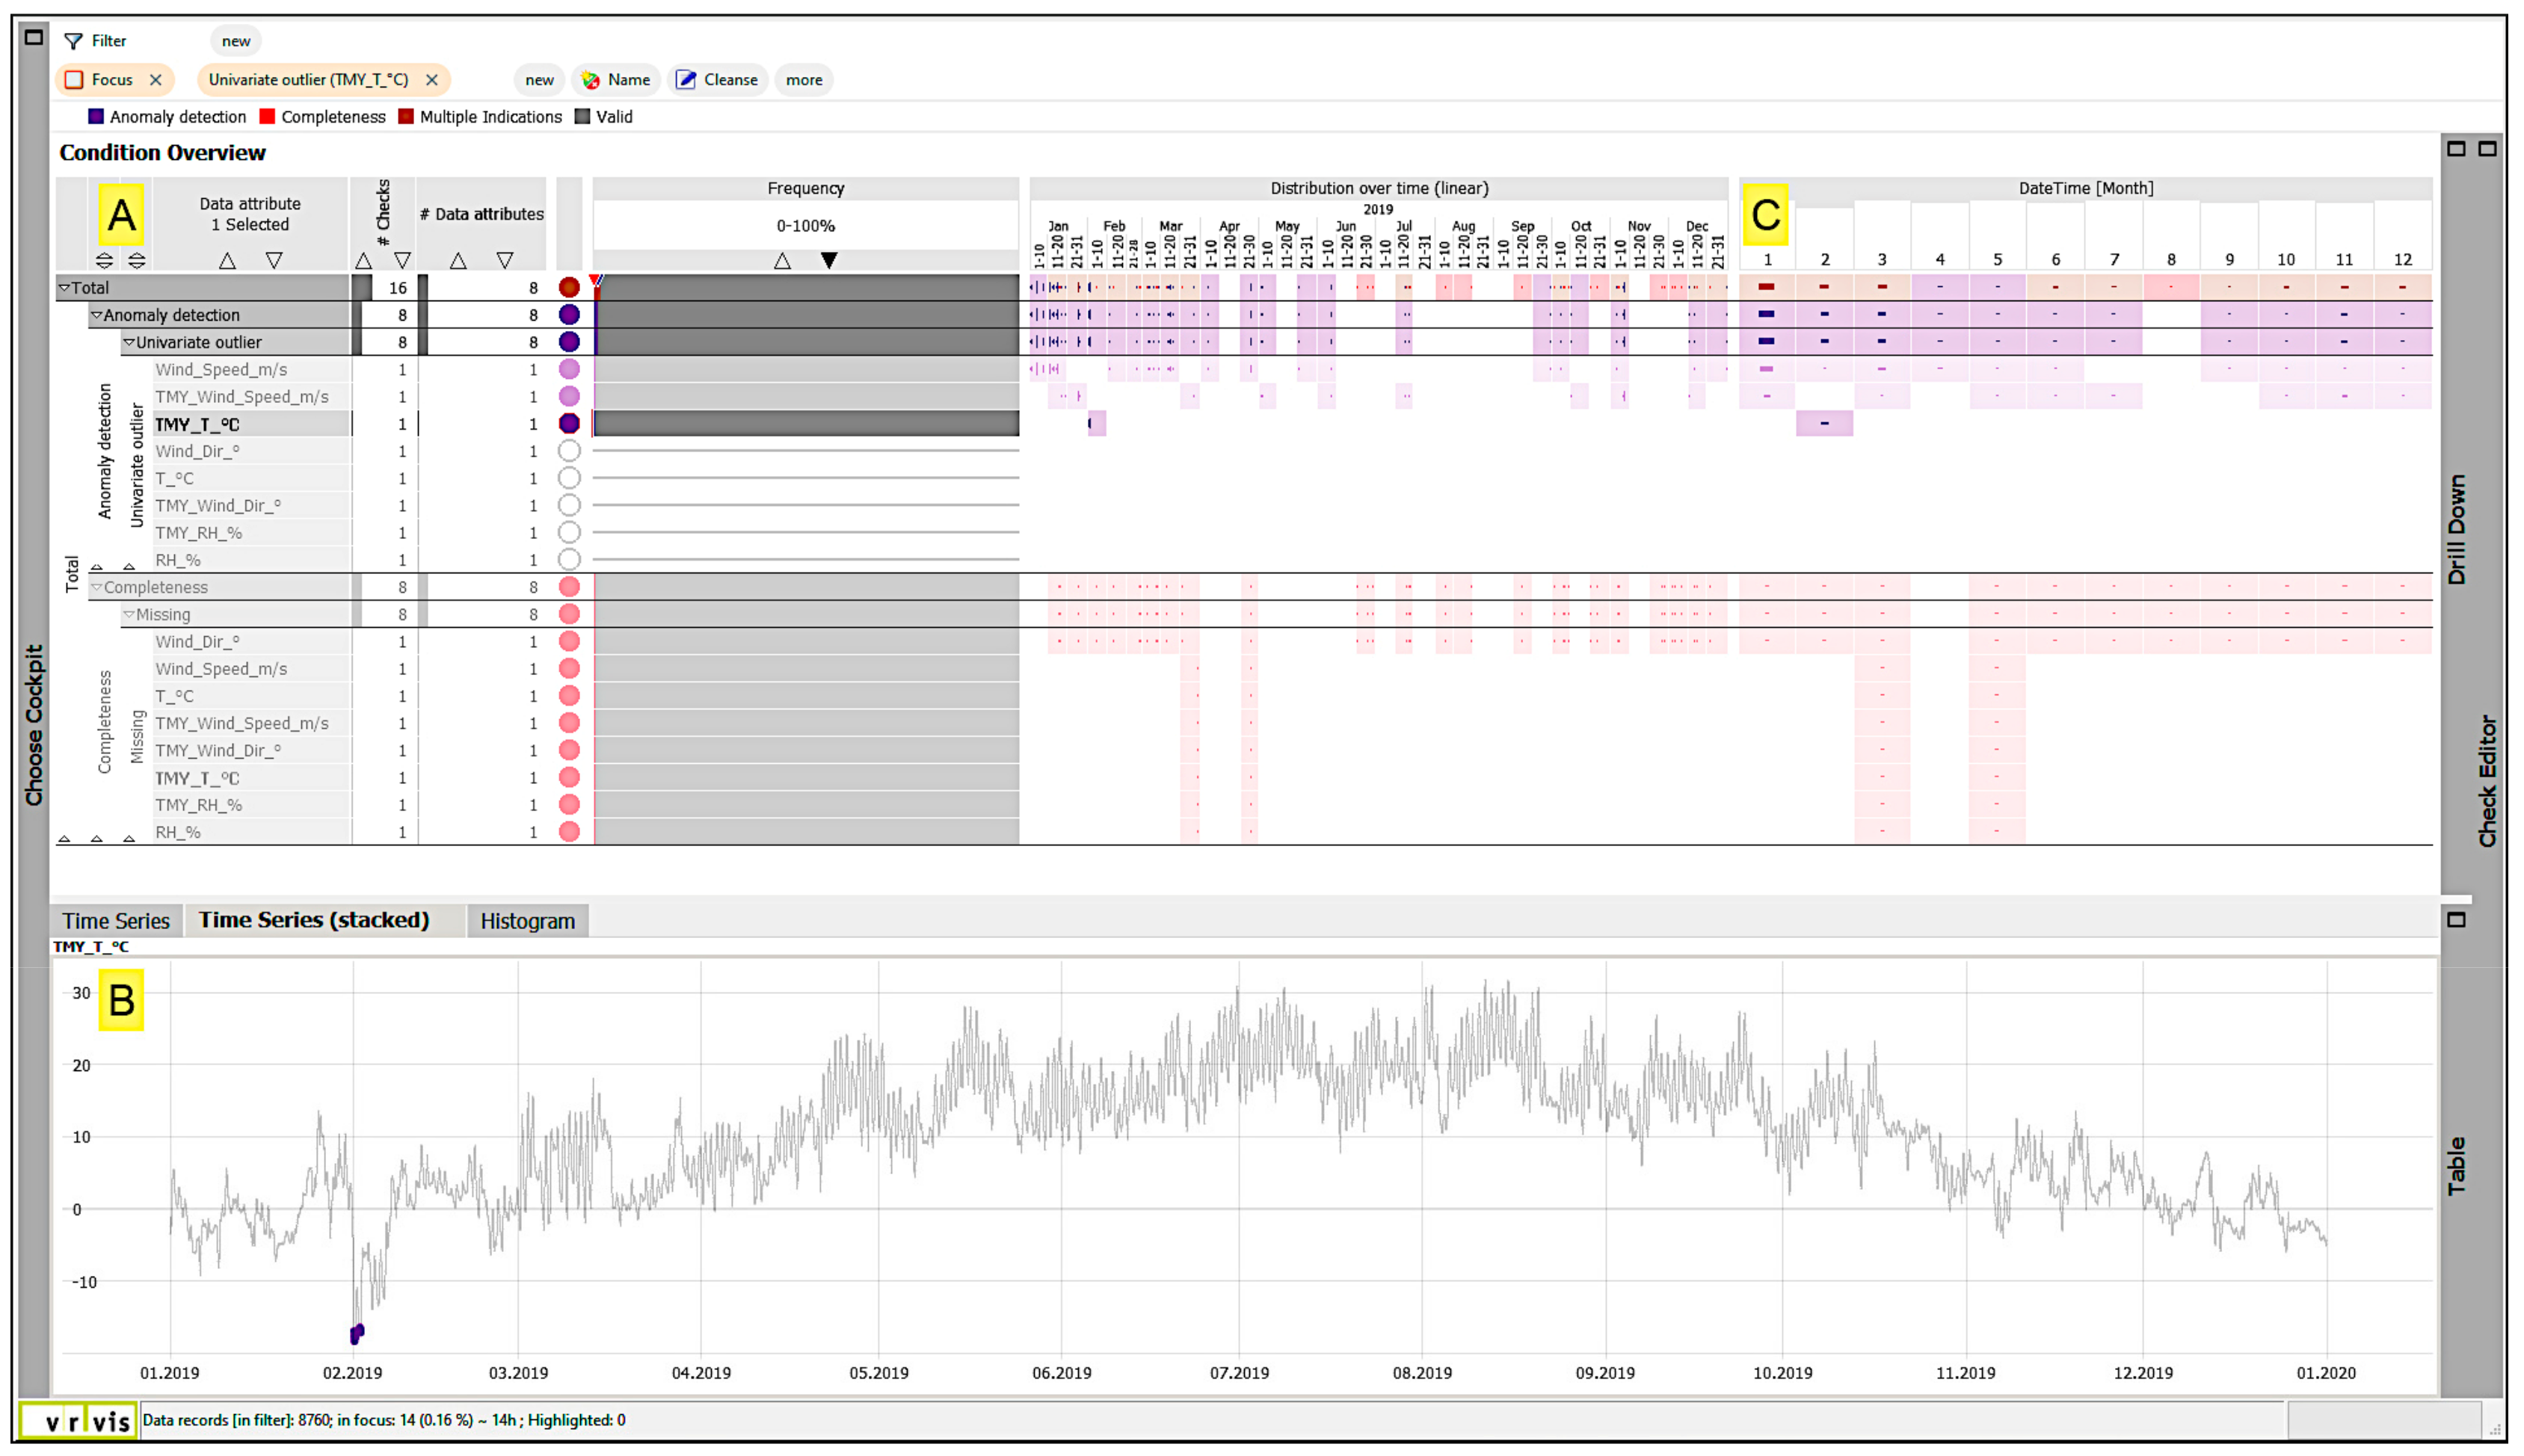
However, interlinked analytics modules of Visplore allowed us to perform a more comprehensive analysis. By deploying a specifically tailored condition monitor cockpit, we were able to instantly detect conditions such as missing values, gaps, duplicate time stamps, and anomalies in all imported time series (Figure 3A). Hierarchical organization of the time series by problem frequency further allowed us to focus on those instances that are perceived as problematic. For instance, an anomaly was detected in the TMY temperature time series whereby a number of univariate outliers were detected in the month of February (Figure 3B). These were evaluated based on the principle of the Tukey test by identification of individual means that are significantly different from a set of means [30]. The identified month is further marked in the calendar view with individual occurrences being mapped onto the line plot for an easy detection and potential exclusion in later analysis. Likewise, the missing values in API-derived wind directions time series were noted and mapped across distinct months in which they were present (Figure 3C).
4.2.2. Data Diversity and Pattern Search
Annual Analysis
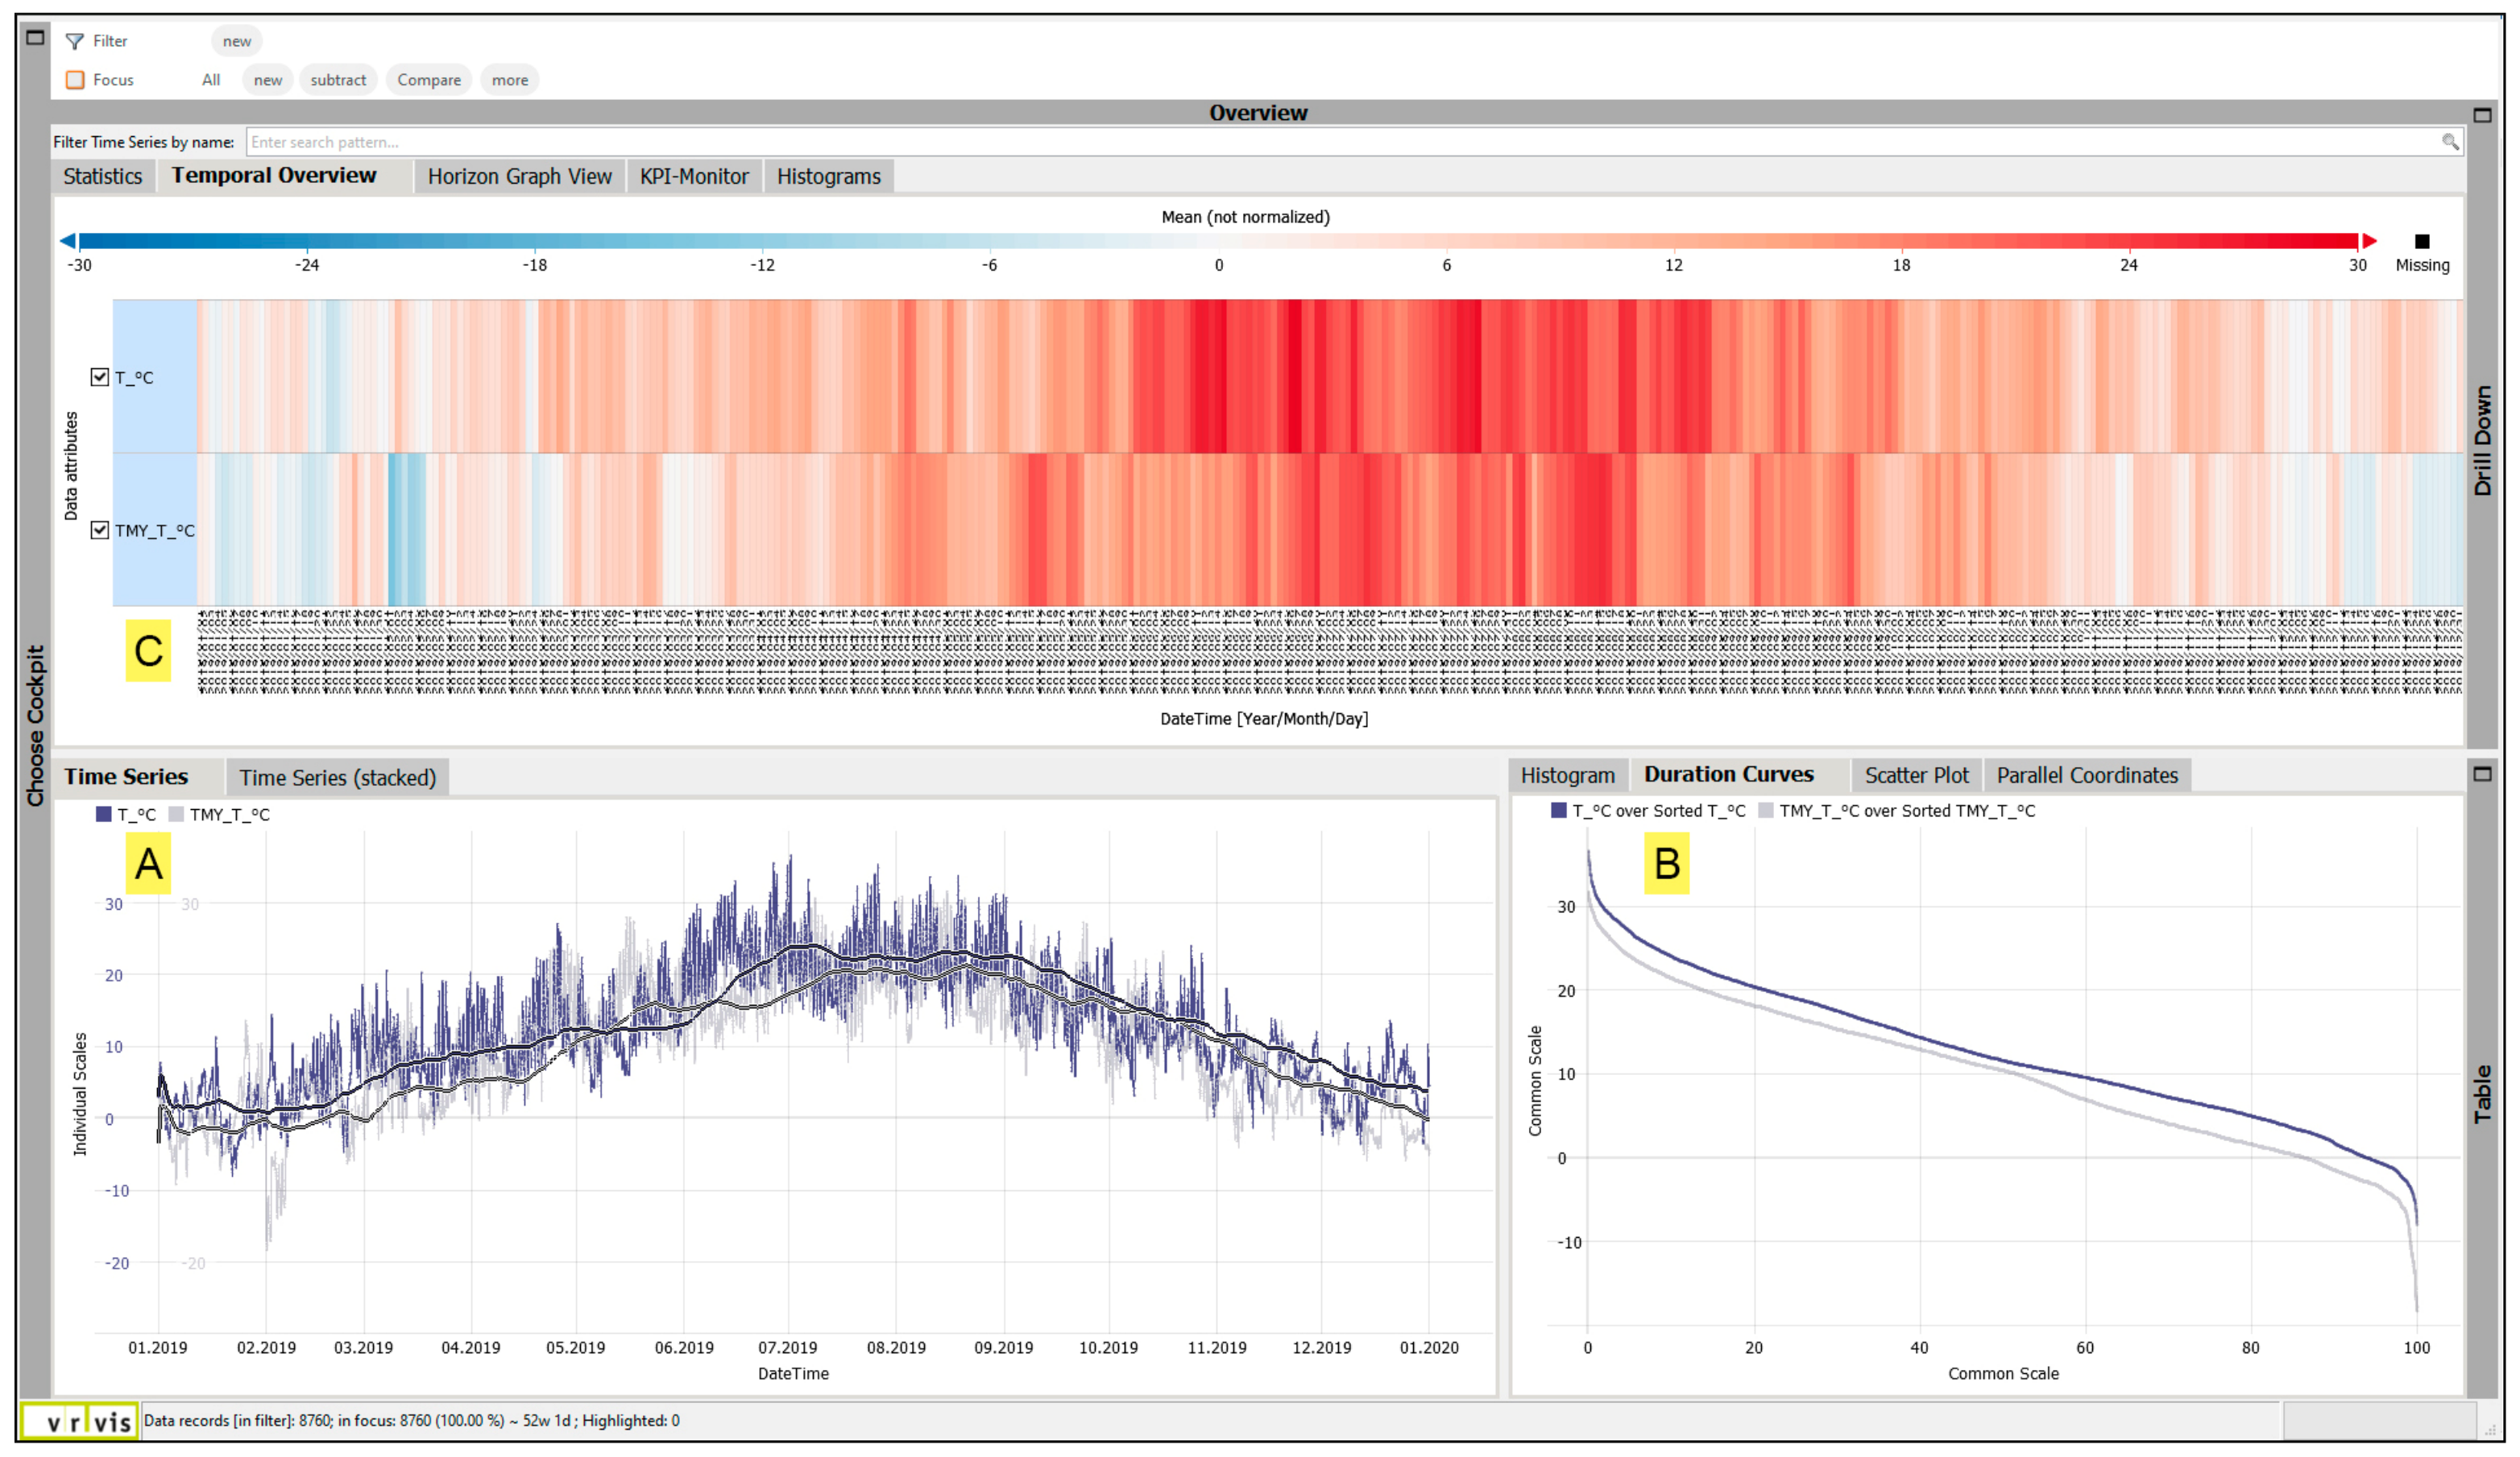
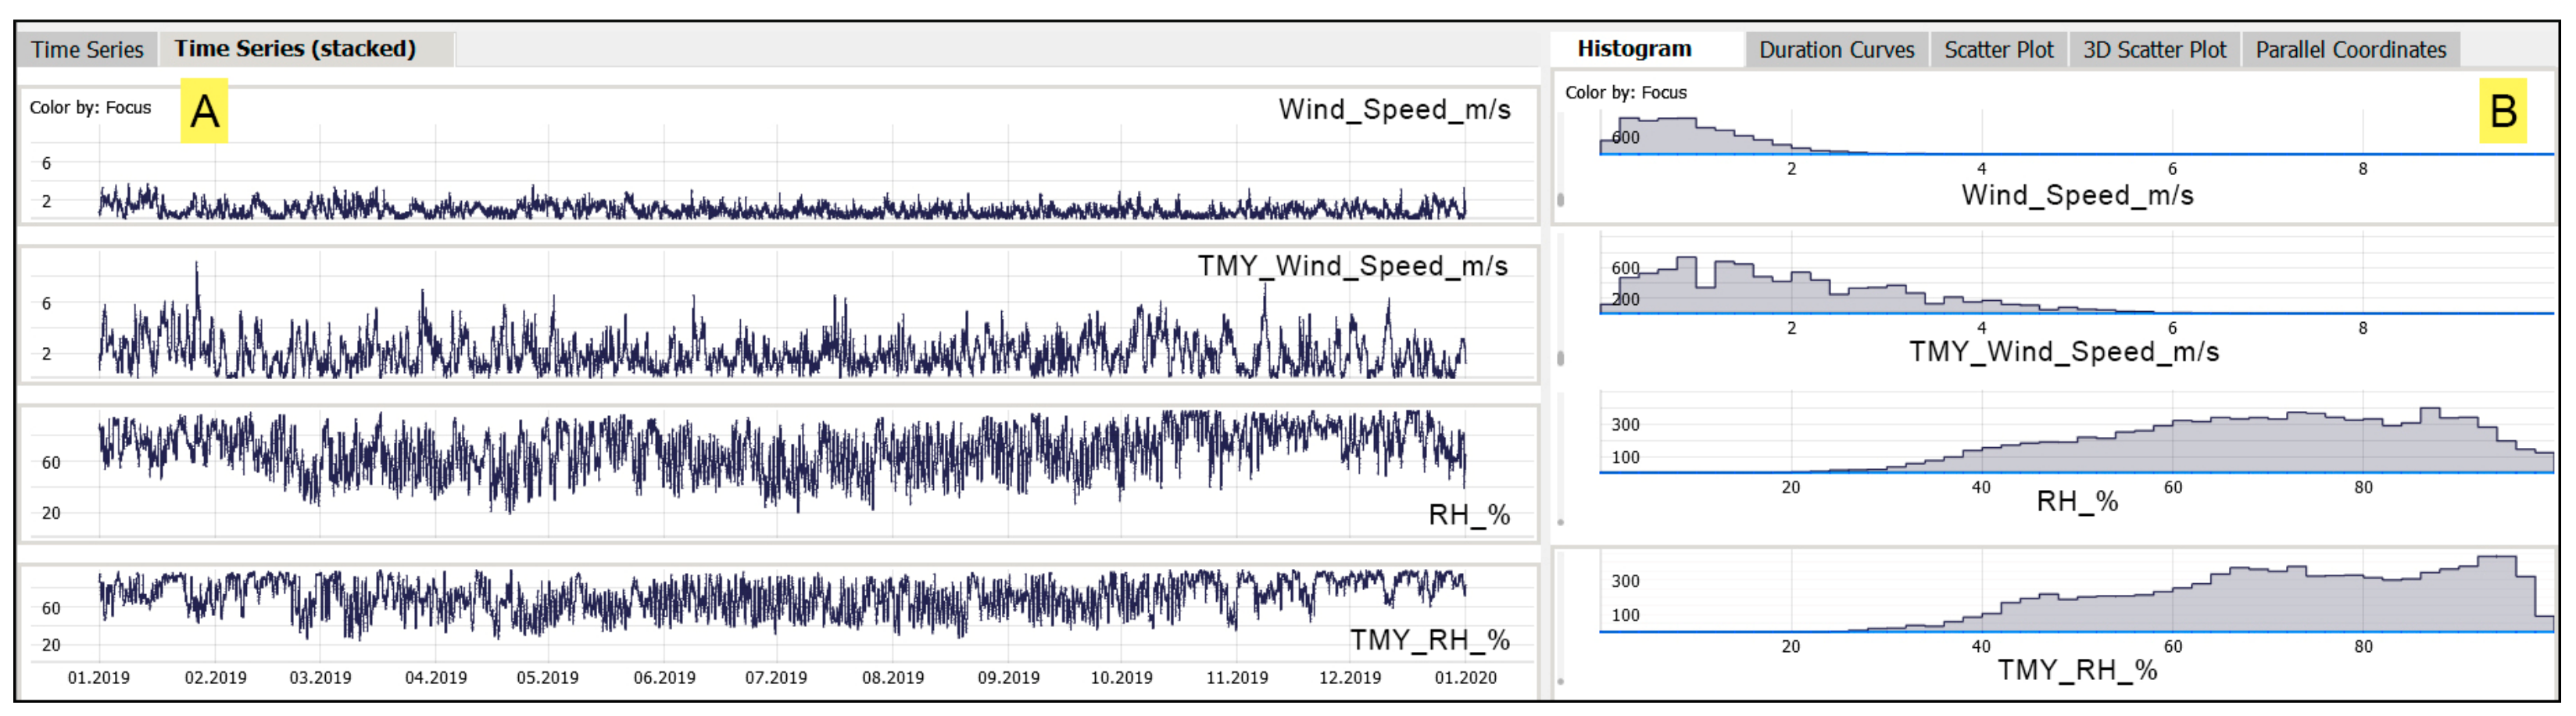
Most analytics modules in Visplore are equipped with a line plot used to represent temporal distribution of selected time series. Using such temporal representations we can see that, besides a clear vertical offset in temperature curves, there are often inversed trends and inconsistencies in peak values between the two time series (Figure 4A). Additionally, the integrated cumulative frequency plot revealed a consistent underestimation of temperature values in TMY (Figure 4B). Looking at the distribution of daily mean values represented by a 2D heatmap plot, we can see that the period of generally warmer temperatures is notably longer in present-day time series (denoted by T_°C in Figure 4C). Similar observations can be made for the relative humidity and wind-speed data (Figure 5). It should be noted that Figure 5 focuses on only two selected linked views from the same analytics module. The variation in distinct values is especially visible in cumulative frequency plots (Figure 5B). It can be observed that the TMY wind-speed distribution is skewed to the right, thus denoting a larger spread and a tendency towards higher values. While the most frequent present-day wind speeds are in the range of 0.2 to 1.6 m/s (80% of the time), in the TMY dataset, these range from 0.2 to 3.4 m/s (85% of the time). A comparative analysis of the time series representing relative humidity data does not reveal such large annual discrepancies, however the dominant inconsistences are noted in the area of higher values for TMY dataset (above the threshold of 90% relative humidity). We can also see notable disparities in wind direction data (Figure 6), whereby TMY dataset greatly overestimated those directions, which are not prevailing in Vienna, given that the winds from west to northwest dominate in the city of Vienna [31]. It should be noted, however, that this divergence may be, in part, due to the very nature of how the TMY dataset is generated. Additionally, the noted shifts in the dominant wind direction may be further driven by climate change.
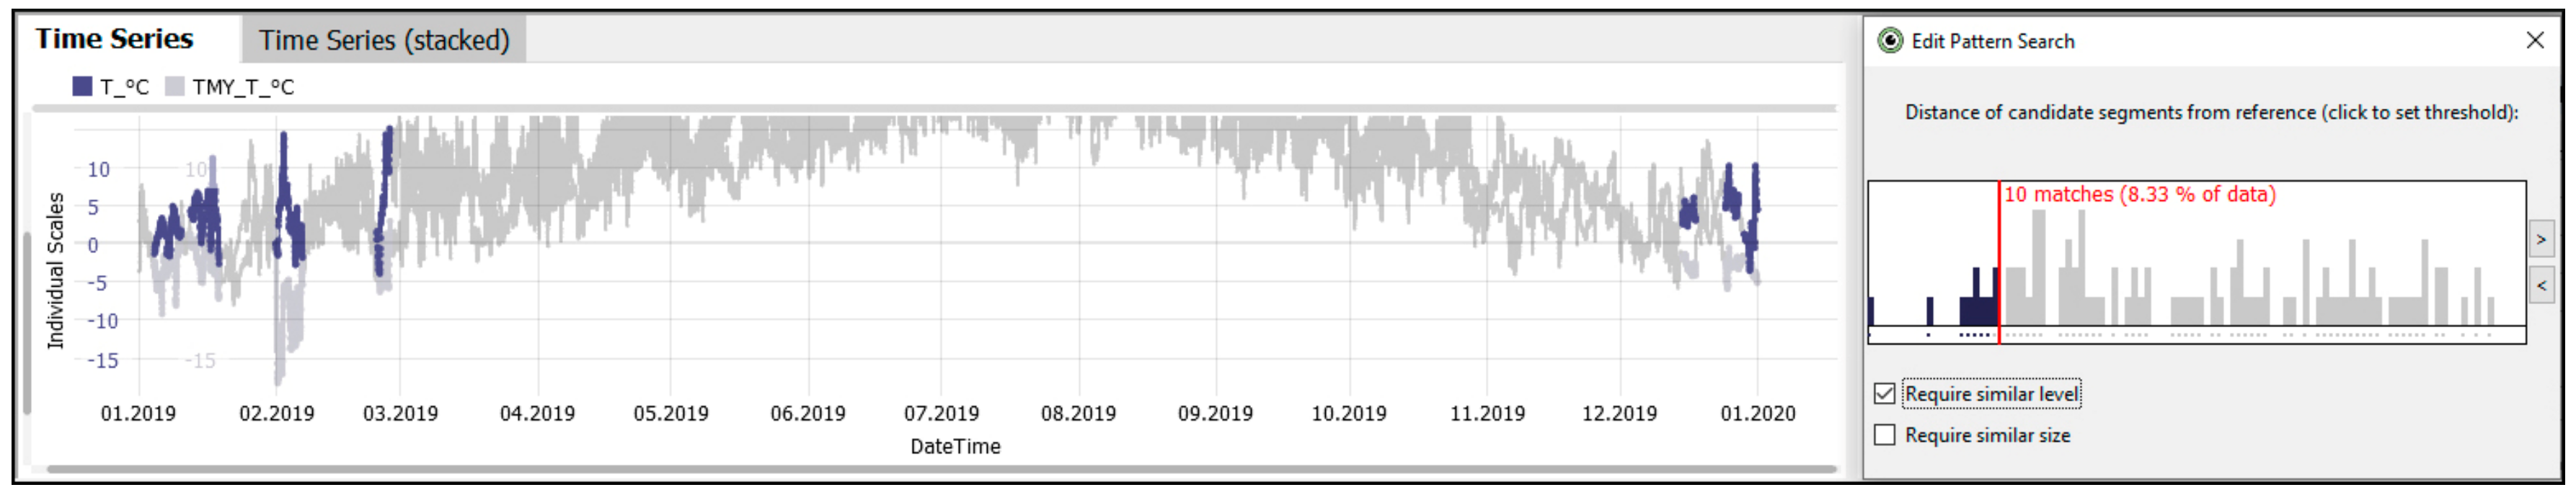
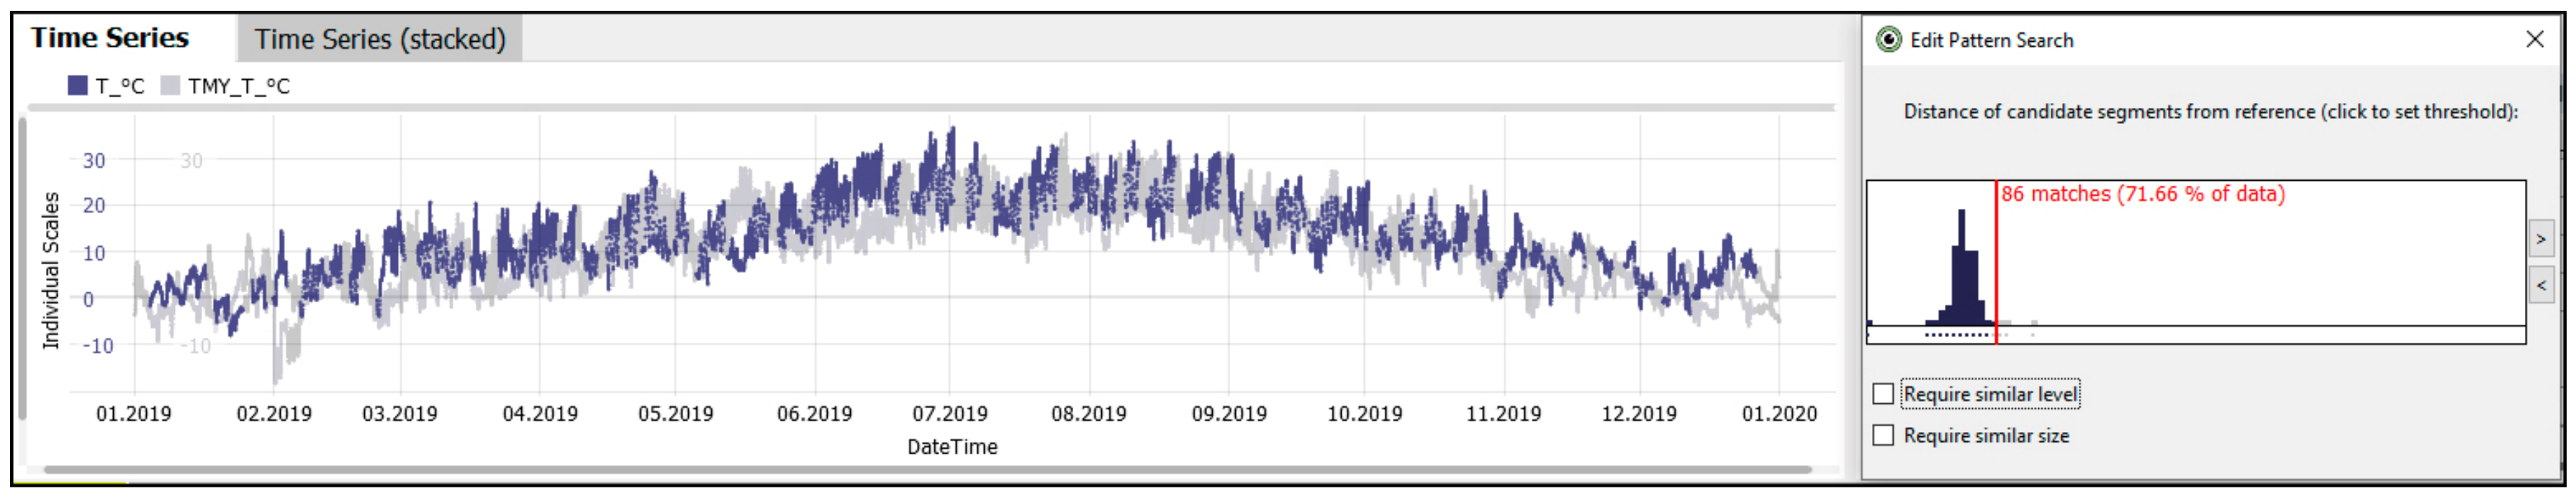
To further investigate the above noted inversed trends and inconsistencies in peak values in temperature time series, we selected the most distinct anomalous pattern representative of such behavior as input for an advanced pattern search and mapping (also depicted in purple color in Figure 3). This functionality is based on the dynamic time warping approach to achieve an optimal identification of any distortions events [32]. The results implied an overall share of 8.33% of such dramatic fluctuations especially visible in colder periods (Figure 7). Altogether, 71.66% displayed a general tendency towards these kinds of thermal inversions, which further appeared to be consistently distributed across the whole time series (Figure 8).
Seasonal Analysis
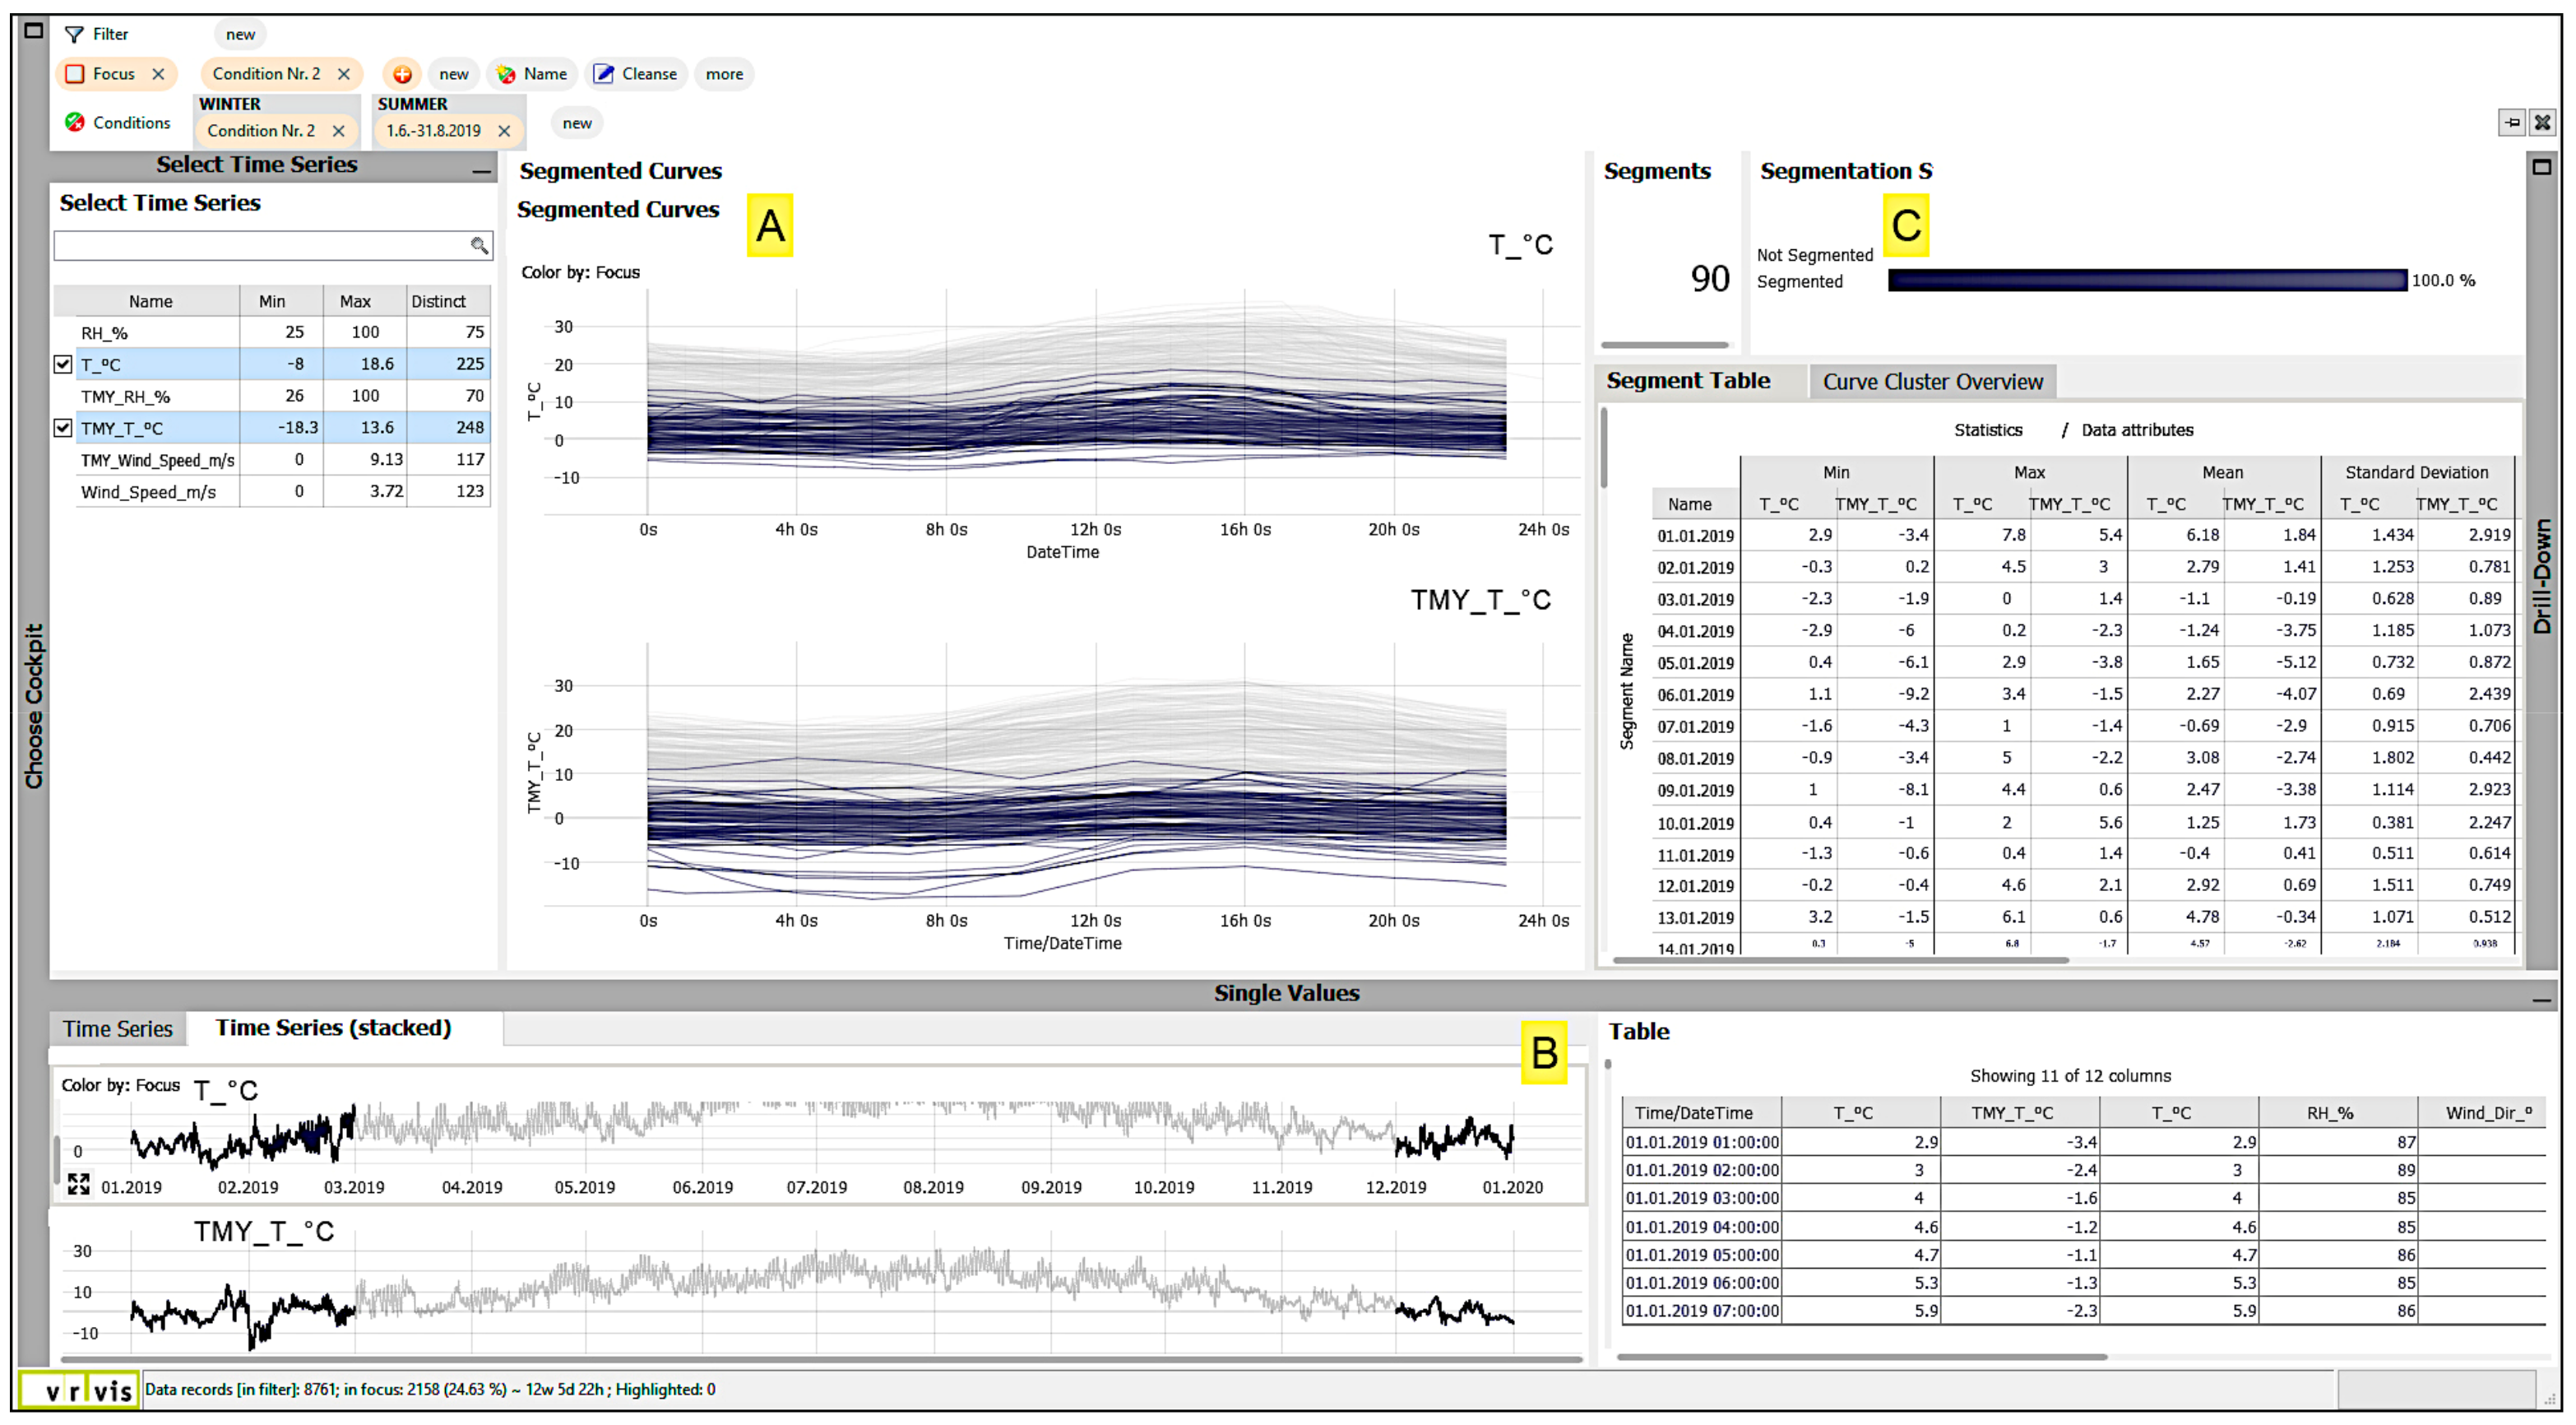
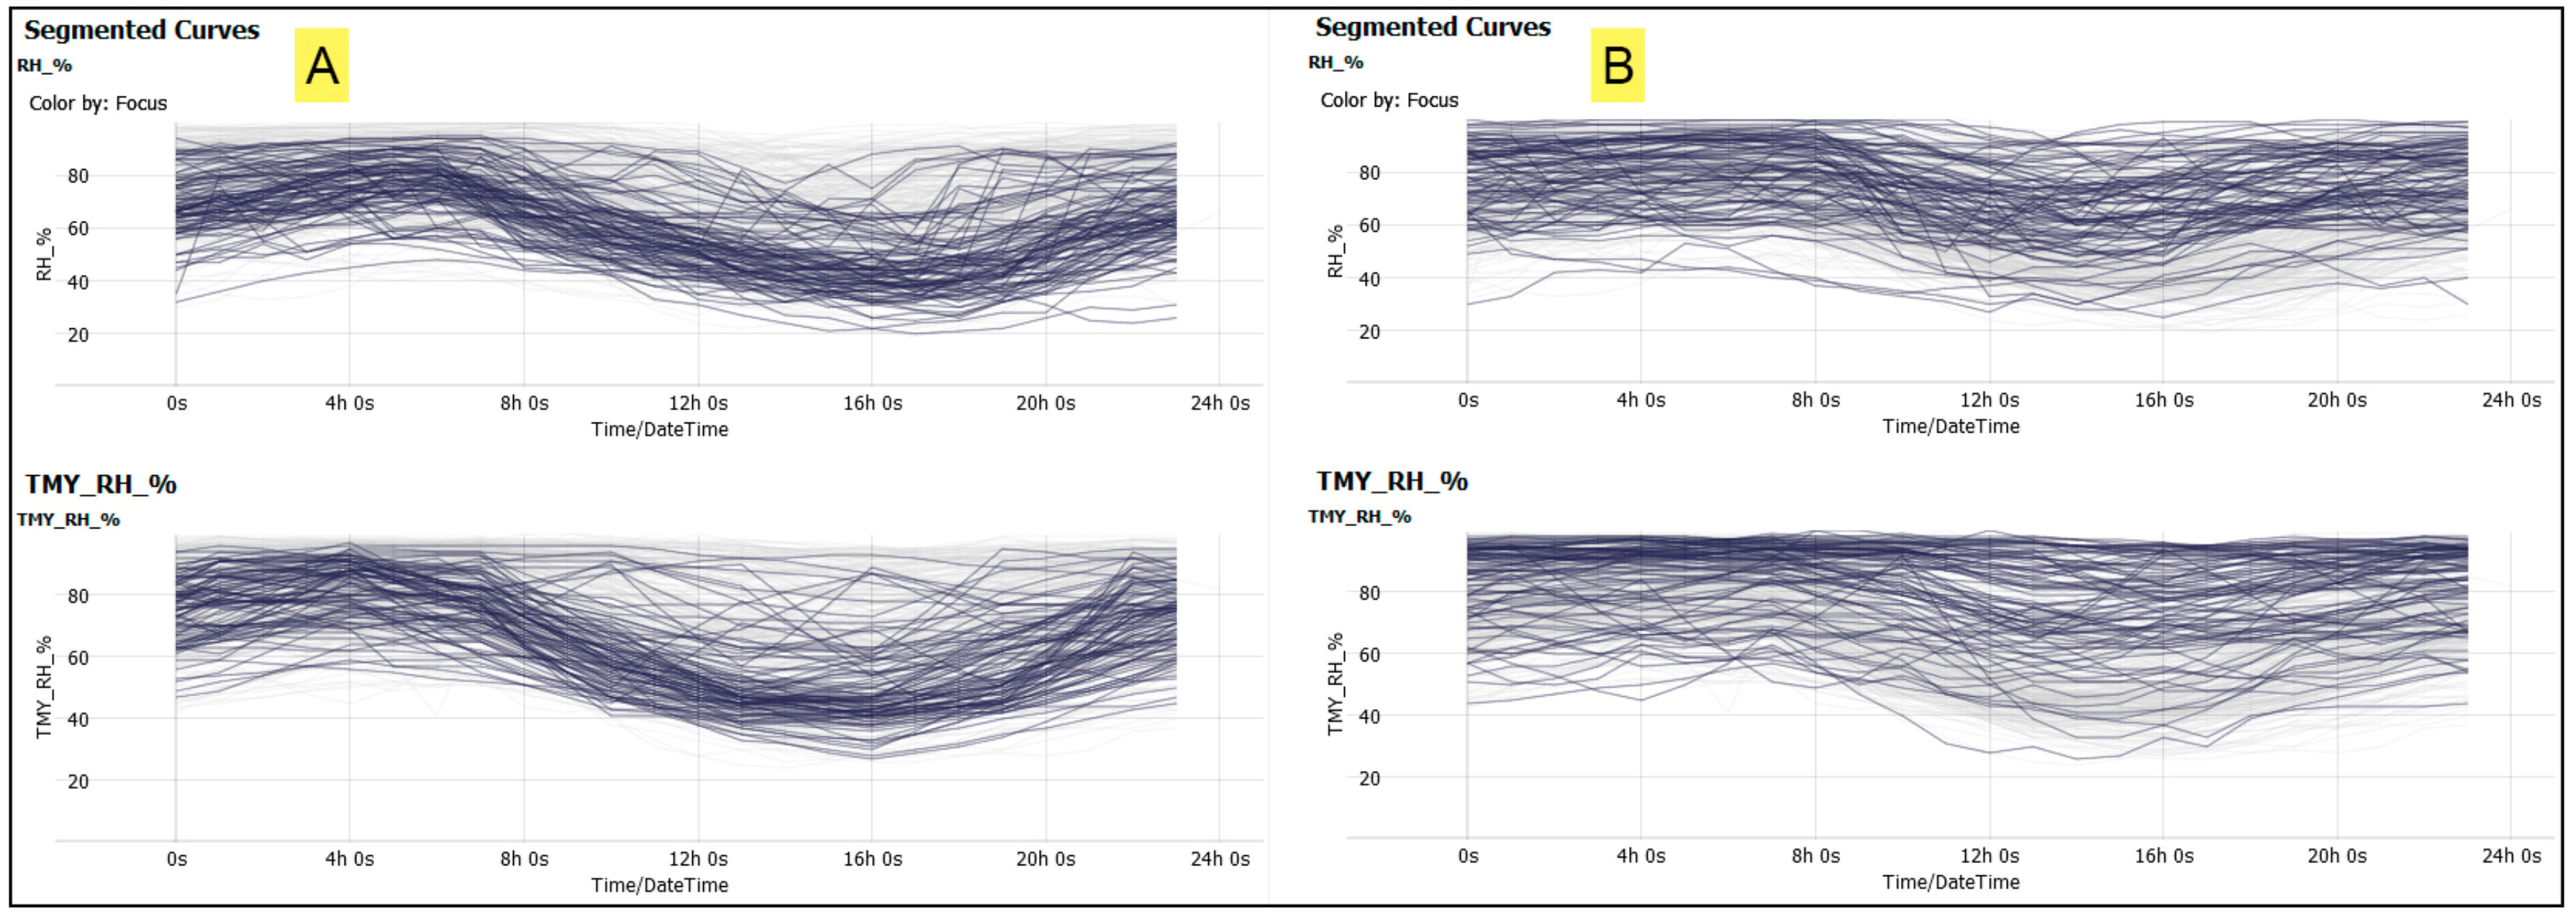
As mentioned before, to carry out the seasonal analysis, we used time-based filters representative of meteorological seasons. For the purpose of present contribution, we will only discuss the relevant findings from summer and winter seasons, as the periods of the most distinct variations of received solar energy driving the resulting global thermal gradients. In this regard, Visplore system is equipped with an analysis module that uses a segmentation algorithm to isolate temporal fragments of the time-series data. We focused on the diurnal segmentation, whereby all segmented curves of selected time series are superimposed over each other. Figure 9 and Figure 10 illustrate the resulting representations for TMY and API-derived time series for the summer and winter period, respectively. In general, major seasonal discrepancies between both datasets may be observed. Specifically, the TMY dataset consistently displayed lower summertime daily maximum and minimum temperature values (Figure 9C). This is further supported by a general clustering tendency of present-day API-derived segmented curves towards higher temperature ranges (Figure 9A). Likewise, the curve shape in present-day time series appears to be flatter than in TMY data, implying smaller daily amplitudes, with generally higher minimum. It can be further observed that the nighttime cooling trend is delayed in API-derived time series. Similar conclusions may be driven from the winter period whereby a general shift towards the lower temperatures is seen in TMY dataset. Looking at the diurnal segmentation of relative humidity and wind-speed data for both summer and winter periods, respectively, depicted in Figure 11 and Figure 12, TMY data are characterized by generally more humid and more turbulent atmospheric events.
This further points to a number of conclusions. Firstly, the effects of climate change seem not to be captured in synthetically generated TMY time series. Secondly, the more frequent phenomenon of tropical nights is equally not depicted in TMY time series. Thirdly, both seasons seem to be on average cooler in the TMY dataset, thus not being representative of more frequent occurrence of extreme weather events, such as, for example, heat waves.
Hot and Cold Events
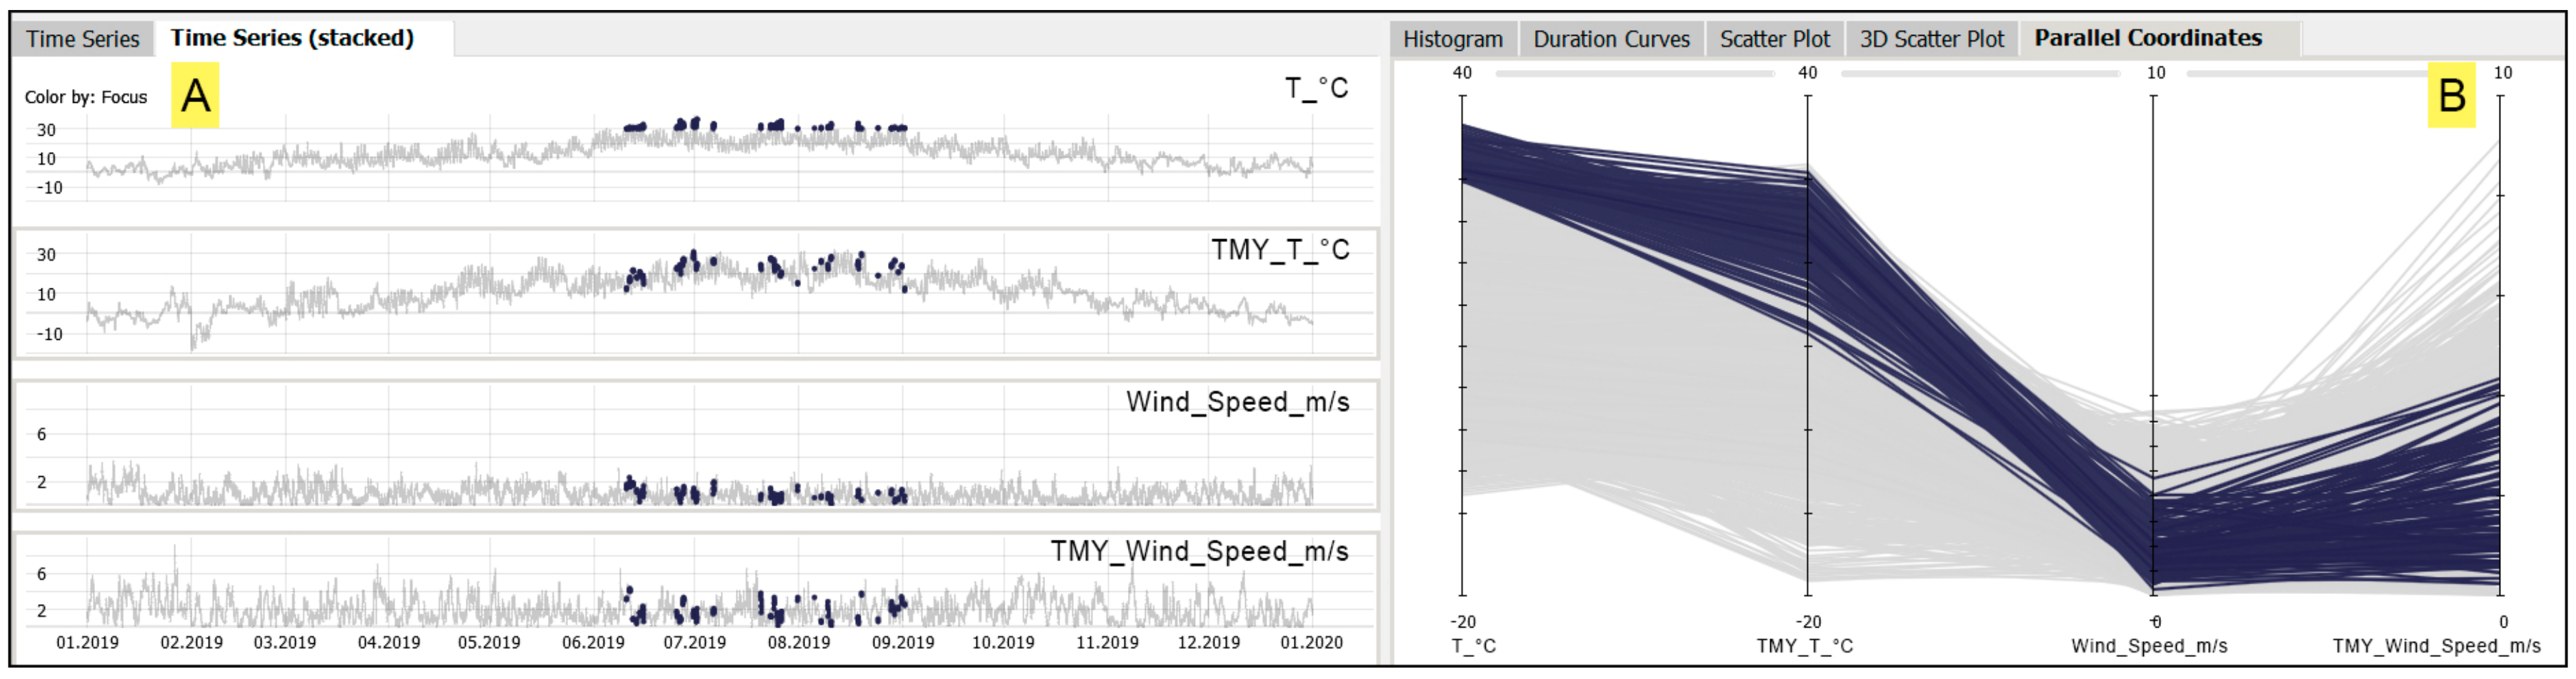
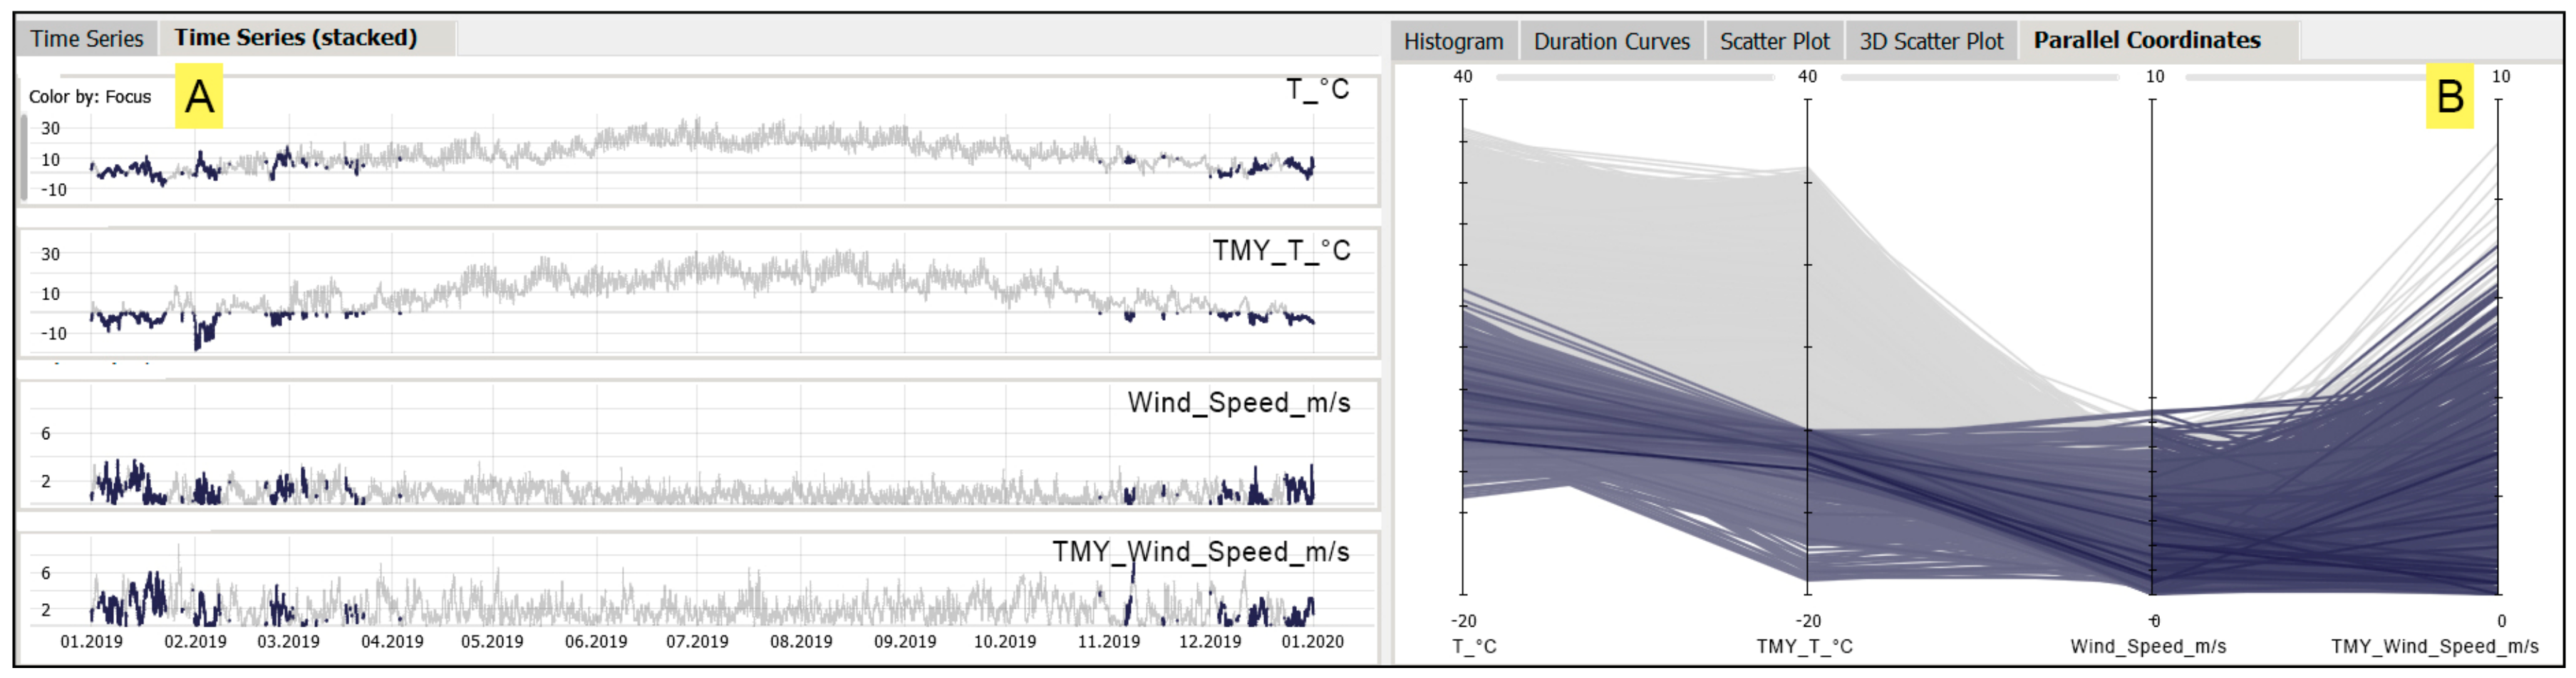
To further investigate these statements, we applied additional filters depicting distinct thresholds used for identifying extreme hot and cold events (30 °C and 0 °C, respectively). The corresponding hot events were observed in respect to the present-day time series to evaluate the extent of deviations in TMY, guided by the notion of consistent underestimation of higher temperatures in TMY time series. In contrast, the corresponding cold events were observed in respect to the TMY to evaluate the extent of deviations from the real observed data, guided by the notion of consistent overestimation of lower temperatures in TMY time series. Furthermore, we looked into the paired instances of temperature and wind-speed data as the key parameters driving fundamental thermal perceptions in humans. Once again, the previously noted periodic inversions of trends and time lags in peak values were clearly identified and mapped using the parallel coordinates plot (Figure 13 and Figure 14). In case of heat-stress periods, for each hot event in present-day time series a much lower temperature incidence in TMY was detected (Figure 13). The same can be said for wind-speed data where for each data point in present-day time series an almost double value was recorded in TMY. In case of cold stress, a more dramatic trend was detected with paired temperatures being up to 16 degrees apart. For instance, for an event in TMY noting a temperature of −17.8 °C, a paired temperature in present-day data stated −1.6 °C. A more critical occurrence was noted in case of wind-speed data where substantially higher values detected in TMY. This further supports the statement of climate change and related effects (e.g., heat waves, tropical nights) not being integrated into the synthetically generated meteorological time series.
5. Supporting Case Study
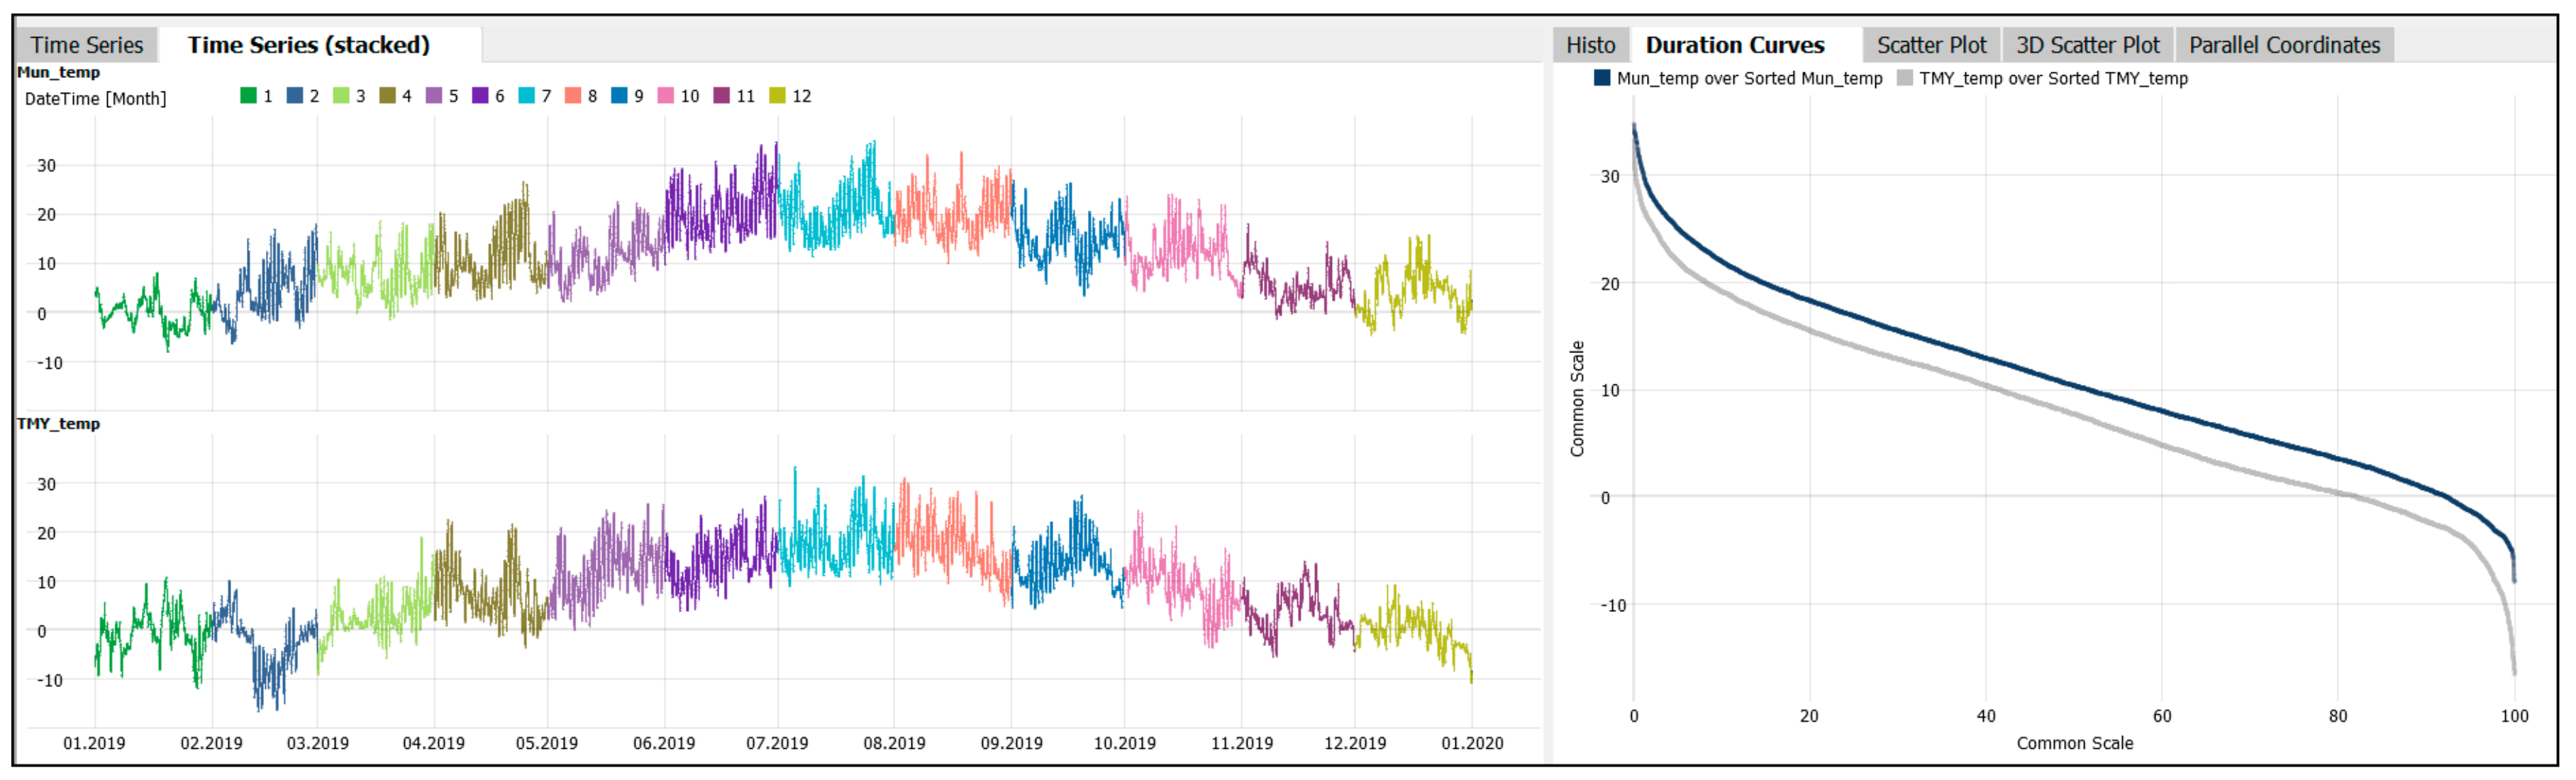
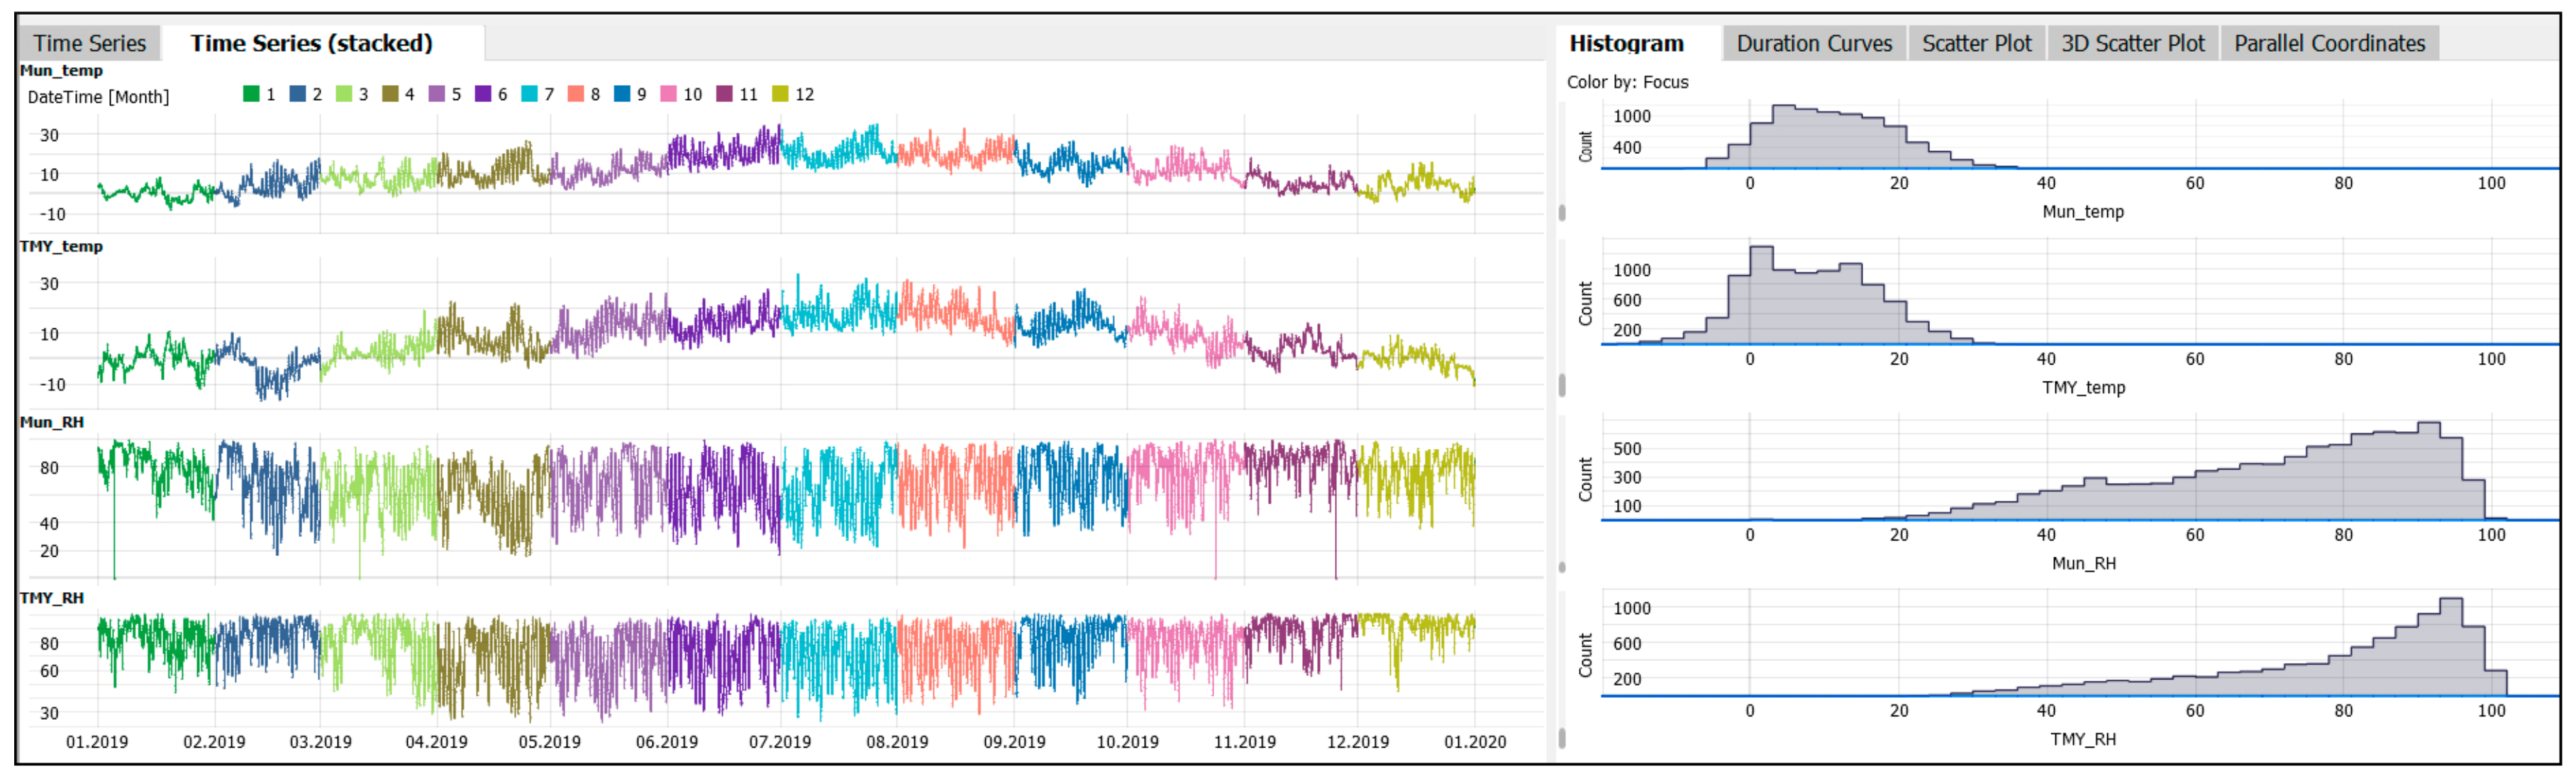
We have also conducted a number of supporting case studies for validation purposes, and we will briefly inform on the resulting findings representative of a Munich area, Germany. Figure 15, Figure 16 and Figure 17 show the temporal distribution and cumulative frequency distribution of investigated air temperature, relative humidity and wind speed time-series data from respective TMY and present-day datasets (depicting year 2019). The present-day data were acquired from German Meteorological Service (DWD) open data portal [5]. The TMY data relate to the same IWEC format and are acquired from the same source as in our original study [6].
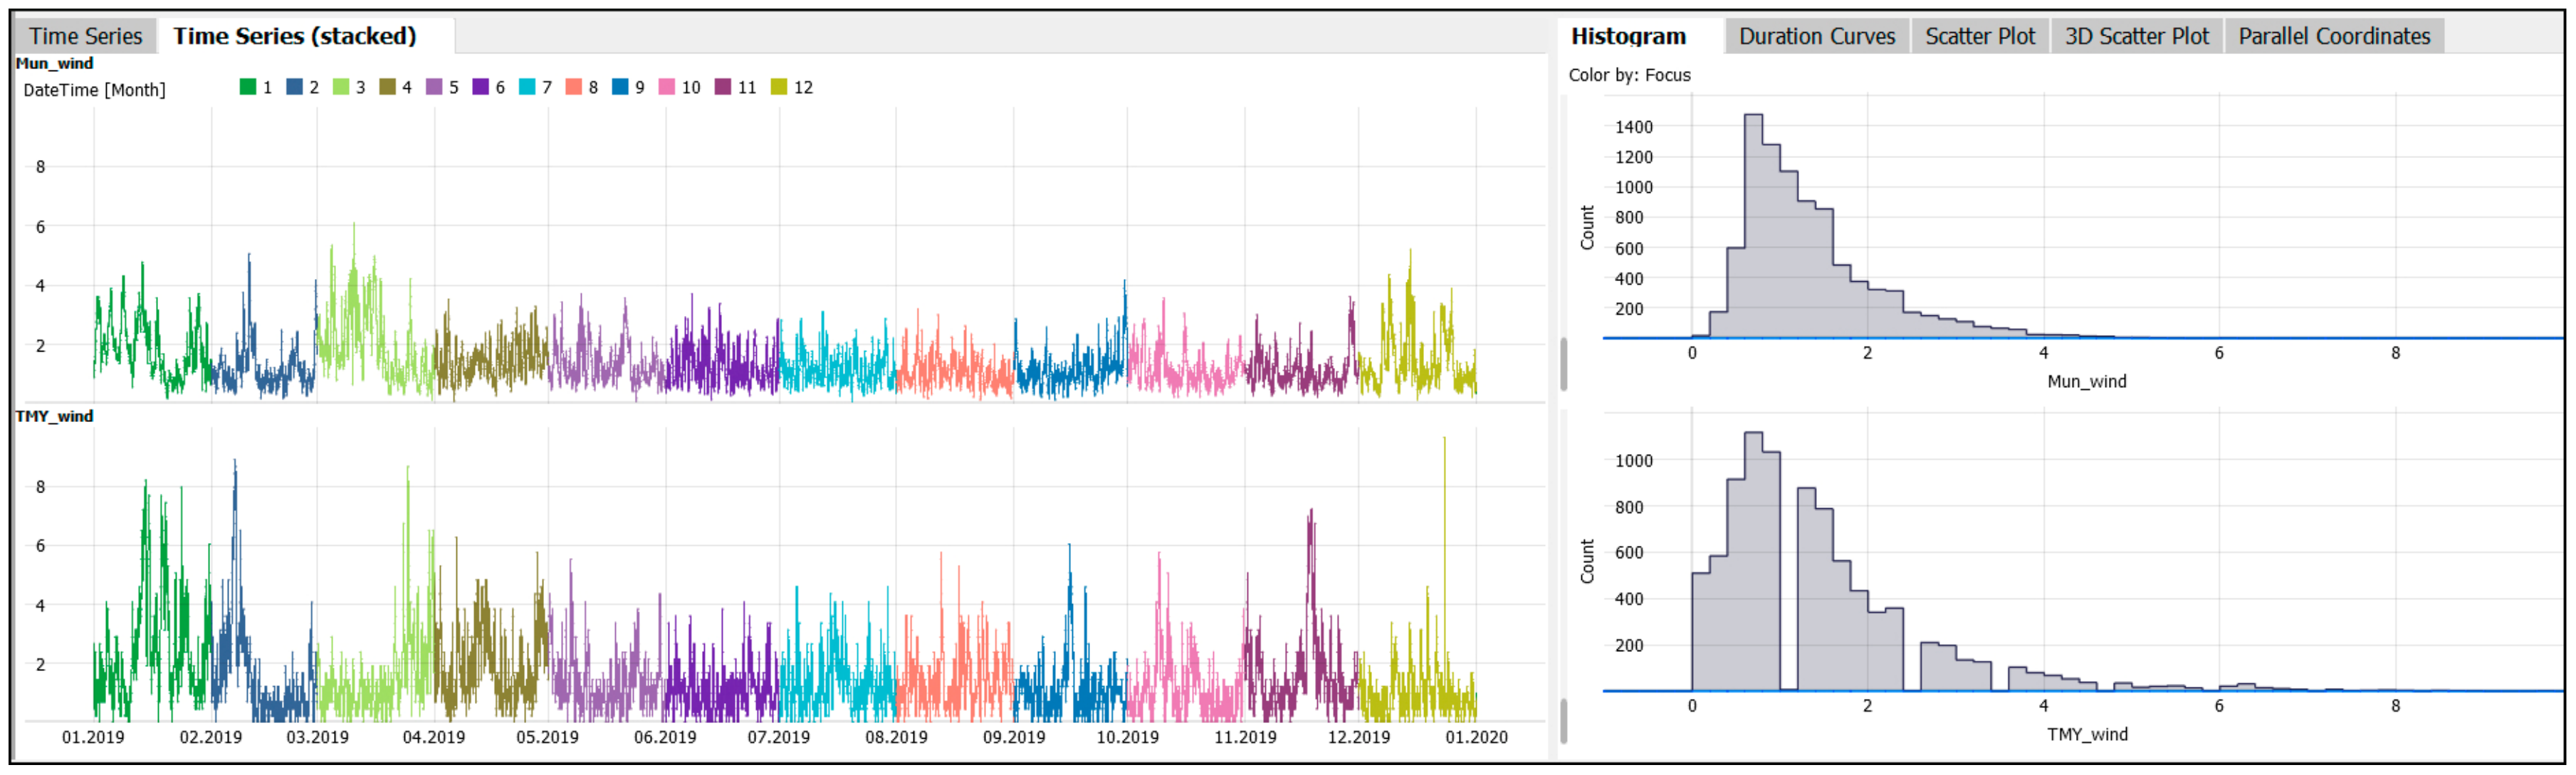
Similar temporal behavior may be observed for Munich, as in the Vienna case study, where the air temperature is consistently being underestimated in TMY, with notable monthly deviations and inversed trends depicted from the present-day curve (Figure 15). The annual maximum temperature is 1.5 °C higher in present-day than in TMY time series, while the annual minimum temperature is 8.6 °C lower in TMY then in present-day time series. Consistent with our previous findings, the amount of data points with lower temperature is notably higher in the TMY dataset than in the present-day dataset, implying colder winters, which may lead to potentially erroneous estimation of heating loads in thermal building performance calculations. The same can be said for relative humidity values (Figure 16), where TMY time series reveals more humid conditions than in real conditions. Looking at the wind-speed data (Figure 17), a notable skewness to the right in the TMY data denotes much higher values than recorded in the present-day dataset. Additionally, a higher percentage of calm (wind speed less than 0.5 m/s) and still days (with no wind) is present in TMY compared to the present-day dataset. As mentioned before, this is consistent with our previous findings, which further validates the observations and conclusions given in this contribution, while stressing the need for further improvements.
6. Future Development Prospects
The advantages and applications outlined in this paper are not only meant to advocate for novel approaches in climate research, but to also highlight the potential challenges and limitations of VA systems identified through the Visplore use case. We are, of course, fully aware that evaluation of only one VA system, such as Visplore, cannot be representative of the whole population of tools. However, based on past research conducted in the field [11,15], it can be said that an all-embracing VA system that offers a full spectrum of functionalities (from data preparation to feature engineering, visualization, and reporting) has yet to be developed.
We could see that Visplore was performing quite well when handling well-structured data. However, the noted lack of data wrangling functionality may intensify the step related to the preprocessing of raw data into usable formats. This is especially true when this step requires a number of tedious and iterative processes on large datasets that are essentially time consuming and often error prone. To compensate for this deficiency, the majority of VA systems nowadays, along with Visplore, are being enriched with a number of secondary software bridges to various specialized commercial or open-source software (e.g., Python, R, Matlab). However, these connections may at times be quite programmatically intensive and not fitting for users without advanced programming skills. Likewise, the concurrent integration of diverse (heterogeneous) data formats would be a great benefit, considering that often data comes from different sources and may be even provided in non-standard formats. Additionally, the consideration and handling of geospatial data, which is currently not supported in Visplore, would lead to more robust environmental applications. Finally, a reporting functionality would allow Visplore to gain more control over how the results are communicated to a broader audience.
7. Conclusions
In the current contribution, we illustrated the application potential of a visual analytics approach towards a comprehensive analysis of high-resolution meteorological time series. The study focused on two distinct meteorological datasets: one synthetically generated from long-term historic records (TMY) and the other representative of present-day ground observations (API-derived), processed with a visual analytics tool called Visplore. In general, our aim was twofold. Firstly, to synthesize the overall benefits of using a VA system over a traditional descriptive data statistics. Toward this end, we have outlined those functionalities in Visplore that may be essential in the detection of multifaceted and often hidden events, patterns, and behaviors in data under investigation. Secondly, to carry out a quality assessment of the TMY dataset in respect to the real observations towards the detection of any temporal discrepancies, anomalies, and misalignments in the two datasets.
Our primary goal may be concluded in the following manner: We have shown that a visual analytics approach may be decisive when it comes to synthetizing complex and large datasets into prominent patterns and insights. By expanding the spectrum of commonly deployed and inherently static data-visualization techniques with a balanced integration of interactive visual representations and analytics techniques, scientists are being equipped with powerful computational algorithms and environments able to surpass traditional methods of sense-making towards a deeper understanding of the underlying information. This was further exemplified in the specific-use case involving meteorological time series where we have shown that the Visplore tool indeed proved to be vital in inferring new knowledge. We were able to gain insights that could not be otherwise reached using traditional methods.
In the following, we elaborate on how we have reached our second goal: We identified a number of anomalies and inconsistences in synthetically generated dataset, which were further detected on different levels of granularity (annual, seasonal, diurnal). These can be concluded in the following manner: TMY dataset consistently underestimated temperature values, with summer and winter periods being on average substantially cooler. Observed on the annual level, periods of higher temperatures appear to be longer in the API-derived dataset compared to the TMY, implying longer duration of heat events. TMY-derived seasons also showed higher levels of humidity values, with equally higher wind velocities implying more turbulent atmospheric events. Furthermore, we identified a myriad of instances where inversed trends and inconsistencies in peak values were observed, with API-derived values being predominantly higher, pointing to the poor reproducibility of the annual meteorological cycle in TMY. Lastly, the paired analysis of temperature and wind-speed data further supported our conclusion regarding climate change and related effects (e.g., heat waves, tropical nights) not being depicted in referenced TMY time series.
Given these facts, it may be said that the suitability of such synthetically generated meteorological time series to support thermal performance and environmental assessments is a rather debatable issue. The application of such files may lead to poor estimation of the resulting energy consumptions, emissions, and the overall environmental impact. It should be noted, however, that a number of TMY datasets currently in circulation were recently restructured to reflect the more contemporary meteorological conditions. Nevertheless, a majority of available files are still significantly outdated, especially in developing countries that face many environmental challenges, which calls for urgency towards further improvements.
Author Contributions
Conceptualization, M.V. and J.S.; methodology, M.V. and J.S.; validation, M.V.; formal analysis, M.V.; investigation, M.V.; resources, M.V.; data curation, M.V.; writing—original draft preparation, M.V.; writing—review and editing, J.S.; visualization, M.V.; supervision, J.S. All authors have read and agreed to the published version of the manuscript.
Funding
This research received no external funding.
Acknowledgments
VRVis is funded by BMK, BMDW, Styria, SFG (Steirische Wirtschaftsförderungs-gesellschaft m.b.H. SFG) and Vienna Business Agency in the scope of COMET—Competence Centers for Excellent Technologies (854174), which is managed by FFG (Österreichische Forschungsförderungsgesellschaft).
Conflicts of Interest
Our intention was not to advertise the Visplore tool, rather it was only deployed in a capacity of a visual analytics solution that assisted us in our study. Visplore software is used as the basis for basic research projects in applied industrial research at the VRVis Zentrum für Virtual Reality und Visualisierung Forschungs-GmbH (VRVis). Together with the VRVis, Visplore can be employed as a data analytics tool in collaborative joint research projects. As such, Visplore stands as a prime example for an interactive visual analytics solutions for time-oriented data. Visplore is an interactive tool for the interactive analysis of large amounts of data, which offers the possibility for providing customized applications. The software has been developed at the VRVis Zentrum für Virtual Reality und Visualisierung Forschungs-GmbH over the last decade in research work together with renowned company partners. More than 25 scientific papers about the analytical possibilities of Visplore have been published, and several of these publications received awards. To continue the successful application of visual analytics in industrial applications, Visplore is further developed in a spin-off company. The Visplore GmbH founded in July 2020 is responsible for the distribution of the standard software packages. Authors further declare that they have no affiliation with or involvement in the company Visplore GmbH, nor any financial, business, or personal interests, such as honoraria, educational grants, consultancies, stock ownership, or patent-licensing arrangements, regarding the software discussed in this manuscript.
References
- Obama, B. Open Government Directive. 2009. Available online: https://obamawhitehouse.archives.gov/sites/default/files/omb/assets/memoranda_2010/m10-06.pdf (accessed on 14 July 2020).
- Zuiderwijk, A.; Janssen, M. Open data policies, their implementation and impact: A framework for comparison. Gov. Inf. Q. 2014, 31, 17–29. [Google Scholar] [CrossRef] [Green Version]
- NOAA. Available online: https://www.ncdc.noaa.gov/cdo-web/ (accessed on 14 July 2020).
- Open Data Austria. Available online: https://www.data.gv.at/ (accessed on 14 July 2020).
- DWD, Deutscher Wetterdienst. Available online: https://www.dwd.de/DE/leistungen/opendata/opendata.html (accessed on 14 July 2020).
- TMY, EnergyPlus. Available online: https://energyplus.net/weather/sources (accessed on 14 July 2020).
- ISO 15927-4:2005. Available online: https://www.iso.org/standard/41371.html (accessed on 1 September 2020).
- Hensen, J.L.M. Simulation of building energy and indoor environmental quality—Some weather data issues. In Proceedings of the International Workshop on Climate Data and Their Applications in Engineering, Prague, Czech Republic, 4–6 October 1999. [Google Scholar]
- Vuckovic, M.; Hammerberg, K.; Mahdavi, A. Urban weather modeling applications: A Vienna case study. Build. Simul. 2020, 13, 99–111. [Google Scholar] [CrossRef] [Green Version]
- Vuckovic, M.; Kiesel, K.; Mahdavi, A. The extent and implications of the microclimatic conditions in the urban environment: A Vienna case study. Sustainability 2017, 9, 177. [Google Scholar] [CrossRef] [Green Version]
- Schmidt, J. Usage of visualization techniques in data science workflows. In Proceedings of the 15th International Joint Conference on Computer Vision, Imaging and Computer Graphics Theory and Applications, Valletta, Malta, 27–29 February 2020; Volume 3, pp. 309–316, ISBN 978-989-758-402-2. [Google Scholar] [CrossRef]
- Tableau. Available online: https://www.tableau.com/ (accessed on 14 July 2020).
- QlikView. Available online: http://www.qlik.com/ (accessed on 14 July 2020).
- MS Power BI. Available online: https://powerbi.microsoft.com/ (accessed on 14 July 2020).
- Behrisch, M.; Streeb, D.; Stoffel, F.; Seebacher, D.; Matejek, B.; Weber, S.H.; Mittelstädt, S.; Pfister, H.; Keim, D. Commercial visual analytics systems–Advances in the big data analytics field. IEEE Trans. Vis. Comput. Graph. 2019, 25, 3011–3031. [Google Scholar] [CrossRef] [PubMed] [Green Version]
- Visplore. Available online: http://www.visplore.com/ (accessed on 14 July 2020).
- Piringer, H.; Tominski, C.; Muigg, P.; Berger, W. A multi-threading architecture to support interactive visual exploration. IEEE Trans. Vis. Comput. Graph. 2009, 15, 1113–1120. [Google Scholar] [CrossRef] [PubMed]
- EnergyPlus. Available online: https://energyplus.net/ (accessed on 14 July 2020).
- TMY Vienna. Available online: https://energyplus.net/weather-location/europe_wmo_region_6/AUT//AUT_Vienna.Schwechat.110360_IWEC/all (accessed on 14 July 2020).
- ASHRAE. International Weather for Energy Calculations (IWEC Weather Files) Users Manual and CD-ROM; ASHRAE: Atlanta, GA, USA, 2001. [Google Scholar]
- ZAMG. Available online: https://www.zamg.ac.at/ (accessed on 14 July 2020).
- CC BY 3.0 AT. Available online: https://creativecommons.org/licenses/by/3.0/at/deed.en (accessed on 14 July 2020).
- Open Data Austria, ZAMG. Available online: https://www.data.gv.at/katalog/dataset/zamg_meteorologischemessdatenderzamg (accessed on 14 July 2020).
- AT-Wetter. Available online: http://at-wetter.tk/ (accessed on 14 July 2020).
- API Vienna. Available online: http://at-wetter.tk/api/v1/station/11035/t/2019-12-31/364 (accessed on 14 July 2020).
- Kandel, S.; Paepcke, A.; Hellerstein, J.M.; Heer, J. Enterprise data analysis and visualization: An interview study. IEEE Trans. Vis. Comput. Graph. 2012, 18, 2917–2926. [Google Scholar] [CrossRef] [PubMed] [Green Version]
- R. Available online: https://cran.r-project.org/ (accessed on 14 July 2020).
- RStudio. Available online: https://rstudio.com/ (accessed on 14 July 2020).
- Zare, S.; Hasheminejad, N.; Shirvan, H.E.; Hemmatjo, R.; Sarebanzadeh, K.; Ahmadi, S. Comparing Universal Thermal Climate Index (UTCI) with selected thermal indices/environmental parameters during 12 months of the year. Weather Clim. Extrem. 2018, 19, 49–57. [Google Scholar] [CrossRef]
- Haynes, W. Tukey’s test. In Encyclopedia of Systems Biology; Dubitzky, W., Wolkenhauer, O., Cho, K.H., Yokota, H., Eds.; Springer: New York, NY, USA, 2013. [Google Scholar]
- Kaufmann, H.; Tran, H.V.; Orlik, A.; Pokorny, S. Windzonierungskarte für Kleinwindkraftanlagen für Wien; 2015. Report; Zentralanstalt für Meteorologie und Geodynamik (ZAMG): Vienna, Austria, 2015. [Google Scholar]
- Müller, M. Dynamic time warping. In Information Retrieval for Music and Motion; Springer: Berlin/Heidelberg, Germany, 2007. [Google Scholar]
Figure 1.
The overview of the native functionalities in Visplore tool: (A) diverse analytics modules accessible through the analysis cockpits, (B) data import overview window.
Figure 1.
The overview of the native functionalities in Visplore tool: (A) diverse analytics modules accessible through the analysis cockpits, (B) data import overview window.

Figure 2.
Selected features of the structure analysis cockpit: (A) data overview; (B) line plots, highlighted missing values (in red) and time-based filters; (C) frequency distribution; (D) drill down metrics.
Figure 2.
Selected features of the structure analysis cockpit: (A) data overview; (B) line plots, highlighted missing values (in red) and time-based filters; (C) frequency distribution; (D) drill down metrics.

Figure 3.
Anomaly and completeness monitor: (A) an instant overview of detected instances that are considered to be an anomaly (in this case outliers), (B) also mapped in purple color in the line plot (illustrated for temperature time series), and (C) over months (for all parameters).
Figure 3.
Anomaly and completeness monitor: (A) an instant overview of detected instances that are considered to be an anomaly (in this case outliers), (B) also mapped in purple color in the line plot (illustrated for temperature time series), and (C) over months (for all parameters).

Figure 4.
Temporal distribution of temperature time series denoted by diverse graphical representations: (A) plot graph (TMY data depicted in light grey); (B) cumulative frequency; (C) 2D heatmap.
Figure 4.
Temporal distribution of temperature time series denoted by diverse graphical representations: (A) plot graph (TMY data depicted in light grey); (B) cumulative frequency; (C) 2D heatmap.

Figure 5.
Temporal distribution of relative humidity and wind speed time series denoted by: (A) line plot; (B) frequency distribution.
Figure 5.
Temporal distribution of relative humidity and wind speed time series denoted by: (A) line plot; (B) frequency distribution.

Figure 6.
Temporal distribution of wind direction time series denoted by: (A) line plot; (B) frequency distribution.
Figure 6.
Temporal distribution of wind direction time series denoted by: (A) line plot; (B) frequency distribution.

Figure 7.
Anomalous pattern search analysis: identification of dramatic inversions in temperature time series.
Figure 7.
Anomalous pattern search analysis: identification of dramatic inversions in temperature time series.

Figure 8.
Anomalous pattern search analysis: identification of general inversions in temperature time series.
Figure 8.
Anomalous pattern search analysis: identification of general inversions in temperature time series.

Figure 9.
Pattern search and comparison representative of summer period: (A) diurnal summertime temperature distribution; (B) temporal distribution of time series; (C) tabular overview of statistical metrics.
Figure 9.
Pattern search and comparison representative of summer period: (A) diurnal summertime temperature distribution; (B) temporal distribution of time series; (C) tabular overview of statistical metrics.

Figure 10.
Pattern search and comparison representative of winter period: (A) diurnal summertime temperature distribution; (B) temporal distribution of time series; (C) tabular overview of statistical metrics.
Figure 10.
Pattern search and comparison representative of winter period: (A) diurnal summertime temperature distribution; (B) temporal distribution of time series; (C) tabular overview of statistical metrics.

Figure 11.
Diurnal segmentation of relative humidity time series: (A) summertime; (B) wintertime.

Figure 12.
Diurnal segmentation of wind speed time series: (A) summertime; (B) wintertime.

Figure 13.
Heat-stress detection based on the applied threshold of 30 °C to the present-day time series: (A) time series; (B) parallel coordinates.
Figure 13.
Heat-stress detection based on the applied threshold of 30 °C to the present-day time series: (A) time series; (B) parallel coordinates.

Figure 14.
Cold-stress detection based on applied threshold of 0 °C to the TMY time series: (A) time series; (B) parallel coordinates.
Figure 14.
Cold-stress detection based on applied threshold of 0 °C to the TMY time series: (A) time series; (B) parallel coordinates.

Figure 15.
Temporal distribution and cumulative frequency distribution of air temperature for Munich TMY and present-day time-series data.
Figure 15.
Temporal distribution and cumulative frequency distribution of air temperature for Munich TMY and present-day time-series data.

Figure 16.
Temporal distribution and frequency distribution of air temperature and relative humidity for Munich TMY and present-day time-series data.
Figure 16.
Temporal distribution and frequency distribution of air temperature and relative humidity for Munich TMY and present-day time-series data.

Figure 17.
Temporal distribution and frequency distribution of wind speed for Munich TMY and present-day time-series data.
Figure 17.
Temporal distribution and frequency distribution of wind speed for Munich TMY and present-day time-series data.


Table 1.
Overview of computed metrics across evaluated time series (T—temperature, RH—relative humidity, WS—wind speed, WD—wind direction).
Table 1.
Overview of computed metrics across evaluated time series (T—temperature, RH—relative humidity, WS—wind speed, WD—wind direction).
| Data Attribute | Missing [%] | Min. | Max. | Mean | Standard Deviation | Coeff. of Variation | |
|---|---|---|---|---|---|---|---|
| API 1 | T | 0.05 | −8.0 | 36.6 | 12.5 | 8.38 | 0.67 |
| RH | 0.05 | 19 | 100 | 69 | 17.2 | 0.25 | |
| WS | 0.05 | 0 | 3.72 | 0.96 | 0.61 | 0.63 | |
| WD | 54 | 0 | 360 | - | 102.25 | 0.48 | |
| TMY 2 | T | 0.05 | −18.3 | 31.7 | 9.9 | 8.76 | 0.88 |
| RH | 0.05 | 24 | 100 | 72 | 16.94 | 0.24 | |
| WS | 0.05 | 0 | 9.13 | 1.97 | 1.28 | 0.65 | |
| WD | 0.05 | 0 | 360 | - | 97.93 | 0.47 | |
1 API-derived present-day meteorological time-series; 2 Typical meteorological year (TMY).
© 2020 by the authors. Licensee MDPI, Basel, Switzerland. This article is an open access article distributed under the terms and conditions of the Creative Commons Attribution (CC BY) license (http://creativecommons.org/licenses/by/4.0/).
Share and Cite
MDPI and ACS Style
Vuckovic, M.; Schmidt, J. Visual Analytics Approach to Comprehensive Meteorological Time-Series Analysis. Data 2020, 5, 94. https://0-doi-org.brum.beds.ac.uk/10.3390/data5040094
AMA Style
Vuckovic M, Schmidt J. Visual Analytics Approach to Comprehensive Meteorological Time-Series Analysis. Data. 2020; 5(4):94. https://0-doi-org.brum.beds.ac.uk/10.3390/data5040094
Chicago/Turabian StyleVuckovic, Milena, and Johanna Schmidt. 2020. "Visual Analytics Approach to Comprehensive Meteorological Time-Series Analysis" Data 5, no. 4: 94. https://0-doi-org.brum.beds.ac.uk/10.3390/data5040094