OFCOD: On the Fly Clustering Based Outlier Detection Framework †


1
Computer Engineering Department, Prince Sattam Bin Abdulaziz University, Al-Kharj 16278, Saudi Arabia
2
Computers and Control Engineering Department, Faculty of Engineering, Tanta University, Tanta 31733, Egypt
*
Author to whom correspondence should be addressed.
†
This paper is an extended version of A hybrid outlier detection algorithm based on partitioning clustering and density measures, Published in: 2015 Tenth International Conference on Computer Engineering & Systems (ICCES), 23–24 December 2015.
‡
These authors contributed equally to this work.
Data 2021, 6(1), 1; https://0-doi-org.brum.beds.ac.uk/10.3390/data6010001
Submission received: 31 October 2020
/
Revised: 23 December 2020
/
Accepted: 24 December 2020
/
Published: 30 December 2020
(This article belongs to the Section Information Systems and Data Management)
Abstract
:In data mining, outlier detection is a major challenge as it has an important role in many applications such as medical data, image processing, fraud detection, intrusion detection, and so forth. An extensive variety of clustering based approaches have been developed to detect outliers. However they are by nature time consuming which restrict their utilization with real-time applications. Furthermore, outlier detection requests are handled one at a time, which means that each request is initiated individually with a particular set of parameters. In this paper, the first clustering based outlier detection framework, (On the Fly Clustering Based Outlier Detection (OFCOD)) is presented. OFCOD enables analysts to effectively find out outliers on time with request even within huge datasets. The proposed framework has been tested and evaluated using two real world datasets with different features and applications; one with 699 records, and another with five millions records. The experimental results show that the performance of the proposed framework outperforms other existing approaches while considering several evaluation metrics.
1. Introduction
An outlier is a data point that differs significantly from the other points in the dataset [1]. Outliers affect the performance of data analysis algorithms and lead up to misleading results [2]. Thus, detecting outliers becomes an important step in data analysis and data mining. Outlier detection algorithms detect rare or abnormal behavior that can be considered important than normal behavior in many applications such as cancer diagnosis, product defects detection, fraud credit card transactions and hacking network traffic data. Outlier detection algorithms are also used as a preprocessing step for the data mining algorithms to filter datasets from outliers [3].
Outlier detection algorithms have extensively been tackled in the past fifteen years. Many algorithms with different approaches have been introduced in the literature [4,5,6,7,8,9,10,11] which can be, in general, categorized into [12,13,14]: statistical-based [15,16], distance-based [17,18], density-based [19,20] and clustering-based methods [9,21,22,23]. Statistical-based approaches aim at finding the probability distribution/model of the underlying normal data and define outliers as those points that do not conform to that model. However, a single distribution may not model the entire data that may originate from multiple unknown distributions limiting the practical adoption of such approaches especially in high dimensional data. Distance-based approaches define outliers as the points that are located far away from the majority points using any distance metric like Manhattan distance or Euclidean distance metrics. These approaches fail when the data points have different spatial densities (sparsity) and thus defining an outlierness distance is not practically feasible [24,25,26]. To combat this issue, Density-based approaches are proposed to investigate not only the local density of the point in question but also the local densities of its nearest neighbors. Density-based approaches feature a stronger modeling capability of outliers but require more expensive computation at the same time.
Clustering techniques, on the other hand, aim at finding patterns characterizing the underlying data then organize the data accordingly into normal clusters (the majority) and outliers deviating from them. In particular, clustering-based approaches can be considered as an unsupervised anomaly detection techniques which receive a great deal of attention because they can construct detection models without using labeled training data. This advantage boosts their applicability in real environments since labeled data or purely normal data cannot be readily obtained in practice. This motivates us to leverage clustering techniques in the outlier detection problem.
Nevertheless, the main challenge of the clustering-based outlier detection approaches is to get rid of the strong tie between using the outlier detection as a preprocessing step for clustering outlier-free data and the dependency of outlier detection on clustering which may be considered a deadlock problem. Additionally clustering algorithms require a large number of distance calculations which have negative impact on the scalability of the algorithm, in both time and memory [27,28]. Unlike density-based approaches, clustering-based approaches do not include a measure for the outlierness degree [29] for data points which is an essential demand in some applications. Majority of the outlier detection approaches are considered One-At-A-Time query approaches that require to re-run the algorithm from scratch for every one-time query in order to identify the outlier points in query [5]. One-At-A-Time query approach is a time-consuming process which is clearly infeasible in real-time systems that require in-time response such as fraud credit card detector and hacking network traffic identifier.
To solve the above-mentioned challenges, an OFCOD: On-the-Fly Clustering-based Outlier Detection framework is proposed in this paper. OFCOD is a hybrid outlier detection framework which mixes clustering with a density-based approach in a novel way. The combination of clustering techniques and density measures yields a significant improvement as it enjoys the advantages of each individual method. Specifically, the proposed algorithm consists of two stages; an offline stage and an online stage. In the offline stage, OFCOD employs the K-Medoids clustering algorithm [30,31]. A proposed enhancement is presented to reduce the distance calculations performed by K-Medoids to avoid repeated/redundant distance calculations and optimize the utilization of the computer memory. Thereafter, normal clusters and outlier clusters are identified based on multiple criteria and a density-based outlierness factor is only calculated for probable outlier points leading to a severe reduction in the computational cost. This paper extends our earlier work in Reference [23]. Specifically, The cluster representative points and the detected outliers can be then leveraged to classify novel instances in the online phase. Therefore, unlike Reference [23] or the baseline approaches, OFCOD is capable of detecting outliers on-the-fly at run time without re-running the whole process from scratch enabling its adoption in real-time applications. Finally, OFCOD provides a unique feature which enables the constructed clusters in the offline phase to be updated at run time by adjusting the clusters’ representative points upon new instances (queries).
Evaluation of OFCOD is done on two realistic datasets (of two different applications): Wisconsin Breast Cancer (WBC) dataset and KDD’99 dataset. The former contains 699 diagnostic data points dedicated for identifying breast cancer and the latter contains five millions network connection instances used to build intrusion detection systems. Our results show that OFCOD outperforms the baseline approaches on both datasets. Specifically, OFCOD provides high true positive rate (at least 99.39%) without compromising on the false positive rates.
2. Proposed Framework
The proposed framework aims to overcome the limitations of the traditional outlier detection methods that require the algorithm to run each time from scratch to determine if the new entered data point is an outlier or normal. This is achieved by introducing a whole vision of the problem starting from the traditional offline detection to the required components needed to classify whether the new point is an outlier or not.
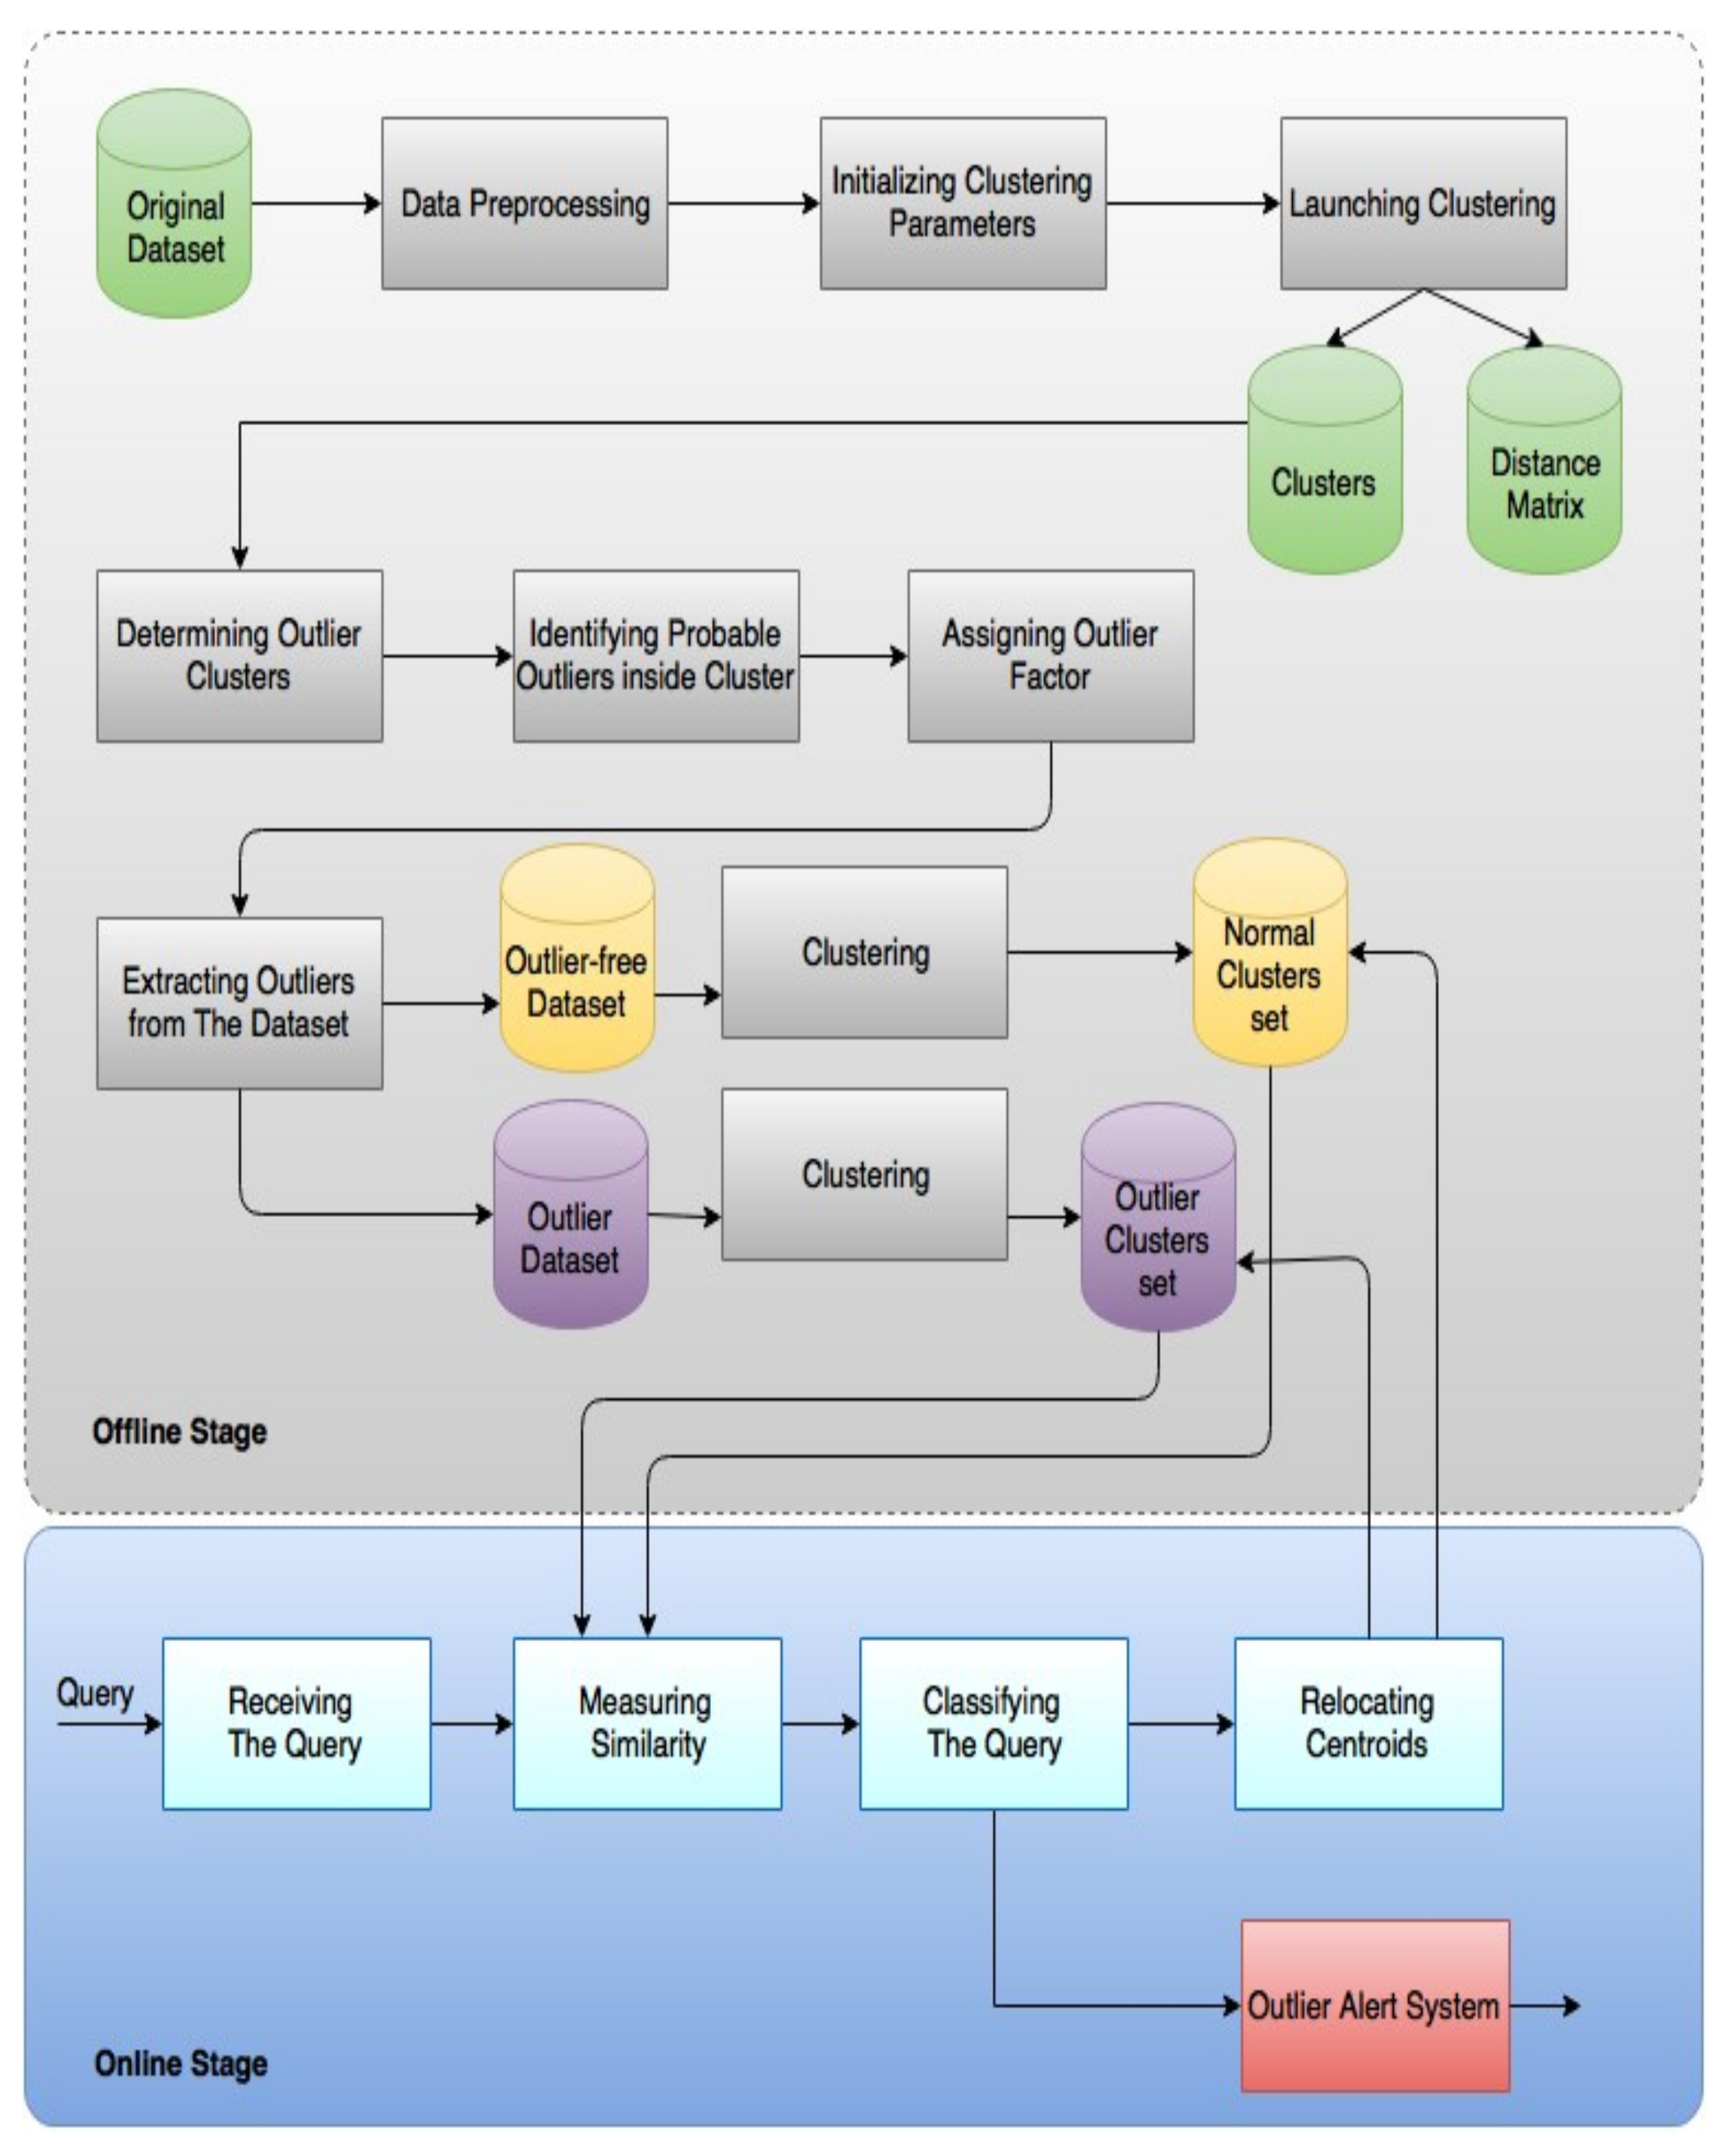
The proposed framework shown in Figure 1 is divided into two stages: offline stage and online stage. The offline stage is used to perform clustering on preliminary data, while the online stage is used to answer any real-time outlier requests. The details of each component are discussed in this section.
2.1. The Offline Stage
The offline stage is responsible for partitioning the data set into clusters, which can be considered as abstracts of the data. Once the clusters are identified, a single computational step is needed to specify the cluster of each new object. A variety of K-Means clustering methods have been proposed for outlier detection [9,29]. K-Means is a well-known algorithm, simple in implementation, and computationally fast even with large data sets. Nevertheless, it suffers from high sensitivity to outliers. This is because outliers are always far away from the majority of data. This leads to dramatical distortion of the centroids setting when an outlier is assigned to a cluster. This in turn affects the assignment of other objects to the clusters. In addition, K-Means algorithm is influenced by the negative impact of using the squared-error function of Euclidean distance [32].
On the other hand, K-Medoids clustering algorithm is robust to outliers and noise compared to k-Means algorithm [33] and hence it is being used as a core for the proposed framework. Medoid is the most centrally located point in a cluster. In K-Medoids, medoid is used as a reference point instead of the cluster mean value. K-Medoids is a fast convergence algorithm as it requires less iterations compared to K-Means [33] algorithm.
The offline stage of the proposed framework consists of six main steps: (1) data preprocessing and initializing parameters; (2) launching clustering; (3) finding outlier clusters; (4) identifying probable outliers inside cluster; (5) assigning outlier factor; (6) removing outliers from the data set. These steps are explained in details in this section.
2.1.1. Data Preprocessing and Parameters Initialization
Datasets have various features of different scales. These scales must be unified to avoid deceiving the algorithm by causing bias toward the highest scale features over the other features. Thus, Min-Max normalization is employed to range all the features from min value “0” to max value “1” given as [3]:
where is the normalized value of the feature, is the actual value of the feature, and and are minimum and maximum values for that feature. The and values can be determined from the information of the used dataset which includes the valid range for each feature.
This step also focuses on selecting the best number of clusters K which leads to fast clustering convergence. A variety of trials is applied on the dataset to achieve this purpose. The chosen best K value corresponds to the highest detection rate and lowest false rate of the clustering process. We adopt the approach in Reference [34] that takes a random sample of 10 % of the data set. A preliminary clustering on this sample is performed using the proposed modified K-Medoids algorithm. The resultant K medoids are used as the initial medoids in the proposed framework.
2.1.2. Launching Clustering
Our experiments show that the K-Medoids algorithm suffers from high computational complexity due to the exhaustive repeated distances’ calculations during the algorithm execution. Specifically, among consecutive iterations of the algorithm until convergence, the distances between some set of points in question are calculated repeatedly. In order to reduce repetition in the distance calculations, a simple straightforward algorithm is developed in Reference [34] aiming at avoiding the repeated calculations of the same distance. This is done by constructing the overall distance matrix between all points beforehand. Thereafter during the algorithm execution, any required distance between a pair of points is queried directly from the distance matrix. However, the distance between non-negligible number of points may not be required by the algorithm and considering them while constructing the distance matrix leads to redundant calculations and thus a high computational cost. Despite the K-medoid algorithm has a fast convergence advantage (require minimal number of iterations), the distance calculations of the algorithm in Reference [34] has a complexity of as it depends on the number of points rather than the number of iterations.
Therefore, we propose a modified version of K-Medoids to avoid both the repeated distances’ calculations and the redundant calculations. The distance between each pair of points is calculated once and cached in memory to avoid recalculation. However, caching large amount of distances in the computer memory may lead to a crash of the framework during the run time. Therefore, to tackle this issue, the framework use both the computer memory (fast memory called ) and the computer disk (large storage space called ) to store the calculated distances. The mechanism of leveraging both storage spaces is initiated by cashing the queried distances incrementally in the memory until its utilization exceeds 80% (where the memory is near full case). Then, the framework’s distances are partitioned between both the memory () and the disk (). Any required distance between a pair of points is queried directly from its cached location based on a lookup table. This lookup table enables not only the identification of the location of the required distances but also the management of which distances to keep in the memory space (i.e., ) and which to move to the dedicated disk space (i.e., ). This can be done by recording the query frequency of each distance in the lookup table. Specifically, When partitioning is required (i.e., ) move only the first-in queried distances (with least call frequency) to the in the disk. This modification on the K-Medoids algorithm makes it scalable because the complete distance matrix has a space to be stored in even if there is no memory space for it. Figure 2 shows the flowchart of our modified algorithm.
Finally, the clustering step outputs the set of clusters , the set of medoids for each cluster and semi-completed distance matrix.
2.1.3. Finding Outlier Clusters
This step is responsible for distinguishing outlier clusters from normal clusters. This is done based on two parameters; cluster size and the cluster outlierness factor. In order to do so, we need to define some parameters as follows:
Definition 1 (Average Cluster Size (ACS)). This is used to measure how large a cluster size is. can be given by the following equation:
where is the cardinality of the data set and k is the number of clusters.
Definition 2 (Large Cluster Set (LC)). Is a set of clusters whose size is greater than ACS. This can be described as:
Definition 3 (Small Cluster Set (SC)). Is a set of clusters whose size is less than half ACS. This can be described as:
Since we are mainly concerned of the small clusters which could be outlier clusters, we recommend to expand the gap between the small clusters and the large clusters by neglecting the range between ACS and .
Definition 4 (Cluster Outlierness Factor (COF)). Is the average distance between each small cluster and all the large clusters. COF can be described by the following equation:
where |LC| is the cardinality of the large clusters set, and d(C, C) is the distance between cluster i and cluster j. This distance is calculated as follows:
where is the dimensions of the medoid point (M) of cluster C and is the dimensions of the medoid point (M) of cluster C.
When we need to calculate cluster outlierness factor for the small clusters, the average distances between each small cluster and all other large clusters are computed; namely Base Cluster Outlierness Factor (BCOF). BCOF is computed as:
Equation (7) assumes that outliers are collected in small sparse clusters which are far from large clusters. Thus, a cluster belongs to outlier cluster set if:
where .
This step outputs the initial outlier cluster set. Till now, none of the points of this set is considered as an outlier because some points may be misclassified. The role of the next steps is to exclude these misclassified points from the outlier set.
2.1.4. Identify Probable Outliers inside Cluster
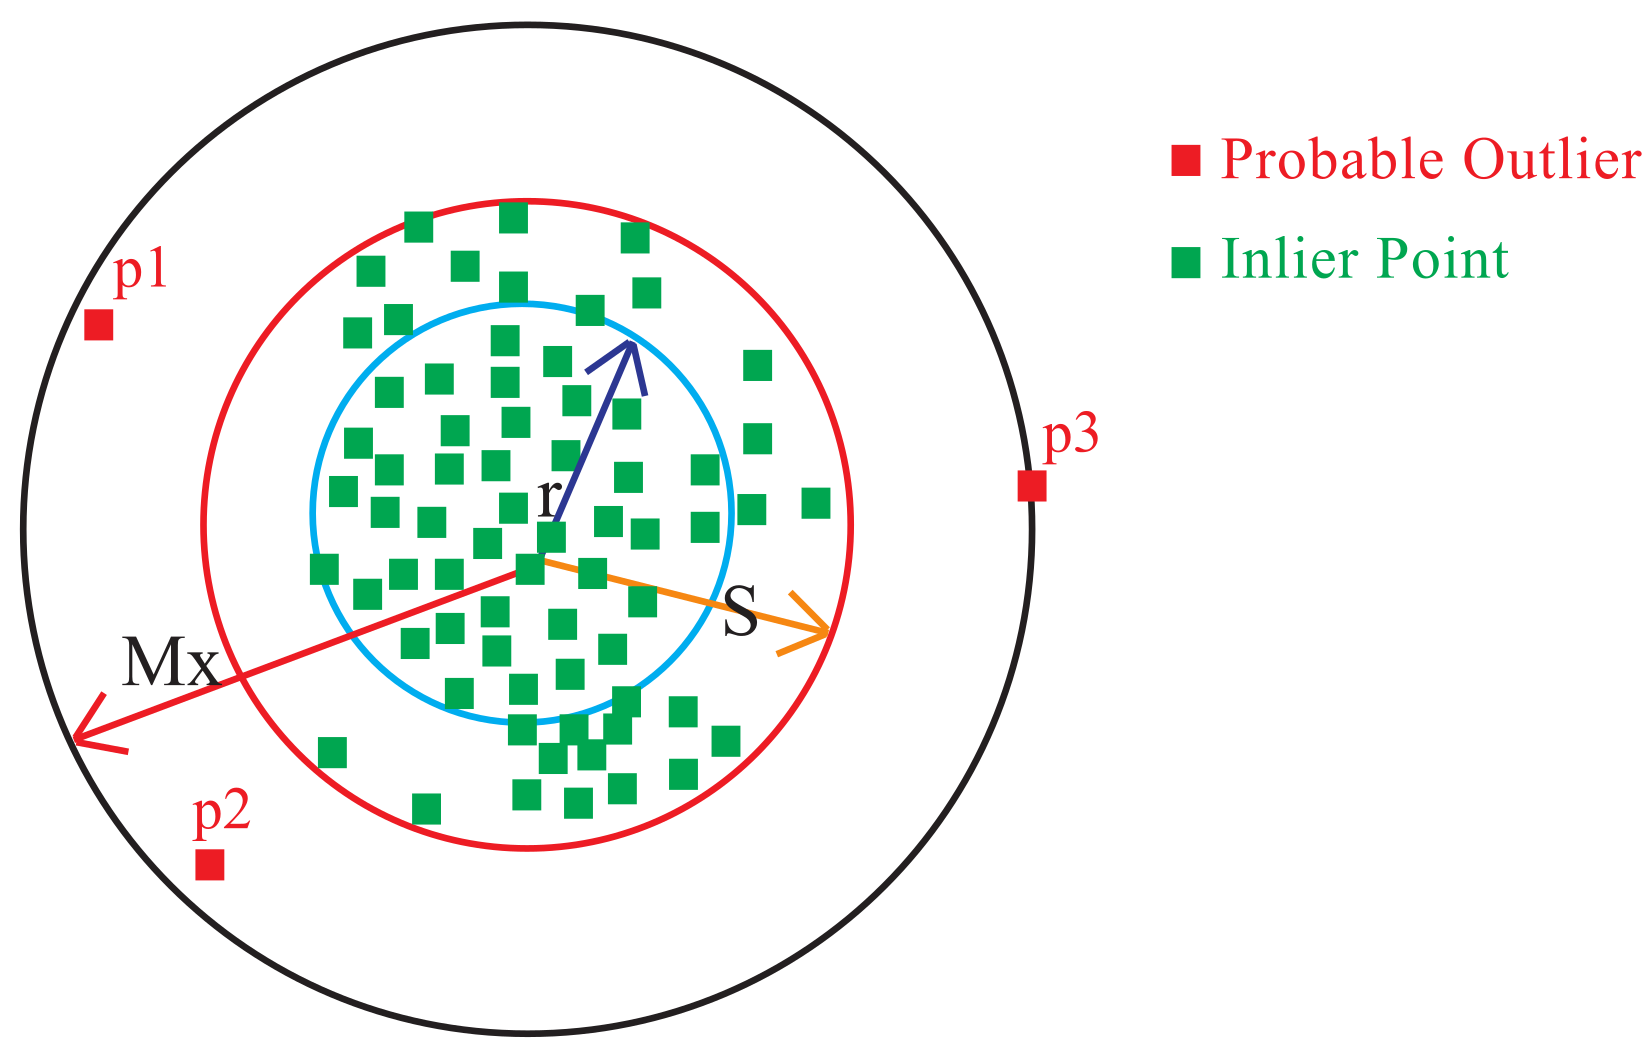
The previous step assumes that all points belonging to outlier cluster set are outliers and all points belonging to normal cluster set are inliers. This assumption is not sufficient for two reasons. First, the outlierness value for each outlier point is not exist. Second, some points may be misclassified inside each cluster. Calculating the outlierness factor for each point in the cluster is not feasible because the number of outlier points is significantly less than the number of inlier points. Also, the outlierness factor is often calculated in terms of O(n). In this work, a separation method is developed to distinguish probable outliers from inlier points. The outlierness factor is only calculated for probable outliers which greatly decreases the computational time of the proposed algorithm. To do so, a local cut-off value (S) for each individual cluster must be defined to determine the region of probable outliers. In Reference [9], a local cut-off value (S) is defined as: S(C) = r(C). This means that the local cut-off value S is only dependent on the radius r of the cluster. We found experimentally that this definition does not yield high detection rate. Therefore, we refine the proposed algorithm by adding another step to identify the probable outlier inside each cluster. This step will limit the calculations of the outlierness factor to be applied on the probable outliers only, which in turn reduces the computational complexity. Thus, we redefine S as follows:
where C is a cluster belonging to the set of clusters C, r(C) is the radius of cluster C, is a slicing distance threshold which is the average distances of points under the radius region to the medoid M(C) and b is a weighted value that starts from 1 and incremented until reaching the optimal value.
The cut-off value S can be obtained through the following steps:
- Slice the distance from medoid M of cluster to the border of the cluster into a set of regions of equal width .
- Calculate the average number of points in all slices under radius region , from medoid as follows:where is the number of slices inside the radius region.
- Find the number of points, , in each slicing region located outside the cluster radius .
- Compare with the average and continue incrementing b until the stopping condition ( is met.
- Finally, .
To determine the true oultlier points in the produced clutsers, outlier and normal clusters are handled differently. All points which lie inside the outlier cluster and satisfy Equation (11) are considered outliers.
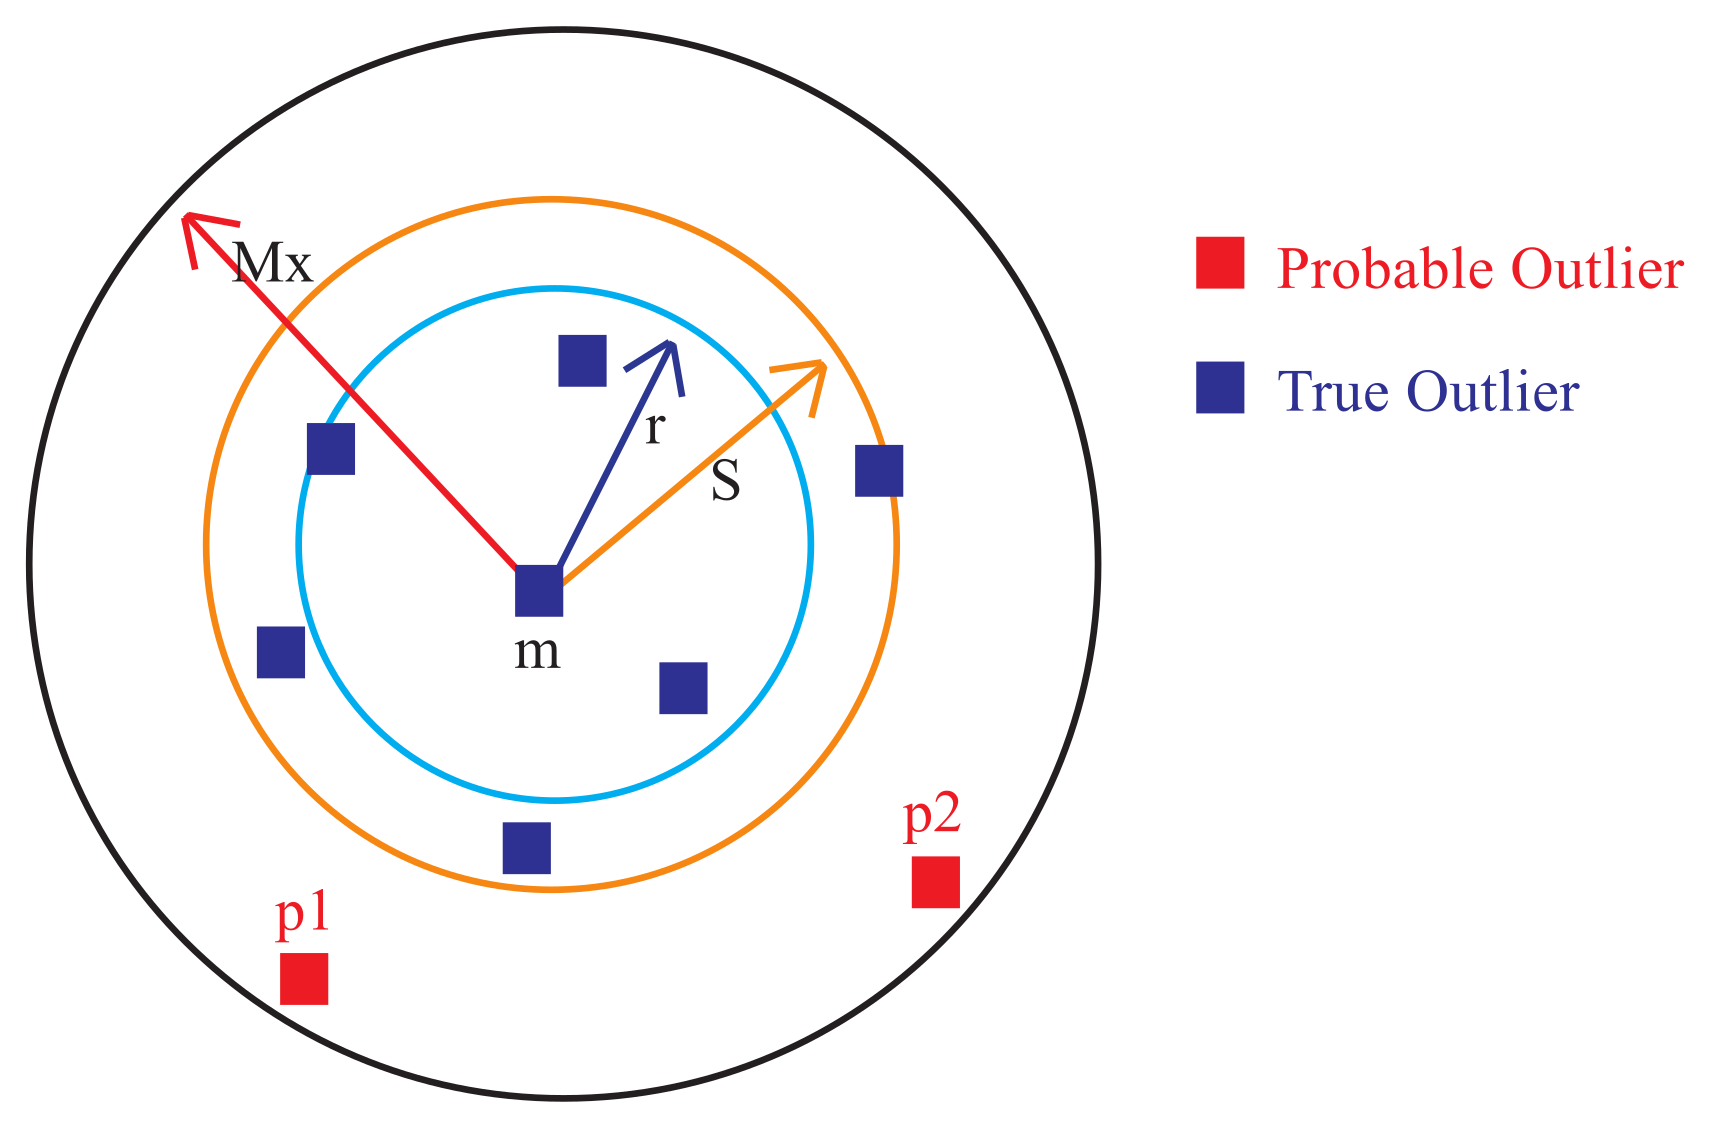
The remaining points in the outlier cluster set that satisfy Equation (12) are considered probable outliers. As shown in Figure 3, the probable outlier points lies outside S, while the true outliers lies inside S.
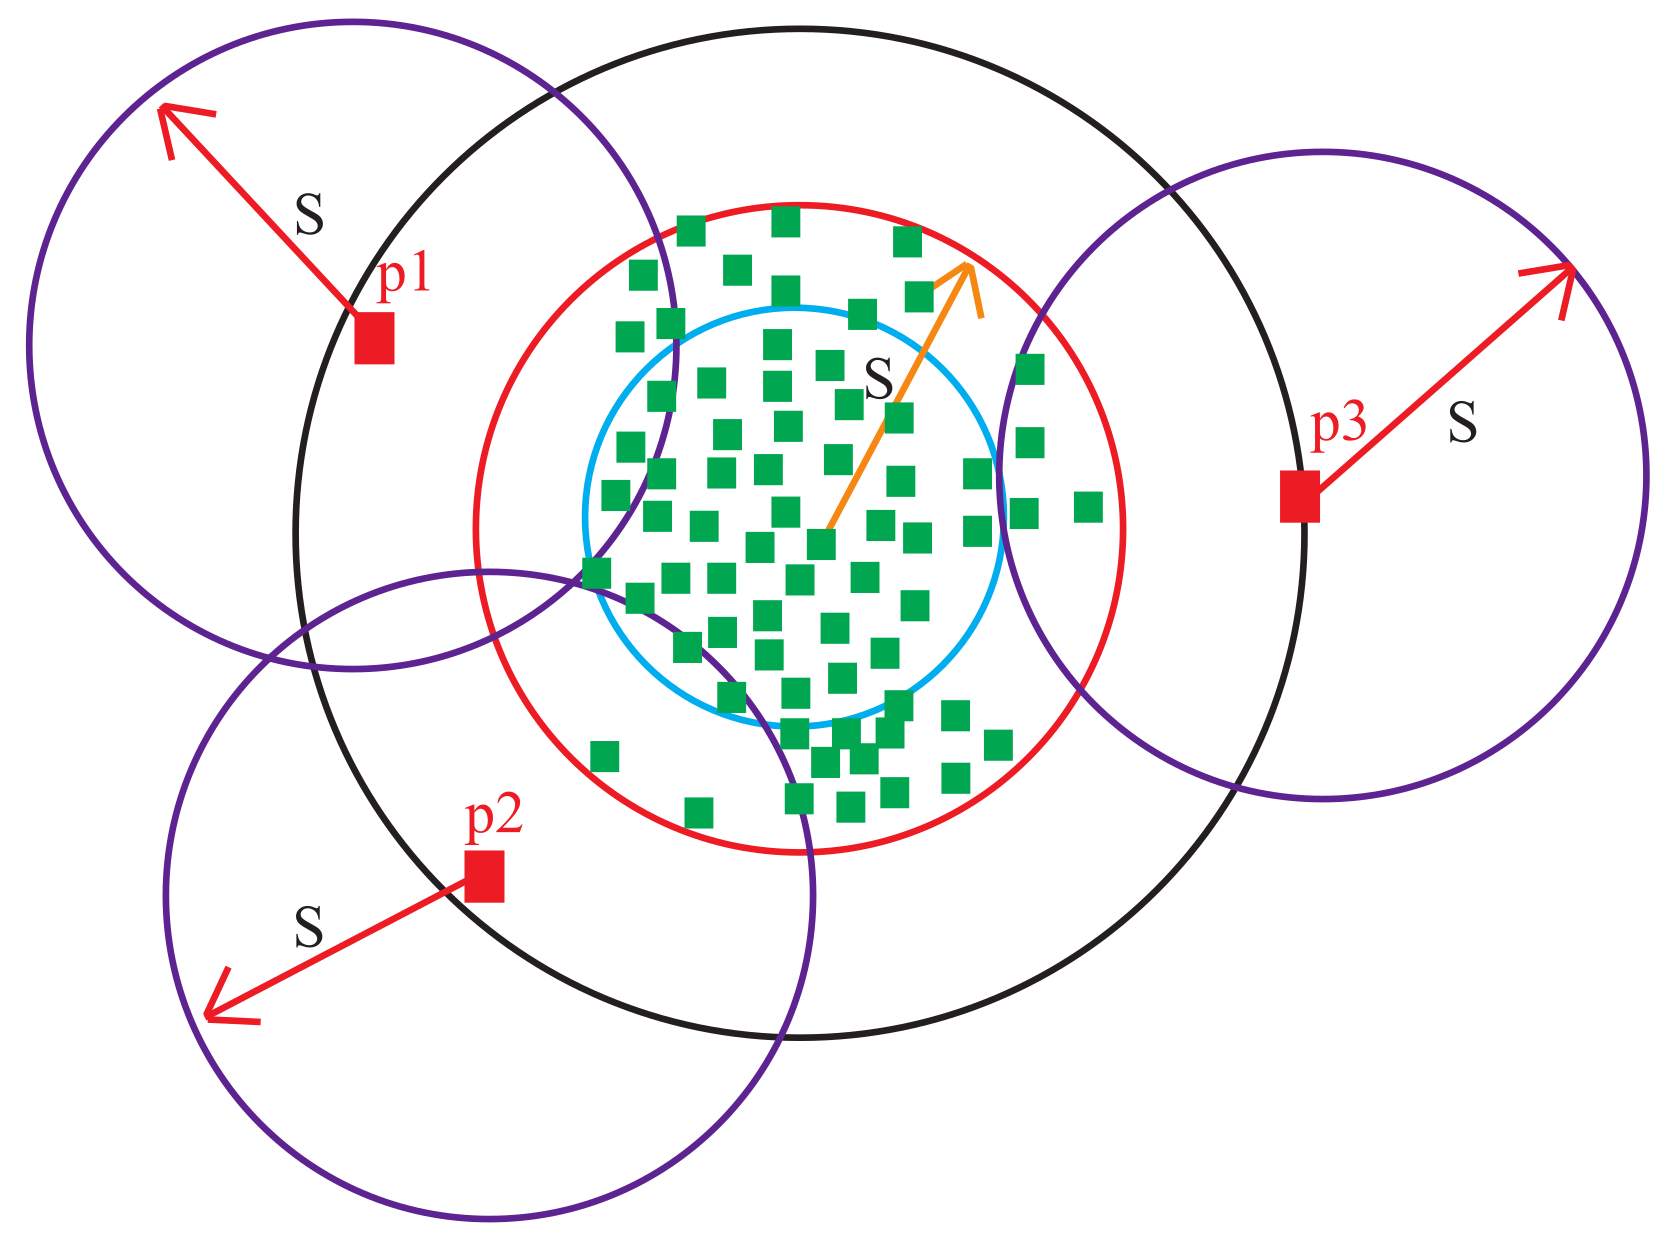
On the other hand, for each normal cluster, the portable outliers are determined based on the points that satisfy Equation (13). Figure 4 shows three portable outliers p, p and p lying outside S while inliers are the points that lie inside S.
The output of this step is a set of true outliers in addition to a collection of probable outliers.
2.1.5. Assigning Outlier Factor
The degree of being an outlier for each portable outlier point either in normal or outlier clusters is determined using its outlierness factor. The density-based Local Outlier Factor (LOF) algorithm proposed in Reference [4] is used in this paper with some modifications for this purpose. In our modified algorithm, we provide the LOF algorithm with the local neighborhood instead of the number of nearest neighbor points (KNN) as in the original LOF algorithm.
The value of the local neighborhood of a cluster is chosen to be the same as the cut-off value S of that cluster. Thus, the modified algorithm does not need KNN parameter to calculate LOF. In our modified algorithm, LOF is computed only for probable outliers which represent less than 10% of the dataset while the complexity of calculating LOF in original LOF algorithm is O(n).
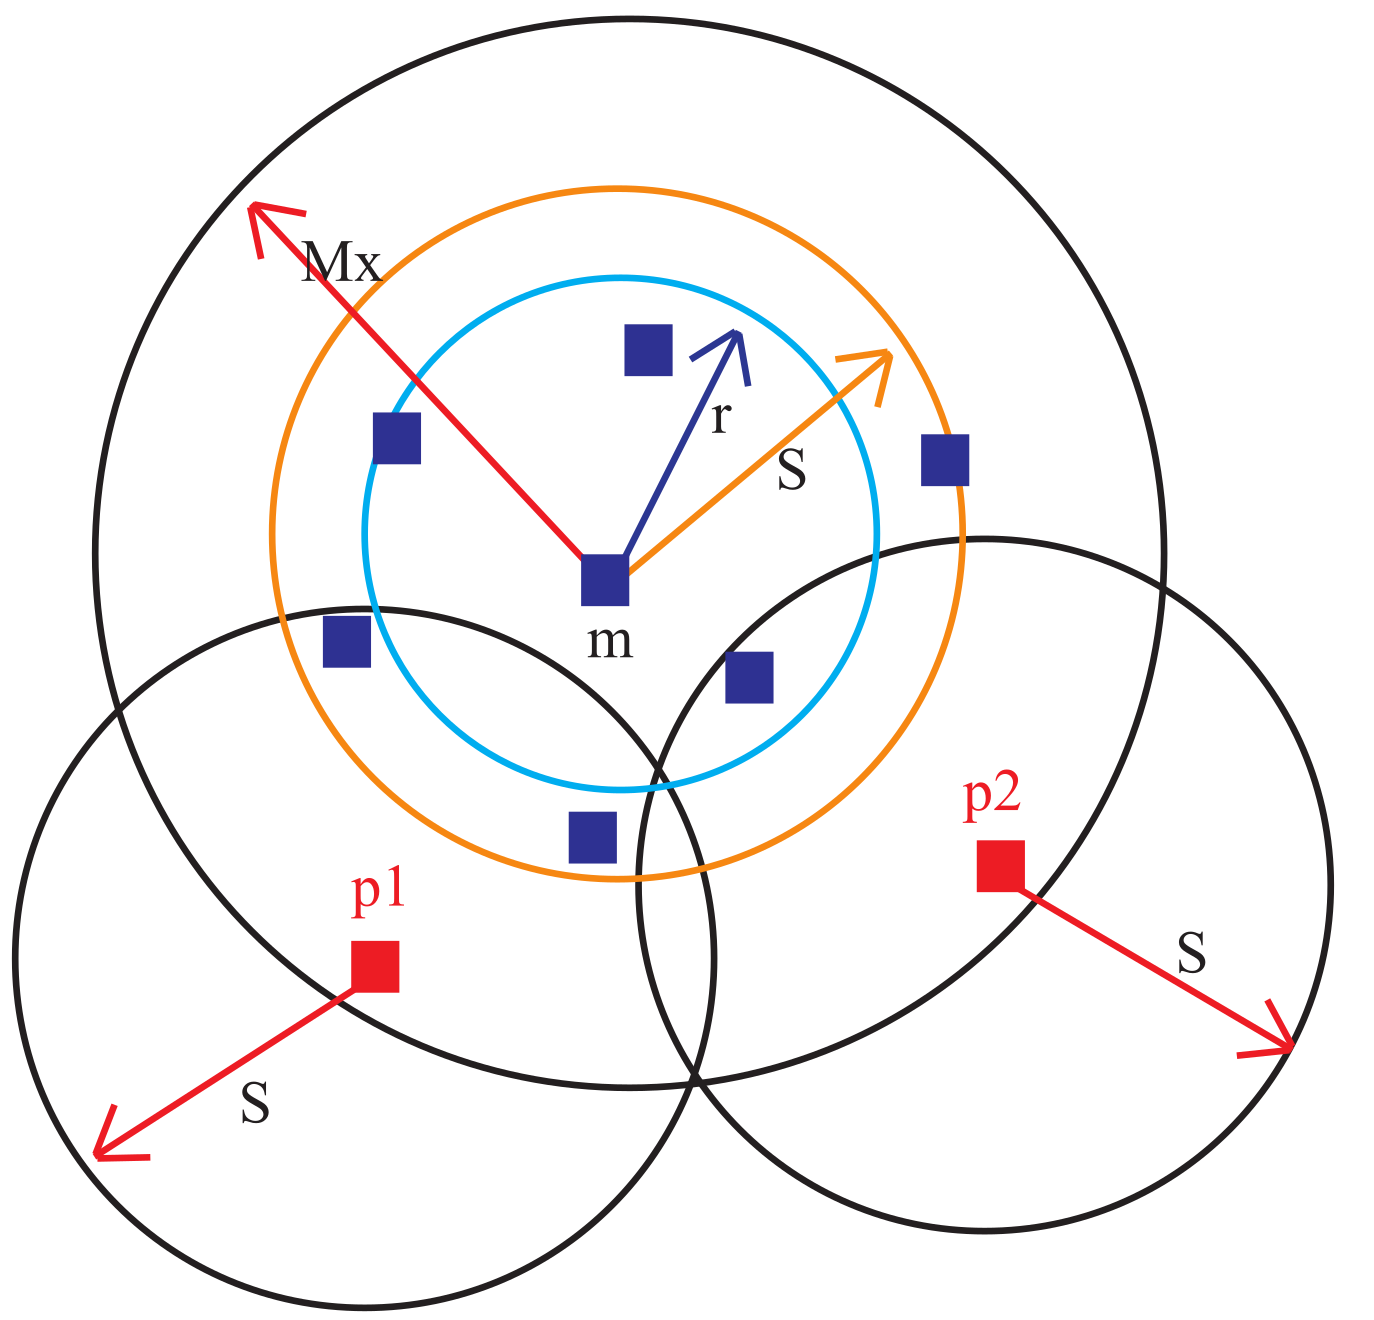
Figure 5 shows the idea of our modified LOF algorithm. As seen, the LOF is computed only for points: p, p and p that lie outside S. To calculate the LOF of a point p, the density of the point p is compared with the densities of the nearest neighbor points lying in the neighborhood S centered at p. This is done for probable outliers of a normal cluster as shown in Figure 5 and for probable outliers of an outlier cluster as shown in Figure 6.
2.1.6. Removing Outliers from the Dataset
As explained previously in step 6, |O| points are added to the set of outliers O. The outlierness factor is used to find the remaining outlier points from the probable outliers. A sorted probable outlier list is created with the highest outlierness factor point at the top and the lowest outlierness factor point at the bottom of the list. Thus, 80% of the top outliers will be extracted away from the data set forming the outlier database and the remaining points form the pure data set. At this step, the clustering process is repeated but on the outlier free data set. A K-Means algorithm is chosen at this step due to its fastness. Moreover, as there are no more outliers exist in the dataset, no worries about the accuracy of the K-Means algorithm. The output of this step are new clusters with new medoids. Each medoid is in the core of the cluster.
2.2. The Online Stage
The steps of the online stage, shown in Figure 1, can be summarized as follows:
- Receiving the query: The online framework receives the query from the user through this step. The query can be a single point to be checked whether it is an outlier or not, or a batch of points to be labeled as outlier or inlier. A preprocessing function is performed on the data before being passed to the next step similar to the one used in the offline stage.
- Similarity calculation: In this step, we utilize the clusters set obtained from the offline stage in measuring the similarity between the tested point and all clusters represented by their centroids. The output of the offline stage is a clustered outlier-free dataset. Each cluster has a medoid that represents the whole cluster. The online stage exploits the relationship between the medoids and their clusters (i.e., a medoid is a fully representative of its cluster). The similarity between the test point and all clusters represented by their medoids is measured. The cosine similarity measure [35] is chosen to calculate the similarity according to the following equation:where P is the point given by the user to check its outlierness, M is the medoid of cluster C and i is the ith dimension of the point. The resulting similarity ranges from −1 to 1. The value −1 means exactly opposite similarity while 1 means exactly the same similarity. The 0 value indicates orthogonality. Any value between −1 and 1 indicates intermediate similarity or dissimilarity.
- Classification and assignment:After calculating the similarity between the test point and the clusters, the test point should belong to the cluster with the highest measured similarity to the point and satisfying Equation (15). The similarity measure is evaluated not only for normal clusters but also for outlier clusters.The test point is assigned to the closest cluster in the feature space. Hence, the cluster size is increased by one point and its medoid should be relocated. Thus, this cluster is maintained up-to-date with any new points.Steps 2 and 3 greatly reduce the computation time than the traditional clustering approaches because the traditional approaches require the generation of the whole clusters including the new data point.
- Medoids and cluster relocation:Finally, to keep the clusters data-up-to date after the insertion of the new point, this step runs in the background to determine the correct center point of the cluster that is affected by the new added point. A new medoid is calculated for the assigned cluster of the test point based on averaging the values of all points including the test point to form a new value. Thus, the only required calculation is for the cluster affected by the addition of that point. This will surely reduce the computational time.Alternatively, to avoid repeating the average calculation for each new assigned point, the centroid is computed directly based on the previous value of the centroid. Thus, the process of calculating the new medoid is independent on cluster size. Equation (16) is used for that.
- Outlier alarm system:This system is responsible for presenting the results to the user based on the requested mode. The request mode could be a single point mode, a batch mode or a test mode. In the single point mode, only one point is introduced to the framework and the result is an alert indicating whether the point is an outlier or not. In the batch mode, the framework runs on a set of points and the response is a file that includes all input points with the class of each one whether it is an outlier or not. The third mode is the test mode which generates four files consisting of the false positive points, the true positive points, the true negative points, and the false negative points of the test set [36]. This data is used to verify the performance of the framework, when both of the input set and the original set are class labeled.At the end of this online stage, the tested point is reclassified as an outlier or inlier. The point is assigned to a specific outlier or inlier cluster and the clusters are updated to be ready for further usage. The complexity of the online stage of the proposed framework is O(K) while K is the number of clusters which is very smaller than the number of points in the dataset leading to on-the-fly response.
3. Results and Discussion
The performance of the proposed framework is evaluated using two real datasets: Wisconsin Breast Cancer (WBC) and KDD’99 datasets.
The Wisconsin Breast Cancer (WBC) [37] is a real dataset originally collected from Wisconsin hospitals. WBC dataset consists of 699 points each with 9 numerical features representing the values of diagnosis. Each point belongs to one of two classes: benign or malignant. The WBC dataset includes 458 points (65.5%) as benign class and 241 points (34.5%) as malignant. The KDD’99 dataset [38] consists of 41 features of network connections. These connections are labeled either normal or outliers/intrusions of four different types. KDD’99 dataset consists of a training set which has 4,898,431 (5 millions) connection instances and a test set of 311,029 (300 K) connections. These datasets include normal connections in addition to four main types of intrusions (outliers). For the clarity of presentation, we consider WBC as the default dataset and we have also tested our proposed framework on the KDD’99 in Section 3.2.6.
3.1. The Offline Stage of the Proposed Framework
We adopt the techniques used in References [1,21,22] by randomly removing some of the malignant points to form a very unbalanced distribution. As a result, the dataset has 39 (8%) malignant points (considered as outliers) and 444 (92%) benign points (considered as inliers). The removed points will be used to test the performance of the online stage of the algorithm. True positive rate (TPR) and false positive rate (FPR) [36] are used as metrics to evaluate the performance of proposed outlier detection algorithm.
The data points are normalized to be in the range from 0 to 1 using Min-Max normalization. The number of clusters k is used as the only input to the offline stage of the proposed framework. k is set only one time. A 10% of the dataset is randomly chosen as a sample for the preliminary clustering step. The experimental results show that by choosing k = 8, the best clustering results are obtained. The value of k is fed into the offline stage of the framework only once.
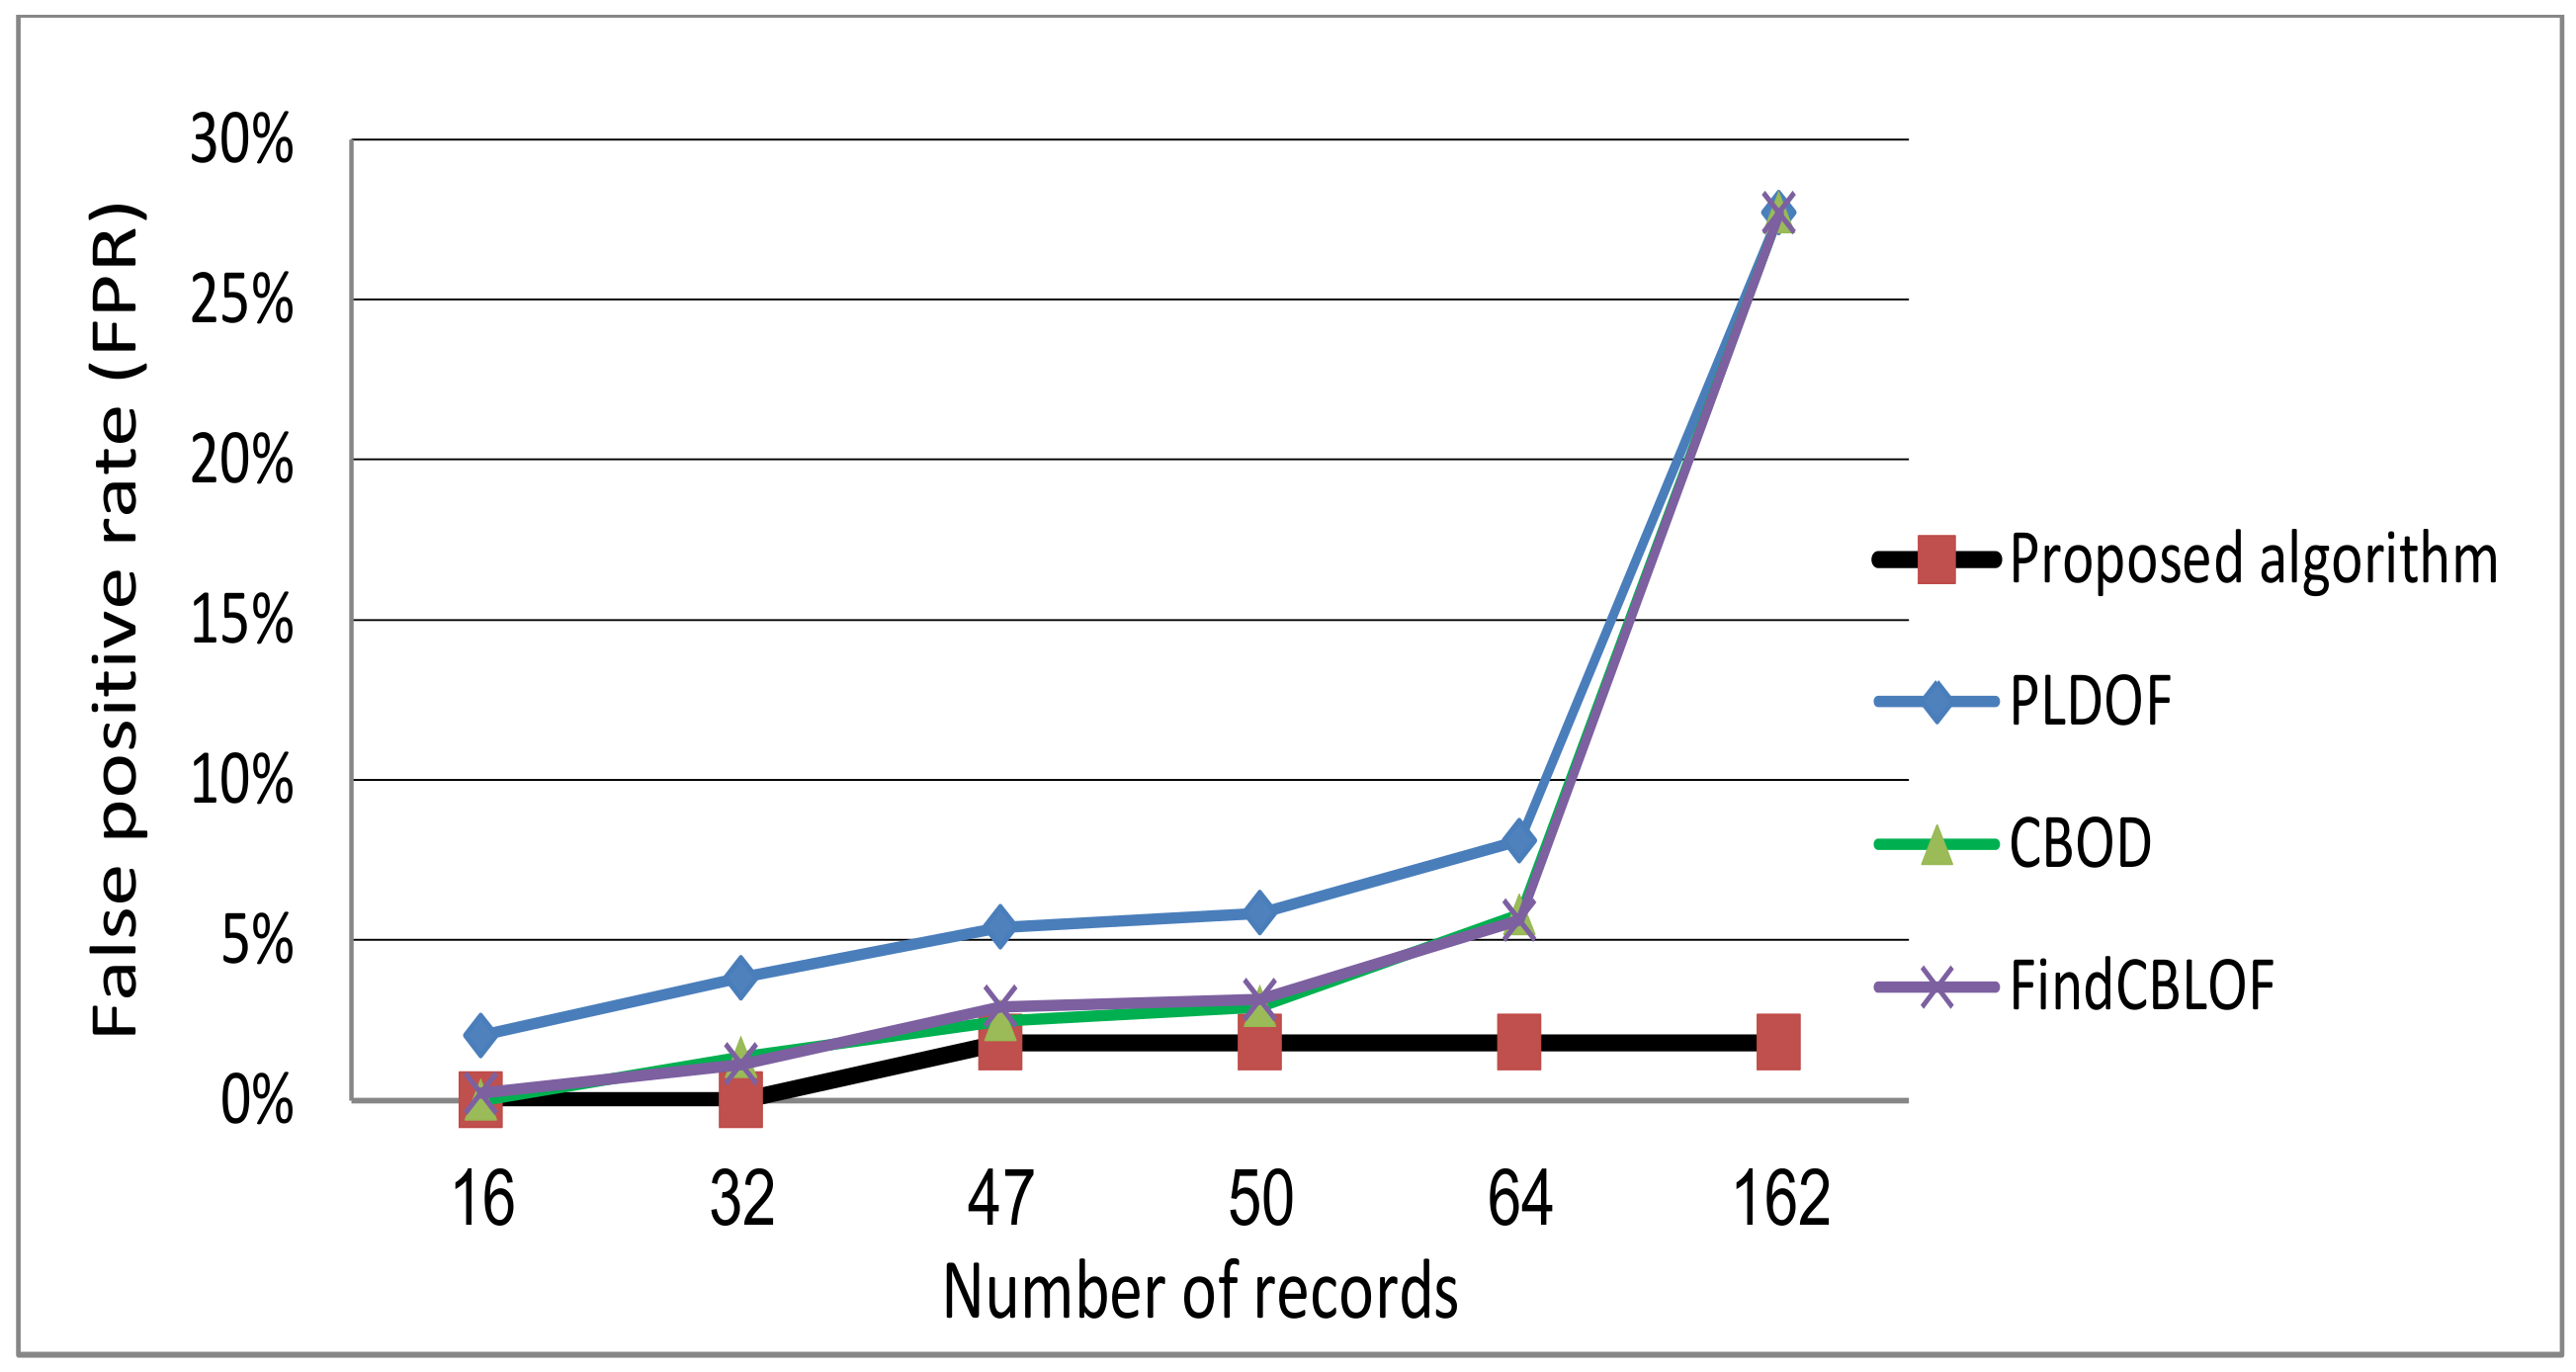
The performance of the proposed offline stage is compared with the traditional algorithms; PLDOF [9], CBOD [22] and FindCBLOF [24]. TPR and FPR are used as evaluation metrics. The top-n outlier points are requested with random sequence to ensure the validity of results. Table 1 shows the results obtained by the offline stage of the proposed framework compared the other approaches.
It is noted from Figure 7 that the offline stage of our algorithm is the first to reach the maximum detection rate of 100% while keeping FPR at the minimum value of 1.8% as shown in Figure 8.
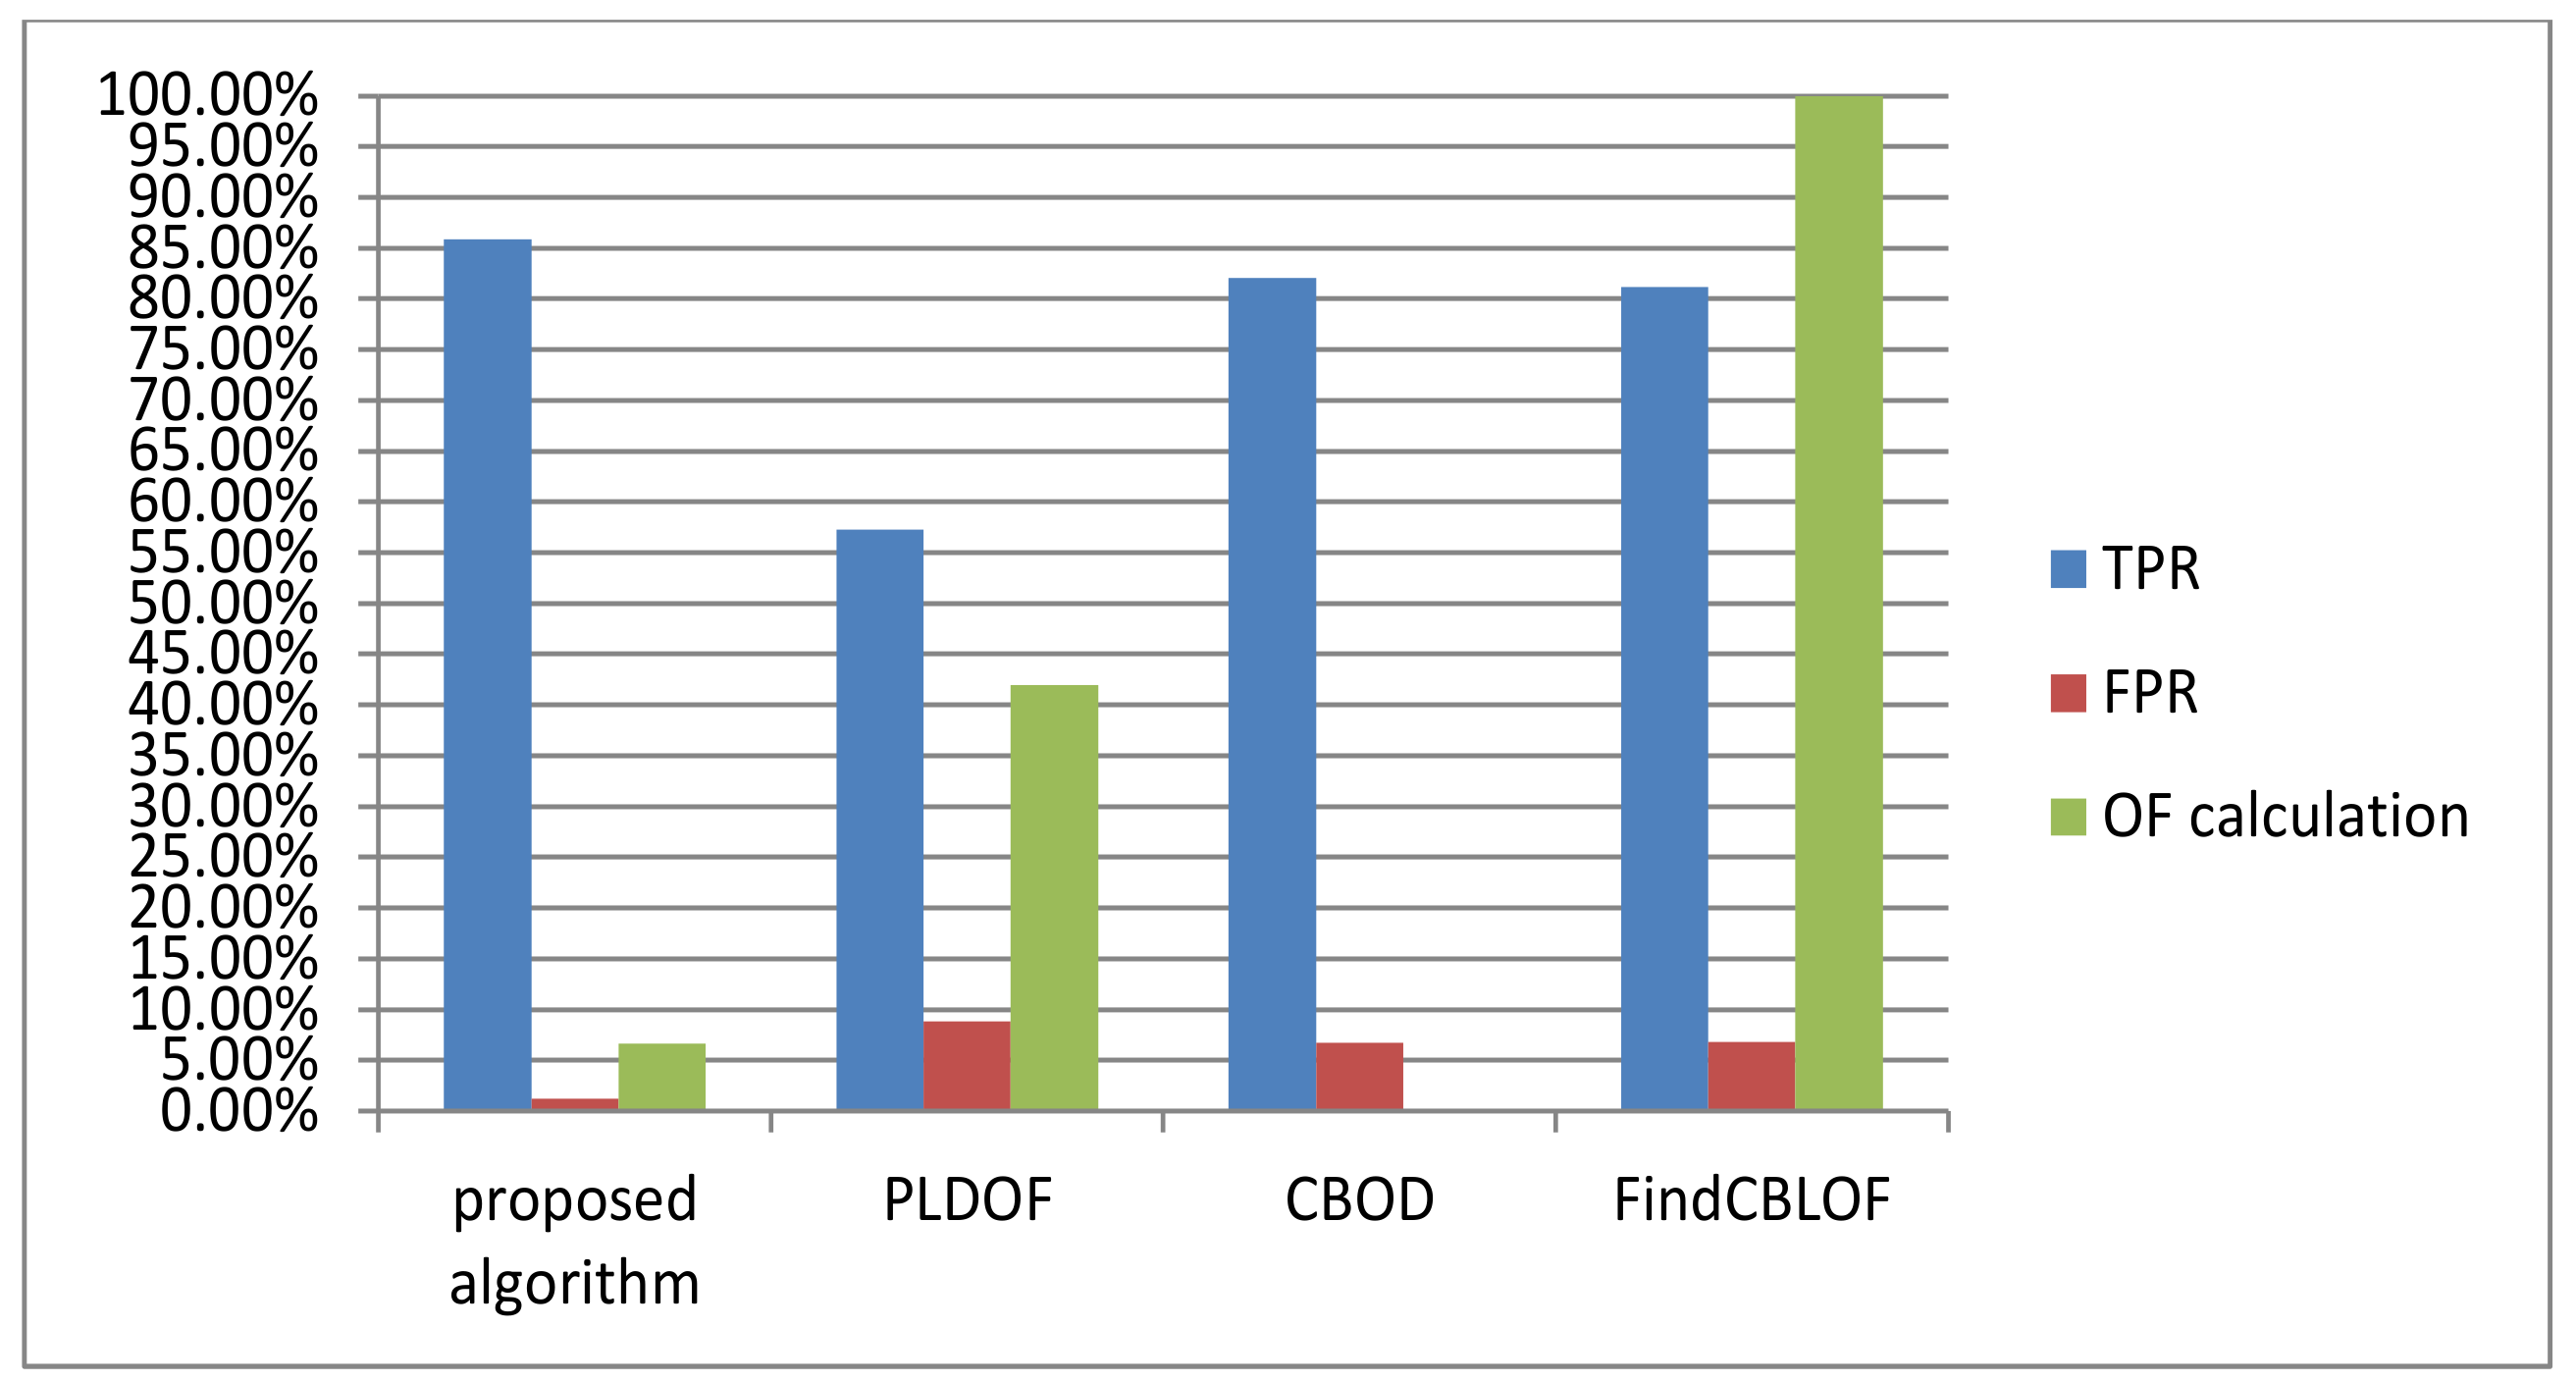
Table 1 and Figure 7 and Figure 8 exhibit the direct proportional relation between the number of points and the detection rate which may be considered as a good performance evidence for all algorithms. However, with the increase of the number of requested outlier points, the FPR increases as well for all algorithms with no limits except for the proposed algorithm. The proposed algorithm reaches the maximum value of FPR 1.8% at a number of points equals 47. This value is kept constant when the number of points is greater than 47. Also, the average TPR, and FPR along with the percentage of outlierness factor calculations for all algorithms are shown in Figure 9. As seen, the proposed algorithm outperforms all other algorithms.
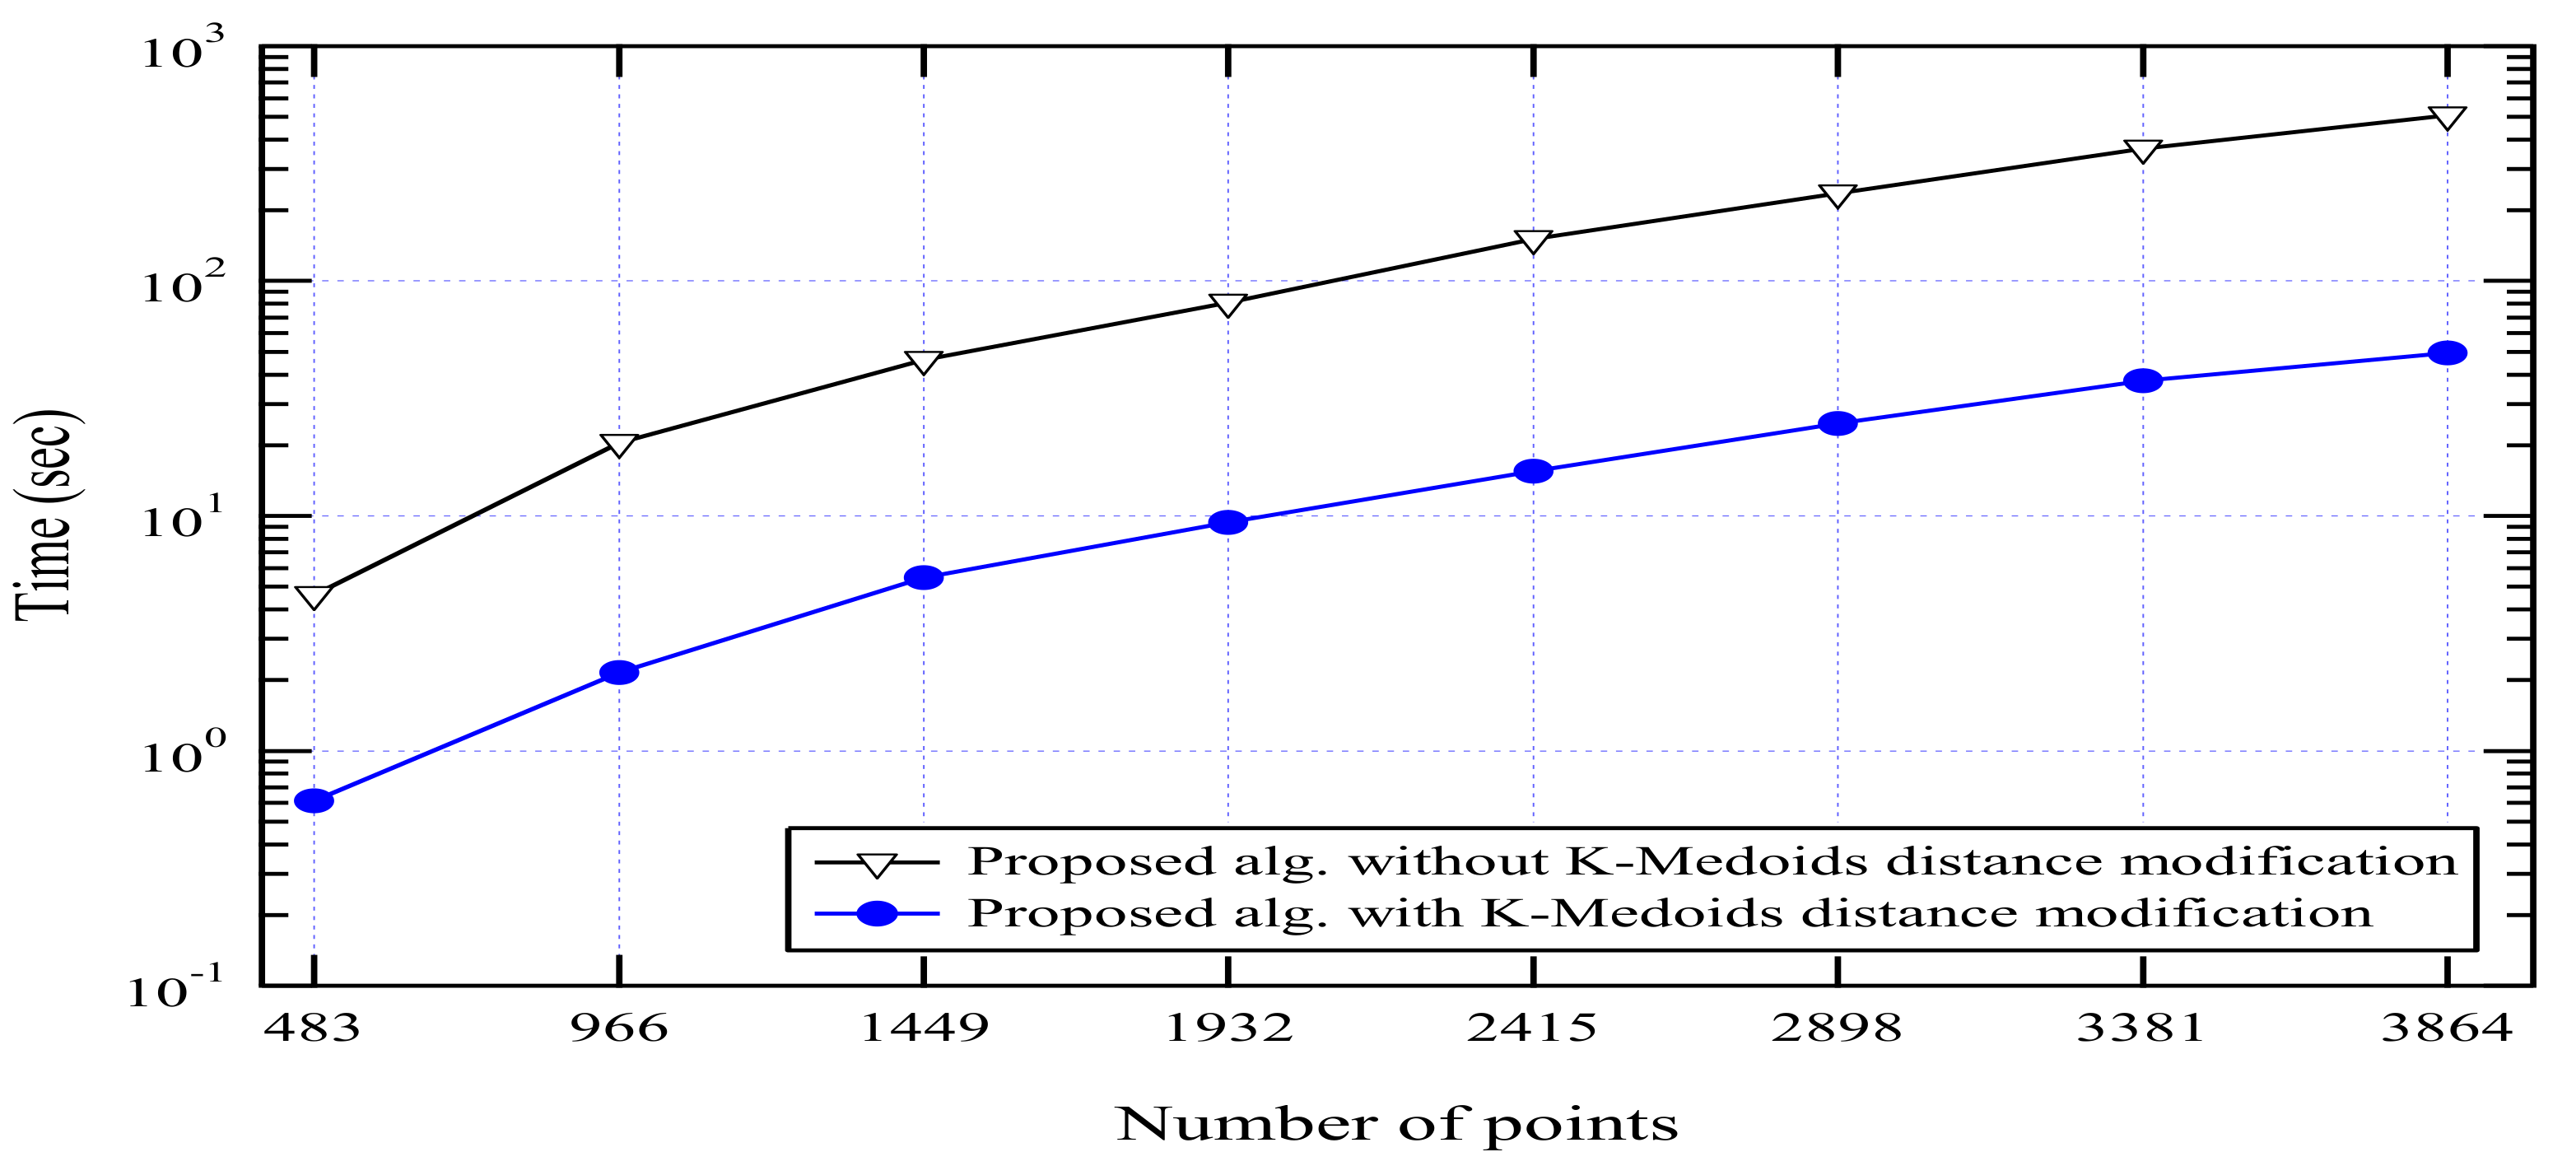
The computational time of the proposed algorithm is measured in order to show the effect of each proposed modification on the response time. All experiments have been run on a 64-bit 2.2 GHz i5 CPU, Asus UX303 machine, Windows 10 and 12 GB of physical memory. Figure 10 shows the time performance of the proposed algorithm before and after modifying the distance calculations of K-Medoids algorithm.
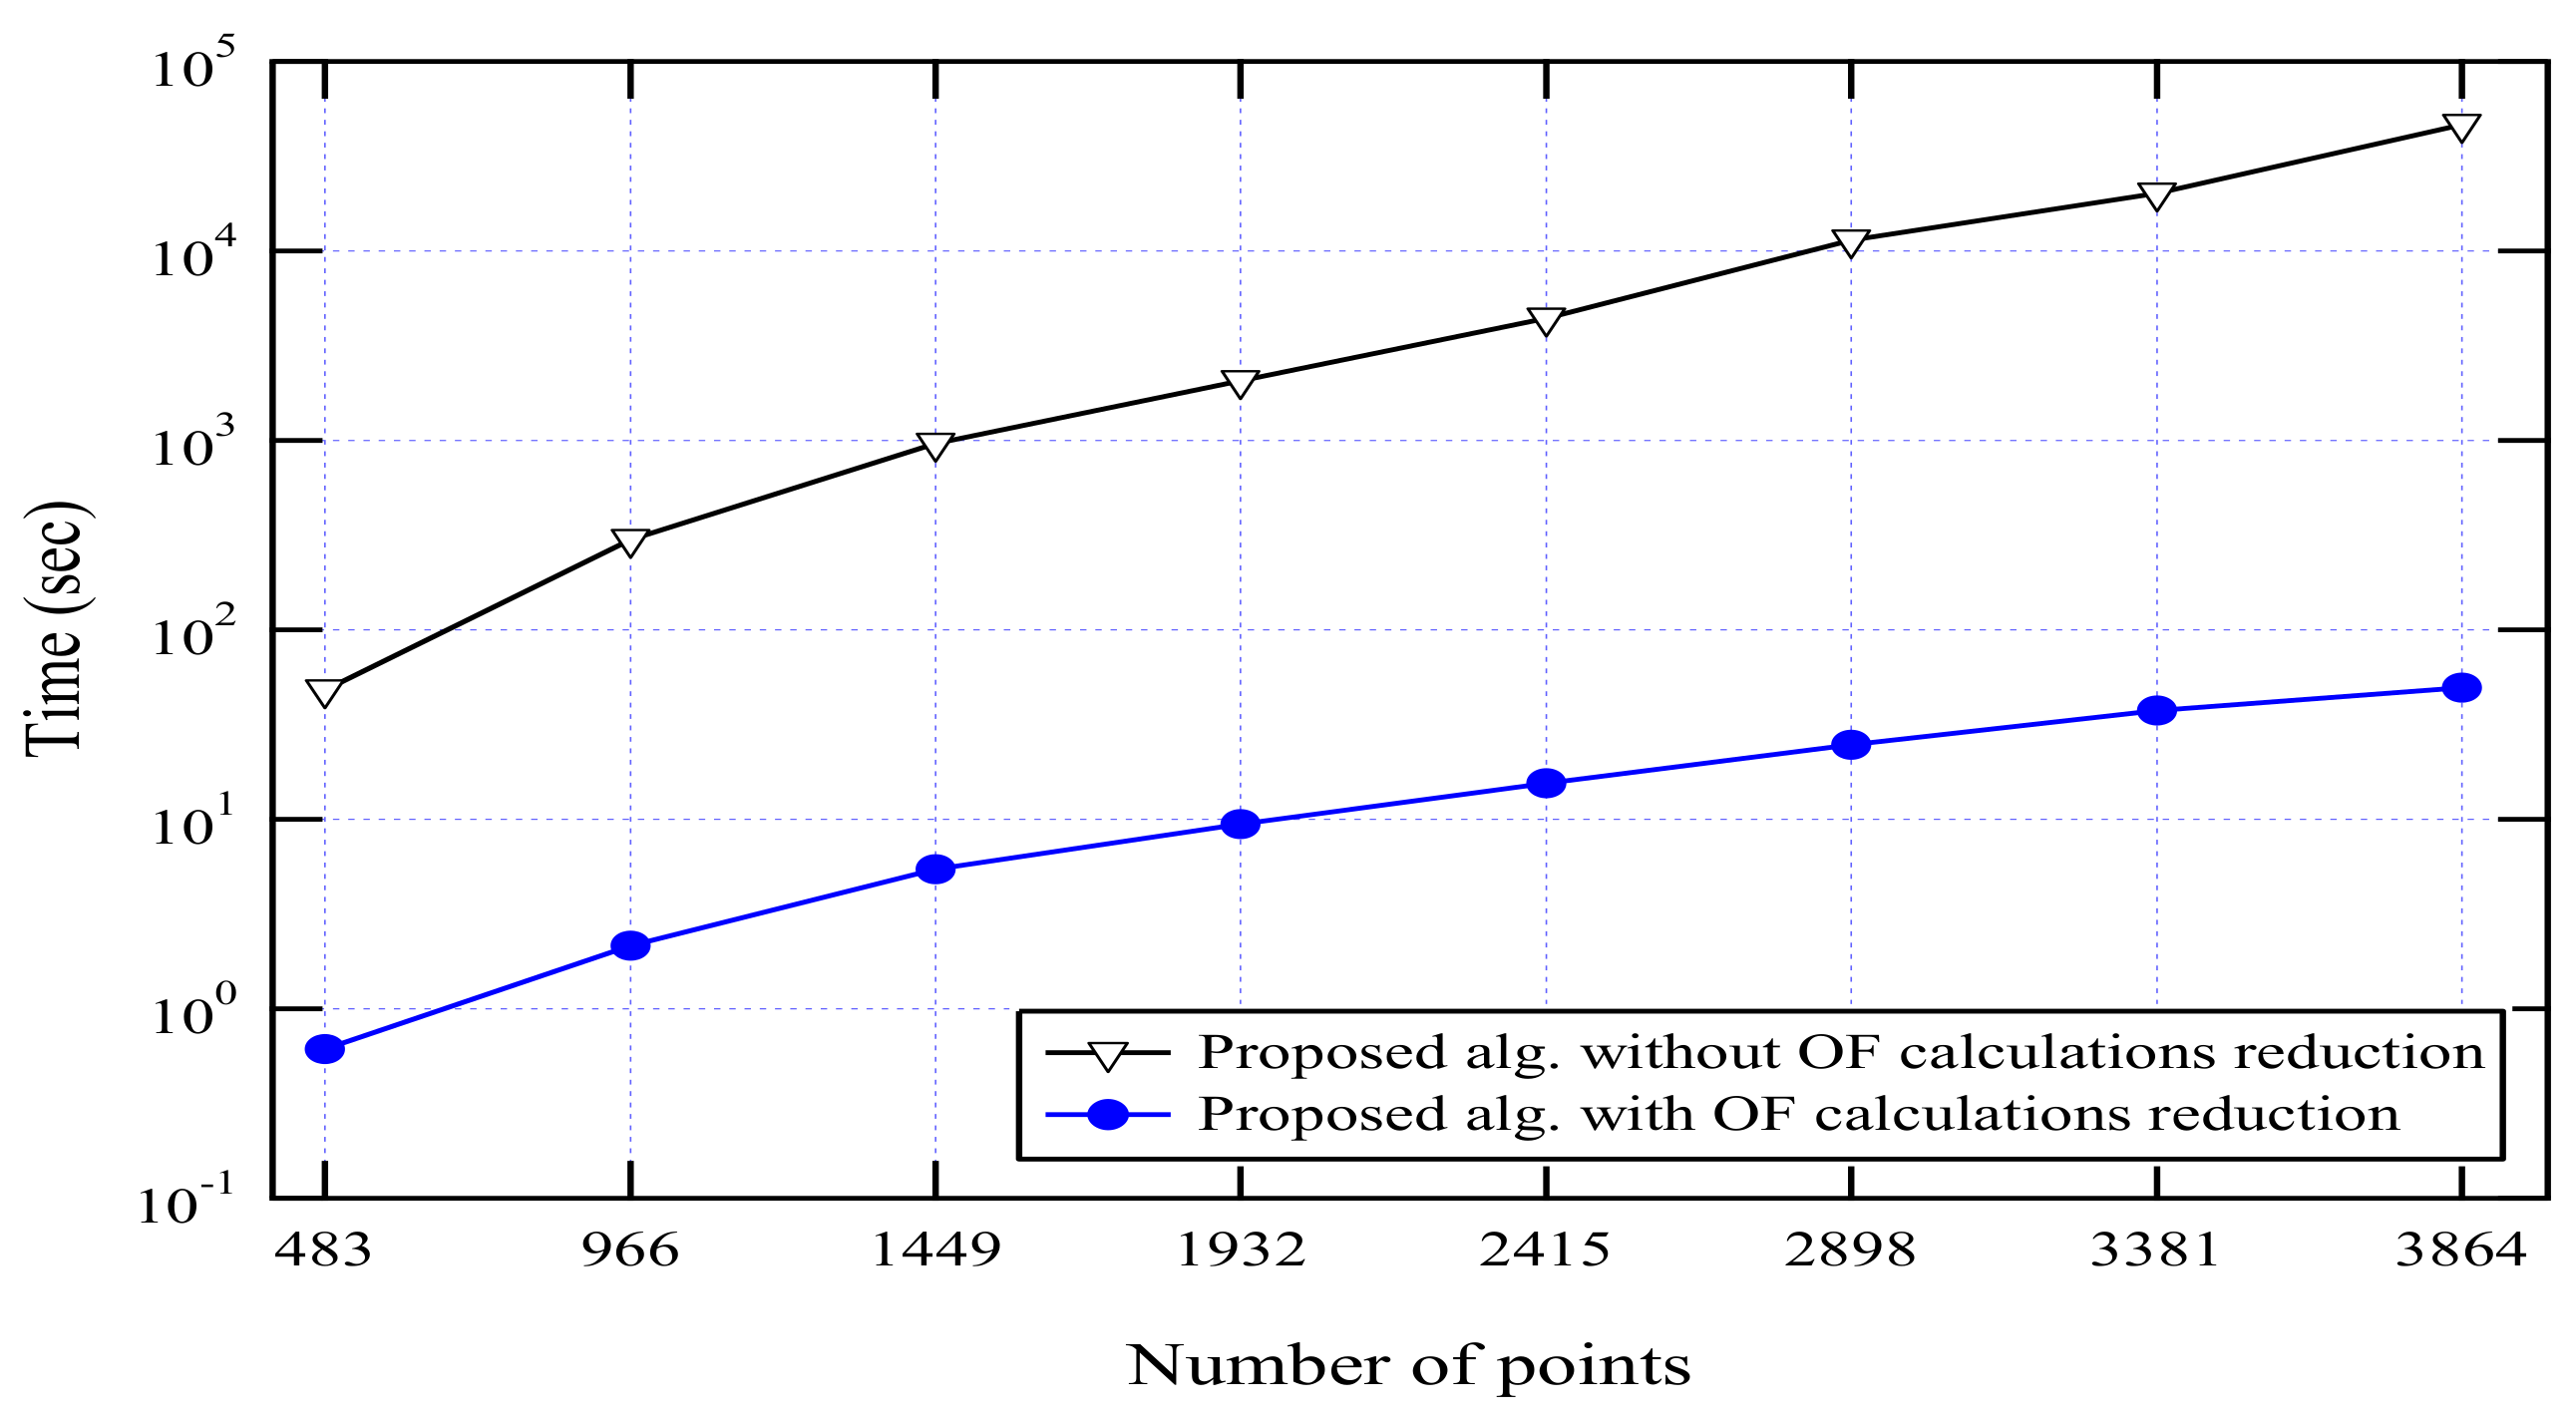
The effect of outlier factor calculation reduction is illustrated in Figure 11 which ensures the importance of this proposed modification. We could not compare the response time of the proposed algorithm to the other three algorithms (PLDOF, CBOD and FindCBLOF) as they did not consider the time evaluation in their work. However, as they use repeated calculations, their time is expected to be larger than the proposed algorithm.
3.2. The Online Stage of the Proposed Framework
In this section, a diverse set of experiments is executed to find the best configuration of our framework. The configuration parameters of our framework are systematically defined by executing a separate experiment for each adjustable parameter. First, we study the effect of the number of clusters (k) which controls the number of classes and defines a trade-off between accuracy and efficiency. Second, we study the effect of the number of top outliers queried (N). As we have used only 483 points from the dataset in the offline stage (the proposed hybrid algorithm), the remaining points, which represent 31% of the original dataset, are used to test the performance of the online stage.
3.2.1. The Effect of the Number of Clusters k
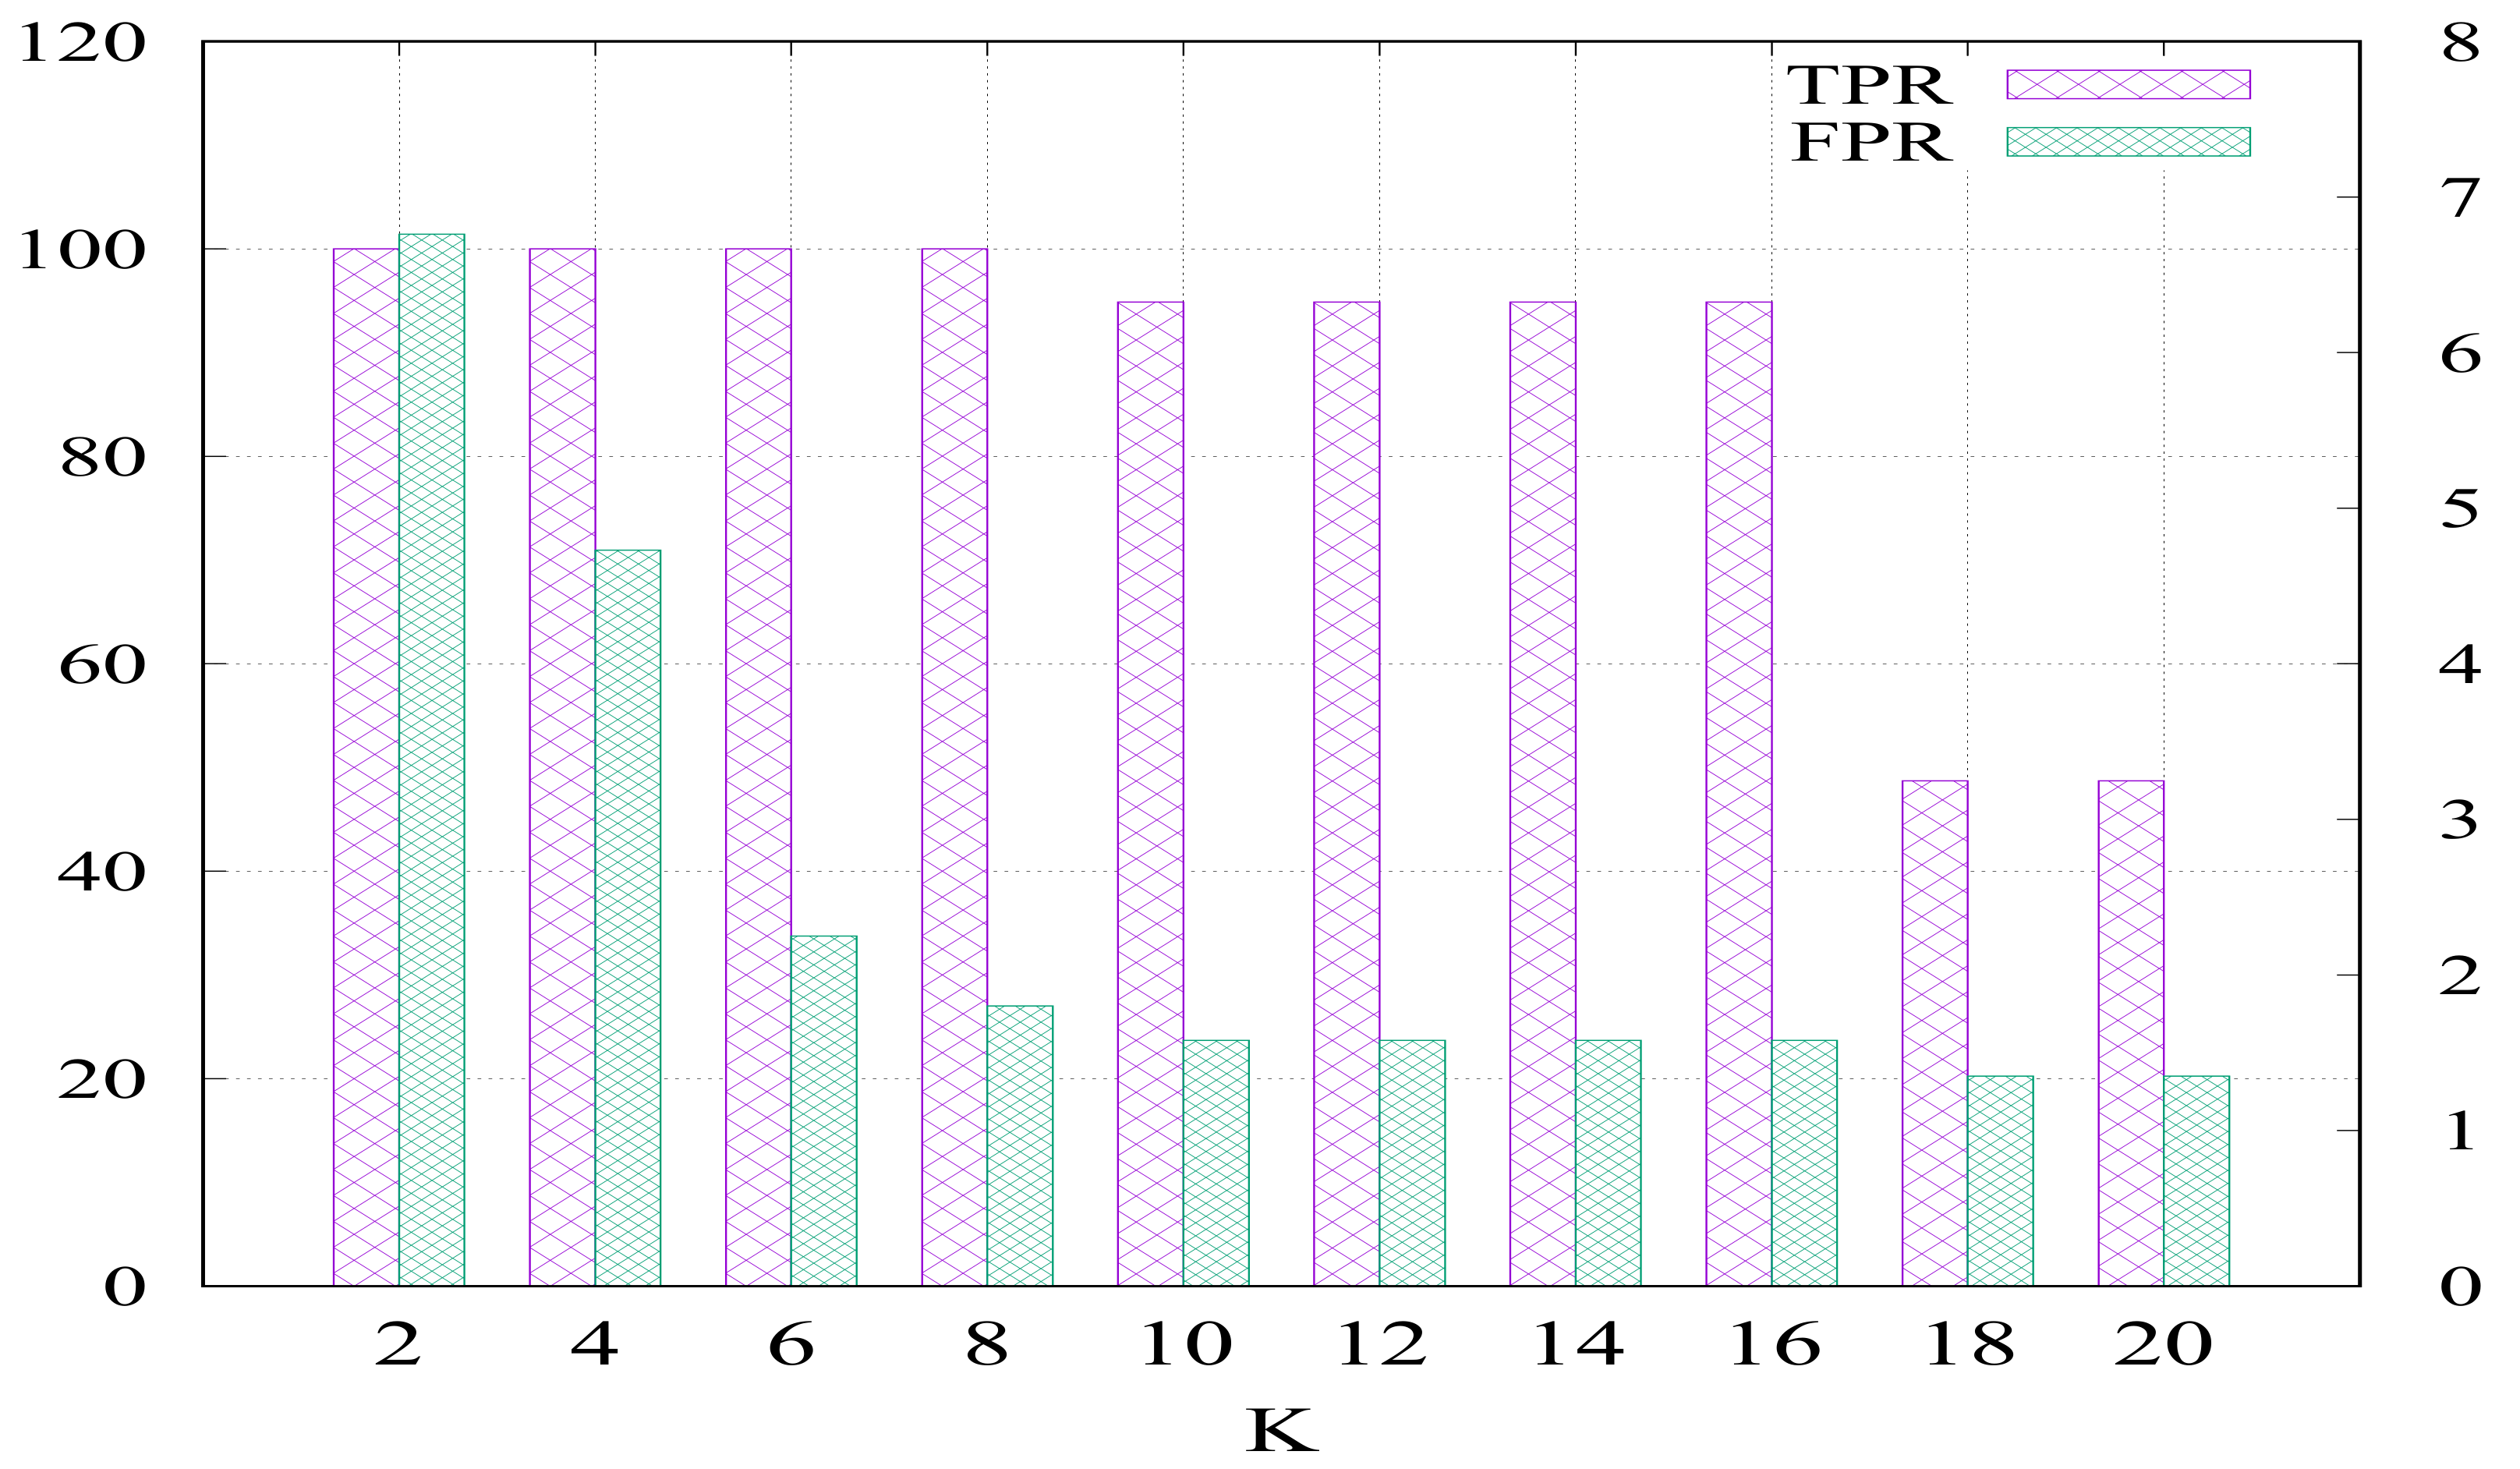
Figure 12 shows the effect of the number of clusters on the TPR and FPR of the OFCOD. The figure shows that the TPR is first enhanced by increasing the number of clusters until reaching its maximum value at k = [4,8] then it tends to decrease again. On the other side, the FPR decreases with the increase of the number of clusters. Furthermore, the increase of the number of clusters highly affects the computation time and complexity of the clustering process. Hence, the optimal results have been obtained at k = 8 where TPR = 100% (at the left y-axis) and FPR = 1.8% (at the right y-axis), which is selected and fed into the clustering step of the OFCOD offline stage.
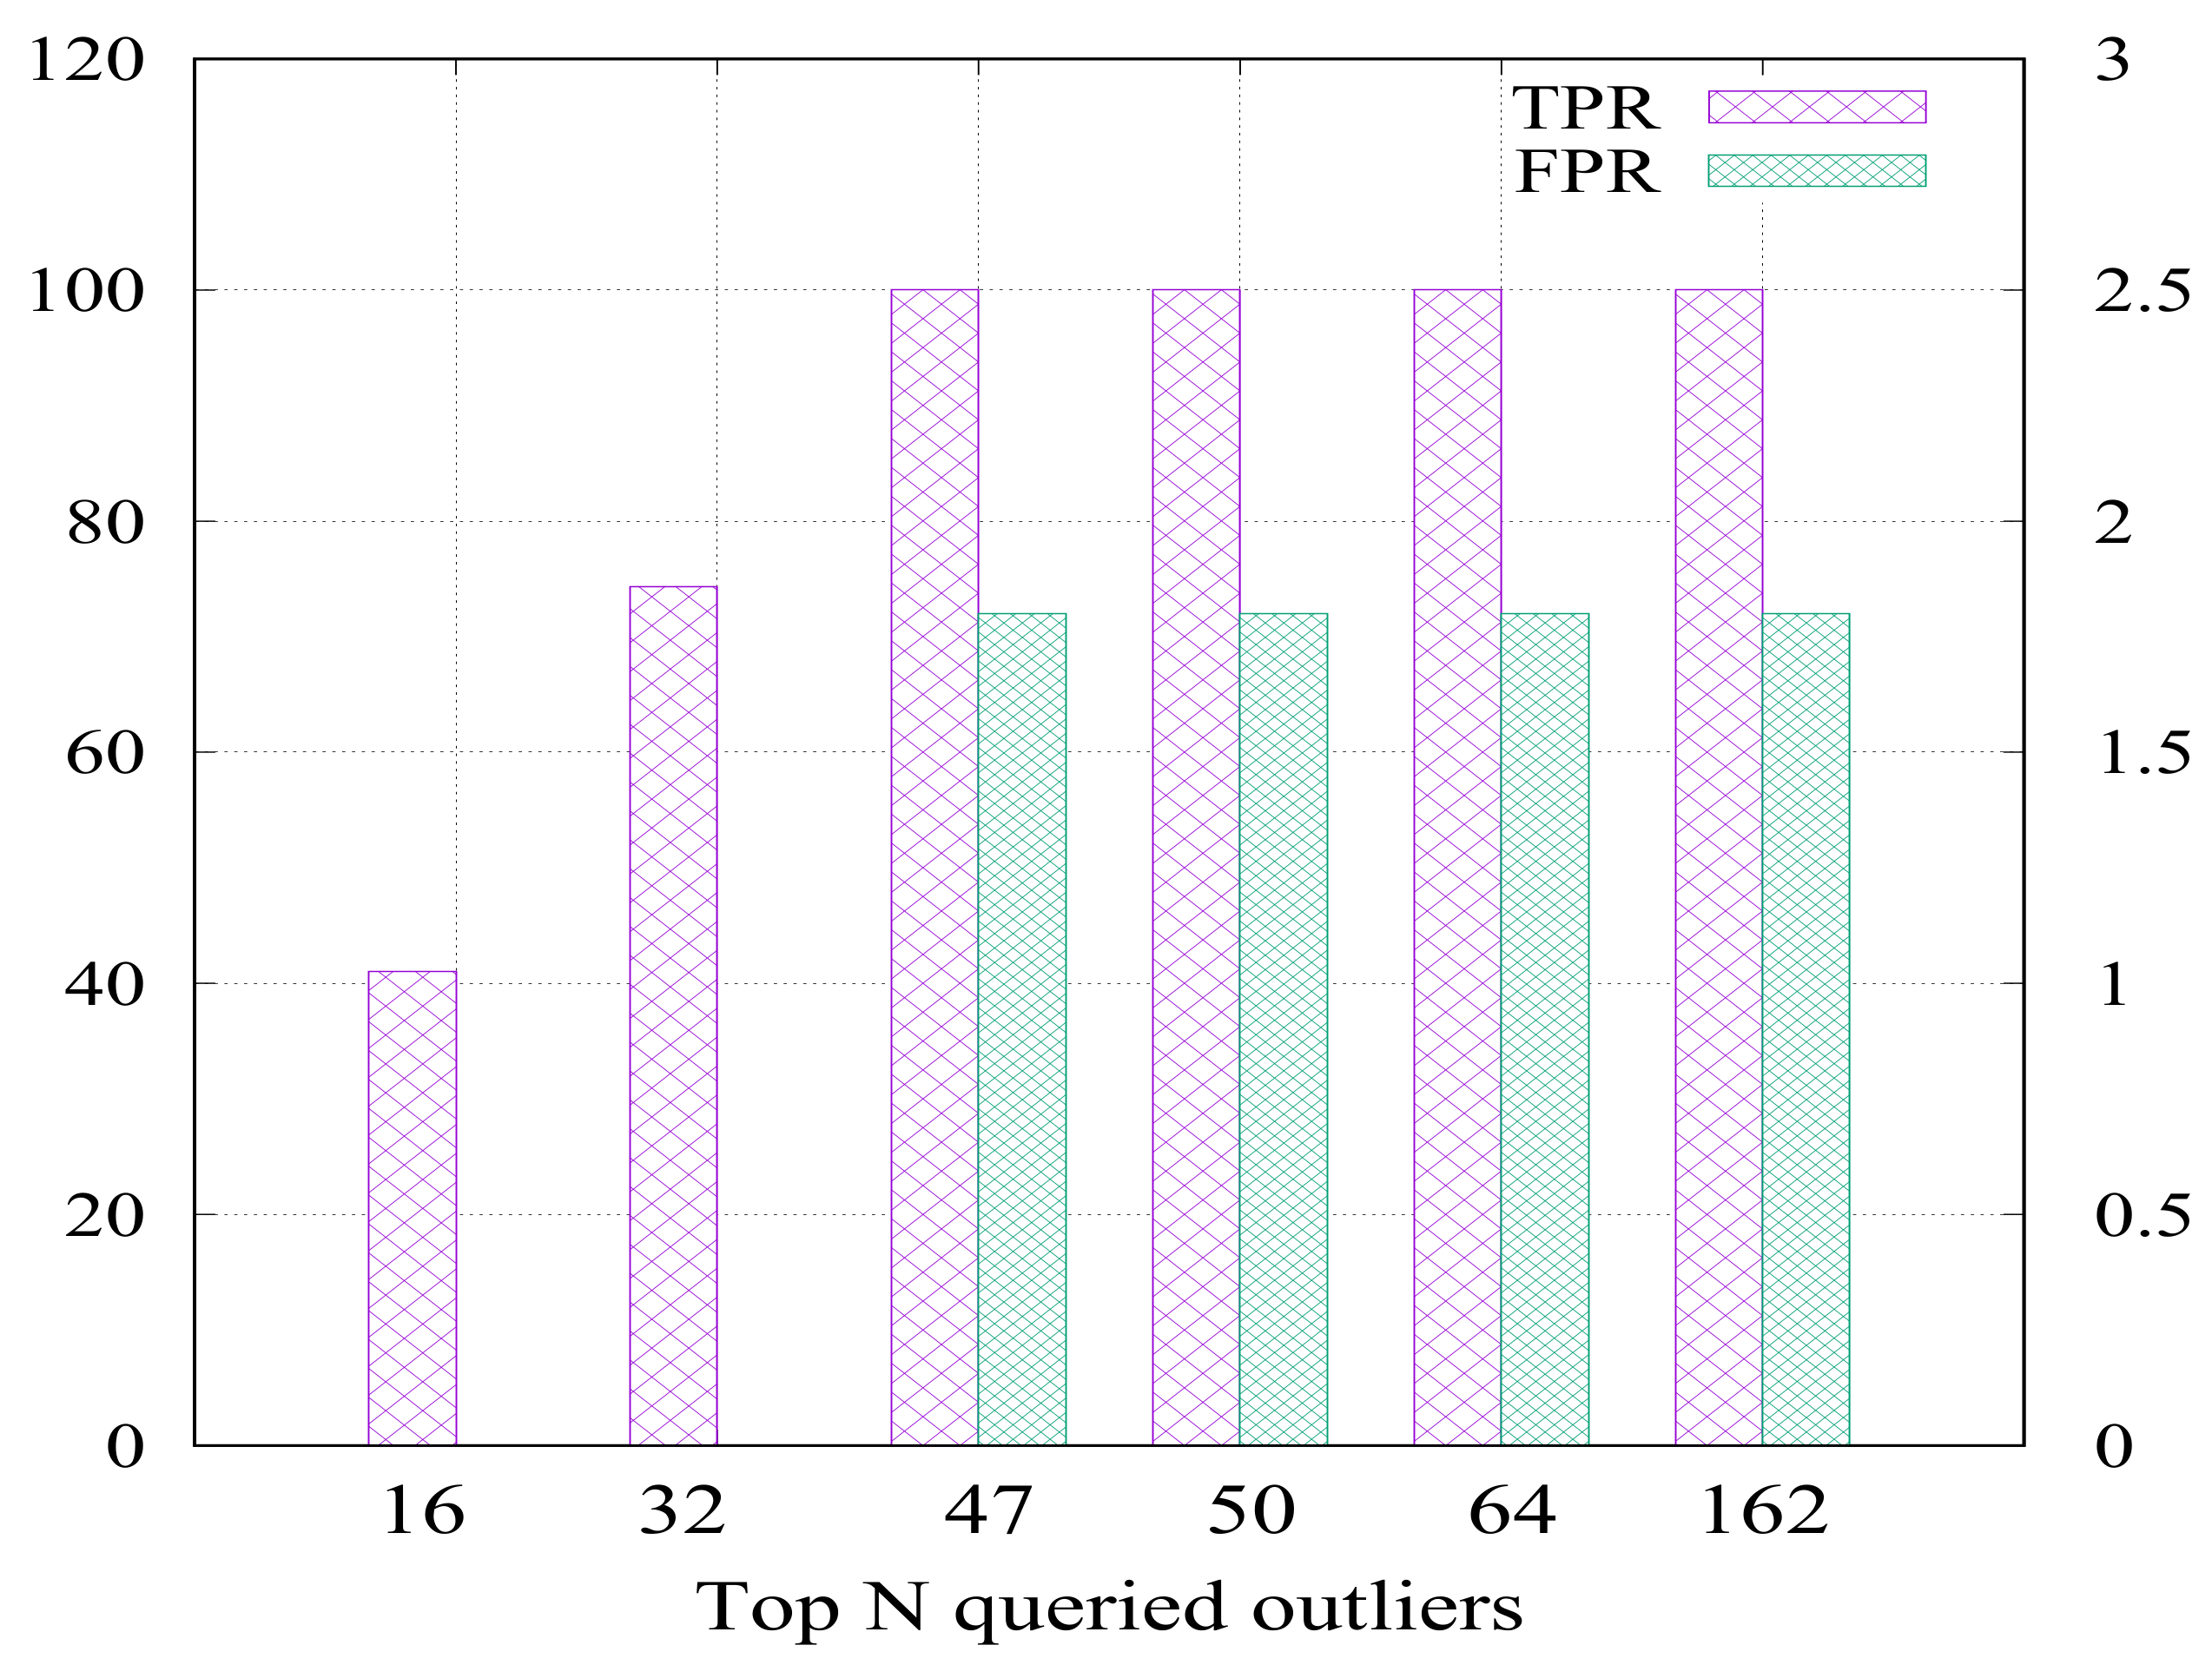
3.2.2. The Effect of the Number of Top Outliers Queried
In this section, we investigate the queried top outlier points (records) which have the highest outlierness factor. Figure 13 shows the true positive rate (TPR) for the proposed algorithm used in the offline phase at different number of queried outlier points (N). As shown, the detection rate of the proposed algorithm raises (until reaching 100% on the left scale) with the increase of the number of requested outlier points. Even with a number of points is as low as 47, OFCOD can achieve its maximum value of 100%. However, the FPR increases until it saturates at only 1.8% (at the right scale) without further increase. This highlights the stability of the proposed algorithm and how it outperforms the compared schemes (as shown in Figure 7 and Figure 8) whose FPRs are negatively affected by the increase of the number of queried outliers.
3.2.3. The OFCOD Performance When Varying the Test Set
Five different sized test sets are randomly constructed (from the WBC dataset) consisting of a number of inliers (normal points) and outliers. In order to validate the generalization performance of the proposed framework, majority of these points are new points which are not invoked in the offline stage. Each dataset has a different percentage of outliers. The generated datasets are with 5%, 15%, 20%, 25% and 31% outliers out of all outliers exist in the original dataset.
Table 2 and Table 3 exhibit the true positive rates and the false positive rates of the online stage, for each dataset with respect to the number of clusters. For instance, at , Table 2 shows that the TPR equals 100% for 5%, 15% and 20% datasets and slightly decreases with the increased number of points (25% dataset).This is acceptable due to the possibility of misclassification of at least one point. For the next requests of the same datasets (25% dataset) or the 31% dataset, the TPR increases again to reach 100%. This is due to the centroid re-adjustment feature of the online stage. A similar scenario occurs in Table 3 for the false positive rates. The results show consistent favorable performance of the true positive rates (high values) and the false positive rates (low values). These results confirm the generalization ability of the proposed framework due to its adaptive nature to adjust clusters’ centroids upon new requests.
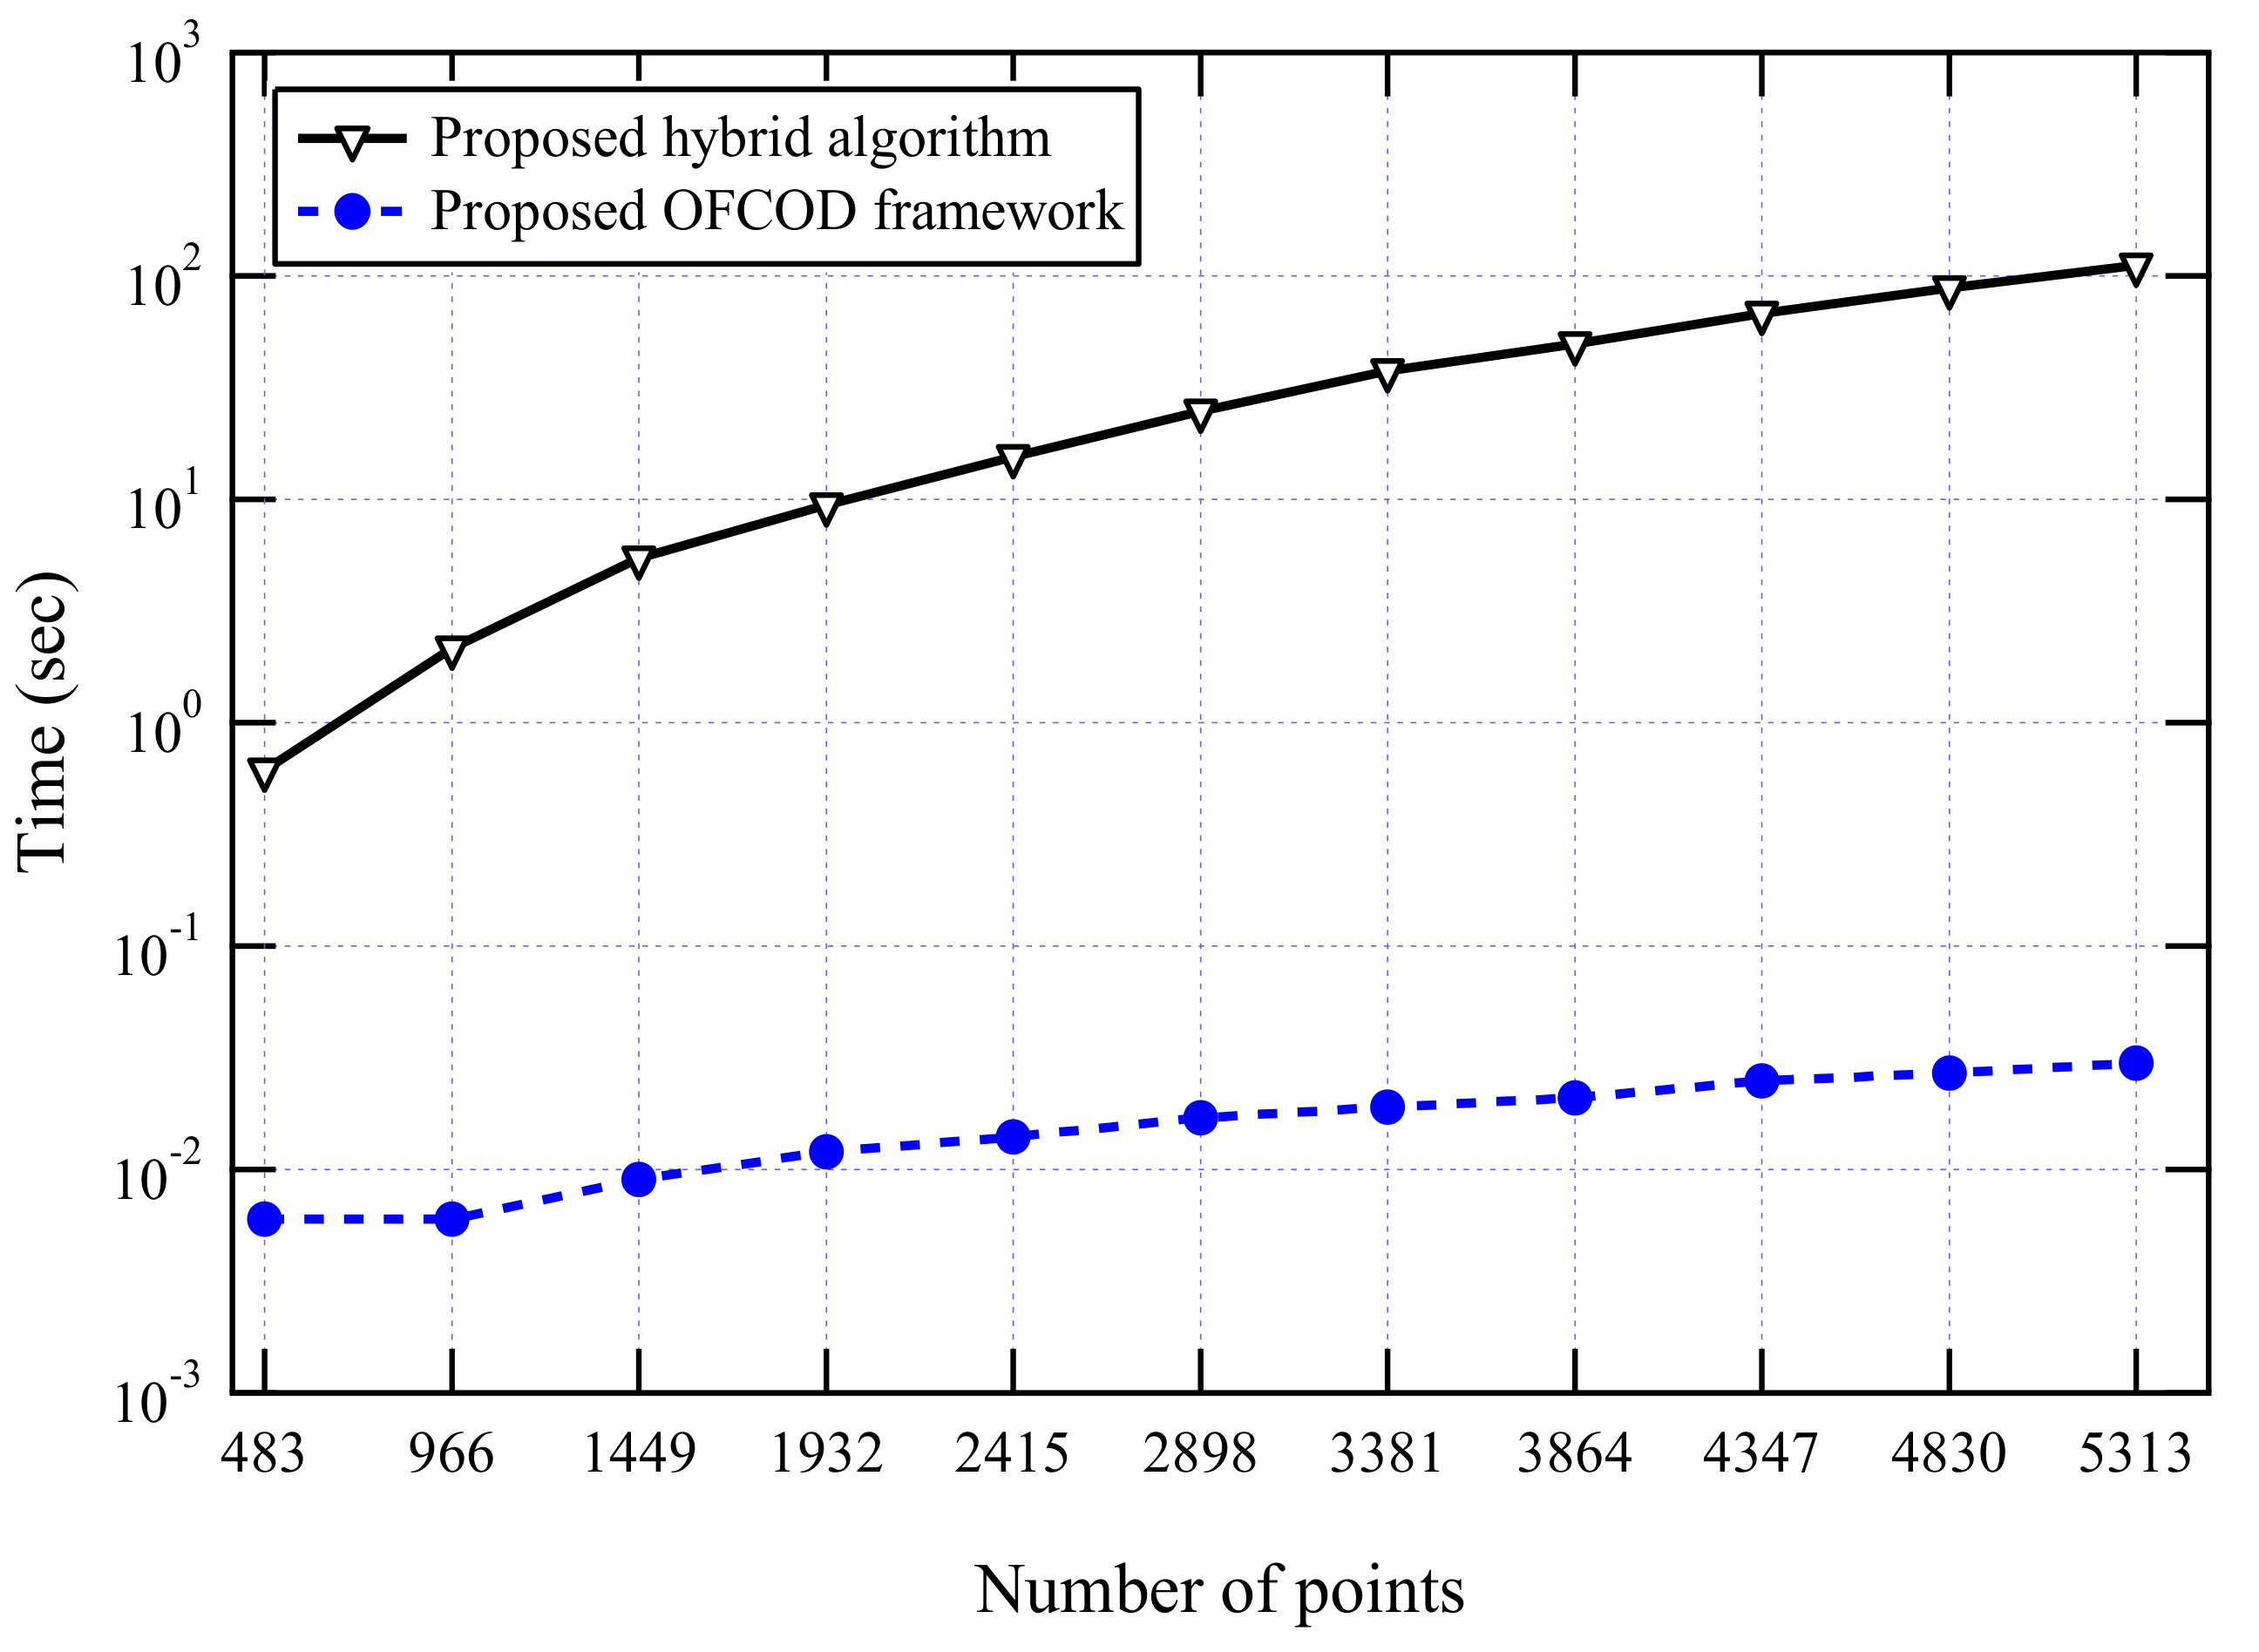
3.2.4. The OFCOD Response Time
The computational time of the proposed online stage of the framework is measured in order to show the response time. All experiments have been run on a 64-bit 2.2 GHz i5 CPU, Asus UX303 machine, Windows 10 and 12 GB of physical memory. Figure 14 shows the in-time response of the proposed on-the-fly framework is significantly better than the proposed traditional hybrid outlier detection algorithm. This is because the proposed framework has reduced run-time computations without the need to launch clustering from scratch.
3.2.5. Comparative Evaluation
We compute the TPR and FPR of the proposed algorithm on a test set which results in 99.58%. The accuracy of the proposed OFCOD framework is compared to K-SVM approach [39], KNN [40] and Lasso [40] on the same dataset to evaluate the performance of the proposed framework. In K-SVM approach [39], a k one-class support vector machine models are trained for normal data. It worths noting that, one-class SVM is a typical unsupervised learning technique which can define a hypersphere (i.e., a cluster) in which most of the normal points fall. During the testing stage (i.e., run-time), the K-SVM approach calculates the distance of each data point in question to the center of the K hyperspheres created in the training phase. Thereafter, the SVM model of the closest hypersphere to the point, is queried to classify either the point is inlier or outlier. Similarly, the K-Nearest Neighbor (KNN [40]) approach creates clusters inside each class of points. Therefore, any new instance is compared to the created clusters to find the most similar one to which the new instance belongs. On the other hand, the Lasso approach [40] transforms the anomaly detection problem into a linear regression model. It defines the detection parameters as regression variables and constructs the model (finding the regression variables) that maximizes the detection accuracy.
Table 4 shows that the proposed OFCOD platform outperforms all approaches in both the TPR and the FPR while maintaining the response time as small as low as 23 ms. This can be justified as the performance of K-SVM approach [39] depends heavily on the assumption that all hyperspheres only model normal data. This assumption cannot be justified and guaranteed since outliers can be grouped in small hyperspheres (clusters) as discussed in Section 2.1.3 and Section 2.1.4. The KNN approach [40] has the similar problem in addition to its limited generalization ability to unseen test instances. These issues lead to the worst results among others. On the contrary, the Lasso approach [40] relaxed this assumption leading to better results compared to the K-SVM and KNN approaches. In conclusion, the proposed OFCOD framework has the advantage of finding outliers in both outlier clusters and normal clusters which is the general case. Moreover, it has the ability to update clusters and re-adjust their centroids based on new queries.
3.2.6. Scalability Evaluation
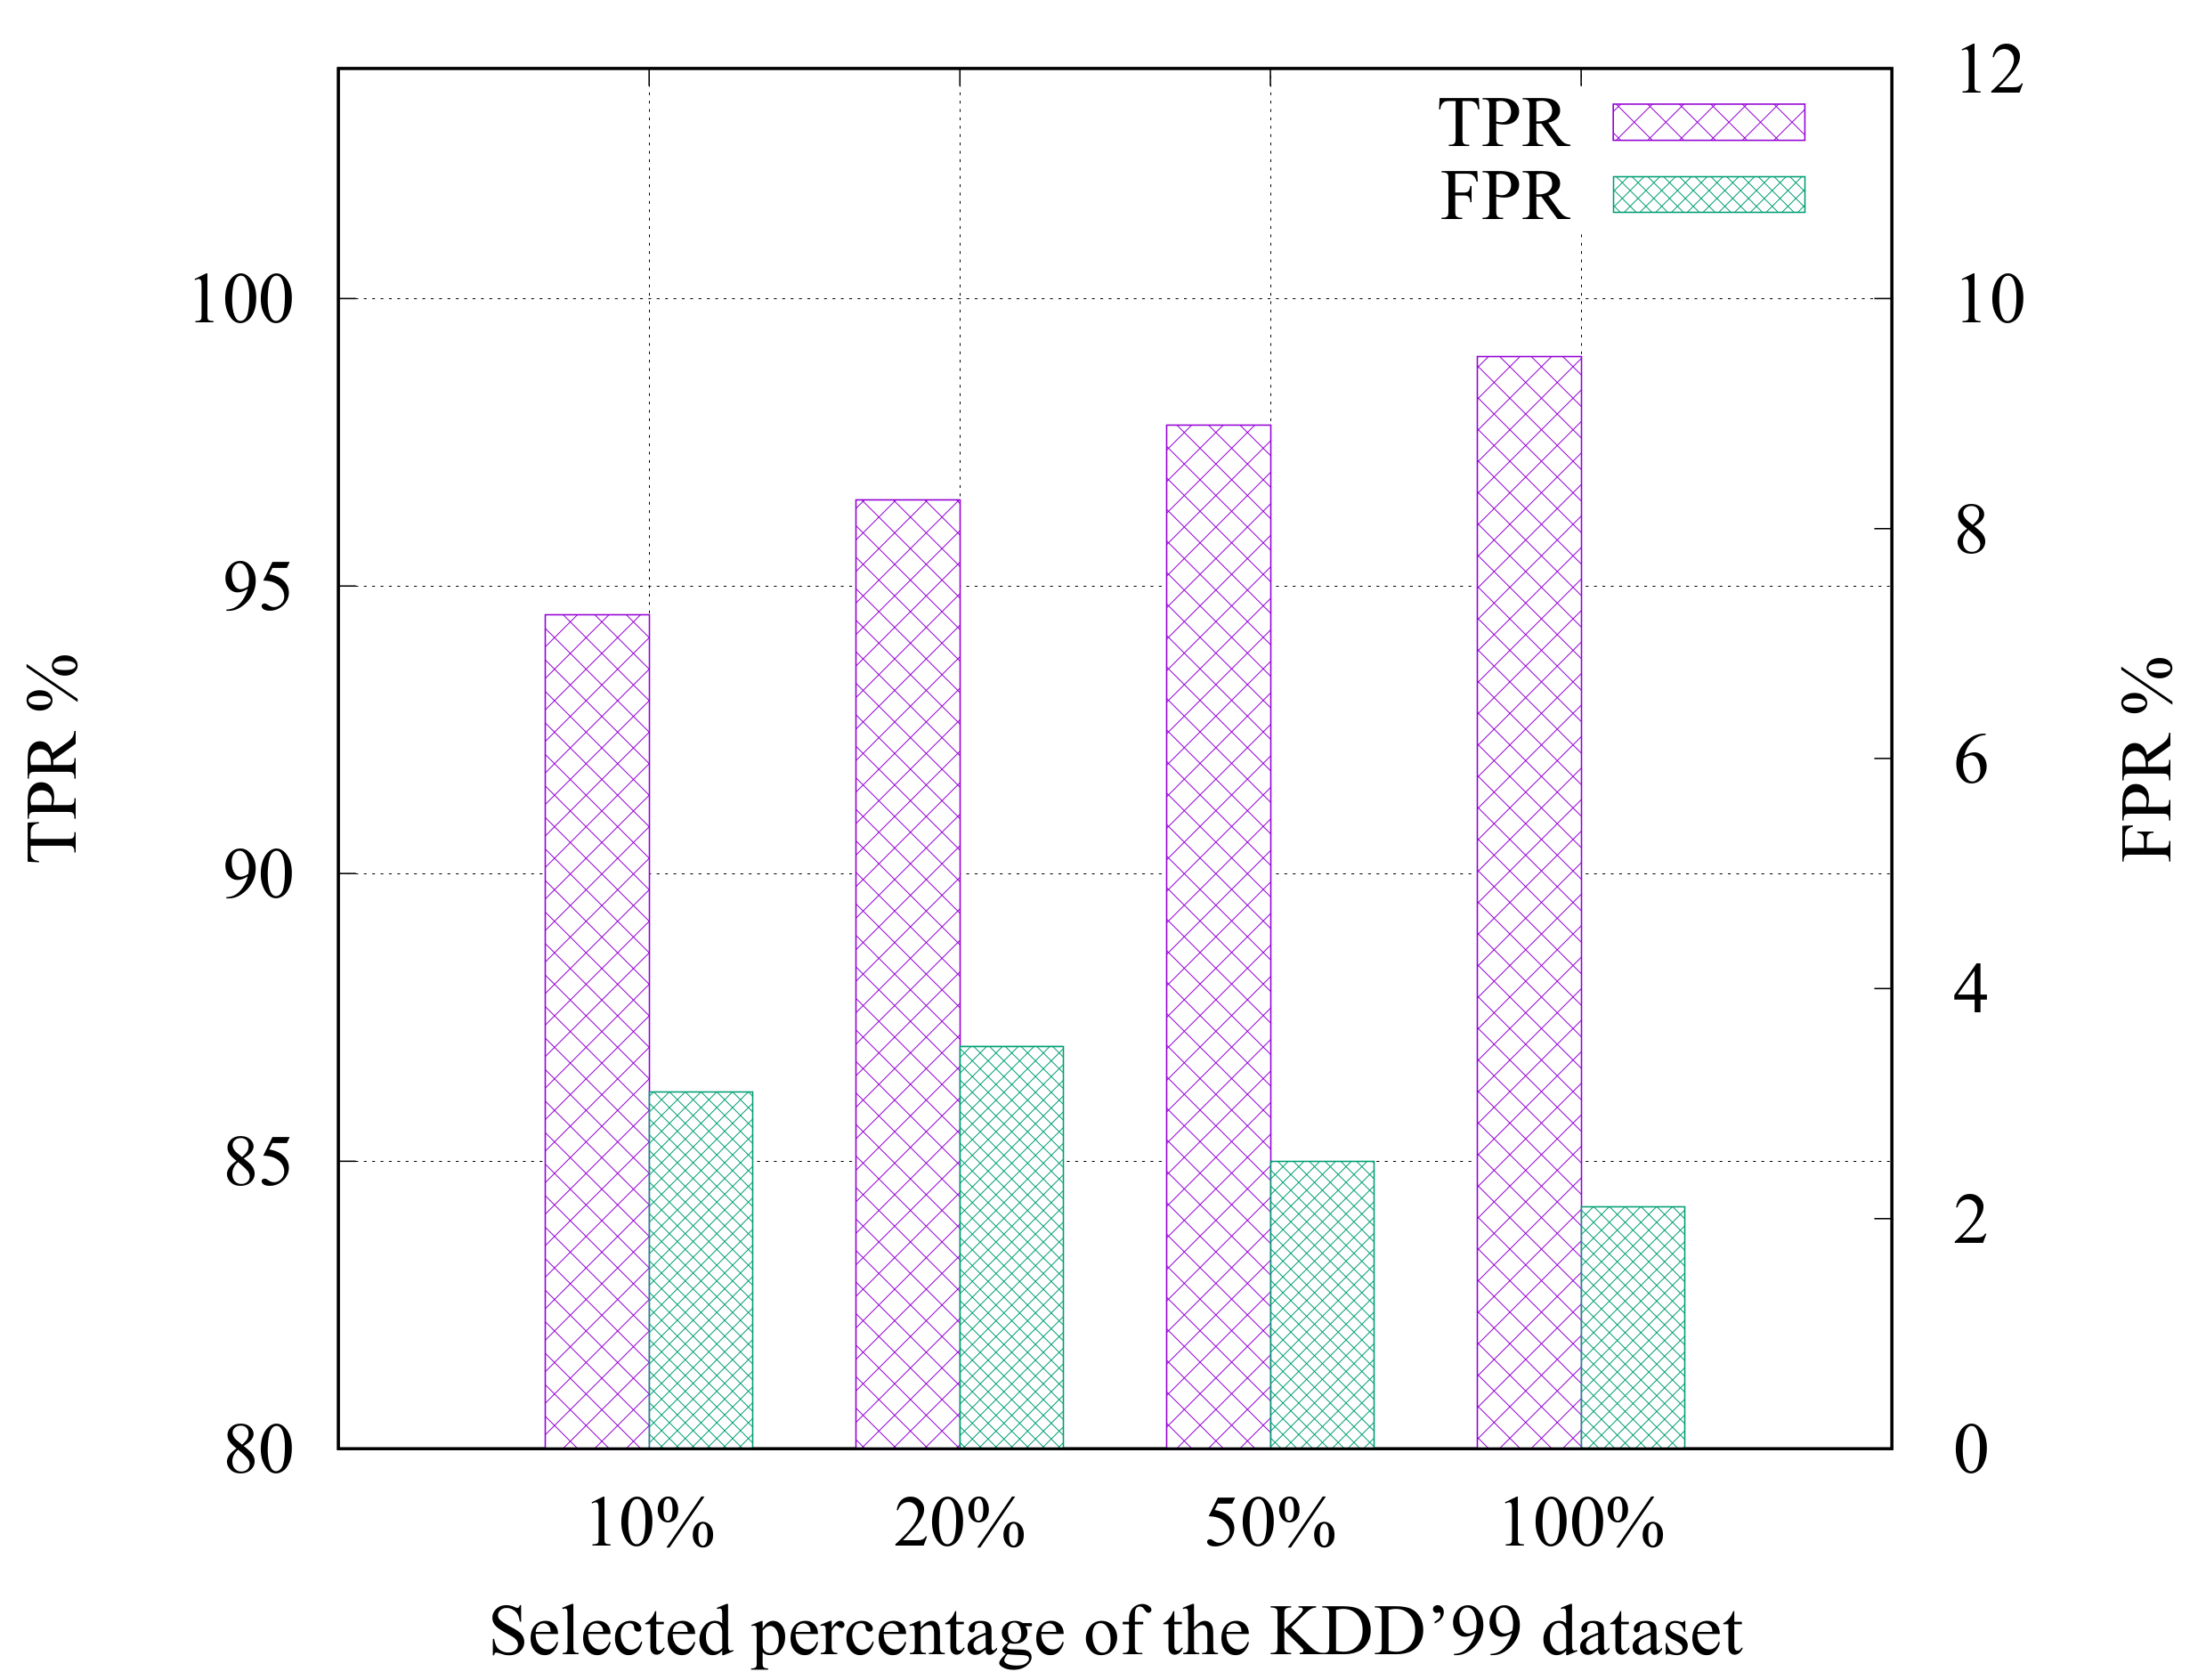
In this section, we evaluate the scalability of the proposed framework when applied to large datasets. For this purpose, the KDD’99 dataset described above is adopted. We used five million connections for learning purposes in the offline phase, and 300 K connections are used to test the overall OFCOD’s performance. To ensure the generalization ability of the proposed framework, the five million connections used in the offline phase are sampled to randomly generate four different datasets including 10% (500 K), 20% (1 M), 50% (2.5 M), and 100% (5 M) connections. The number of clusters that scores the best results are obtained at 52.
Figure 15 shows the TPR and FPR corresponding to each dataset. The figure shows that, the more available data for the offline phase of the framework, the better performance (i.e., increasing TPR and decreasing FPR). This can be justified due to ability of the proposed framework to build clusters with near perfect separable hyperplanes which facilitates the anomaly detection tasks. On the other hand, even with the availability of only relatively small subsets (e.g., 10% (500 K) and 20% (1 M)), the OFCOD framework is able to learn from the new queries and adjust the cluster centroids incrementally.
4. Conclusions
In this paper, an efficient and effective clustering-based outlier detection framework called OFCOD, that enables online detection of outliers, is presented. The framework includes two stages: offline stage and online stage. We optimize the offline stage calculations in order to enhance the clustering performance in outlier detection. Online stage achieves fast responsiveness to queries and reinforces the adaptive nature of the proposed framework. The experimental results show that the proposed framework outperforms the traditional clustering-based algorithms in terms of the detection rate and the false positive rate. In addition, it efficiently detects novel outliers in the real-time without any extensive calculations. The obtained results are very promising, paving the road for future research in different directions. Applying the proposed framework on distributed datasets located at different network sites for global outliers computation is one of these directions.
Author Contributions
Conceptualization, A.E., H.R. and A.M.S.; methodology, A.E.; software, H.R.; validation, A.E. and H.R.; formal analysis, A.E. and H.R.; writing—review and editing, A.E., H.R. and A.M.S. All authors have read and agreed to the published version of the manuscript.
Funding
This research received no external funding.
Institutional Review Board Statement
Not applicable.
Informed Consent Statement
Not applicable.
Data Availability Statement
The datasets presented in this study are openly available in: https://archive.ics.uci.edu/ml/datasets/Breast+Cancer+Wisconsin+(Diagnostic). http://kdd.ics.uci.edu/databases/kddcup99/kddcup99.
Acknowledgments
The authors would like to thank the Deanship of Scientific Research in Prince Sattam Bin Abdelaziz University, KSA for his support during the stages of this research.
Conflicts of Interest
The authors declare no conflict of interest.
References
- Simon, H.; Hongxing, H.; Graham, W.; Rohan, B. Outlier Detection Using Replicator Neural Networks. In Data Warehousing and Knowledge Discovery; Springer: Berlin/Heidelberg, Germany, 2002; pp. 170–180. [Google Scholar]
- Gagniuc, P.; Ionescu-Tirgoviste, C.; Radulescu, C.H. Automatic Growth Detection of Cell Cultures through Outlier Techniques using 2D Images. Int. J. Comput. Commun. 2013, 8, 407–415. [Google Scholar] [CrossRef] [Green Version]
- Han, J.; Kamber, M.; Pei, J. Data Mining: Concepts and Techniques; Elsevier: Amsterdam, The Netherlands, 2012; Volume 3. [Google Scholar]
- Markus, B.; Hans-Peter, K.; Raymond, N.; Jörg, S. LOF: Identifying Density-based Local Outliers. SIGMOD Rec. 2000, 29, 93–104. [Google Scholar]
- Lei, C.; Mingrui, W.; Di, Y.; Elke, R. Online Outlier Exploration Over Large Datasets. In Proceedings of the KDD ’15, 21th ACM SIGKDD International Conference on Knowledge Discovery and Data Mining, Sydney, Australia, 10–13 August 2015; ACM: New York, NY, USA, 2015; pp. 89–98. [Google Scholar]
- Howsalya, D.; Devi, I. Outlier Detection Algorithm Combined with Decision Tree Classifier for Early Diagnosis of Breast Cancer. Int. J. Adv. Eng. Technol. 2009, 7, 93–98. [Google Scholar]
- Jianhua, G.; Wei, H.; Billy, W. Real time traffic flow outlier detection using short-term traffic conditional variance prediction. Transp. Res. Part C Emerg. Technol. 2014, 50, 160–172. [Google Scholar]
- Xiaodan, X.; Huawen, L.; Minghai, Y. Recent Progress of Anomaly Detection. Complexity 2019, 2019, 1–11. [Google Scholar] [CrossRef]
- Jatindra, P.; Sukumar, N. An Outlier Detection Method Based on Clustering. In Proceedings of the 2011 Second International Conference on Emerging Applications of Information Technology, Kolkata, India, 19–20 February 2011; pp. 253–256. [Google Scholar]
- Chawla, S.; Gionis, A. k-means-: A Unified Approach to Clustering and Outlier Detection; SDM: Bethesda, MD, USA, 2013. [Google Scholar]
- Kanishka, B.; Bryan, M.; Chris, G. Algorithms for Speeding Up Distance-based Outlier Detection. In Proceedings of the KDD ’11, 17th ACM SIGKDD International Conference on Knowledge Discovery and Data Mining, San Diego, CA, USA, 21–24 August 2011; pp. 859–867. [Google Scholar]
- Xu, X.; Li, H.L.; Yao, M. A Comparison of Outlier Detection Techniques for High-Dimensional Data. Int. J. Comput. Intell. Syst. 2018, 11, 652–662. [Google Scholar] [CrossRef] [Green Version]
- Bendechache, M.; Tari, A.K.; Kechadi, M. Parallel and distributed clustering framework for big spatial data mining. Int. J. Parallel Emergent Distrib. Syst. 2019, 34, 671–689. [Google Scholar] [CrossRef]
- Santhi, P.; Bhaskaran, V.M. Improving the Efficiency of Image Clustering using Modified Non Euclidean Distance Measures in Data Mining. Int. Comput. Commun. 2014, 9, 56–61. [Google Scholar]
- Kamal, M.; Harsh, S.; Gursharanjeet, K. Comparative Analysis of Outlier Detection Techniques. Int. J. Comput. Appl. 2014, 97, 12–21. [Google Scholar] [CrossRef]
- Ricardo, C.; Davoud, M.; Arthur, Z.; Jörg, S. Hierarchical Density Estimates for Data Clustering, Visualization, and Outlier Detection. ACM Trans. Knowl. Discov. Data 2015, 10, 5:1–5:51. [Google Scholar]
- Edwin, K.; Raymond, N. Finding Intensional Knowledge of Distance-Based Outliers. In Proceedings of the VLDB ’99, 25th International Conference on Very Large Data Bases, Edinburgh, UK, 7–10 September 1999; Morgan Kaufmann Publishers Inc.: San Mateo, CA, USA, 1999; pp. 211–222. [Google Scholar]
- Amol, G.; Srinivasan, P.; Eric, O. Fast mining of distance-based outliers in high-dimensional datasets. Data Min. Knowl. Discov. 2008, 16, 349–364. [Google Scholar]
- Tang, B.; He, H. A Local Density-Based Approach for Local Outlier Detection. arXiv 2016, arXiv:1606.08538. [Google Scholar] [CrossRef] [Green Version]
- Su, S.; Xiao, L.; Zhang, Z.; Gu, F.; Ruan, L.; Li, S.; He, Z.; Huo, Z.; Yan, B.; Wang, H.; et al. N2DLOF: A New Local Density-Based Outlier Detection Approach for Scattered Data. In Proceedings of the 2017 IEEE 19th International Conference on High Performance Computing and Communications, Bangkok, Thailand, 18–20 December 2017; pp. 458–465. [Google Scholar]
- He, Z.; Xu, X.; Deng, S. Discovering Cluster Based Local Outliers. Pattern Recognit. Lett. 2003, 2003, 9–10. [Google Scholar] [CrossRef]
- Jiang, S.; An, Q. Clustering-Based Outlier Detection Method. In Proceedings of the 2008 Fifth International Conference on Fuzzy Systems and Knowledge Discovery, Shandong, China, 18–20 October 2008; Volume 2, pp. 429–433. [Google Scholar]
- Rizk, H.; Elgokhy, S.; Sarhan, A. A hybrid outlier detection algorithm based on partitioning clustering and density measures. In Proceedings of the Tenth International Conference on Computer Engineering & Systems (ICCES), Cairo, Egypt, 23–24 December 2015; pp. 175–181. [Google Scholar]
- Elbasiony, R.M.; Sallam, E.A.; Eltobely, T.E.; Fahmy, M.M. A hybrid network intrusion detection framework based on random forests and weighted k-means. Ain Shams Eng. J. 2013, 4, 753–762. [Google Scholar] [CrossRef] [Green Version]
- Edwin, K.; Raymond, N.; Vladimir, T. Distance-based Outliers: Algorithms and Applications. Vldb J. 2000, 8, 237–253. [Google Scholar]
- Maria, K.; Anastasios, G.; Apostolos, P.; Kostas, T.; Yannis, M. Efficient and Flexible Algorithms for Monitoring Distance-based Outliers over Data Streams. Inf. Syst. 2016, 55, 37–53. [Google Scholar]
- Justin, Z. Privacy preserving K-medoids clustering. In Proceedings of the 2007 IEEE International Conference on Systems, Man and Cybernetics, Montreal, QC, Canada, 7–10 October 2007. [Google Scholar]
- Shaukat, K.; Masood, N.; Shafaat, A.; Jabbar, K.; Shabbir, H.; Shabbir, S. Dengue Fever in Perspective of Clustering Algorithms. J. Data Min. Genom. Proteom. 2015, 6, 3. [Google Scholar]
- Jaing, M.F.; Tseng, S.S.; Su, C.M. Two-phase Clustering Process for Outliers Detection. Pattern Recogn. Lett. 2001, 22, 691–700. [Google Scholar] [CrossRef]
- Nirmal, S. Comparative Study between K-Means and K-Medoids Clustering Algorithms. J. Classif. 2019, 6, 839–844. [Google Scholar]
- Budiaji, W.; Leisch, F. Simple K-Medoids Partitioning Algorithm for Mixed Variable Data. Algorithms 2019, 12, 1–15. [Google Scholar] [CrossRef] [Green Version]
- Archana, S.; Yadav, A.; Rana, A. K-means with Three different Distance Metrics. Int. J. Comput. Appl. 2013, 67, 13–17. [Google Scholar]
- Victoria, H.; Jim, A. A Survey of Outlier Detection Methodologies. Artif. Intell. Rev. 2004, 22, 85–126. [Google Scholar]
- Park, H.S.; Jun, C.H. A simple and fast algorithm for K-medoids clustering. Expert Syst. Appl. 2009, 36, 3336–3341. [Google Scholar] [CrossRef]
- Anna, K.; Michael, G. A fast outlier detection strategy for distributed high-dimensional data sets with mixed attributes. Data Min. Knowl. Discov. 2010, 20, 259–289. [Google Scholar]
- Fawcett, T. An introduction to ROC analysis. Pattern Recognit. Lett. 2006, 27, 861–874. [Google Scholar] [CrossRef]
- Wolberg, W.; Street, W.; Mangasarian, O. UCI Repository of Machine Learning Databases: Breast Cancer Wisconsin (Diagnostic) Data Set; UCI: Irvine, CA, USA, 1998. [Google Scholar]
- KDD’99: The KDD Intrusion Detection Dataset. 1999. Available online: http://kdd.ics.uci.edu/databases/kddcup99/kddcup99.html (accessed on 20 December 2020).
- Zheng, B.; Yoon, S.; Lam, S. Breast cancer diagnosis based on feature extraction using a hybrid of K-means and support vector machine algorithms. Expert Syst. Appl. 2014, 41, 1476–1482. [Google Scholar] [CrossRef]
- Shanxiong, C.; Maoling, P.; Hailing, X.; Sheng, W. An anomaly detection method based on Lasso. Clust. Comput. 2017, 22. [Google Scholar] [CrossRef]
Figure 1.
On the fly clustering-based outlier detection (OFCOD).

Figure 2.
Modified distance calculation of K-Medoids algorithm.
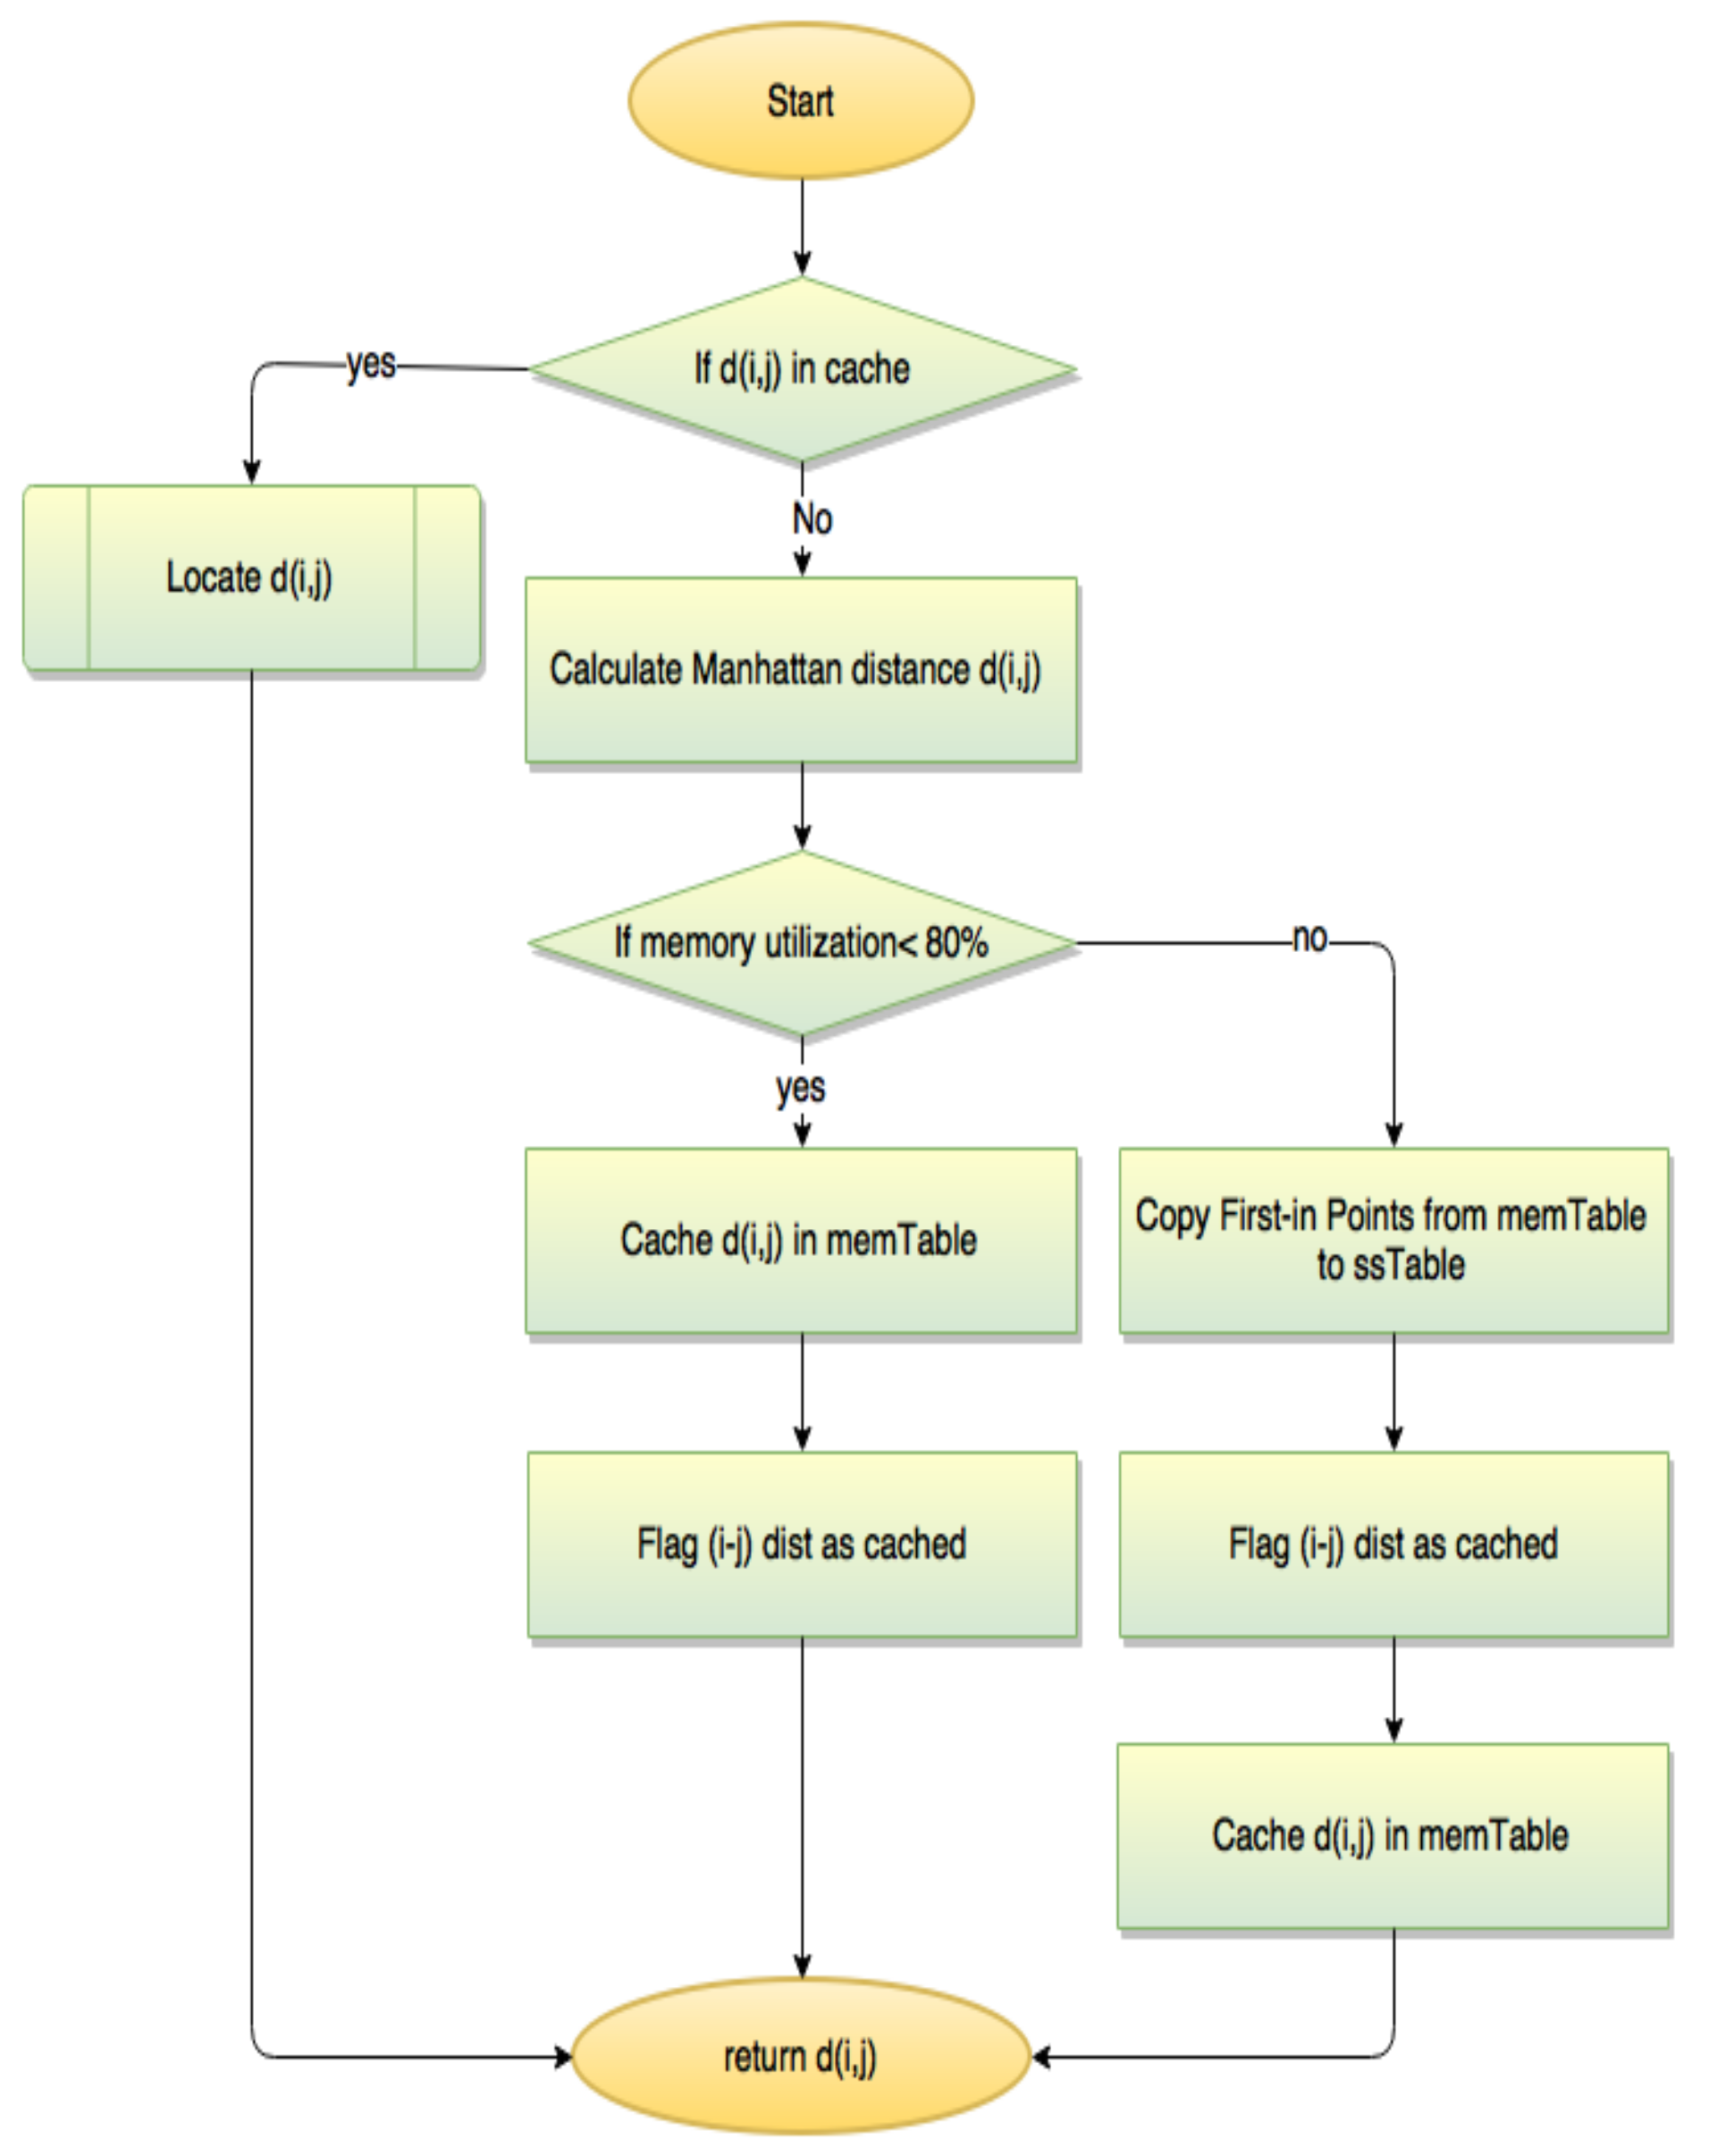
Figure 3.
True and portable outliers of an outlier cluster. (Figure 3, Figure 4, Figure 5, Figure 6, Figure 7, Figure 8 and Figure 9 are based on “A hybrid outlier detection algorithm based on partitioning clustering and density measures”, by Hamada Rizk et al. which appeared in 2015 Tenth International Conference on Computer Engineering & Systems (ICCES). © [2015] IEEE.)

Figure 4.
Inliers and probable outliers of a normal cluster.

Figure 5.
Finding Local Outlier Factor (LOF) for probable outliers of a normal cluster.

Figure 6.
Finding LOF for probable outliers of an outlier cluster.

Figure 7.
True positive rates at different number of points.
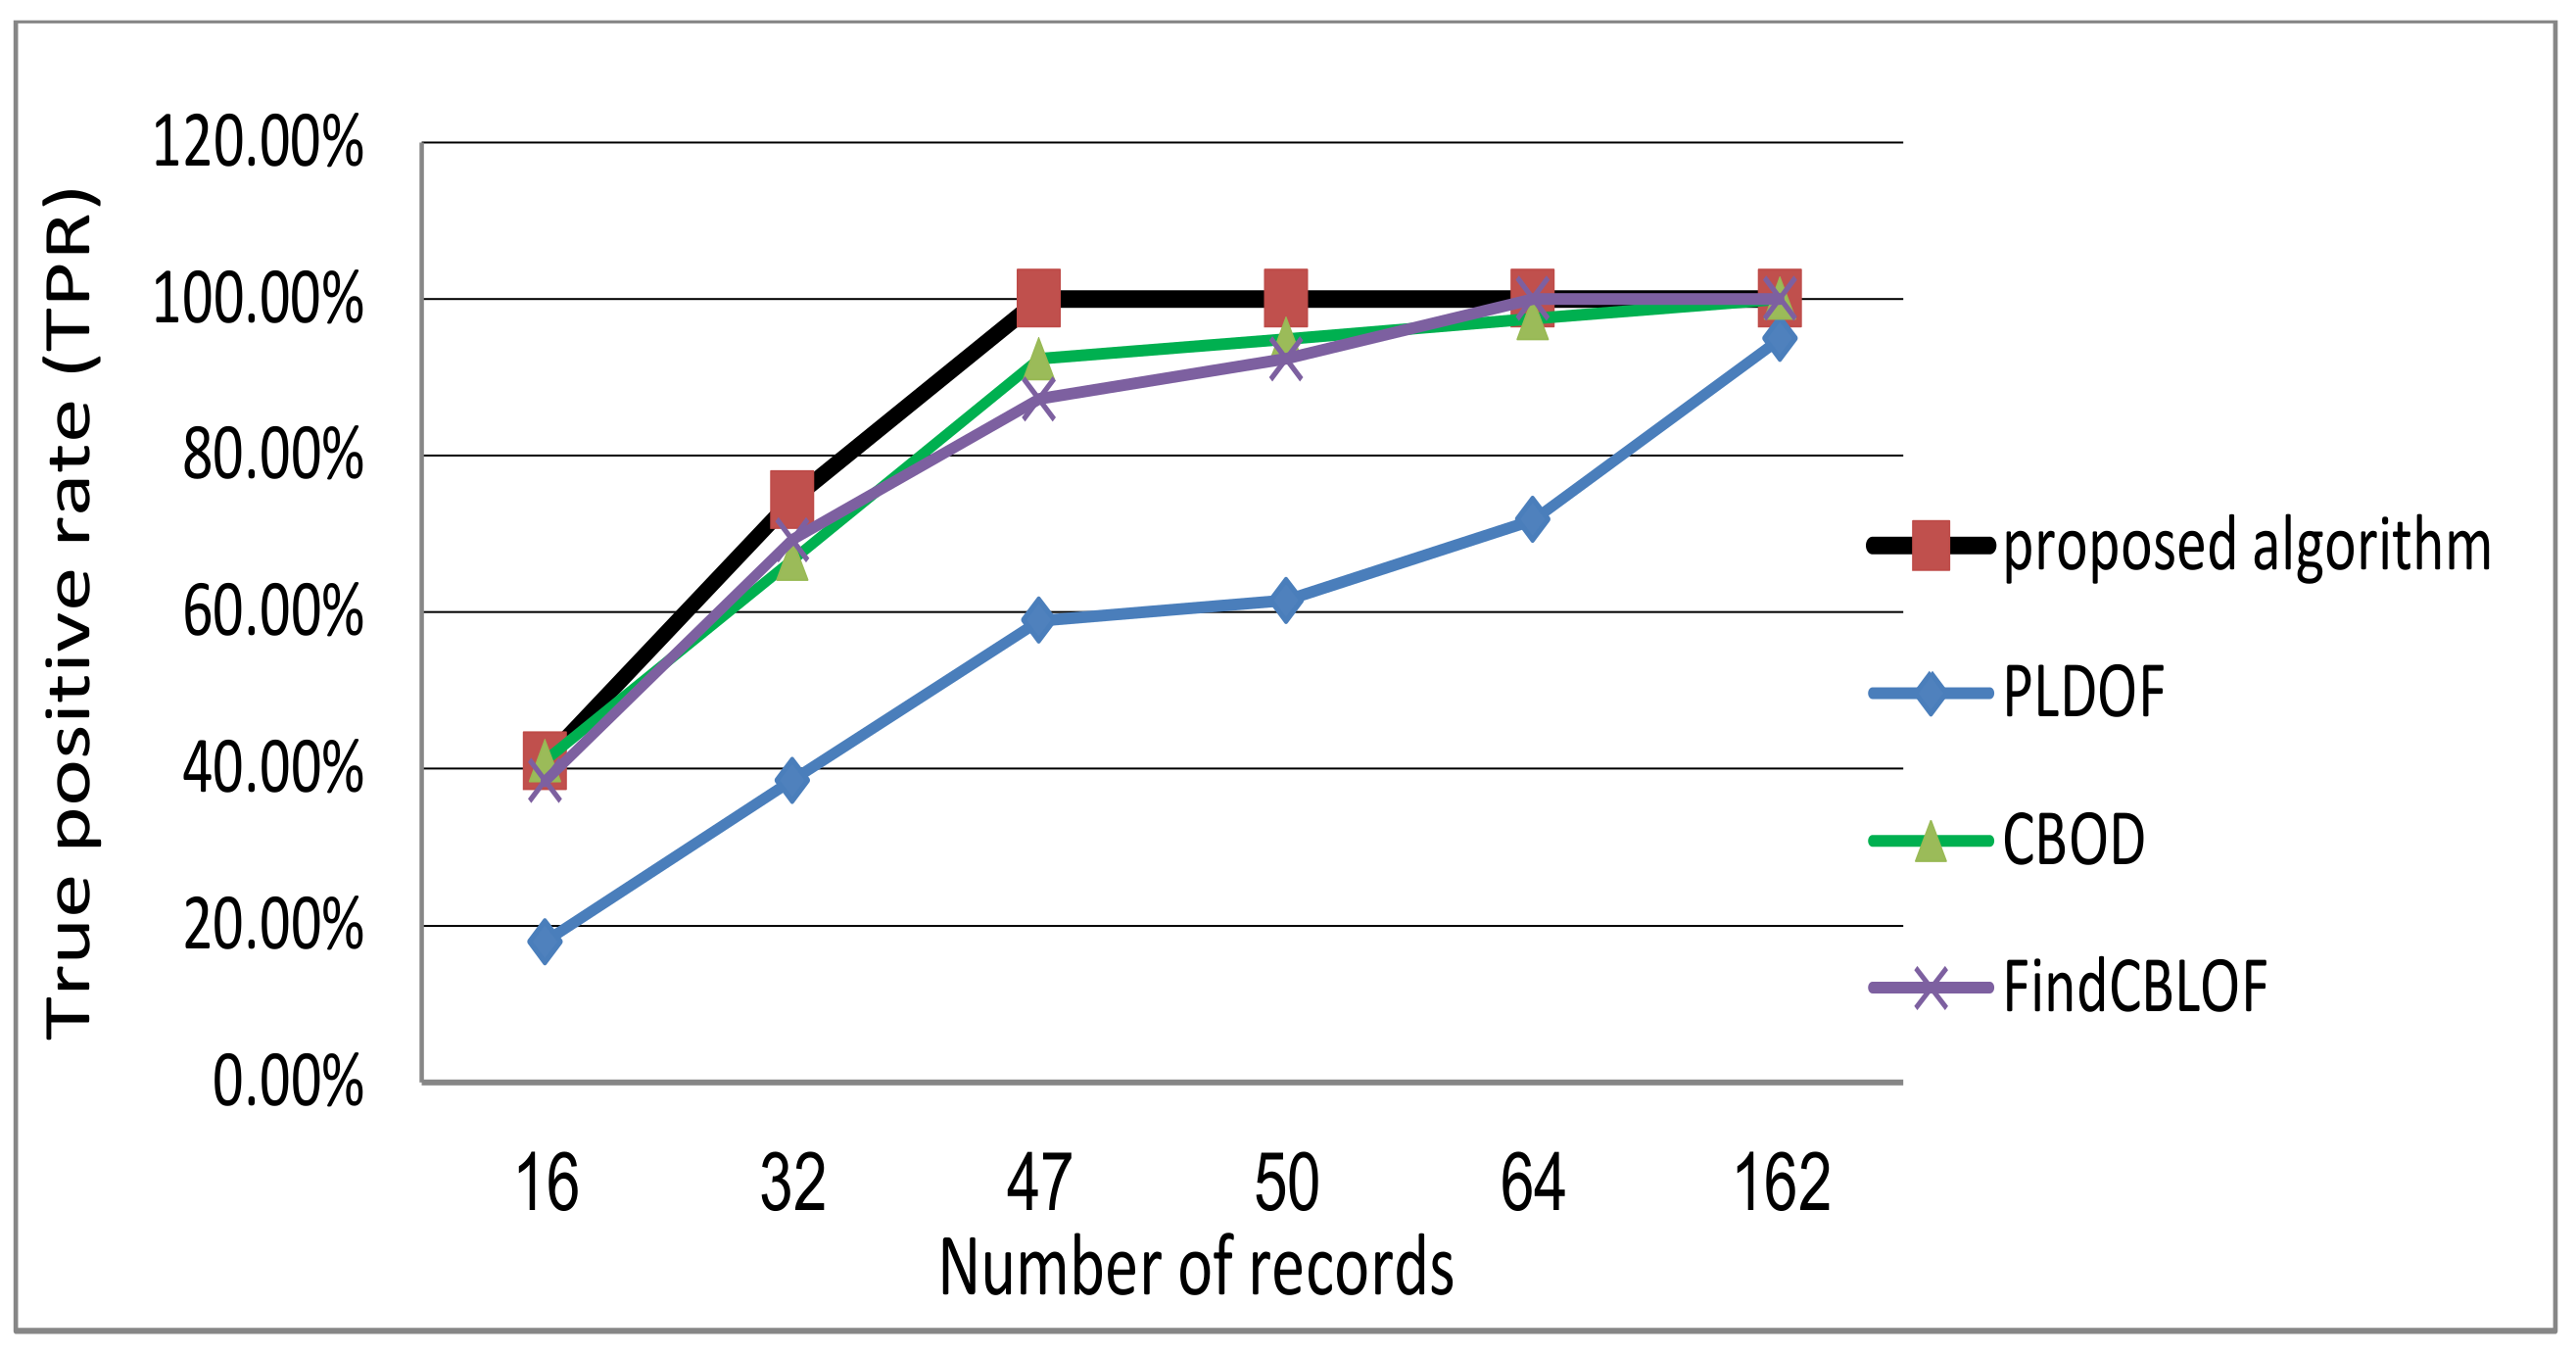
Figure 8.
False positive rates at different number of points.

Figure 9.
Average TPR, FPR and OF calculations.

Figure 10.
The effect of K-Medoids modification on time performance (log scale) of the proposed algorithm.
Figure 10.
The effect of K-Medoids modification on time performance (log scale) of the proposed algorithm.

Figure 11.
The effect of OF calculations on time performance (log scale) of the proposed algorithm.

Figure 12.
The effect of changing K on TPR and FPR.

Figure 13.
The effect of changing N on TPR and FPR.

Figure 14.
The response time (log scale) of the proposed hybrid algorithm vs. the proposed OFCOD framework.
Figure 14.
The response time (log scale) of the proposed hybrid algorithm vs. the proposed OFCOD framework.

Figure 15.
Scalability evaluation when applying OFCOD to detect intrusions/outliers from the KDD’99 dataset.
Figure 15.
Scalability evaluation when applying OFCOD to detect intrusions/outliers from the KDD’99 dataset.


Table 1.
True positive rate (TPR) and false positive rate (FPR) Values.
| Number of Points (Top Ratio) | Proposed Algorithm | PLDOF [9] | CBOD [22] | FindCBLOF [21] | ||||
|---|---|---|---|---|---|---|---|---|
| TPR | FPR | TPR | FPR | TPR | FPR | TPR | FPR | |
| 16 | 41.03% | 0% | 17.8% | 2.03% | 41.03% | 0% | 38.46% | 0.23% |
| 32 | 74.36% | 0.67% | 38.5% | 3.82% | 66.67% | 1.35% | 69.23% | 1.13% |
| 47 | 94.87% | 1.8% | 58.9% | 5.4% | 92.31% | 2.48% | 87.18% | 2.93% |
| 50 | 100% | 1.8% | 61.5% | 5.85% | 94.87% | 2.93% | 92.3% | 3.15% |
| 64 | 100% | 1.8% | 71.79% | 8.11% | 97.44% | 5.8% | 100% | 5.63% |
| 162 | 100% | 1.8% | 94.87% | 27.7% | 100% | 27.7% | 100% | 27.7% |
Table 2.
TPR of the proposed online stage of OFCOD framework.
| K | Percent of Points to Check | ||||
|---|---|---|---|---|---|
| 5% | 15% | 20% | 25% | 31% | |
| 2 | 100% | 100% | 100% | 99.39% | 99.5% |
| 4 | 100% | 97.93% | 100% | 95.7% | 99.5% |
| 6 | 96.77% | 100% | 100% | 99.39% | 99% |
| 8 | 100% | 100% | 100% | 99.39% | 100% |
| 9 | 96.77% | 94.84% | 93.89% | 92.64% | 92.57% |
| 10 | 96.77% | 95.88% | 93.89% | 91.41% | 92.1% |
Table 3.
FPR of the proposed online stage of OFCOD framework.
| K | Percent of Points to Check | ||||
|---|---|---|---|---|---|
| 5% | 15% | 20% | 25% | 31% | |
| 2 | 33.33% | 12.5% | 22.22% | 9.1% | 14.82% |
| 4 | 33.33% | 12.5% | 11.11% | 0% | 7.14% |
| 6 | 33.33% | 12.5% | 22.22% | 9.1 | 7.14% |
| 8 | 33.33% | 12.5% | 11.11% | 0% | 7.14% |
| 9 | 33.33% | 12.5% | 11.11% | 0% | 7.14% |
| 10 | 33.33% | 12.5% | 22.22% | 0% | 7.14% |
Publisher’s Note: MDPI stays neutral with regard to jurisdictional claims in published maps and institutional affiliations. |
© 2020 by the authors. Licensee MDPI, Basel, Switzerland. This article is an open access article distributed under the terms and conditions of the Creative Commons Attribution (CC BY) license (http://creativecommons.org/licenses/by/4.0/).
Share and Cite
MDPI and ACS Style
Elmogy, A.; Rizk, H.; Sarhan, A.M. OFCOD: On the Fly Clustering Based Outlier Detection Framework. Data 2021, 6, 1. https://0-doi-org.brum.beds.ac.uk/10.3390/data6010001
AMA Style
Elmogy A, Rizk H, Sarhan AM. OFCOD: On the Fly Clustering Based Outlier Detection Framework. Data. 2021; 6(1):1. https://0-doi-org.brum.beds.ac.uk/10.3390/data6010001
Chicago/Turabian StyleElmogy, Ahmed, Hamada Rizk, and Amany M. Sarhan. 2021. "OFCOD: On the Fly Clustering Based Outlier Detection Framework" Data 6, no. 1: 1. https://0-doi-org.brum.beds.ac.uk/10.3390/data6010001