Human Activity Vibrations
by
 , ,
, ,
Sakdirat Kaewunruen
1,* ,
,
Jessada Sresakoolchai
1 ,
,
Junhui Huang
1,
Satoru Harada
2 and
Wisinee Wisetjindawat
2 1
School of Engineering, University of Birmingham, Birmingham B15 2TT, UK
2
Hitachi Europe Limited, ERD Office, 12th Floor, 125 London Wall, London EC2Y 5AL, UK
*
Author to whom correspondence should be addressed.
Data 2021, 6(10), 104; https://0-doi-org.brum.beds.ac.uk/10.3390/data6100104
Submission received: 6 September 2021
/
Revised: 29 September 2021
/
Accepted: 29 September 2021
/
Published: 30 September 2021
Abstract
:We present a unique, comprehensive dataset that provides the pattern of five activities walking, cycling, taking a train, a bus, or a taxi. The measurements are carried out by embedded sensor accelerometers in smartphones. The dataset offers dynamic responses of subjects carrying smartphones in varied styles as they perform the five activities through vibrations acquired by accelerometers. The dataset contains corresponding time stamps and vibrations in three directions longitudinal, horizontal, and vertically stored in an Excel Macro-enabled Workbook (xlsm) format that can be used to train an AI model in a smartphone which has the potential to collect people’s vibration data and decide what movement is being conducted. Moreover, with more data received, the database can be updated and used to train the model with a larger dataset. The prevalence of the smartphone opens the door to crowdsensing, which leads to the pattern of people taking public transport being understood. Furthermore, the time consumed in each activity is available in the dataset. Therefore, with a better understanding of people using public transport, services and schedules can be planned perceptively.
Dataset License: Creative Commons Attribution 4.0 International.
1. Introduction
Smartphones are growing prevalent in people’s daily lives. With the embedded high capability sensors like gyroscopes, accelerometers, GPS, cameras, and microphones, this allows personal-, group-, and community-scale sensing applications. We consider that this invention will reshape our world, in areas such as transportation, social networks, healthcare, business, and environmental monitoring. One of the main obstacles is the accuracy provided by the built-in sensors due to their size and the low cost [1]. To evaluate the performance of phone sensors, reference [2] conducted a thorough test on phone-based sensors in terms of accuracy, precision, and energy consumption. The accelerometer and gyroscope presented a stable performance with a slight deviation.
Machine learning, a sub-branch of artificial intelligence (AI), refers to a computational method to learn from past information and make an accurate prediction [3]. For example, Siirtola and Röning [4] used mobile phones to collect people’s acceleration while performing five activities: running, driving, sitting, walking, and cycling. Two models, k-nearest neighbor (KNN) and quadratic discriminant analysis (QDA), learned the acceleration pattern of each activity from the acquired dataset, and the post-learn models were installed on phones providing satisfaction outcomes. The University of California, Irvine (UCI), used accelerometers and gyroscopes to collect an extensive dataset comprising more than 10,000 instances and 563 attributes. Each attribute was computed from the 2.56 s window [5]. The UCI configuration of two sensors and 2.56 s window size is not applicable for us since two sensors consume approximately 30% of energy for a 1-h test on Google Nexus 4 [2], and a 2.56 s window is considered to be too short in the public transportation mean detection. Specifically, both a bus and a pedestrian taking a stroll waiting for a traffic light can induce the same motion pattern within 2.56 s. Therefore, an enlarged length of sample covering the waiting time for a traffic light is used since apart from the time waiting for the traffic signal, walking and taking a bus cause different motion patterns. Moreover, there was no consideration for phone placement in the UCI dataset which only placed the phone on the waist. With the identical phone placement setting, a model trained based on this dataset might be unable to predict the same motion if the phone is placed in the top pocket instead of the waist.
This data descriptor proposes a 2500-instance database with a 1-min sample that conquers the UCI dataset issues. Additionally, it reveals the approach used to collect the data, containing the criteria for data record technical validation, usage note, and code availability. Two AI models, deep neural network (DNN) and convolutional neural network (CNN), are used to learn the patterns of the activities from the vibration data. The DNN is trained by two datasets, the pre-preprocessed dataset, and the raw dataset. The result turns out to be unsatisfying. The CNN is also trained by two datasets, the raw data in time-series and frequency-series. The CNN model addressing time-series outperforms all other configurations.
This dataset enables smartphones to identify which form of public transport people are using. Furthermore, this is beneficial for a train or bus company to charge fees automatically, which can improve the capacity of a train station through the removal of ticket barriers while bus stop time can be reduced because there is no need for people to pay the fee one by one.
2. Materials and Methods
Data in this data descriptor were collected by using an accelerometer available in smartphones. A mobile application was used to collect data is VibSensor which is available in both Google Play Store and App Store. Data were collected by members in the research group who were different in ages and genders. The interesting activities were walking, cycling, taking a bus, taking a train, and taking a taxi. Members of the research group were asked to use the application to record their body vibration while performing interesting activities.
During performing the activities, it was suggested that the subjects also stored their phones in different ways such as in bags, pockets, left-hand position, or right-hand position, which allowed the dataset to cover as many situations as possible. We believe that the model can be well-trained by this diverse dataset.
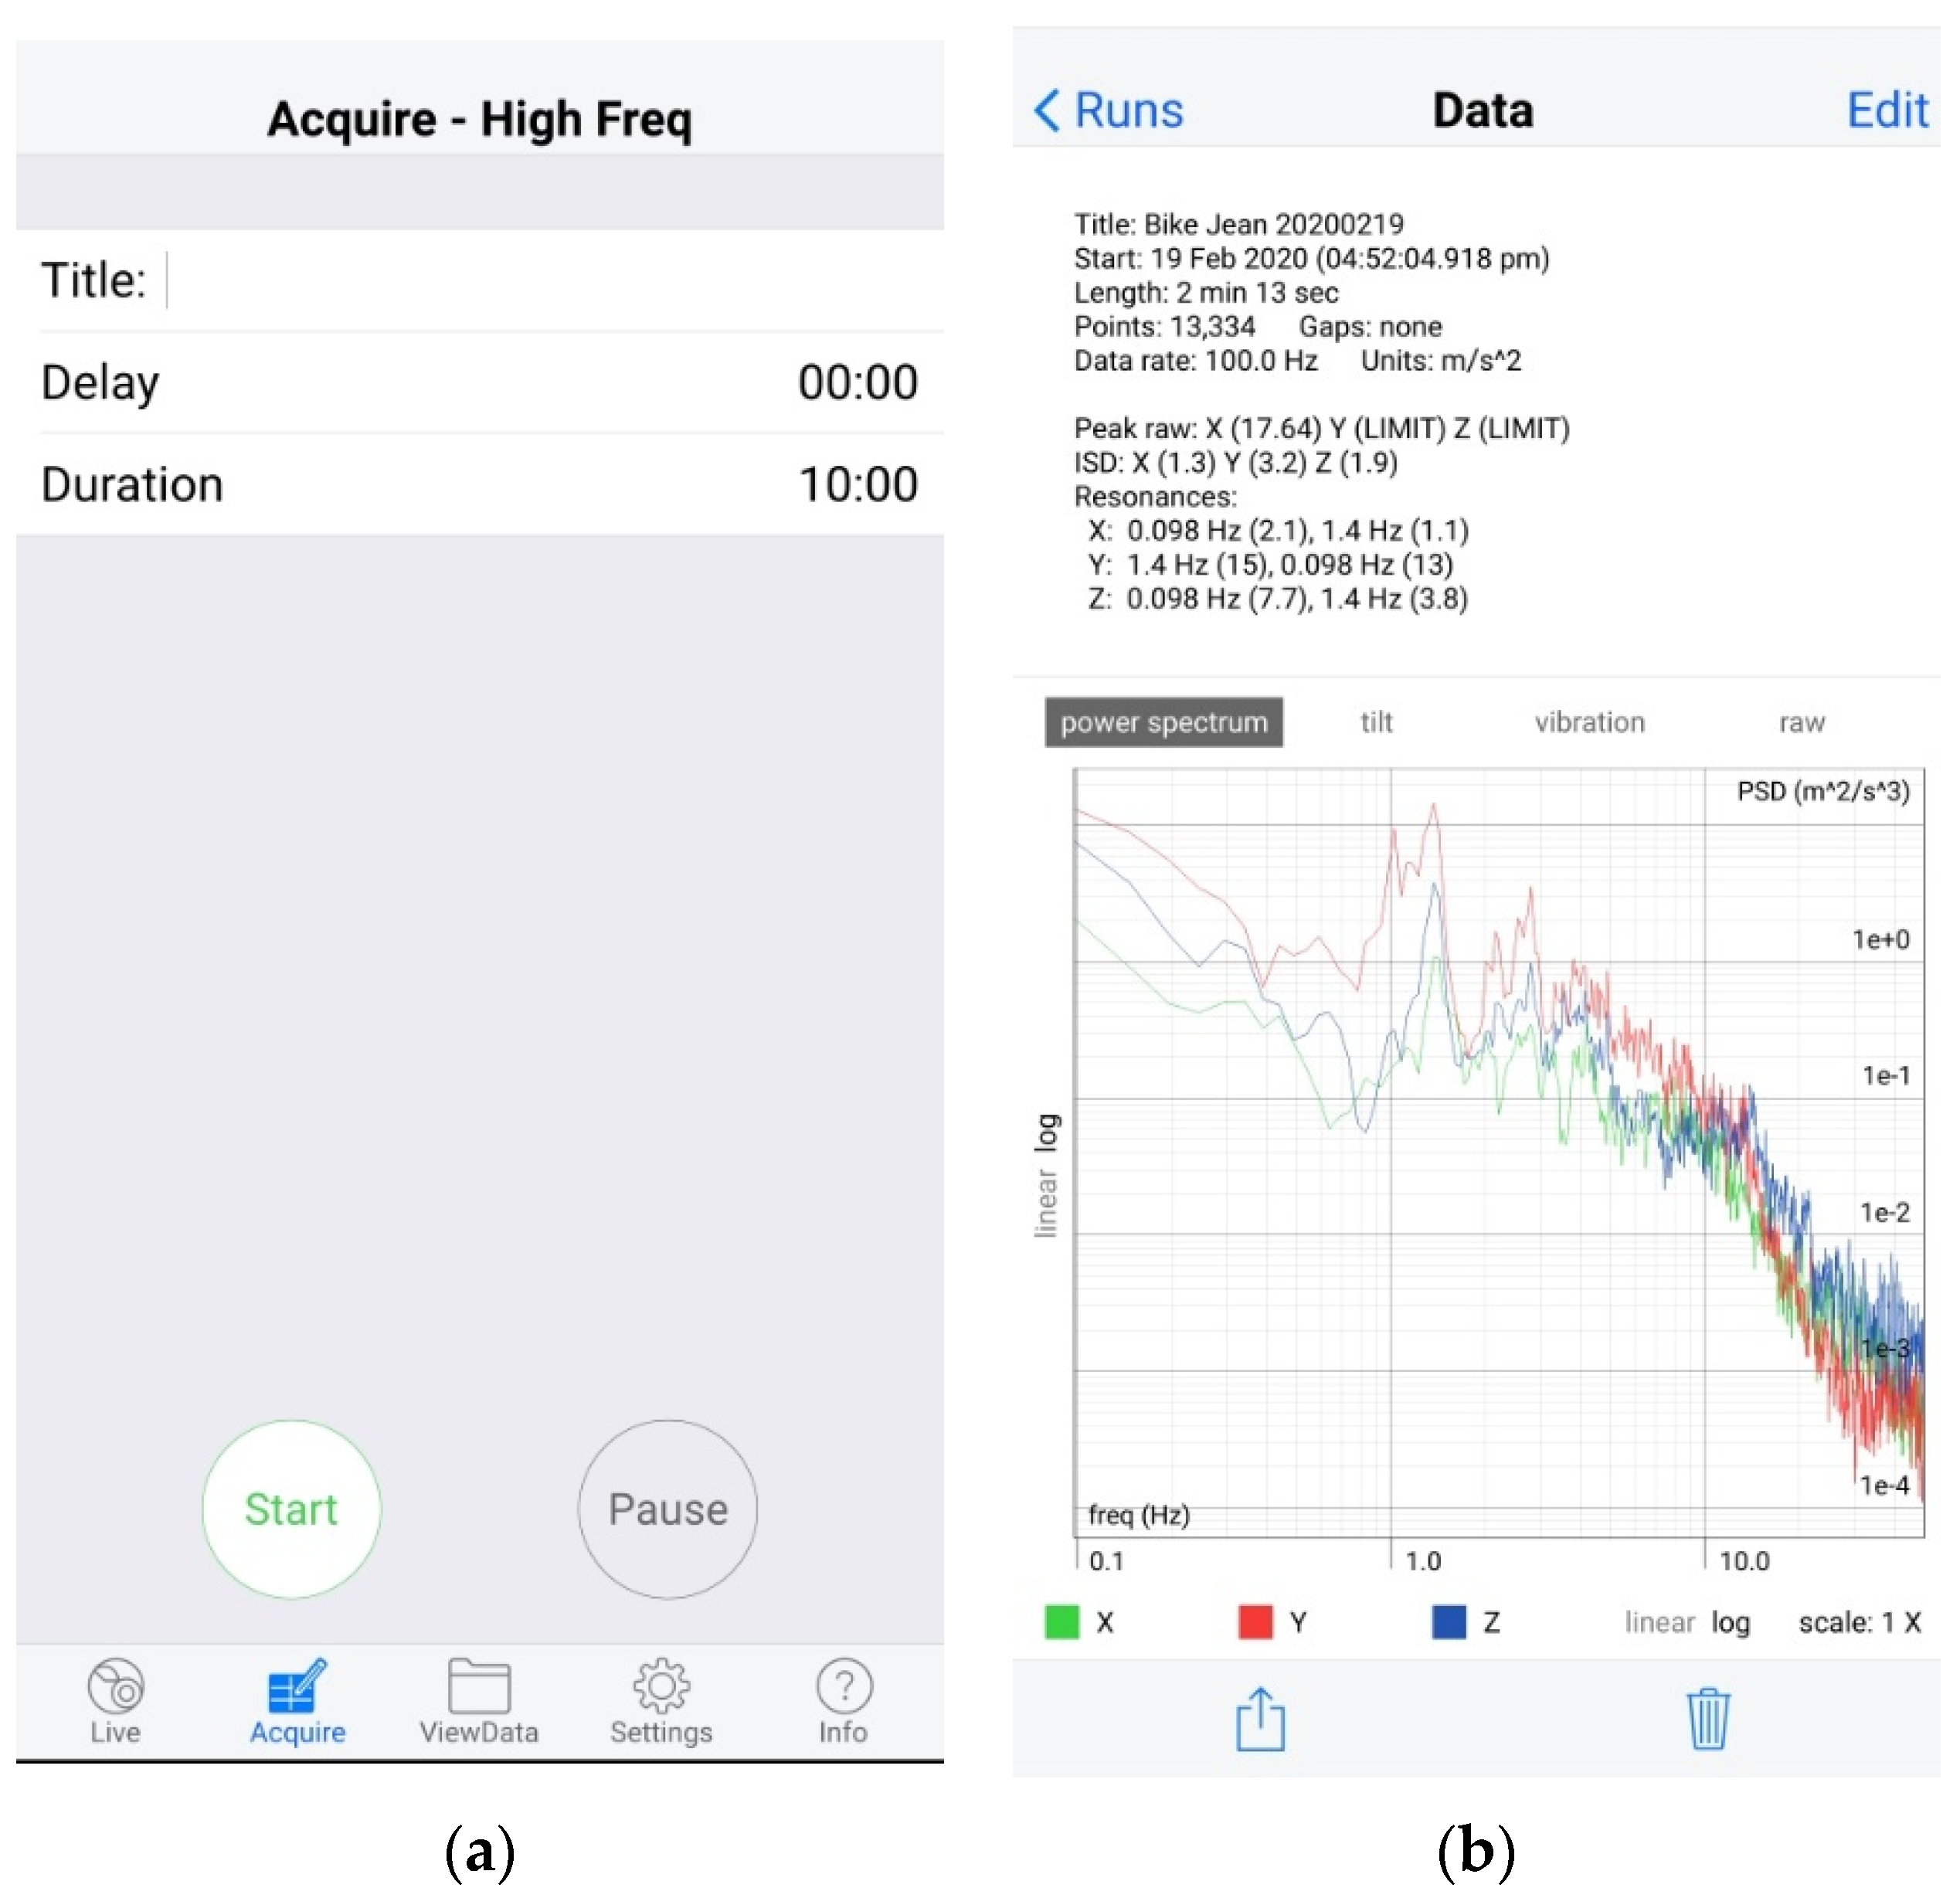
In the application, data collection can be conducted by selecting ‘Acquire’ as shown in Figure 1a. On this page, title, delay, and duration can be defined. After the title, delay, and duration are set, the start button is used to start the work process of the application. The application will stop working when the time reaches the defined duration, or the pause button is pressed.
Data export can be performed using ViewData, selecting a date, and recorded data, as shown in Figure 1b. The application records power spectrum, tilt, and vibration at the same time. In this data descriptor, vibration is focused. Therefore, data exporting is undertaken by choosing vibration and sharing it with other devices or people. Exported files are XLSM files containing vibration data in the x, y, and z-axis.
Data are processed in two ways: simplified data and raw data. A 1-min interval was used as a representative of data. In simplified data, the average of absolute values of x, y, and z-axis vibration in 1 min is calculated. Then, other related variables are calculated consisting of the total vector (), maximum value, mean value (), minimum value, and standard deviation (SD). In the case of raw data, vibrations in the x, y, and z-axis are rearranged in separate worksheets where a row contains a set of data, and each column is the vibration. This data descriptor is recorded on a 100 Hz and 60 s basis, so the number of columns in each row is 6000.
Fractions of data in each file that are less than 1 min will be ignored because a 1-min interval is used as a representative of the data. From the data processing, the total number of samples was 2497, and the number of samples in each class is shown in Table 1.
The data processing was conducted using Excel Macro written in Visual Basic for Applications (VBA) language. The code was uploaded to a repository as raw data and processed data. Further detail of data processing is shown in the Code Availability section.
3. Data Records
Two data files were uploaded on Zenodo. The files were arranged into two xlsm files, a simplified_data.xlsm, raw_data.xlsm including vibration in three directions X, Y, Z, and activities in four sheets, as follows:
- Simplified_data.xlsm. This table presents the eight features mentioned above regarding the five activities. The related fields of the table are:
- X, Y, Z stand for the average value generated from the absolute number in three directions in one minute.
- Total is the total vector of the three average values.
- Max is the maximum value of each axis.
- Min is the minimum value of each axis.
- The mean value is developed from .
- SD represents the standard deviation value.
- Activity is the label of each sample
- Raw_data.xlsm sheet 1: body_acc_x. This table reveals the raw data in the x-axis. Each row points to an activity while every column is one timestamp.
- Raw_data.xlsm sheet 2 and 3: these two sheets present the same format as file body_acc_x but in y and z directions.
- Raw_data.xlsm sheet 4: y_label marks each data sample for corresponding activities.
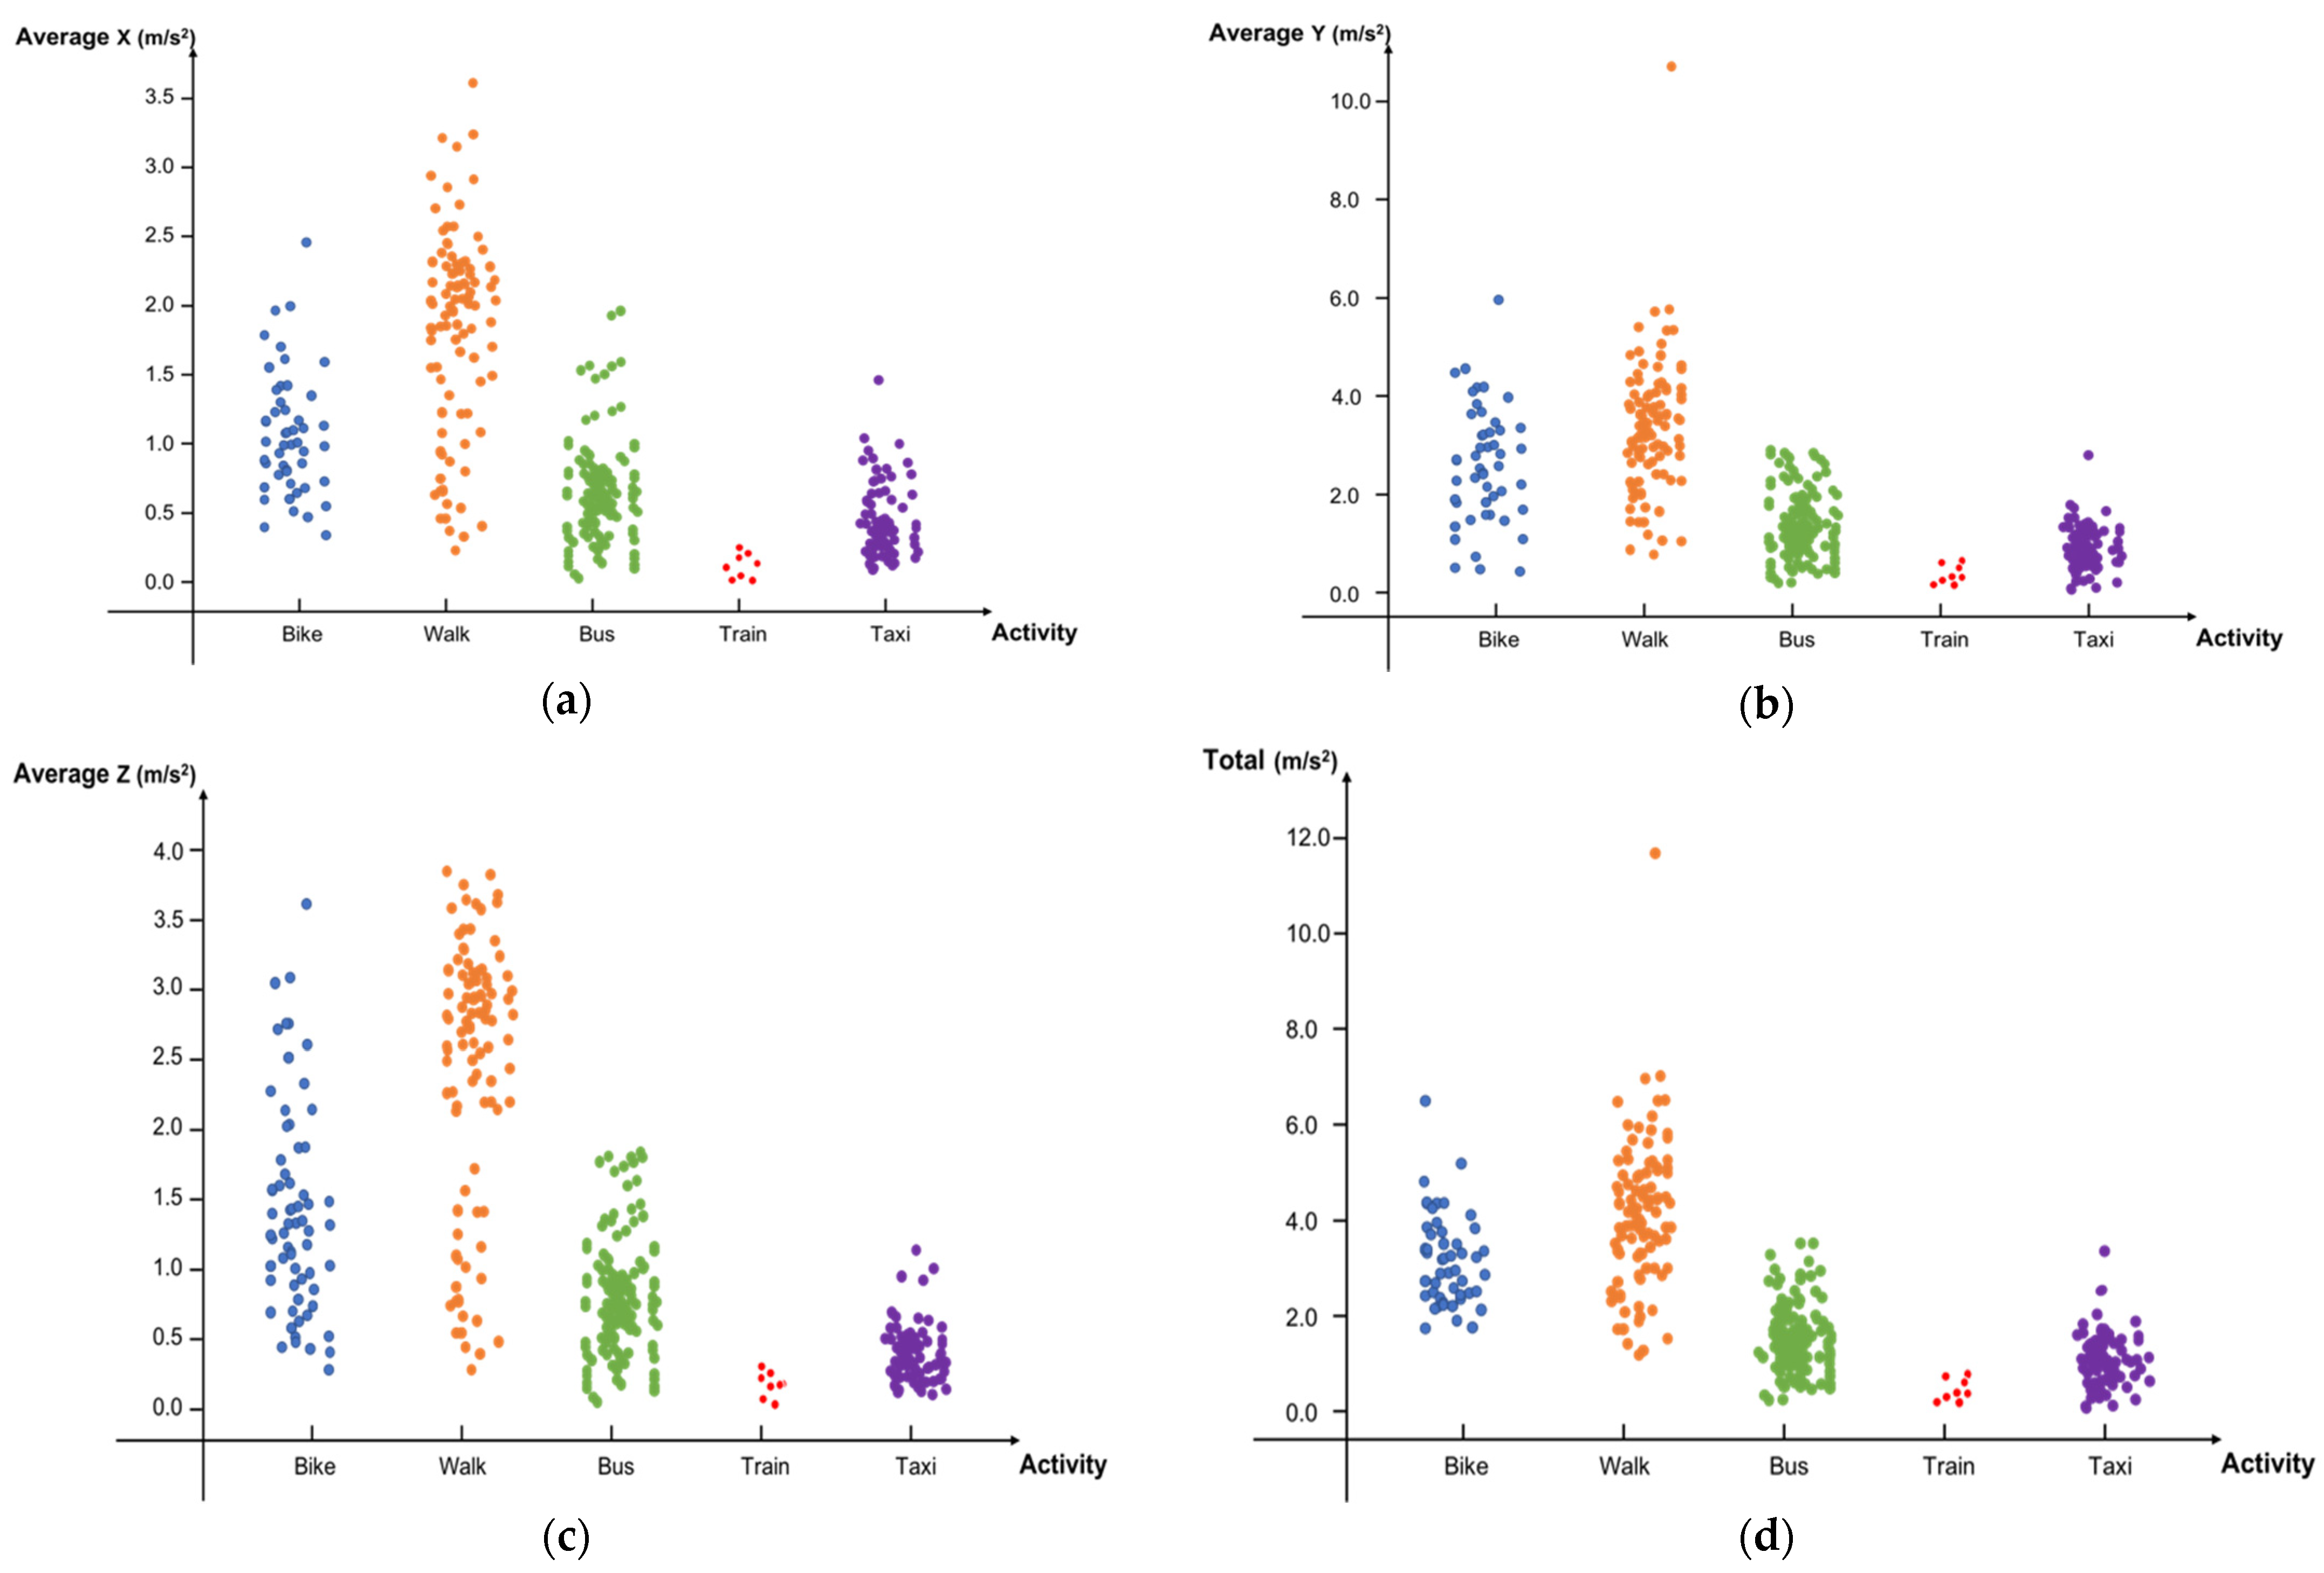
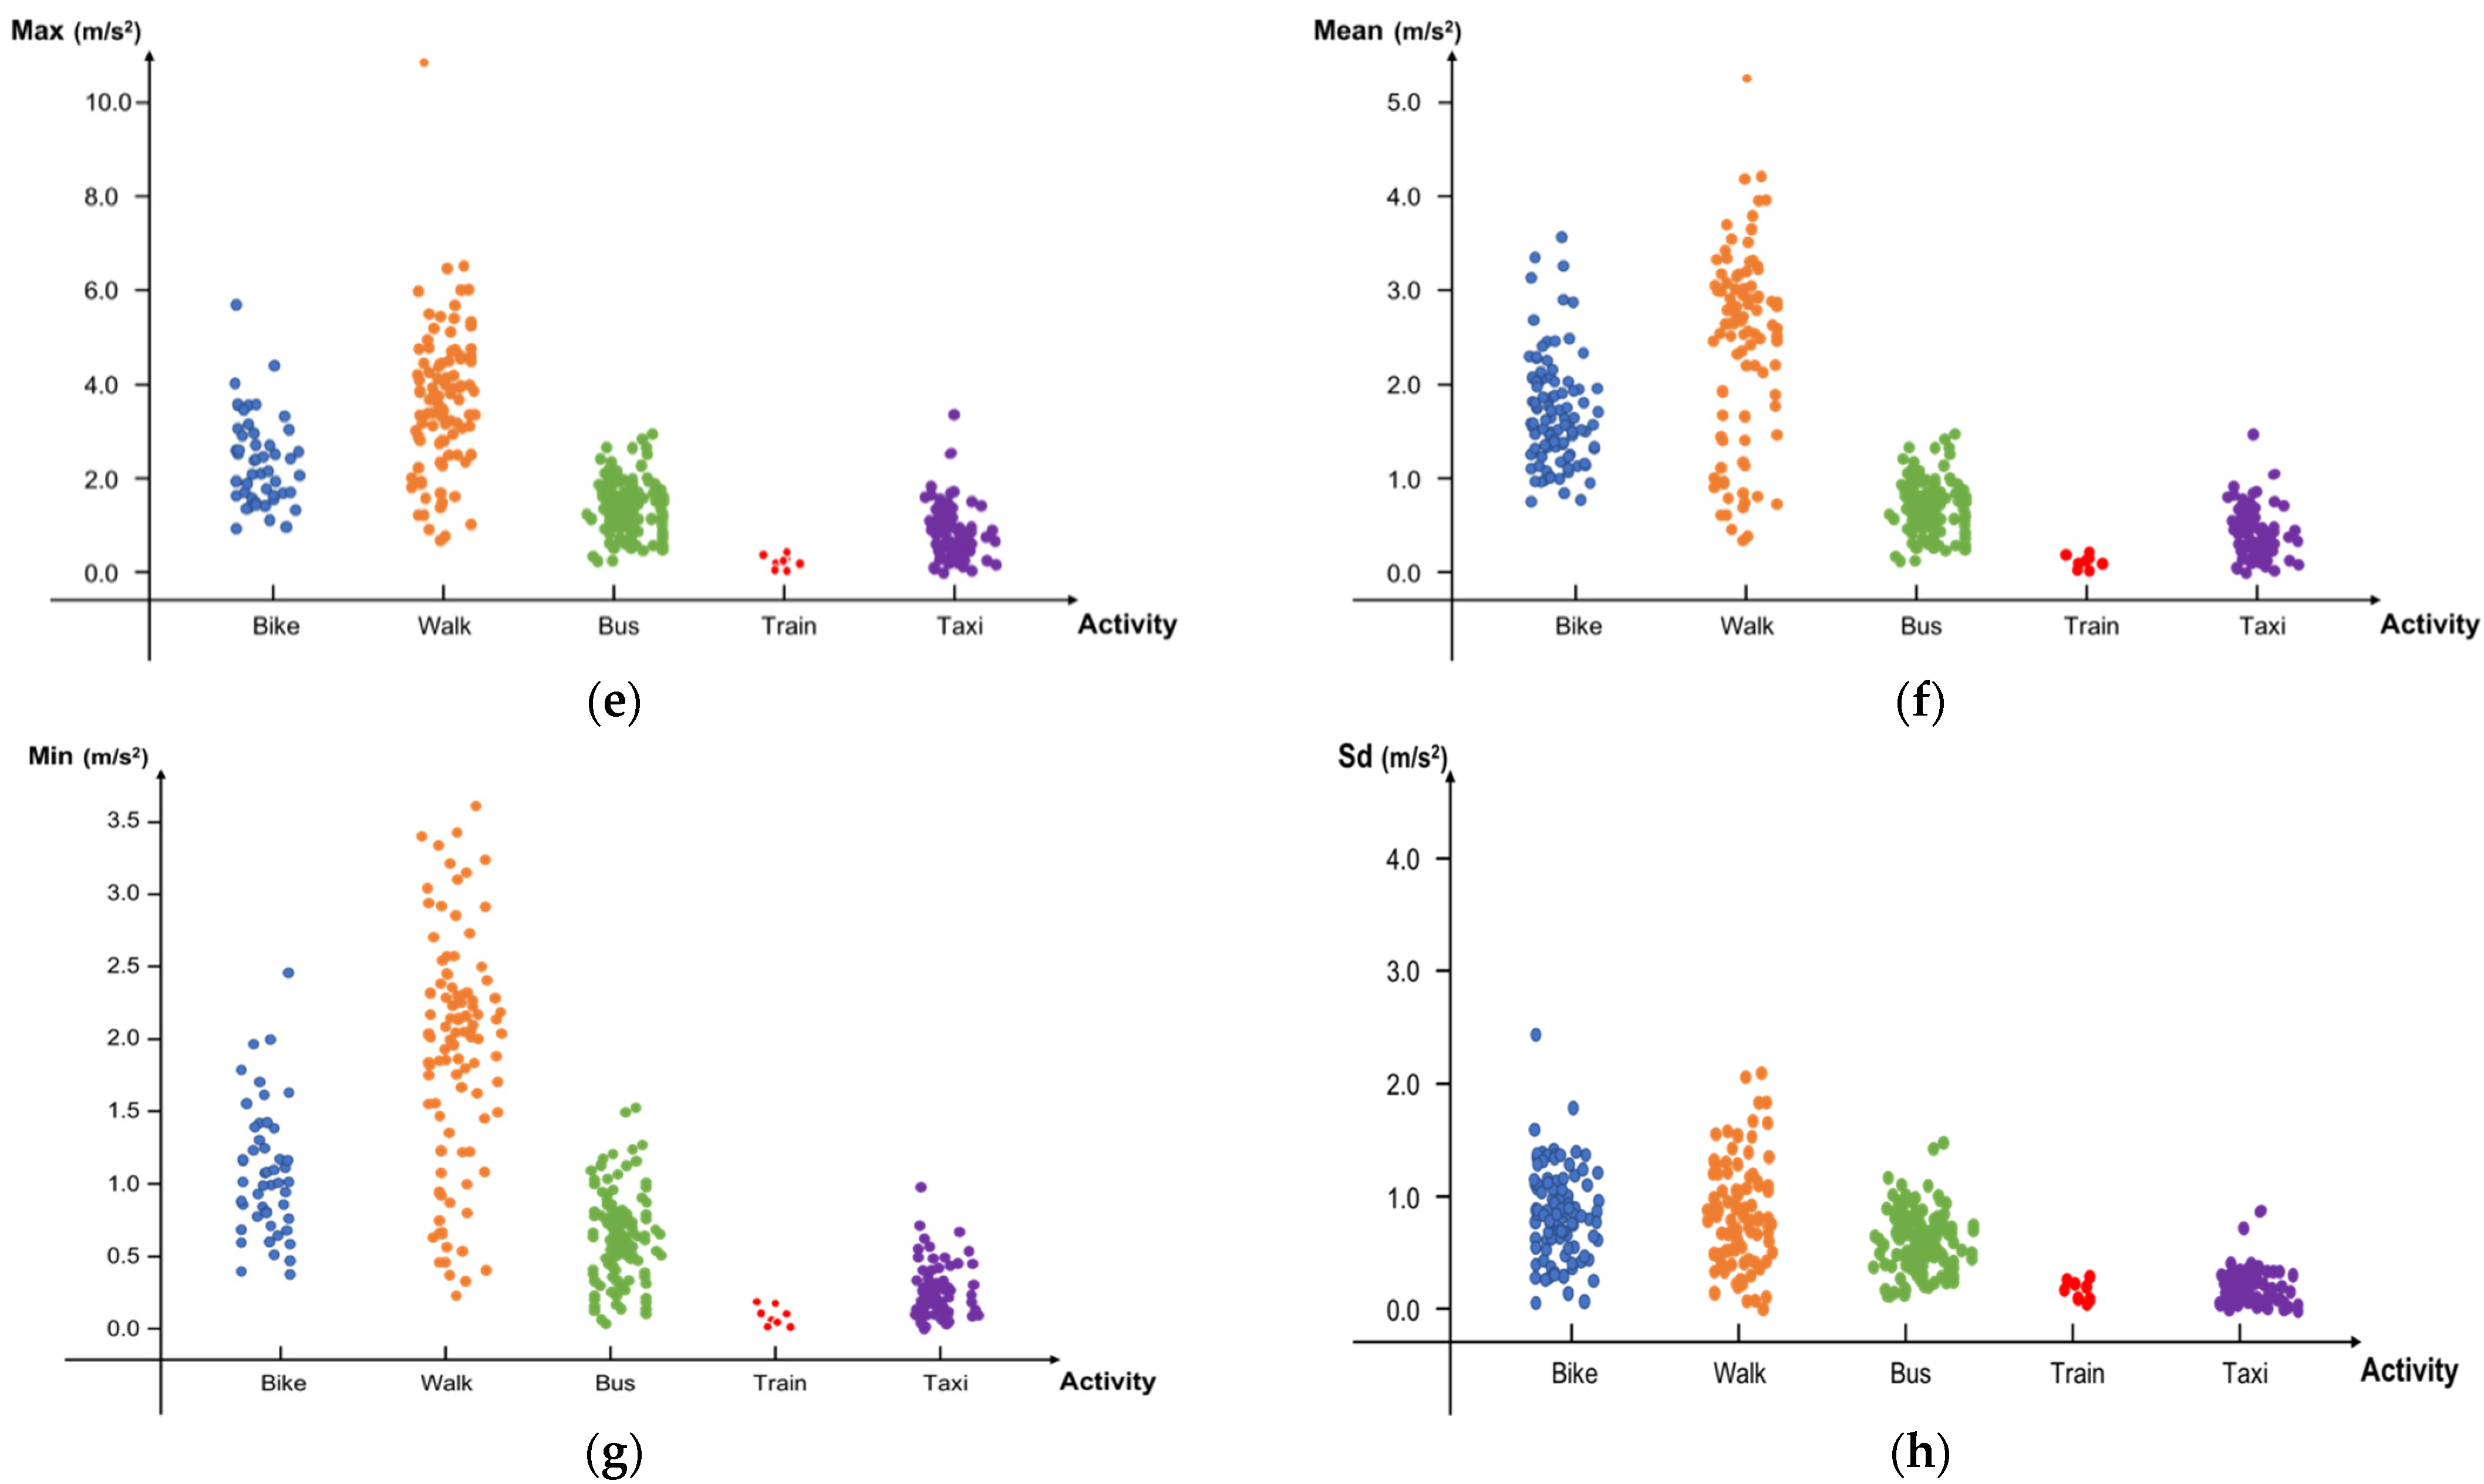
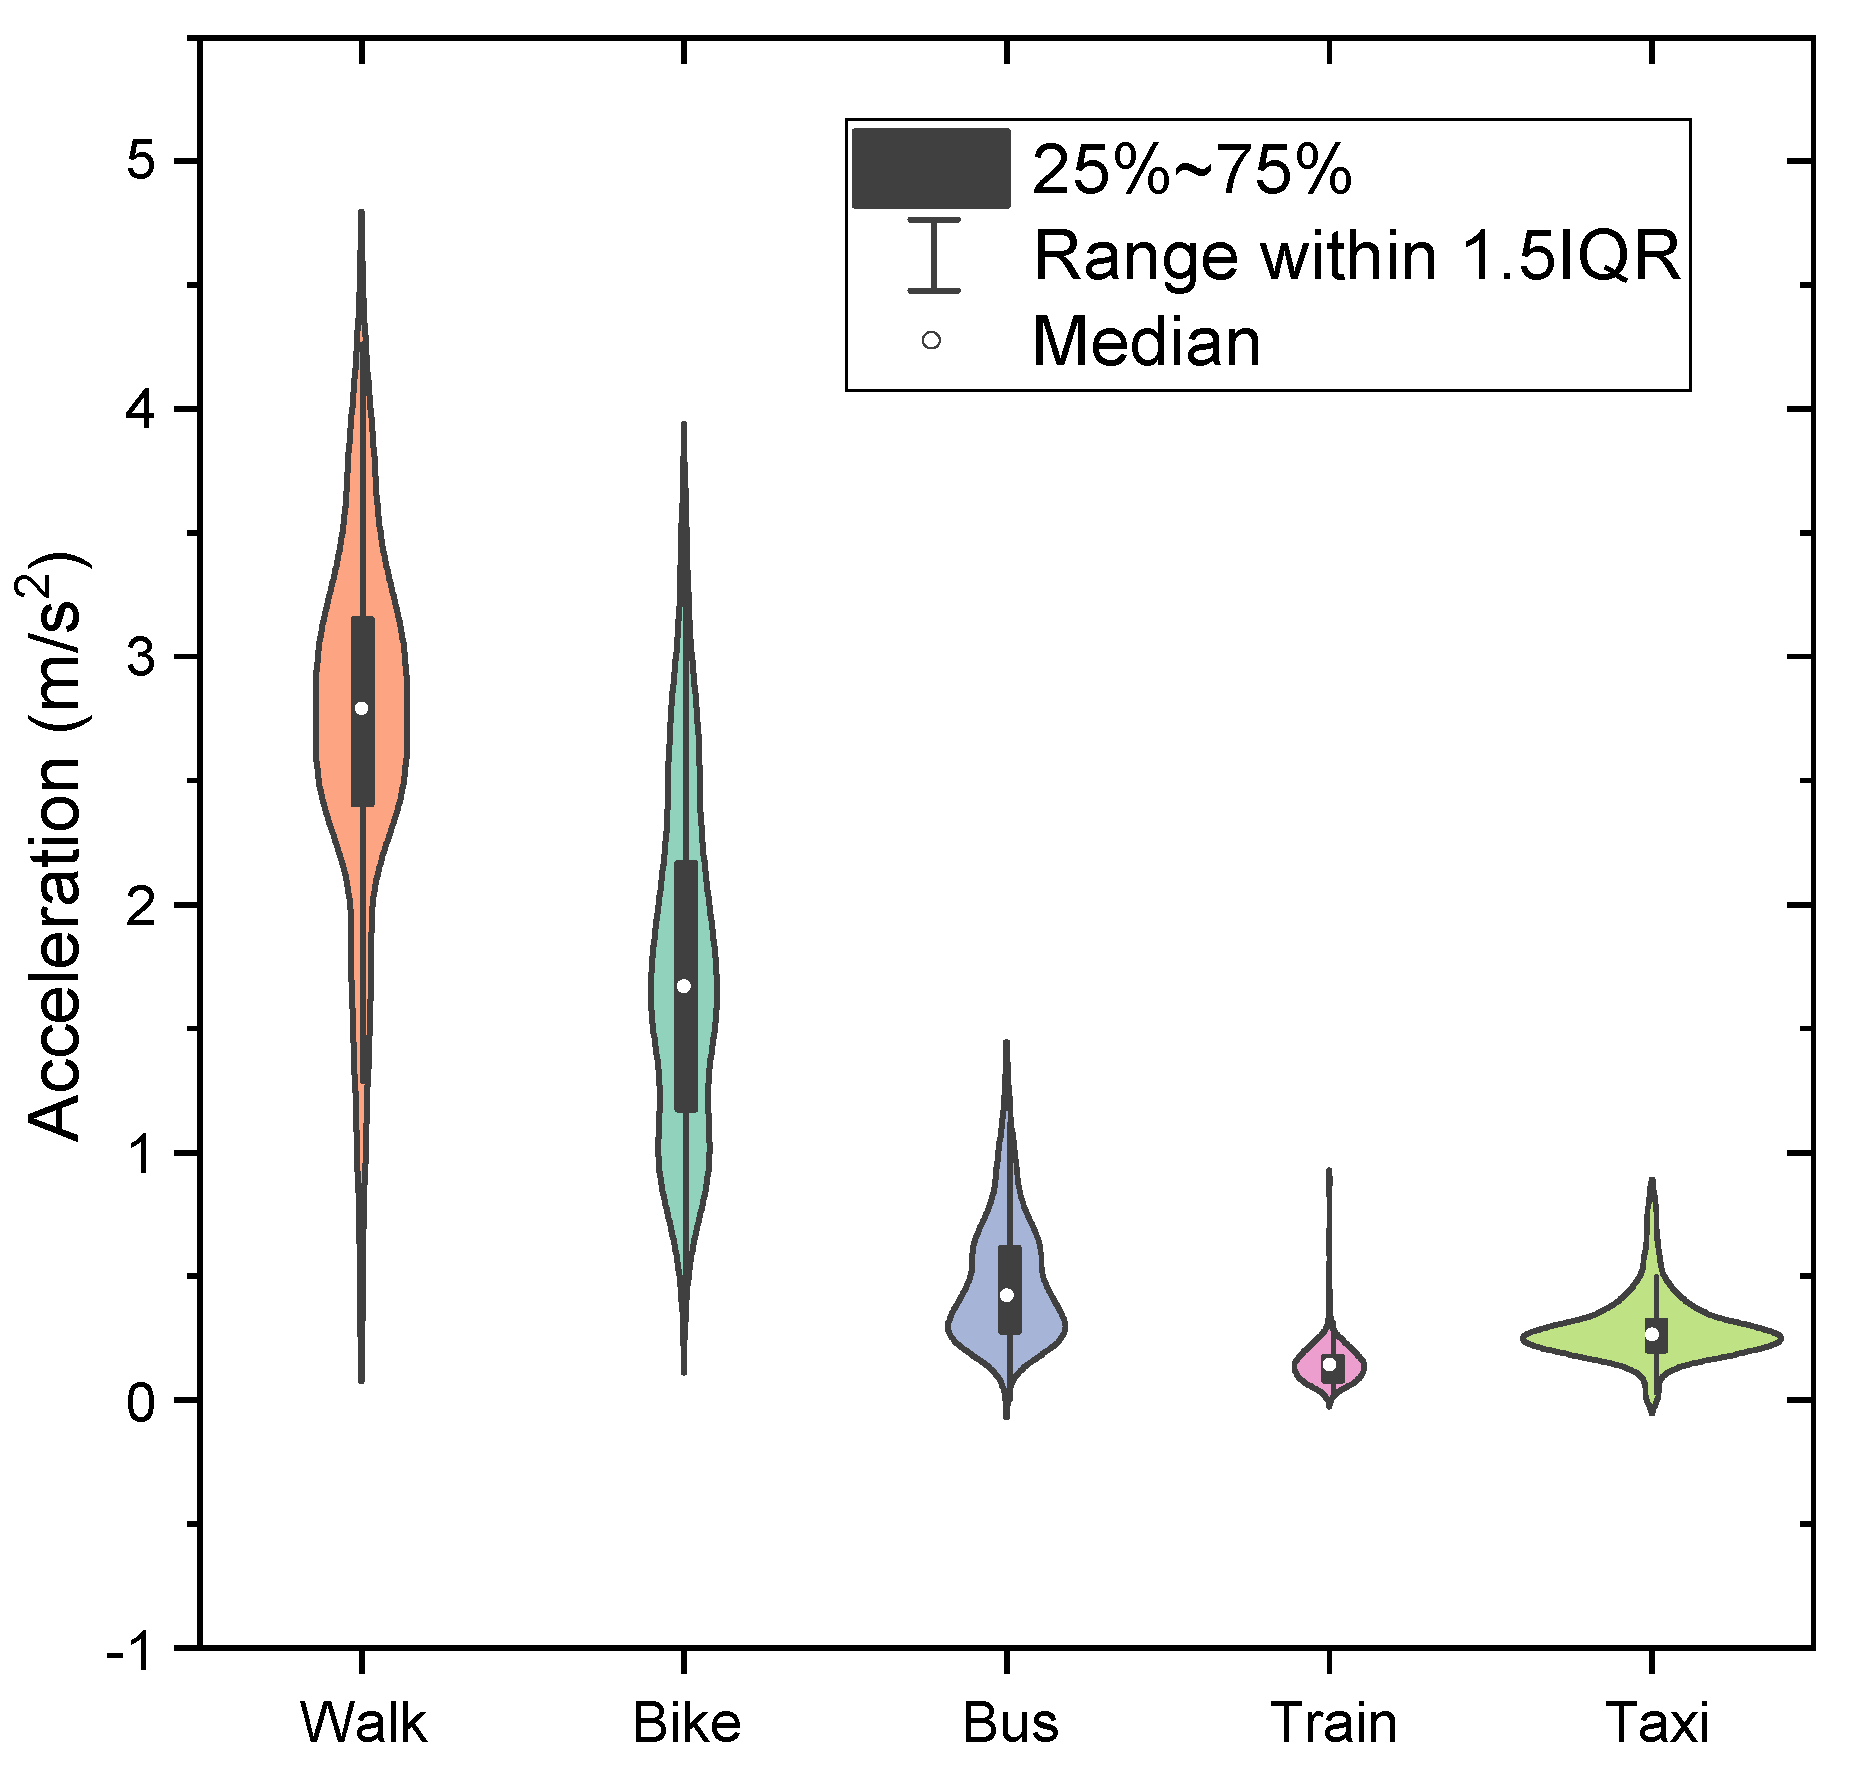
Figure 2 shows the distribution of activities in accordance with each feature.
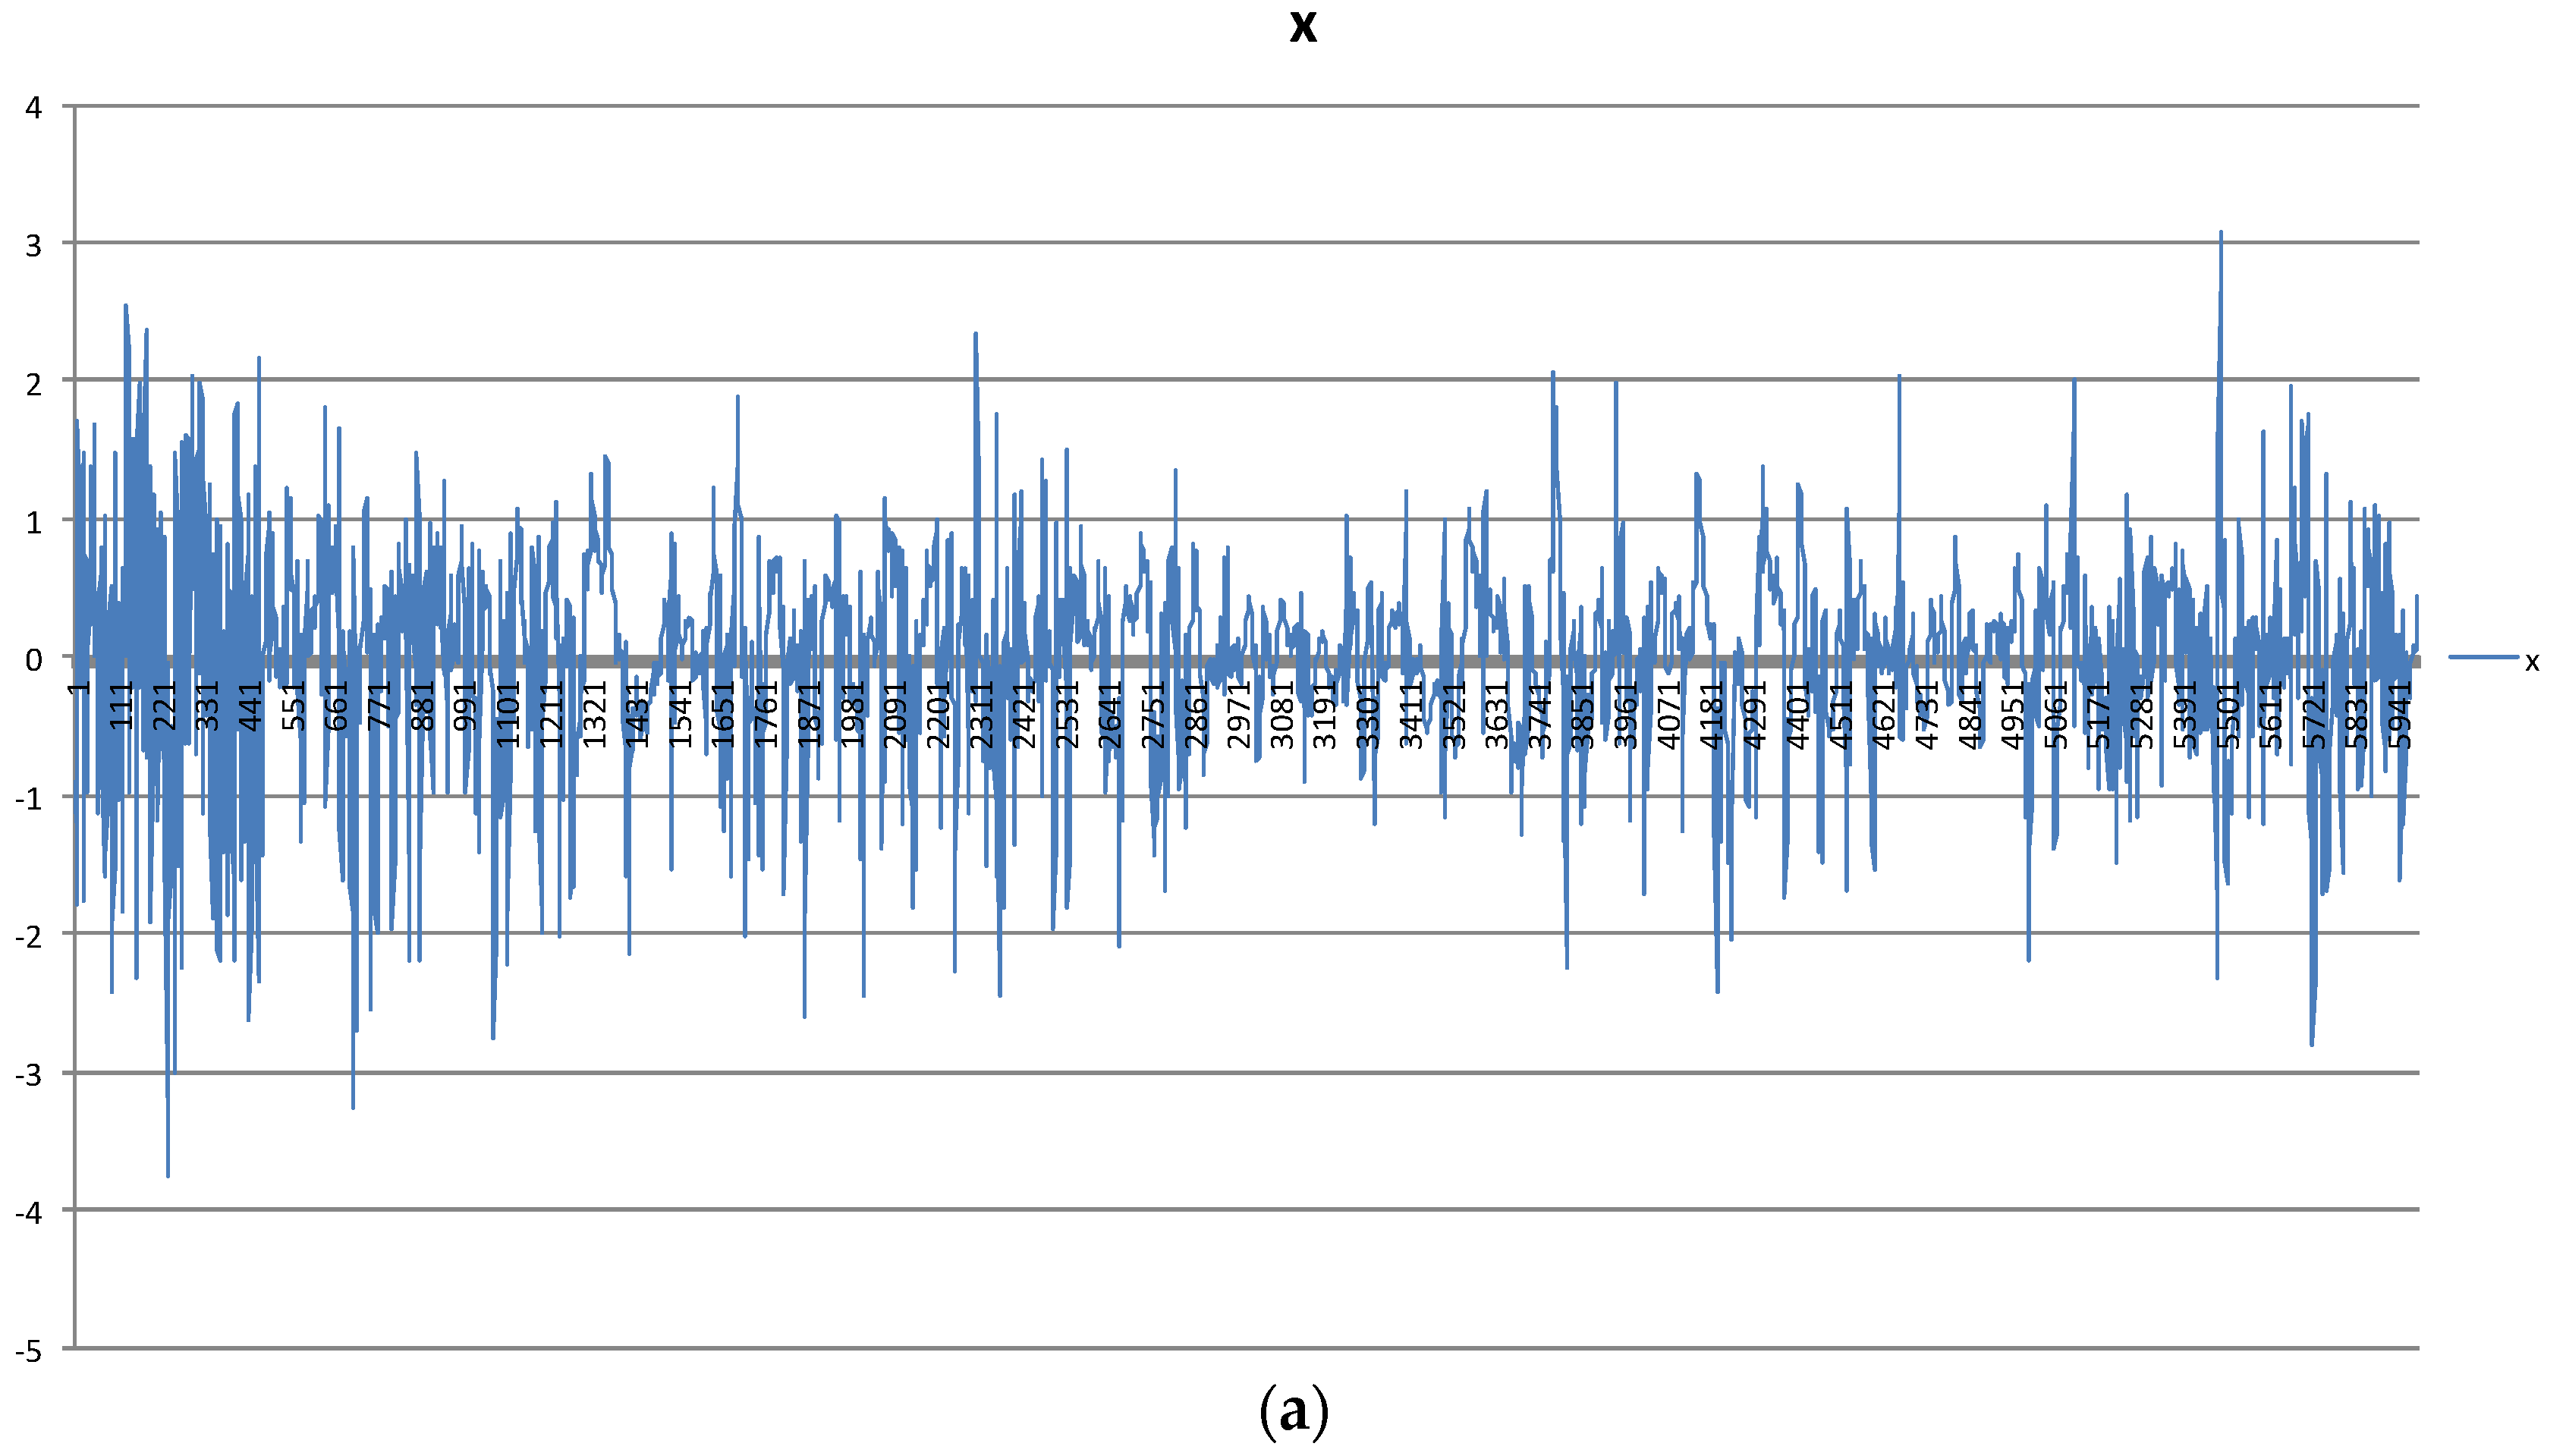
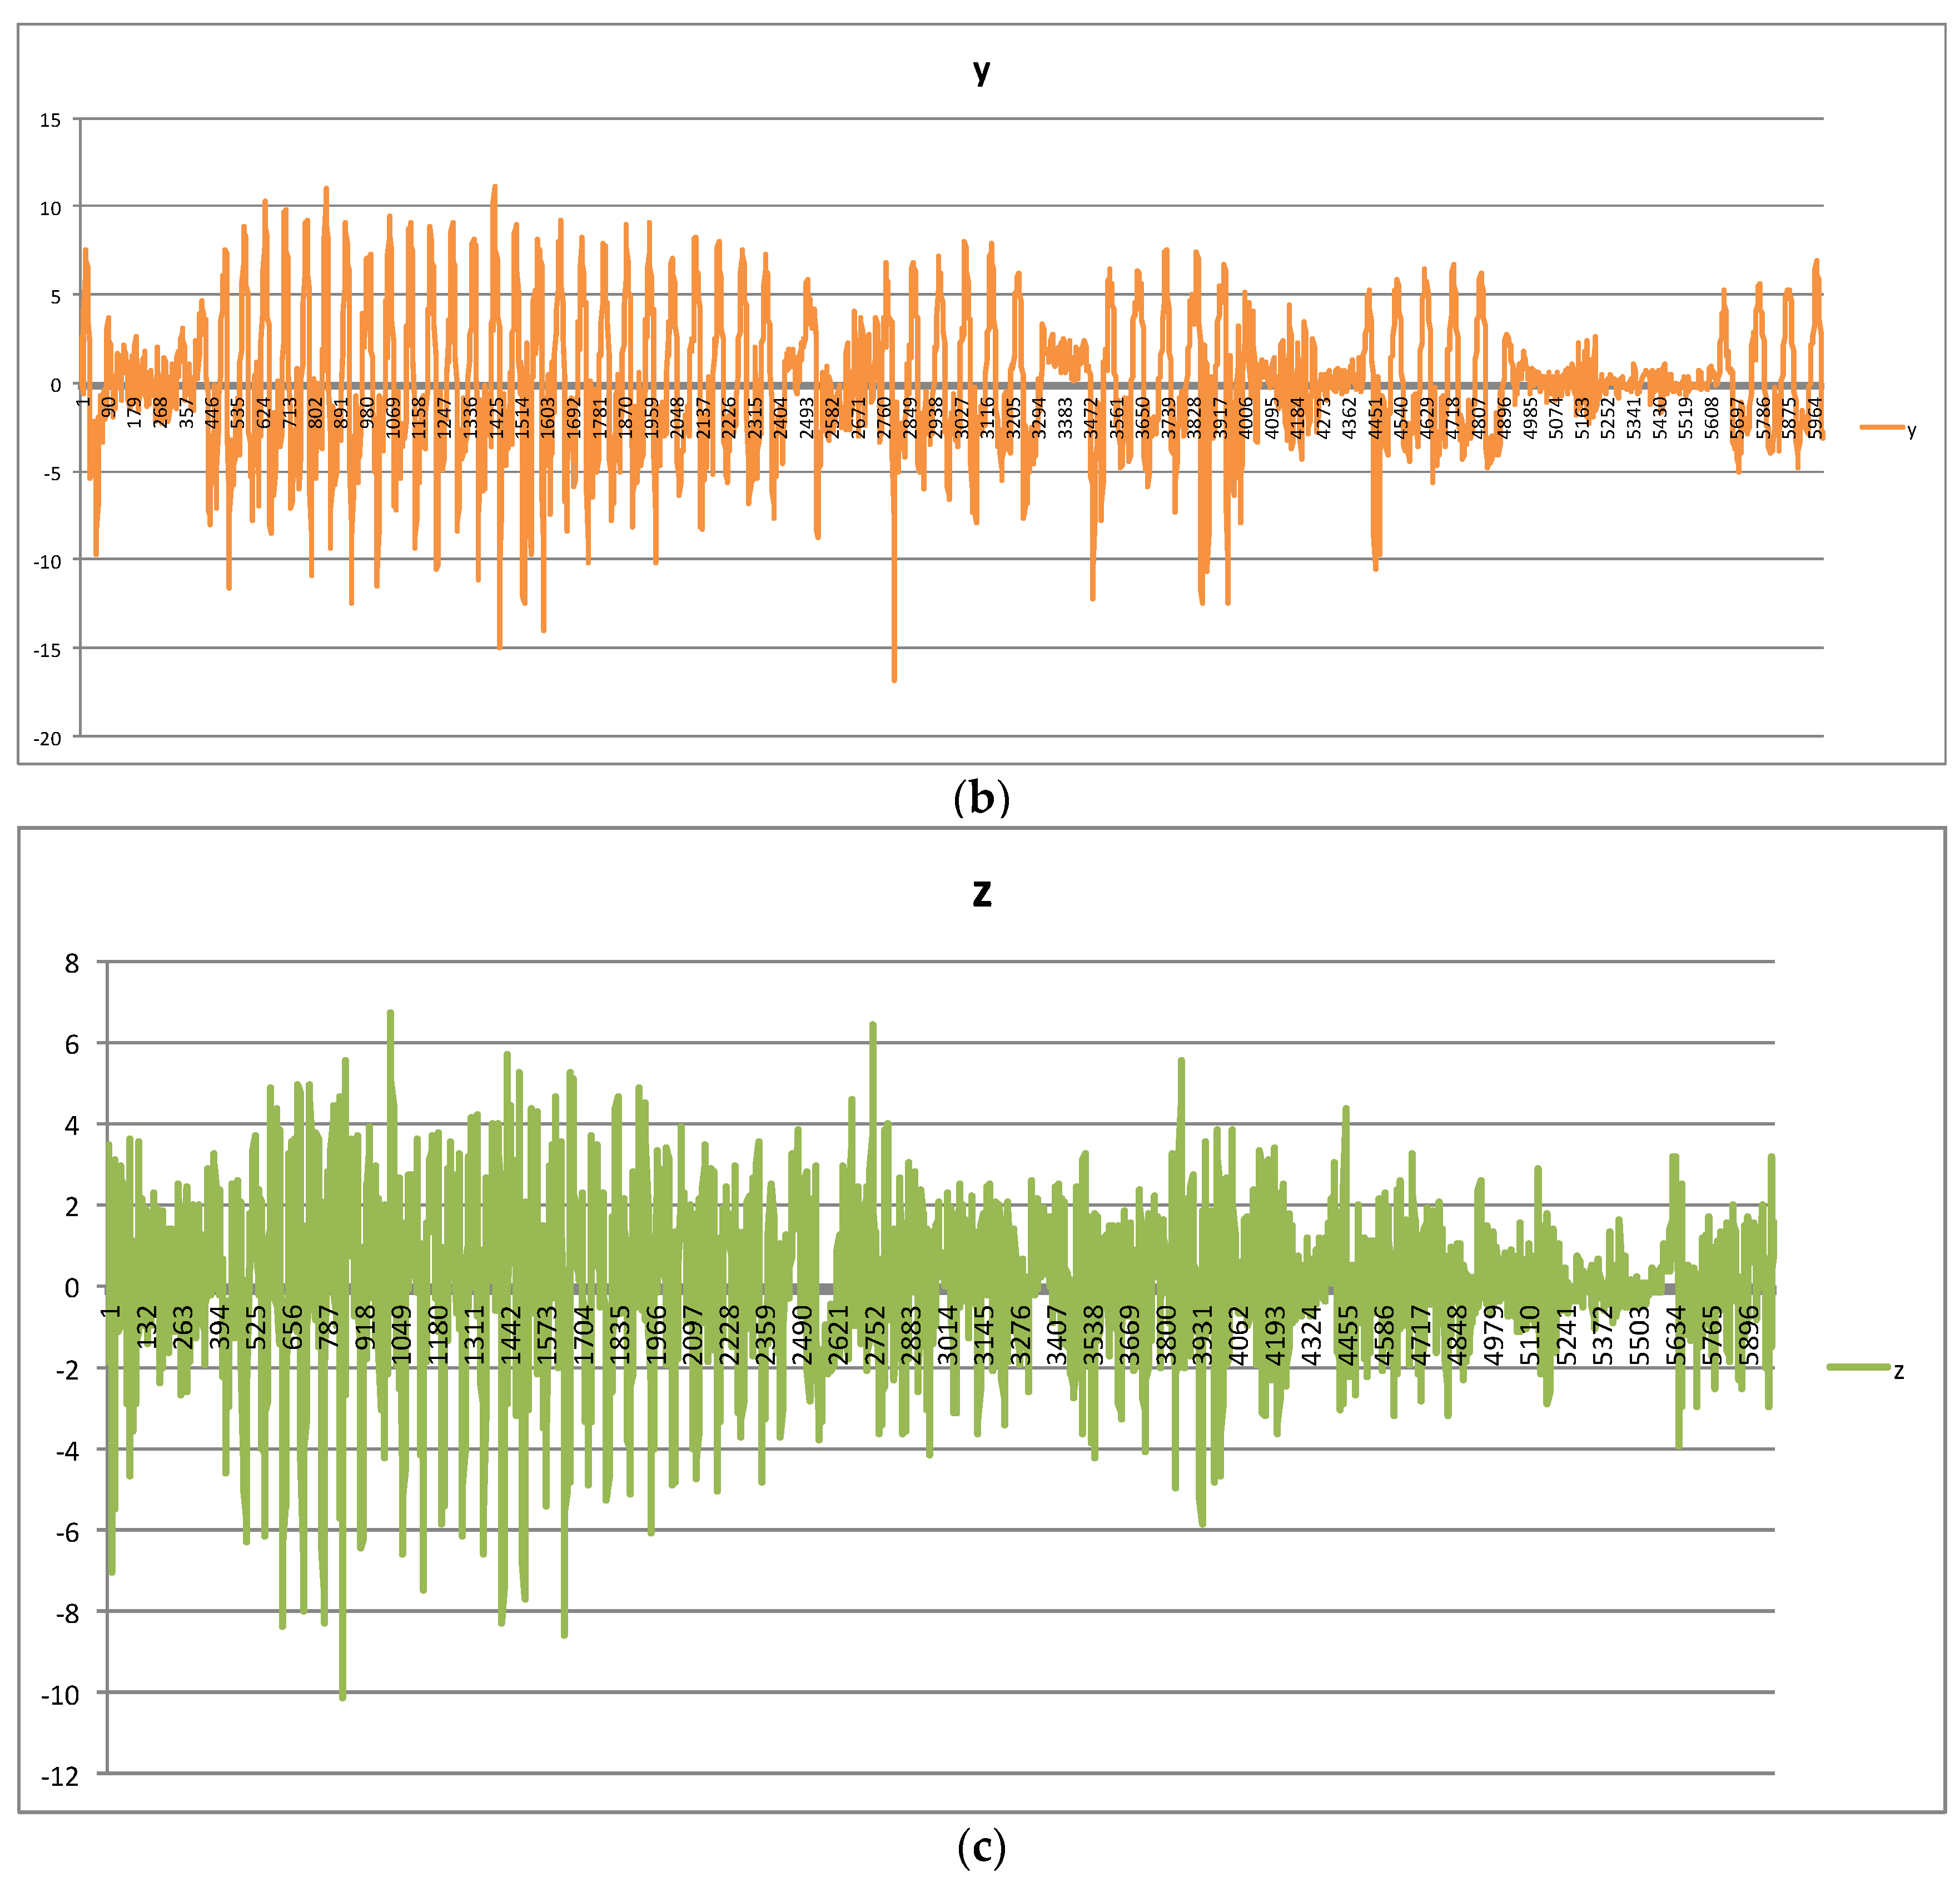
Figure 3 depicts the vibration in three directions with 1-min duration. Every window in three directions in the raw data can be used by DNN as one sample after being preprocessed to eight handcrafted features.
4. Technical Validation
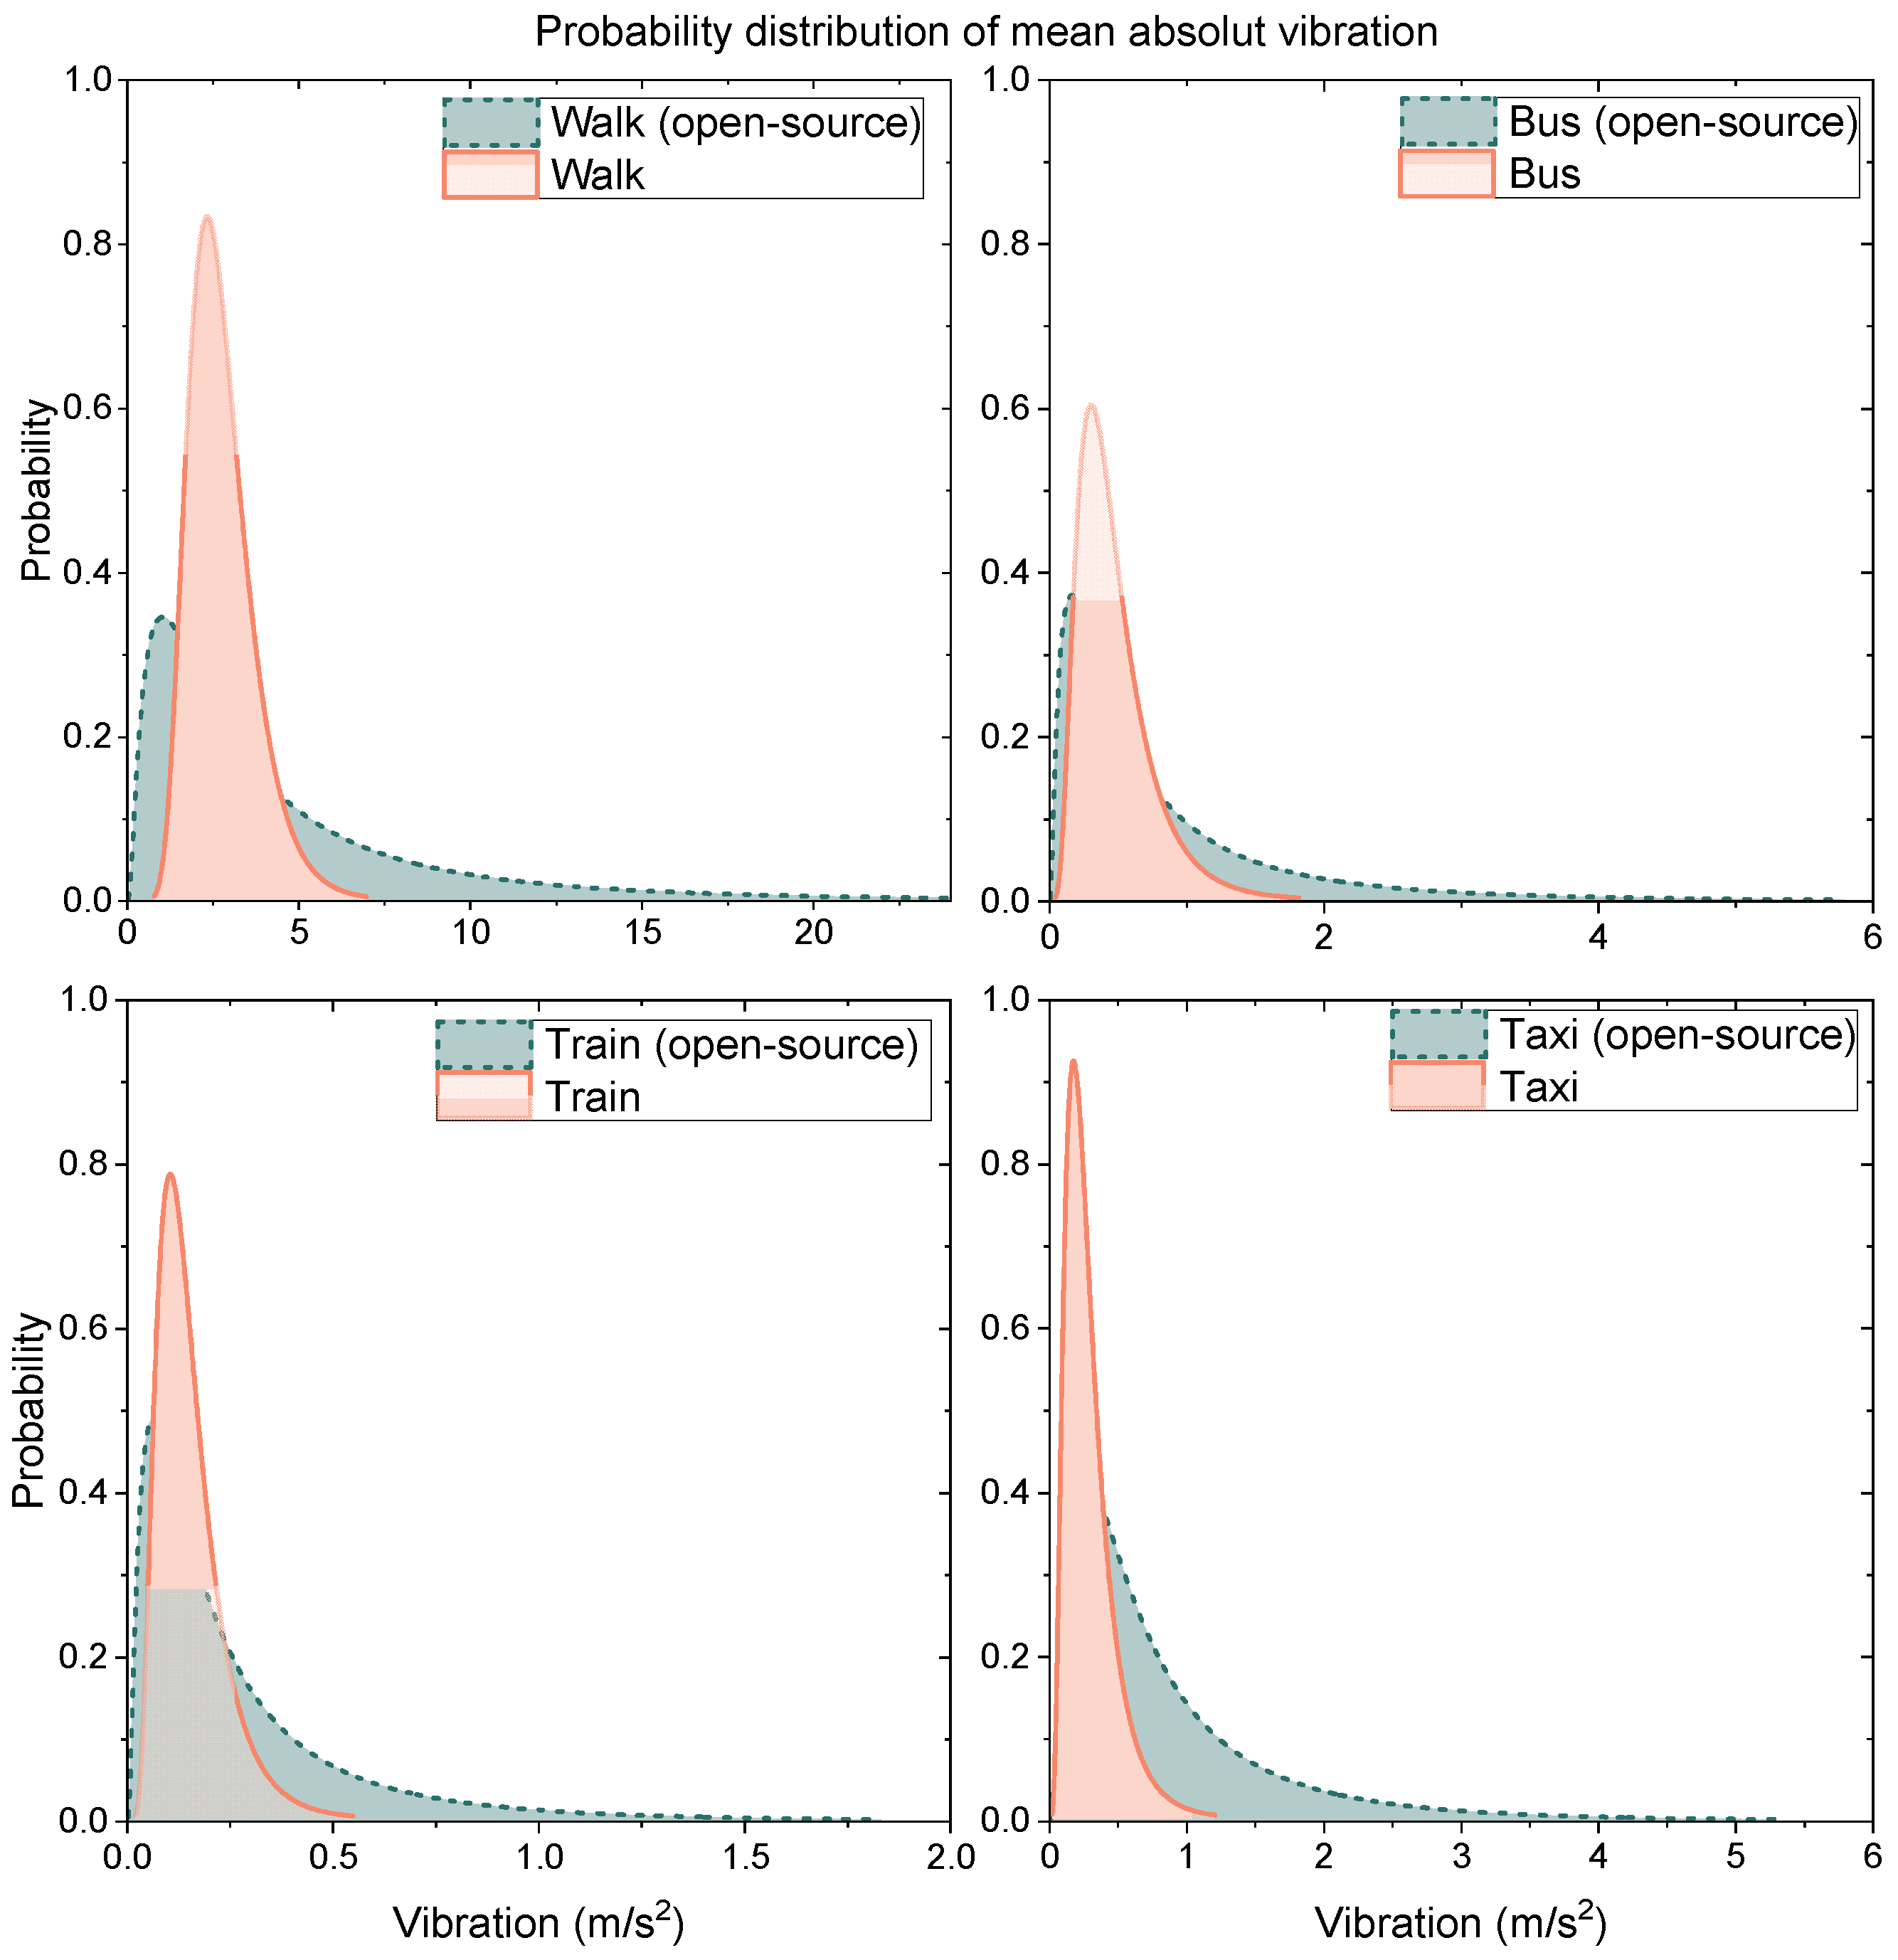
Data are validated by comparing them to other open-source data. For the comparison, means of absolute x, y, and z vibrations are compared. A violin plot of the mean vibrations of each class is shown in Figure 4. The open-source data which are used to compare were collected by Carpineti, Lomonaco [6]. They were interested in walking, taking a car, being still, taking a train, and taking a bus. It can be seen that there are four consistent human activities which available in this data descriptor and the aforementioned open-source data consisting of walking, taking a car, taking a train, and taking a bus while cycling and being still are not available in both datasets. Therefore, the mean vibrations of four consistent activities are compared to validate data. The comparison is made using the mean absolute vibration calculated from vibrations in the x, y, and z-axis. The comparison is shown in Figure 4. The chart compares the probability distribution of mean absolute vibrations from this data descriptor and the open-source data.
From Figure 5, it can be seen that ranges of the mean absolute vibrations from the open-source data and this data descriptor are in the same range. The deviation of the data from the open-source data is larger than the data in this data descriptor. This may imply that data in this data descriptor have lower fluctuation than the open-source data. In addition, when comparing vibrations from different members in the research group, the vibrations are in the same range which can be seen from the maximum probability of 0.6–0.8. Therefore, it can be concluded that the data are consistent with other datasets which are reliable to use.
5. Usage Notes
These data help evaluate the vibration pattern of several activities that people performing collected by smartphones and as inputs of AI models of activity recognition. For business purposes, these data can be used to train an AI model that can be a smart public transport fee-charging tool depending on the time people spend onboard a bus or a train. This can save time that people are stuck by a ticket barrier in a train station or people queuing to pay for boarding a bus. Moreover, the trained model can understand the time and the pattern by which people consume different forms of public transport. With these data, the transportation department can plan the services of transportation wisely.
6. Code Availability
Data processing was conducted by using Excel Macro written in VBA. The codes can be accessed in “raw data.xlsm” and “simplified data.xlsm” selecting the Developer tab and Macros.
The first set of commands is used to open, process, and close XLSM files containing data collected by the mobile application. This can be conducted by renaming files systematically to use the loop function to open, process, and close XLSM files. The timeframes of each file are adjusted to start from 0 because, in some cases, the recording time does not start from 0. For simplified data, vibrations in the x, y, and z-axis are transformed into absolute values. After that, vibrations in each axis are calculated for average values. That means data in 60 s or 6000 values in each axis are calculated to be representative. As mentioned, the rest of the data, which are less than 60 s, will be ignored. Until this stage, the results consist of three values, the average values of absolute vibration in the x, y, and z-axis. From these three values, five additional values are calculated consisting of the total vector (), maximum value, mean value (), minimum value, and standard deviation (SD). For raw data, the code will rearrange data in every 60 s as a representative by separating vibrations in each axis. Therefore, in “raw data.xlsm”, four sheets consist of raw data from x, y, and z-axis and labels. Each row of each sheet is related to the same sample.
7. Conclusions
We have obtained some interesting activities comprising walking, cycling, taking a train, a bus, and a taxi using a phone-based accelerometer. Data were collected and processed in two ways: raw data and simplified data. Vibrations were recorded in three dimensions, namely, longitudinal, horizontal, and vertical. Data processing was undertaken using VBA available in Excel Macro-enabled Workbook. Data can be used to train AI models to detect and classify human activities. This will be beneficial for the application of human activity recognition which can be developed for further applications and purposes.
Author Contributions
Conceptualization, S.K., S.H. and W.W.; Methodology, S.K., J.S., J.H., S.H. and W.W.; Data collection, S.K., J.S., J.H. and W.W.; Data processing, J.S.; Validation, S.K. and W.W.; Investigation, S.K. and W.W.; Writing—Original draft, J.S. and J.H.; Writing—Review and editing, S.K., S.H. and W.W.; Supervision, S.K. and W.W.; Project administration, S.K. and W.W. All authors have read and agreed to the published version of the manuscript.
Funding
This research received funding from Hitachi Europe Limited (Project 2021/1 TAP).
Institutional Review Board Statement
Not applicable.
Informed Consent Statement
Not applicable.
Data Availability Statement
The open data are fully available at https://0-doi-org.brum.beds.ac.uk/10.5281/zenodo.4976858 under Creative Commons Attribution 4.0 International license.
Conflicts of Interest
The authors declare no conflict of interest.
References
- Paixão, A.; Fortunato, E.; Calçada, R. A contribution for integrated analysis of railway track performance at transition zones and other discontinuities. Constr. Build. Mater. 2016, 111, 699–709. [Google Scholar] [CrossRef]
- Ma, Z.; Qiao, Y.; Lee, B.; Fallon, E. Experimental evaluation of mobile phone sensors. In Proceedings of the 24th IET Irish Signals and Systems Conference (ISSC 2013), Letterkenny, Ireland, 20–21 June 2013. [Google Scholar]
- Mohri, M.; Rostamizadeh, A.; Talwalkar, A. Foundations of Machine Learning; MIT Press: Cambridge, MA, USA, 2018. [Google Scholar]
- Siirtola, P.; Röning, J. Recognizing human activities user-independently on smartphones based on accelerometer data. Int. J. Interact. Multimed. Artif. Intell. 2012, 1, 38–45. [Google Scholar] [CrossRef]
- Frank, A. UCI Machine Learning Repository. 2010. Available online: http://archive.ics.uci.edu/ml (accessed on 1 January 2021).
- Carpineti, C.; Lomonaco, V.; Bedogni, L.; Di Felice, M.; Bononi, L. Custom dual transportation mode detection by smartphone devices exploiting sensor diversity. In Proceedings of the 2018 IEEE International Conference on Pervasive Computing and Communications Workshops (PerCom Workshops), Athens, Greece, 19–23 March 2018; pp. 367–372. [Google Scholar]
Figure 1.
(a) Acquire window in VibSensor for vibration data collection; (b) ViewData window in VibSensor for exporting vibration data.
Figure 1.
(a) Acquire window in VibSensor for vibration data collection; (b) ViewData window in VibSensor for exporting vibration data.

Figure 2.
Scatterplot of the activity assigned to every feature. From (a–h), the features are the average of x, y, and z, total, max, mean, min, and SD, respectively.
Figure 2.
Scatterplot of the activity assigned to every feature. From (a–h), the features are the average of x, y, and z, total, max, mean, min, and SD, respectively.


Figure 3.
The vibration in x, y, and z directions in the time domain: (a) x-direction, (b) y-direction, (c) z-direction.
Figure 3.
The vibration in x, y, and z directions in the time domain: (a) x-direction, (b) y-direction, (c) z-direction.


Figure 4.
The violin plot of the mean vibrations of each class.

Figure 5.
Probability distribution of mean absolute vibration.


Table 1.
The number of samples in each class.
| Class | The Number of Samples |
|---|---|
| Walk | 378 |
| Bike | 275 |
| Bus | 485 |
| Train | 290 |
| Taxi | 1069 |
| Total | 2497 |
Publisher’s Note: MDPI stays neutral with regard to jurisdictional claims in published maps and institutional affiliations. |
© 2021 by the authors. Licensee MDPI, Basel, Switzerland. This article is an open access article distributed under the terms and conditions of the Creative Commons Attribution (CC BY) license (https://creativecommons.org/licenses/by/4.0/).
Share and Cite
MDPI and ACS Style
Kaewunruen, S.; Sresakoolchai, J.; Huang, J.; Harada, S.; Wisetjindawat, W. Human Activity Vibrations. Data 2021, 6, 104. https://0-doi-org.brum.beds.ac.uk/10.3390/data6100104
AMA Style
Kaewunruen S, Sresakoolchai J, Huang J, Harada S, Wisetjindawat W. Human Activity Vibrations. Data. 2021; 6(10):104. https://0-doi-org.brum.beds.ac.uk/10.3390/data6100104
Chicago/Turabian StyleKaewunruen, Sakdirat, Jessada Sresakoolchai, Junhui Huang, Satoru Harada, and Wisinee Wisetjindawat. 2021. "Human Activity Vibrations" Data 6, no. 10: 104. https://0-doi-org.brum.beds.ac.uk/10.3390/data6100104