
A Data Resource for Sulfuric Acid Reactivity of Organic Chemicals


1
Department of Earth, Atmospheric and Planetary Sciences, Massachusetts Institute of Technology, 77 Massachusetts. Avenue., Cambridge, MA 02139, USA
2
Department of Physics, Massachusetts Institute of Technology, 77 Massachusetts. Avenue., Cambridge, MA 02139, USA
3
Department of Aeronautics and Astronautics, Massachusetts Institute of Technology, 77 Massachusetts. Avenue., Cambridge, MA 02139, USA
*
Author to whom correspondence should be addressed.
Data 2021, 6(3), 24; https://0-doi-org.brum.beds.ac.uk/10.3390/data6030024
Submission received: 4 December 2020
/
Revised: 25 January 2021
/
Accepted: 22 February 2021
/
Published: 25 February 2021
(This article belongs to the Section Chemoinformatics)
Abstract
:We describe a dataset of the quantitative reactivity of organic chemicals with concentrated sulfuric acid. As well as being a key industrial chemical, sulfuric acid is of environmental and planetary importance. In the absence of measured reaction kinetics, the reaction rate of a chemical with sulfuric acid can be estimated from the reaction rate of structurally related chemicals. To allow an approximate prediction, we have collected 589 sets of kinetic data on the reaction of organic chemicals with sulfuric acid from 262 literature sources and used a functional group-based approach to build a model of how the functional groups would react in any sulfuric acid concentration from 60–100%, and between −20 °C and 100 °C. The data set provides the original reference data and kinetic measurements, parameters, intermediate computation steps, and a set of first-order rate constants for the functional groups across the range of conditions −20 °C–100 °C and 60–100% sulfuric acid. The dataset will be useful for a range of studies in chemistry and atmospheric sciences where the reaction rate of a chemical with sulfuric acid is needed but has not been measured.
Dataset: doi: 10.5281/zenodo.4467868
Dataset License: Dataset is made available under the Creative Commons license CC BY (SA).
1. Summary
The chemistry of sulfuric acid is of practical importance to industry [1], as well as to atmospheric sciences and astronomy. The kinetics of reaction with sulfuric acid—whether a substance will react and how fast, under a wide range of conditions—is, therefore, of great practical importance. The reactivity of a molecule in sulfuric acid may be calculated exactly when the molecule’s pKa is known (and so its ionization state in the acid of different concentrations is known), and the reaction mechanism is known (reviewed in [1,2,3,4]). However, these properties are rarely known unless the kinetics have already been experimentally measured for the compound of interest or a compound that is structurally closely related. Estimating the stability of new substances in sulfuric acid, therefore, must rely on comparison with diverse chemicals containing functional groups similar to the test molecule. The dataset presented in this paper provides a set of kinetic examples for such reactivity estimation and modeling from literature data and an extrapolated set of kinetic parameters based on the experimentally derived examples.
Data on the reactivity of chemicals in sulfuric acid is scattered in diverse literature, using diverse reporting methods and units. We compiled data on the reaction kinetics for 589 reactions in concentrated sulfuric acid from 262 literature sources and converted them to a dataset in a unified system of units. Literature searches were both from citations in books and papers on sulfuric acid chemistry and by keyword. In the case of phosphine, a model of reactivity was built from scattered literature hints to fill in a crucial part of chemical space, for reasons described below. The compiled data were then used to build a dataset of extrapolated reaction rates for a set of 130 functional groups liable to breakdown or solvolysis in concentrated sulfuric acid and a complementary set of reaction parameters for sulfonation of phenyl rings.
The data provided by the dataset can be used to give a pragmatically based indication of the stability of an arbitrary chemical in sulfuric acid. Detailed mechanistic studies (either ab initio quantum calculations of reaction paths or detailed experimental kinetic studies) would give much more accurate predictions but are extremely time-consuming. In their absence, we believe that the dataset presented in this paper will be useful for any researcher looking to explore the reactivity of chemicals in sulfuric acid for applications such as, but not limited to, stratospheric chemistry or planetary atmospheric modeling. The dataset will also have industrial applications, where sulfuric acid is a widely used reagent. In this regard, future work could extend this study to the reactivity of organic compounds with nitric acid and with nitric and sulfuric acid mixtures, which are widely used in nitration reactions [5].
2. Data Description
2.1. Summary of Data
The dataset is a compilation of literature data on sulfuric acid reactivity of molecules, converted to unified data units. The data fall into three parts:
- Original literature data (Excel Sheets “Data” and “References”);
- Functional group definitions (Excel Sheet “Groups List”);
- Derived kinetic constants (Excel Sheets “Concentration Lookup”, “Group defaults” and “Group Rates Matrix”).
The derived kinetic constants are extrapolated from the literature data using the functional group definitions, as described below in Section 3.5.
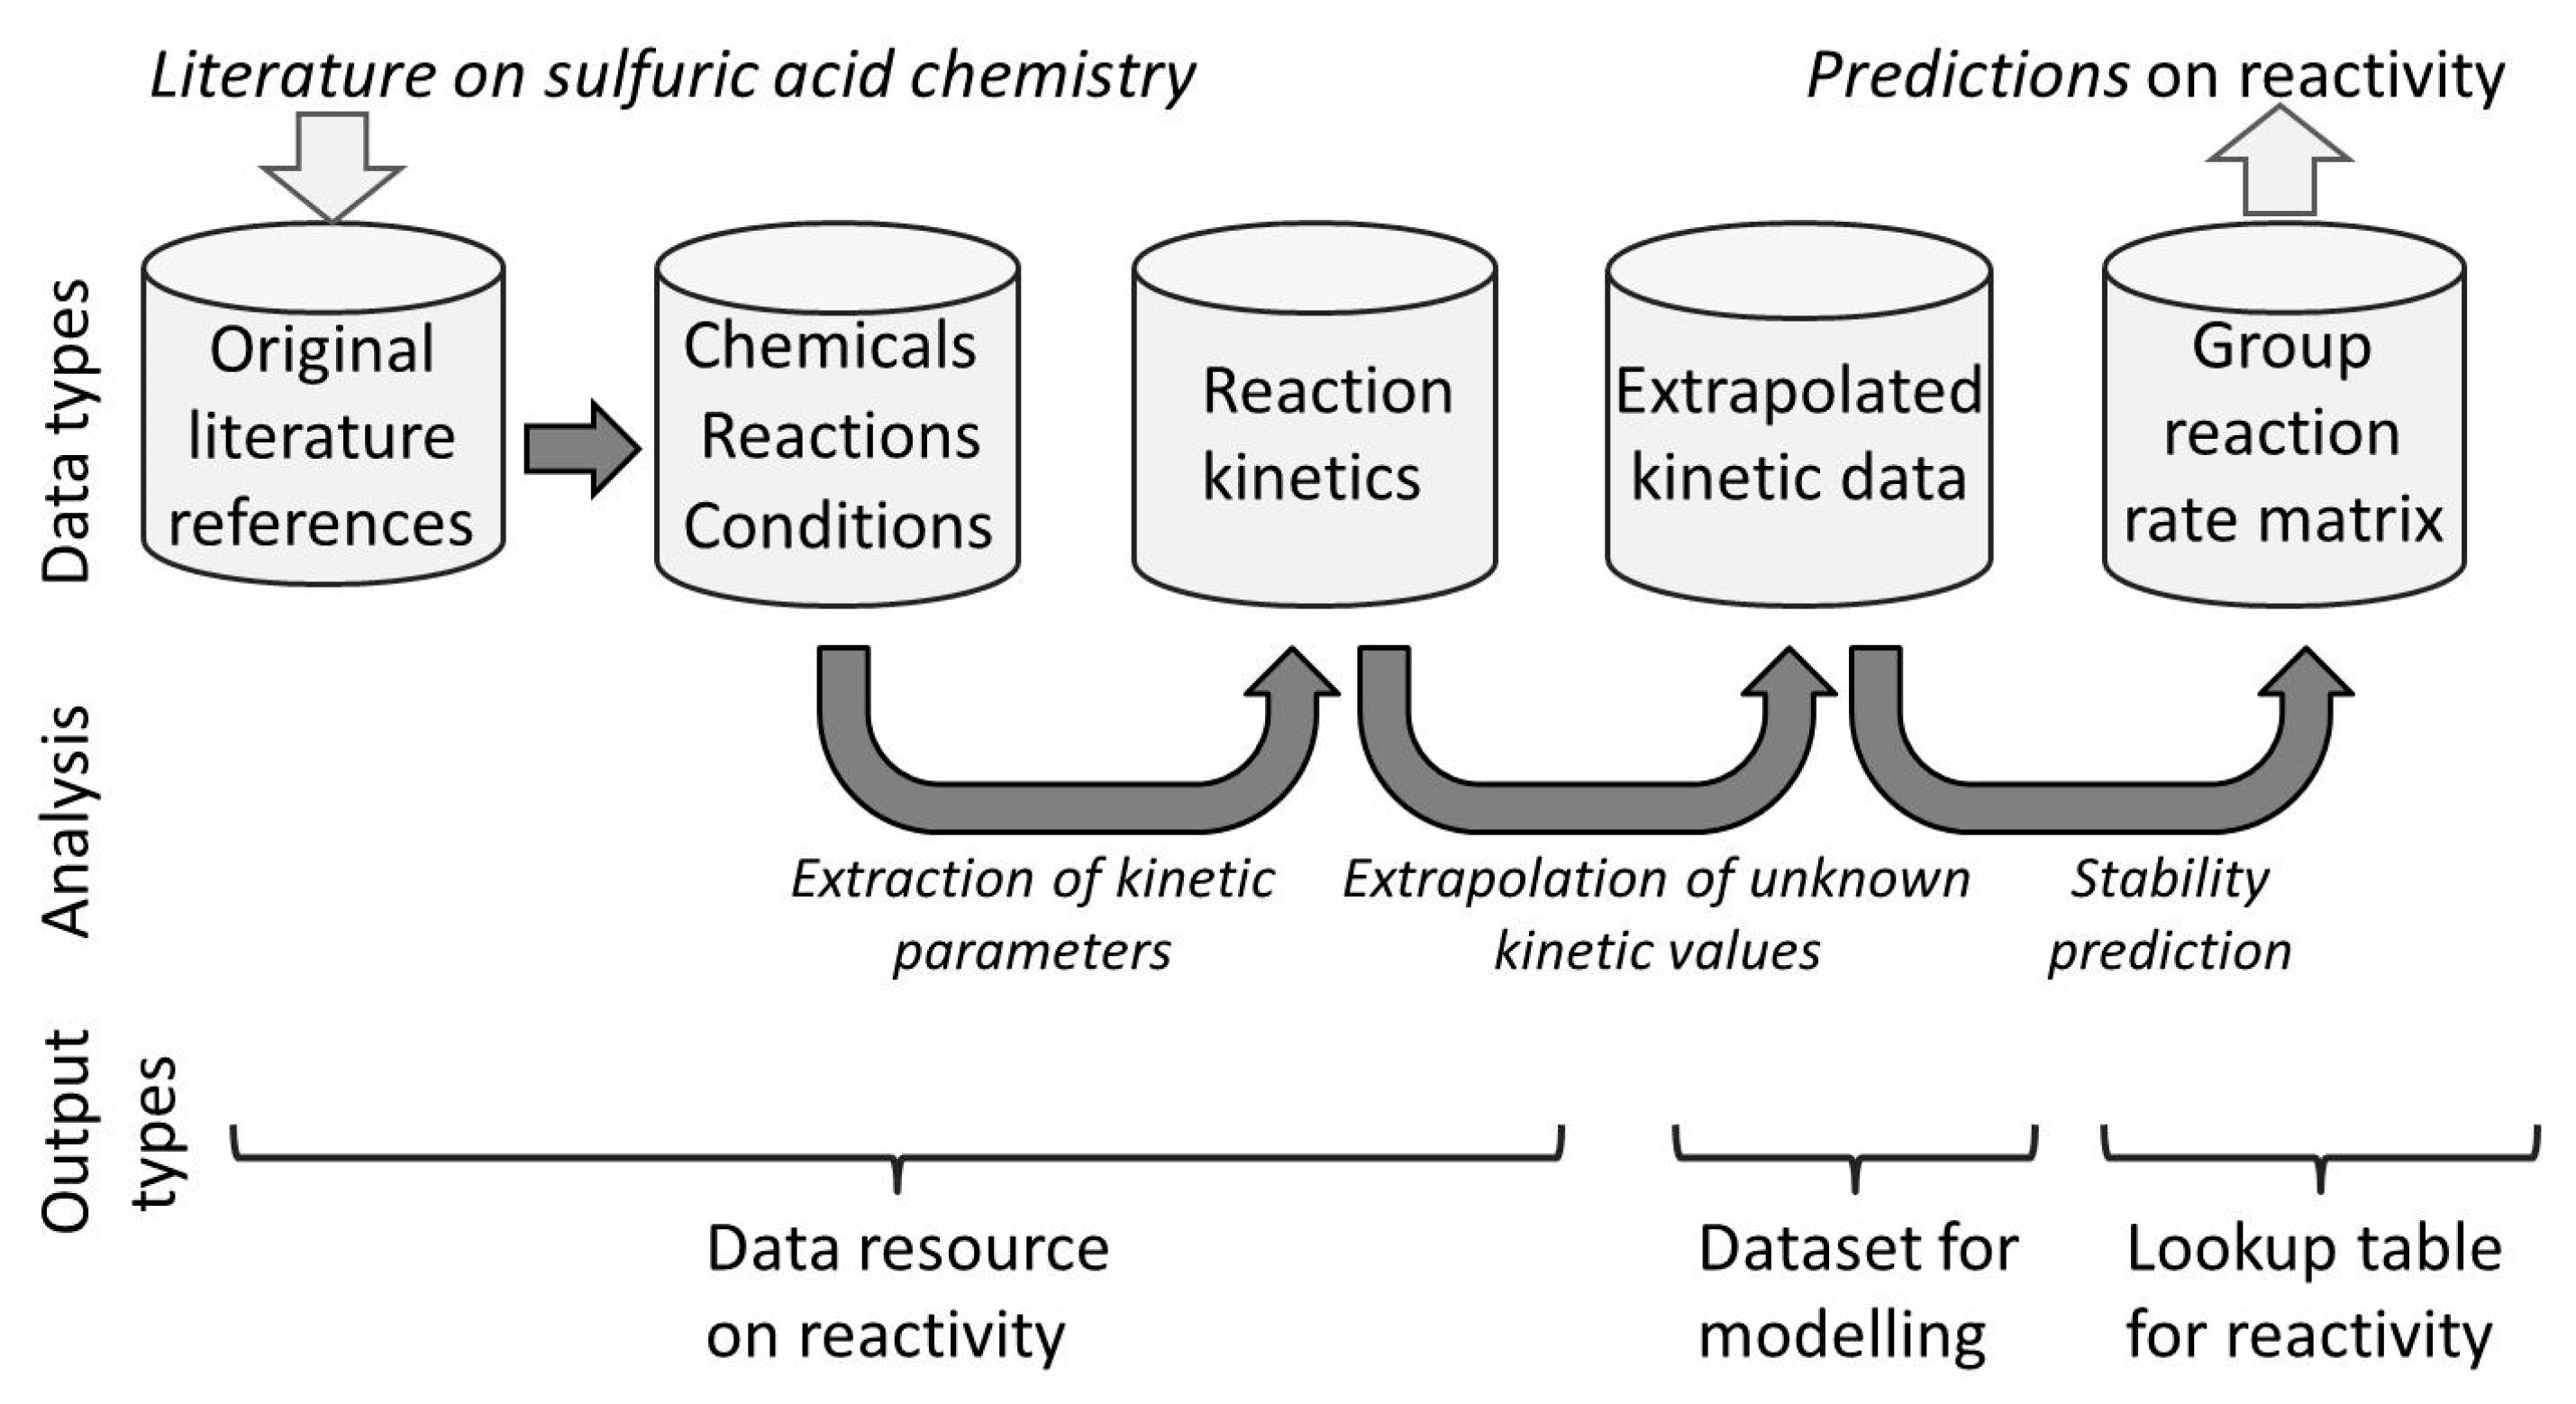
The structure of the data is illustrated in Figure 1.
Chemical Structure Format (the SMILES Convention)
2.2. Summary Statistics
The original data comprise 589 reactions of 489 compounds identified from 262 literature references, most deriving from the period 1950–1980, but in total covering the period 1907–2019. The data were classified as to whether reactions were measured at a SINGLE acid concentration value or MULTIPLE acid concentrations, and whether they were measured at one temperature (“No_Q10”), multiple temperatures for one acid concentration (“SINGLE_Q10”), or multiple temperatures at multiple acid concentrations (“MULTIPLE_Q10”). The coverage of these combinations is summarized in Table 1.
2.3. Data Schema
The data are presented as an Excel file with multiple sheets; further files provide each sheet in a tab-separated variable (.TSV) format. All cells are free-form (i.e., not fixed length). All numbers are floating-point unless indicated otherwise. The data fields are summarized in Table 2.
3. Methods
3.1. Literature Search for Data
The literature was searched for papers presenting kinetic data as follows: only papers that presented original rate measurements were considered; papers that presented summary kinetic equations or qualitative statements of rate were not included. Papers were identified (a) from citations in standard texts on sulfuric acid chemistry [1,2,4], (b) by search of Google Scholar using keywords “concentrated sulfuric” or “concentrated sulfuric” and “kinetics” or “rate of reaction”, and (c) search of all papers cited in or citing papers found by approaches (a) and (b). Roughly 1500 papers were scanned, of which 262 yielded usable data.
All these papers reported the kinetic analysis of reaction of a compound containing a specific chemical group, here termed a functional group. Each molecule contained one and only one functional group. This is because the objective of all the papers was to study the mechanism of the reaction of that functional group. The molecule might contain other structures, but these were selected not to react under the conditions used. For example, the solvolysis of benzamides is studied in compounds that (by definition) contain phenyl rings [8,9], but the amide group is broken down many orders of magnitude faster than phenyl rings are sulfonated, and so in effect, the molecule can be considered as having only amide groups as a reacting moiety.
The data for the reactivity of phosphine were compiled differently. Because of the interest in phosphine in the acid clouds of Venus [10], the reactivity of this molecule was of particular interest. However, no systematic kinetic data exists for the reaction of phosphine with sulfuric acid, despite the industrial importance of this reaction [11]. Single reaction points were, therefore, identified in five sources [12,13,14,15,16] and matched to Q10, m and c values from Equation (2) below. This is not ideal, as these are semi-anecdotal reports gathered up to a century ago under a wide range of conditions and illustrates the need for more systematic measurement of some literature values.
3.2. Data Checking and Validation
The data within a paper were assessed for consistency by checking plots of rate vs. concentration with the paper’s own conclusions and for a smooth rate: concentration relationship. Outliers or sudden changes in curve gradient suggested an error, often in transcription, but sometimes in the original publication (usually typographical errors, such as a missing minus sign). The data were validated by internal reference within the dataset as follows: During compilation of kinetic parameters (see below), the scatter of predicted rates for a class of compounds was plotted for three sets of conditions. Typically ranges of rates were 1–2 log units. Outliers with a greater difference from the mean than 2 log units were checked against the original paper for transcription errors.
No attempt was made to check a paper’s underlying scientific rationale. Not only was this impractical, but it was also not in the spirit of the database, which is to report what the literature says, not to critique it.
3.3. Rate Units
Rates were assumed to be first order with respect to the target chemical, i.e., represented by a constant rate k with units of time−1. This is true of almost all reactions studied; for those where second-order kinetics applies at higher concentrations (e.g., [17,18]), first-order kinetics are approximated at low concentrations. If rate constants or raw data were reported in units other than second−1, the rate was converted according to Equation (1) reported in time units other than seconds where:
where the rate(second) is the rate in units of seconds−1, rate(units) is the rate in some other time unit, and (seconds/unit) is the number of seconds in that time unit.
rate(second) = rate(units)/(seconds/unit),
Concentrations were converted to % acid units. Common concentration units were molar acid, molar water, and Hammett acidity Ho [1]. Specific tables for converting these units to % acid were constructed from [1,2,4,19,20], as the relationship between them is nonlinear. Lookup tables are provided in the sheet “Concentration Lookup” in the dataset.
For some measurements, a rate of reaction at just a single concentration of sulfuric acid is reported (measurements we have designated SINGLE). For others, reaction rates at multiple concentrations are reported; such measurements are often used to determine the reaction mechanism. Reactions with rates measured at several sulfuric acid concentrations were designated MULTIPLE. For MULTIPLE entries, rates were matched to Equation (2)
where m (the gradient of the linear plot of log(rate) vs. acid concentration) and c (the intercept of that plot) are constants, the rate is the rate in the reported units (see above), and conc. is the concentration of sulfuric acid. For MULTIPLE data entries, m and c were recorded in the dataset. A log-linear relationship was found to give a reasonable match to almost every data set for concentrations between 60% and 98%. Below 60%, some (but not all) reactions show substantially nonlinear kinetics with acid concentration due to competing reaction mechanisms. Above 98% species, such as SO3 and H2S2O7, become significant players in reaction chemistry [21], Hammett acidity becomes highly nonlinear with concentration [1], and this simple formalism is less reliable.
Log(rate) = m ∗ (conc.) + c
3.4. Calculation of Q10 Values
Reactions invariably proceed faster at higher temperatures, but the degree to which a reaction is accelerated by an increase in temperature depends on the activation energy of the reaction, which itself is dependent on the mechanism and is not readily inferred. The rate at which a reaction increases in rate is conveniently parameterized as a Q10 value—the multiple by which a reaction rate increases for a 10 °C increase in temperature. A wide range of temperature data was converted to a uniform Q10 parameter for the 83 reports that included data on rates at different temperatures.
Q10 was calculated from the reports of the rate at a different temperature as follows: For a table of rate values and temperatures, starting with the lowest temperature, the gradient of a plot of (log(rate/rateo) vs. (T − To)/10 gave as gradient log(Q10), where the rate is the rate at temperature T, and rateo is the rate at temperature To.
Some papers only allowed the calculation of Q10 for a single concentration of sulfuric acid (measurements designated SINGLE_Q10). This was reported in the database, together with the concentration at which it was measured. Others allowed calculations of Q10 for several acid concentrations (measurements, which were designated MULTIPLE_Q10). For these, the value of Q10 was plotted as a function of acid concentration, and the data set records the gradient and intercept of a straight line least-squares match through those data to form Equation (3):
Q10 = n ∗ (conc.) + d
Note that the majority of the entries had no Q10 data, as shown in Table 1 (By contrast, all entries, by definition, had kinetic rate data).
3.5. Inference of Unmeasured Kinetic Parameters for Solvolysis Reactions
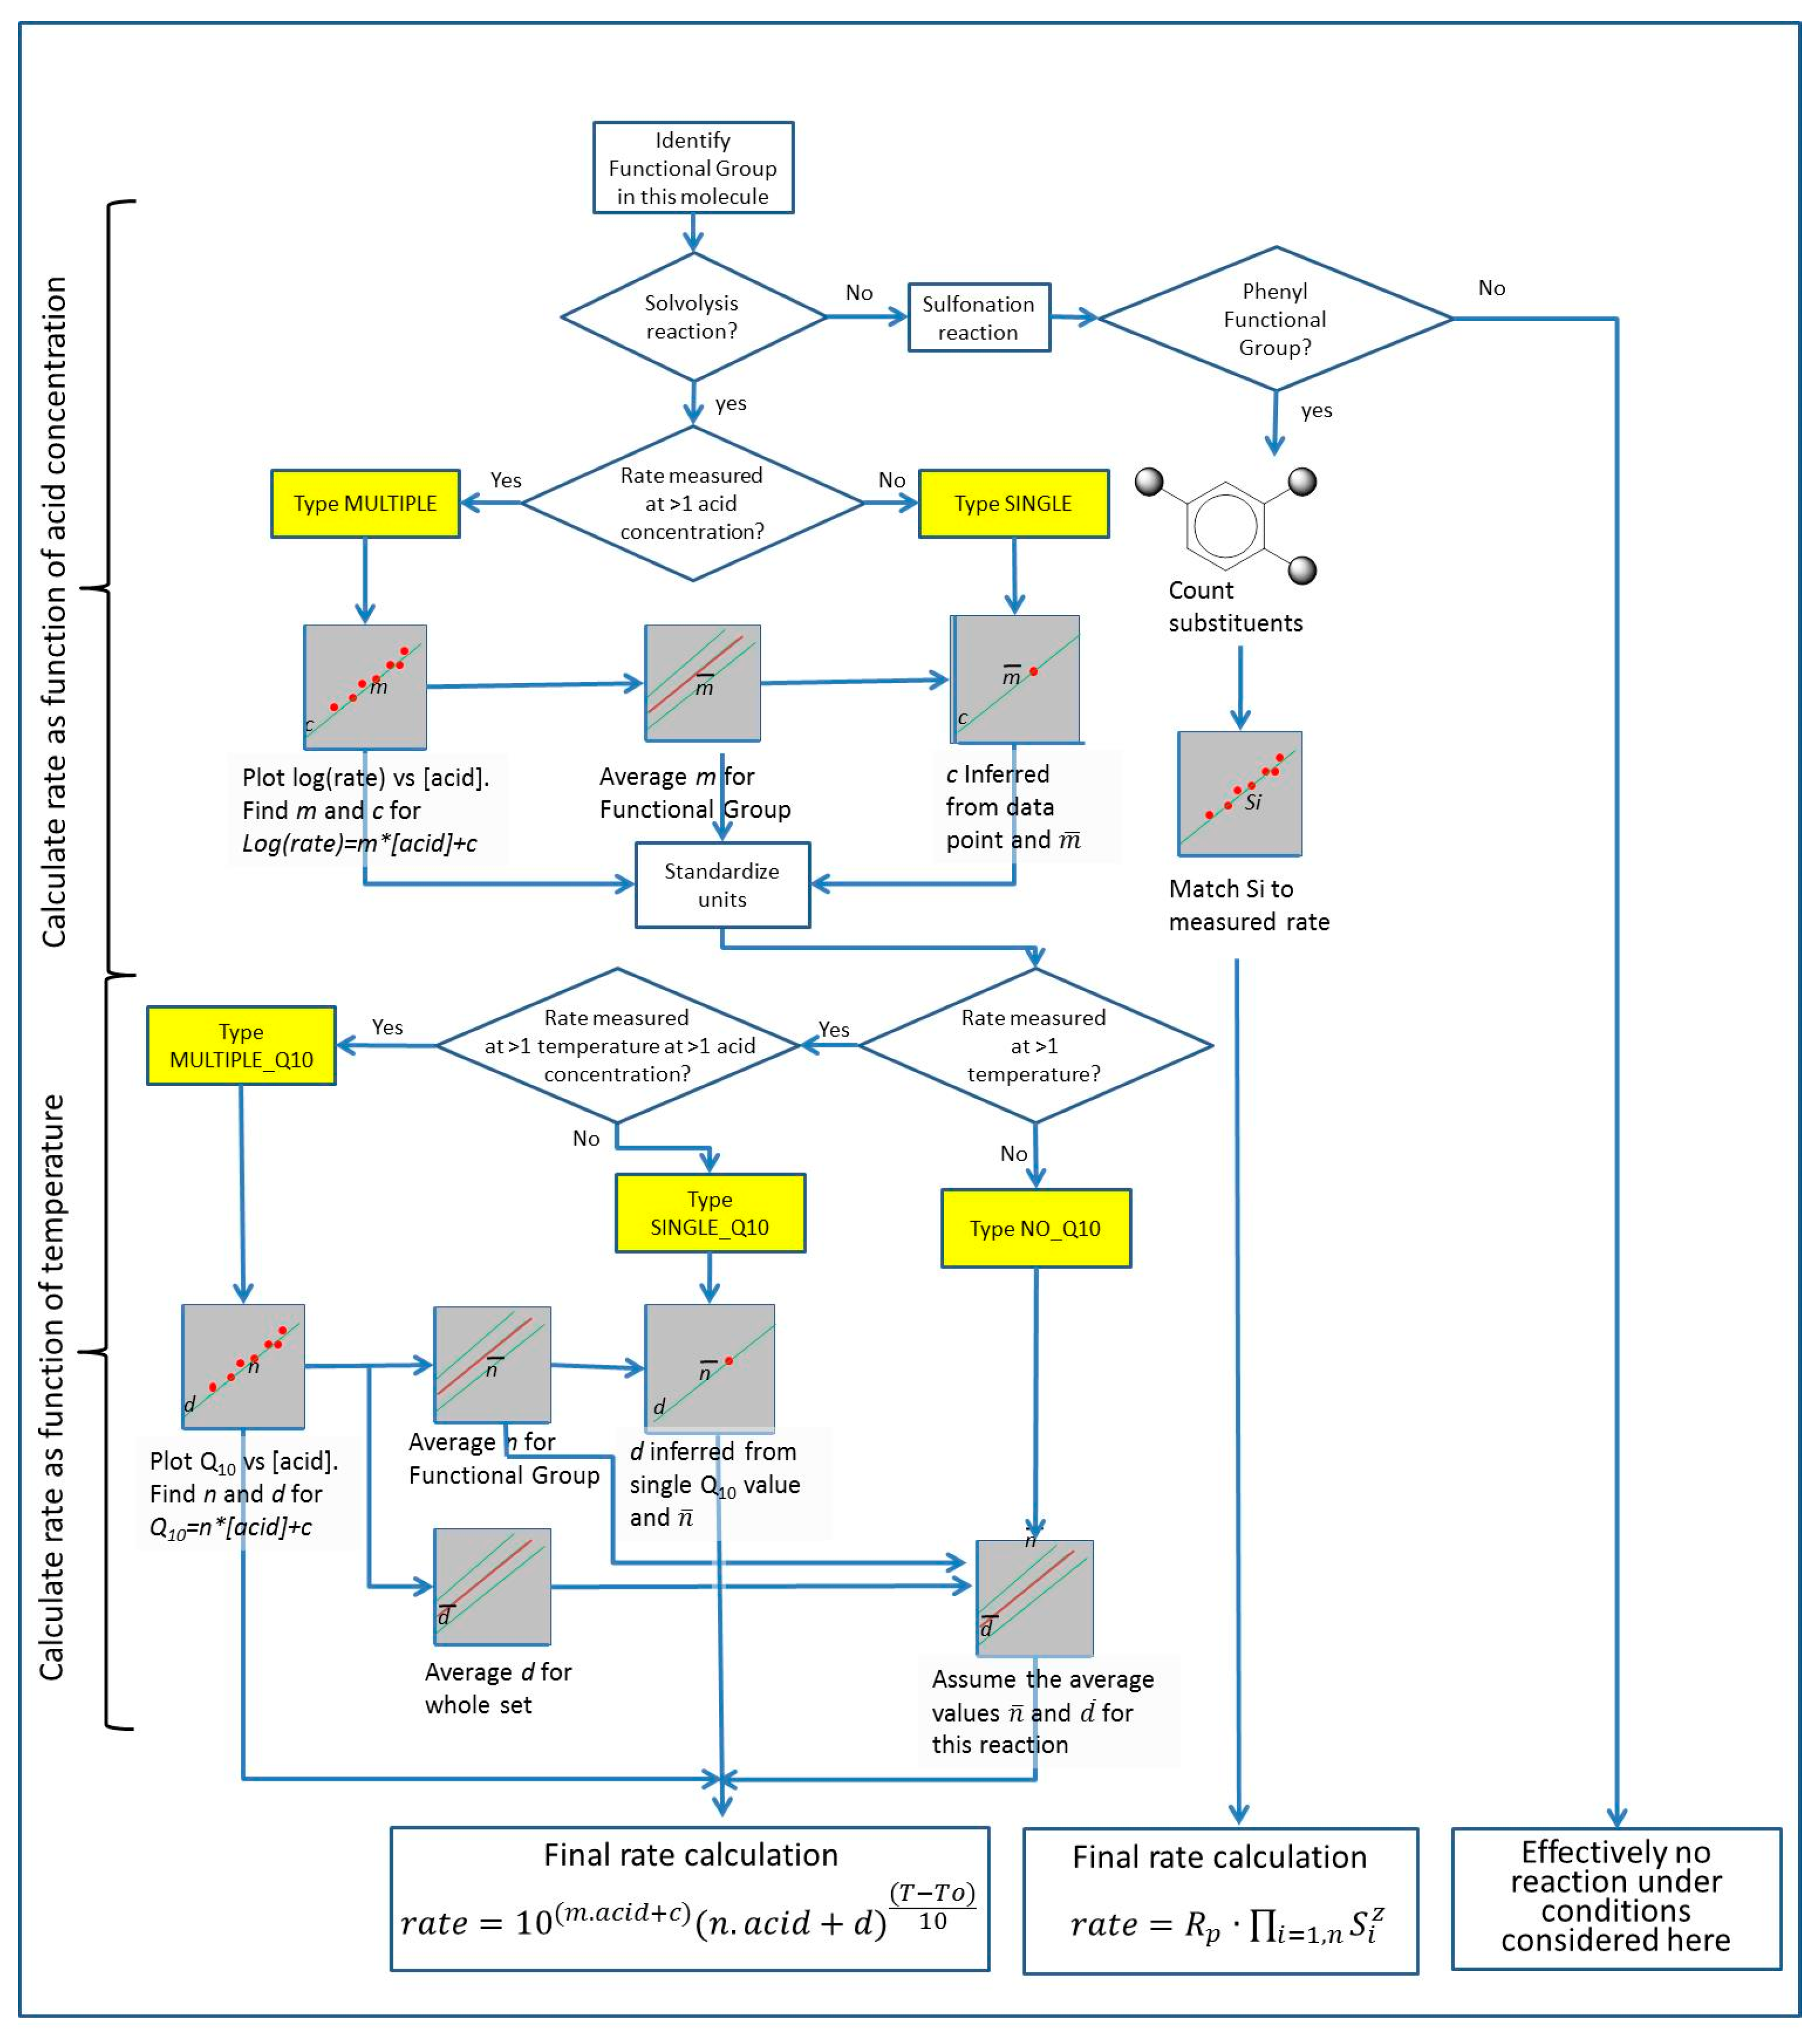
The ideal would be to have MULTIPLE data and MULTIPLE_Q10 for all entries. As shown in Table 1, this is not the case, and the data set needed to predict the reaction of a chemical at an arbitrary temperature and acid concentration is largely missing. For a complete picture of sulfuric acid reactivity, the missing rate values must be reconstructed from the single measured values and the typical rate at which the rate of reaction changes with acid concentration for that class of chemicals. This was achieved as follows: The pipeline is summarized in Figure 2.
Reactions that resulted in solvolysis or other breakdowns of the molecule (for example, hydrolysis of esters, oxidation of thiols, dehydration of alcohols) were treated differently from reactions involving sulfonation (adding an SO3 group to a molecule). Solvolysis reactions have kinetics that depends on the nature of the group being affected, and there is a wide range of possible groups. Sulfonations, by contrast, happens almost exclusively on phenyl rings (for reasons discussed below) and hence have more uniform chemistry.
Solvolysis reactions are predicted on the basis of functional groups. A functional group is defined as a small group of atoms with characteristic chemical reactivity. It is expected that each functional group would have a characteristic sensitivity to attack by sulfuric acid and that molecules containing a given functional group would have similar mechanisms of reaction with sulfuric acid.
Each of the compounds whose reactions were characterized was assigned to a functional group on the basis of the group that was being affected by sulfuric acid. As noted above, each compound contains only one functional group that is relevant for the conditions of the experiment, and hence each compound could be uniquely associated with one and only one functional group. Two sets of average properties for functional groups were then assigned:
- A mean gradient m from all the Equation (2). If no gradient was available for a functional group, i.e., there are no MULTIPLE values for that functional group, then the mean of the gradient m for the entire dataset is used instead. The result is designated GROUP_RATE_DEFAULT_GRADIENT;
- A mean gradient for Q10 as a function of acid concentration for each functional group. If a functional group has no MULTIPLE_Q10 values, then the mean of the gradient of Q10 with acid concentration for the entire dataset is used instead. The result is designated GROUP_Q10_DEFAULT_GRADIENT.
The following algorithm was then used to compile a set of reaction rates for each of the functional groups
- Fill in a complete set of parameters for Equations (1) and (2) as follows:
- For MULTIPLE data:
- Rate gradients m and constants c for Equation (2) were taken from the experimental data
- For SINGLE data:
- Rate gradients m for Equation (2) were looked up in the table of GROUP_RATE_DEFAULT_GRADIENT values
- Rate constants c for Equation (2) were calculated according to:where rate = the single reaction rate measured by experiment and concentration is the concentration at which it is measuredc = LOG(rate) − GROUP_RATE_DEFAULT_GRADIENT ∗ concentration,
- For MULTIPLE_Q10 data
- Gradient n and constant d in Equation (3) relating Q10 to acid concentration were taken from experimental data
- For SINGLE_Q10 data
- Gradient n in Equation (3) relating Q10 to acid concentration were looked up in the table GROUP_Q10_DEFAULT_GRADIENT
- The constant d in Equation (3) was calculated according to Equation (5):where Measured_Q10 is the single measured value for Q10, and concentration is the concentration of acid at which it was measuredd = Measured_Q10 − GROUP_Q10_DEFAULT_GRADIENT ∗ concentration,
- For No_Q10 values (i.e., measurements where no data on the dependence on rate with temperature was published)
- Gradient n in Equation (3) relating Q10 to acid concentration were looked up in the table of GROUP_Q10_DEFAULT_GRADIENT
- The constant d in Equation (3) was assumed to be the global average value of d = 3.41612
- Calculate rates for all molecules based on the interpolated constant data. With the “filled in” table of values for m, c, n and d, we calculate the predicted rate constant k for each reaction in the original dataset according to Equation (6):where To is the temperature at which that reaction was originally measured, T is the temperature we wish to predict, acid is the concentration of acid in which we wish to predict reaction rate, in units of %, m, c, n and d are the parameters derived above, and k is the rate constant in seconds−1.The selection of T and acid is arbitrary, but to build a systematic table in which values can easily be looked up, a matrix of temperatures from −20 °C to 100 °C and 60% acid to 100% acid was used.
- Average rates for all reactions in each functional group, to make an average rate for that functional group
The final output of the algorithm is a table of reaction rates for each of the functional groups for the whole matrix of conditions modeled in Equation (6). This matrix is provided in the sheet “Group Rates Matrix” as the Log10(rate constant)
3.6. Inference of Unmeasured Kinetic Parameters for Sulfonation Reactions
Unlike solvolysis reactions, sulfonation reactions are effectively the chemistry of phenyl rings. Sulfonation only occurs in concentrated sulfuric acid and at elevated temperatures. A range of reagents can sulfonate other groups and can sulfonate phenyl at lower temperatures [2], but this chemistry is not relevant to the chemistry of sulfuric acid itself. Thus, groups that are less stable to solvolysis than phenyl rings will be attacked and degraded before they are sulfonated (e.g., furan rings), and nitrogen-containing aromatics are resistant to any sulfuric acid chemistry and can only be sulfonated by more potent sulfonating agents, such as “oleum” (solutions of SO3 in pure sulfuric acid) [22,23].
For phenyl rings, sulfonation is accelerated or retarded depending on the electronic effects of substituents on the rings. Sulfonation rates for a phenyl ring with arbitrary substituents were calculated as follows: A base rate for sulfonation of the phenyl ring was obtained directly from experimental data, as described above. Sulfonation for a substituted phenyl ring was estimated as
where Rp is the rate of sulfonation of benzene, Si is the multiplicative factor for substituent i, and z is the number of i substituents on the ring. Multiplicative factors for the addition of substituents to the ring were then estimated using a simulated annealing algorithm [9] to minimize the difference between predicted values and experimental values for the range of substituted phenyls present in the original experimental dataset under the same matrix of conditions described in Section 3.5, algorithm step 2 above.
The output of the algorithm is a table of “base rates” of reaction for unmodified benzene at the same selected temperatures and acid concentrations as for the solvolysis reactions in Section 3.5 above, and a set of parameters in the sheet “group defaults”.
4. User Notes
The dataset is available for downloading from zenodo.org as an Excel 2010 spreadsheet and as separate TSV files representing each of the Excel sheets, which, together with a “readme” file, are presented as a *.zip archive. We suggest that there are three ways the data could be used.
- Lookup of reaction rates for specific functional groups, using tables in the sheets “group defaults” (for sulfonation) and “group rates matrix” (for solvolysis) for a specific set of conditions;
- Lookup interpolated kinetic data from the sheet “data” to build a customized database of rates, either for a customized set of conditions or using a different averaging schema;
- Use the primary data from the datasheet to build a new algorithm for “filling in” missing data and/or trace original data from the references listed.
Author Contributions
Project conceptualization; S.S., W.B., J.J.P.; methodology W.B.; software, J.J.P.; data collection and processing W.B.; writing—original draft preparation, W.B., writing—review and editing, J.J.P., S.S., W.B.; funding acquisition, S.S. All authors have read and agreed to the published version of the manuscript.
Funding
This research was funded by the Change Happens Foundation, and by Breakthrough Initiatives
Data Availability Statement
Data is downloadable from Zenodo.org using doi:10.5281/zenodo.4467868, under the Creative Commons license CC BY (SA).
Conflicts of Interest
The authors declare no conflict of interest.
References
- Liler, M. Reaction Mechanisms in Sulphuric Acid and Other Strong Acid Solutions; Academic Press: London, UK, 1971. [Google Scholar]
- Cerfontain, H. Mechanistic Aspects in Aromatic Sulfonation and Desulfonation; Interscience Publishers: New York, NY, USA, 1968. [Google Scholar]
- Cox, R.A.; Yates, K. Kinetic equations for reactions in concentrated aqueous acids based on the concept of “excess acidity”. Can. J. Chem. 1979, 57, 2944–2951. [Google Scholar] [CrossRef] [Green Version]
- Gilbert, E.E. Sulfonation and Related Reactions; Interscience Publishers: Hoboken, NJ, USA, 1965. [Google Scholar]
- Booth, G. Nitro Compounds, Aromatic. In Ullmann’s Encyclopedia of Industrial Chemistry; Wiley-VCH Verlag GmbH & Co. KGaA: Baden-Württemberg, Germany, 2000. [Google Scholar] [CrossRef]
- Weininger, D. SMILES, a chemical language and information system. 1. Introduction to methodology and encoding rules. J. Chem. Inf. Comput. Sci. 1988, 28, 31–36. [Google Scholar] [CrossRef]
- Van Drie, J.H.; Weininger, D.; Martin, Y.C. ALADDIN: An integrated tool for computer-assisted molecular design and pharmacophore recognition from geometric, steric, and substructure searching of three-dimensional molecular structures. J. Comput. Aided Mol. Des. 1989, 3, 225–251. [Google Scholar] [CrossRef]
- Edward, J.T.; Meacock, S.C.R. 383. Hydrolysis of amides and related compounds. Part I. Some benzamides in strong aqueous acid. J. Chem. Soc. 1957, 2000–2007. [Google Scholar] [CrossRef]
- Smith, C.R.; Yates, K. Structure, medium, and temperature dependence of acid-catalyzed amide hydrolysis. J. Am. Chem. Soc. 1971, 93, 6578–6583. [Google Scholar] [CrossRef]
- Greaves, J.S.; Richards, A.M.; Bains, W.; Rimmer, P.B.; Sagawa, H.; Clements, D.L.; Seager, S.; Petkowski, J.J.; Sousa-Silva, C.; Ranjan, S. Phosphine gas in the cloud decks of Venus. Nat. Astron. 2020. [Google Scholar] [CrossRef]
- Xiao-yong, Z. Process for purification of crude acetylene gas by using concentrated sulphuric acid. Polyvinyl Chloride. 2009, 7. [Google Scholar]
- Sheldrick, G.M. Nuclear Magneic Resonace Studies of Inorganic Hydrides; University of Cambridge: Cambridge, UK, 1966. [Google Scholar]
- Lorenz, M.L.; Lutzmann, H.; Reichert, M. Procédé Pour L’épuration D’acétylène Obtenu à Partir D’hydrocarbures; Ministere des affaires economique et de l’energie: Berlin, Germany, 1963. [Google Scholar]
- Dorfman, Y.; Yukht, I.; Levina, L.; Polimbetova, G.; Petrova, T.; Emelyanova, V. Oxidation of Ph3 and Ash3 through metal-complexes, free and connected oxygen. Uspekhi Khimii 1991, 60, 1190–1228. [Google Scholar]
- Miller, S.A. Acetylene: Its Properties, Manufacture and Uses; Ernest Bern Ltd.: London, UK, 1965; Volume I. [Google Scholar]
- Leeds, F.H.; Butterfield, J.J.A. Acetylene, the Principles of Its Generation and Use: A Practical Handbook on the Production, Purification, and Subsequent Treatment of Acetylene for the Development of Light, Heat and Power; C. Griffin: London, UK, 1910. [Google Scholar]
- Datta, M.; Buglass, A.J.; Tillett, J.G. Hydrolysis of N-Phenylalkanesulfinamides in Aqueous Mineral Acids. Phosphorus Sulfur Silicon Relat. Elem. 2011, 186, 565–573. [Google Scholar] [CrossRef]
- Casale, M.T.; Richman, A.R.; Elrod, M.J.; Garland, R.M.; Beaver, M.R.; Tolbert, M.A. Kinetics of acid-catalyzed aldol condensation reactions of aliphatic aldehydes. Atmos. Environ. 2007, 41, 6212–6224. [Google Scholar] [CrossRef]
- Hammett, L.P. The Determination of the Proton-Attracting Properties of Liquids. J. Chem. Phys. 1940, 8, 644. [Google Scholar] [CrossRef]
- Jorgenson, M.J.; Hartter, D.R. A Critical Re-evaluation of the Hammett Acidity Function at Moderate and High Acid Concentrations of Sulfuric Acid. New H0 Values Based Solely on a Set of Primary Aniline Indicators. J. Am. Chem. Soc. 1963, 85, 878–883. [Google Scholar] [CrossRef]
- Cox, R.A. Mechanistic studies in strong acids. I. General considerations. Catalysis by individual acid species in sulfuric acid. J. Am. Chem. Soc. 1974, 96, 1059–1063. [Google Scholar] [CrossRef]
- McElvain, S.M.; Goese, M.A. The Sulfonation of Pyridine and the Picolines. J. Am. Chem. Soc. 1943, 65, 2233–2236. [Google Scholar] [CrossRef]
- Den Hertog, H.J.; van der Plas, H.C.; Buurman, D.J. The reactivity of pyridine towards sulphuric acid at elevated temperatures. Recl. Des Trav. Chim. Des Pays Bas 1958, 77, 963–971. [Google Scholar] [CrossRef]
Figure 1.
Data types and their relationships are presented in this paper. Top row—the data sets presented here. Central row—the relationship between the data sets and their interconversion. Bottom row—types of data and applications that can be taken from the current data set for uses as a literature resource, a resource for modeling or a lookup table for chemical stability.

Figure 2.
Pipeline for calculation of interpolated kinetic values for the reactions in the database. See Section 3.5 text for details. Yellow boxes show data types as listed in Table 2.
Figure 2.
Pipeline for calculation of interpolated kinetic values for the reactions in the database. See Section 3.5 text for details. Yellow boxes show data types as listed in Table 2.


Table 1.
Summary statistics.
| No_Q10 | SINGLE_Q10 | MULTIPLE_Q10 | |
|---|---|---|---|
| SINGLE | 182 | 14 | 0 |
| MULTIPLE | 326 | 38 | 31 |
Measurements of the kinetics of reactions in sulfuric acid, classified by the data available. SINGLE = rate measured at a single sulfuric acid concentration. MULTIPLE = rate measured at multiple concentrations. NO_Q10 = rate measured at one temperature, SINGLE_Q10 = rate measured at multiple temperatures at one sulfuric acid concentration, MULTIPLE_Q10 = rate measured at multiple temperatures and at multiple acid concentrations.
Table 2.
Data fields in the file.
| Field Name | Field Description |
|---|---|
| Sheet “Data”(in columns) | |
| NAME | Compound name |
| InChI | IUPAC InChI code for the compound |
| SMILES | SMILES string for compound |
| REACTION | Type of chemical reaction undergone |
| SINGLE_CONC | For SINGLE type, the concentration of acid used |
| SINGLE_CONC_UNITS | For SINGLE type, units for concentration reported |
| REF_TEMP | Temperature at which reaction was reported |
| SINGLE_RATE | For SINGLE type, rate of reaction |
| MUTLIPLE_GRADIENT | For MULTIPLE type, gradient (m) in Equation (2) |
| MULTIPLE_INTERCEPT | For MULTIPLE type, intercept (c) in Equation (2) |
| TIME_UNITS | Units of time in which rates are reported (seconds, minutes, etc.) |
| MULTIPLE_CONC_UNITS | For MULTIPLE type, units of concentration for Equation (2) |
| SINGLE_Q10 | For SINGLE_Q10 type, value of Q10 |
| SINGLE_Q10_CONC | For SINGLE_Q10 type, concentration at which Q10 was calculated |
| MULTIPLE_Q10_GRADIENT | For MULTIPLE_Q10 type, gradient (n) in Equation (3) |
| MULTIPLE_Q10_INTERCEPT | For MULTIPLE Q10 type, intercept (d) in Equation (3) |
| REFERENCE | Literature reference (see “Sheet reference”’ below) |
| MULTIPLE_STANDARD_GRADIENT | For MULTIPLE type, gradient (m) in Equation (2) normalized to % concentration units and seconds−1 rate units |
| MULTIPLE_STANDARD_INTERCEPT | For MULTIPLE type, intercept (d) in Equation (2) normalized to % concentration units and seconds−1 rate units |
| SINGLE_STANDARD_CONC | For SINGLE type, concentration converted to % acid |
| SINGLE_STANDARD_RATE | For SINGLE type, rate converted to seconds−1 |
| GROUP | Functional group number (see “Sheet, groups list” below) |
| EXTRAPOLATED_EQUATION_GRADIENT | Filled in gradient in Equation (2) as described in Section 3.5 below |
| EXTRAPOLATED_EQUATION_INTERCEPT | Filled in intercept in Equation (2) as described in Section 3.5 below |
| EXTRAPOLATED_Q10_GRADIENT | Filled in gradient in Equation (3) as described in Section 3.5 below |
| EXTRAPOLATED_Q10_INTERCEPT | Filled in intercept in Equation (3) as described in Section 3.5 below |
| Sheet “Concentration lookup” | |
| MOLAR and %_MOLAR | Values of concentration of sulfuric acid in molar, and corresponding values of % acid |
| Ho and %_Ho | Values are Hammett acidity of sulfuric acid and corresponding values of % acid |
| Sheet “Groups list”(in columns) | |
| NUMBER | Number code used in GROUP column in data and group defaults sheets |
| NAME | Internal name for this functional group |
| SMARTS | SMARTS string description of this functional group |
| STRUCTURE | Pictorial representation of structure |
| Sheet “Group defaults” (in rows) | |
| GROUP | Group number |
| NAME | Internal name for this functional group |
| GROUP_RATE_DEFAULT GRADIENT | Default gradient for use in extrapolating SINGLE measurement types for this functional group |
| GROUP_Q10_DEFAULT | Default Q10 value for this group |
| Sheet “Group rates matrix” (in columns) | |
| GROUP | Functional group number |
| NAME | Functional group name |
| Columns 3 (C) thru 119 (DO): | |
| Row 1: | Temperature |
| Row 2: | Acid concentration |
| Rows 3 thru 132: | Log of reaction rate constant in seconds−1 of that functional group (column 1) at the temperature and acid concentration specified at the head of the column |
| Sheet “References” (in columns) | |
| References as cited in sheet “Data” | |
Publisher’s Note: MDPI stays neutral with regard to jurisdictional claims in published maps and institutional affiliations. |
© 2021 by the authors. Licensee MDPI, Basel, Switzerland. This article is an open access article distributed under the terms and conditions of the Creative Commons Attribution (CC BY) license (http://creativecommons.org/licenses/by/4.0/).
Share and Cite
MDPI and ACS Style
Bains, W.; Petkowski, J.J.; Seager, S. A Data Resource for Sulfuric Acid Reactivity of Organic Chemicals. Data 2021, 6, 24. https://0-doi-org.brum.beds.ac.uk/10.3390/data6030024
AMA Style
Bains W, Petkowski JJ, Seager S. A Data Resource for Sulfuric Acid Reactivity of Organic Chemicals. Data. 2021; 6(3):24. https://0-doi-org.brum.beds.ac.uk/10.3390/data6030024
Chicago/Turabian StyleBains, William, Janusz Jurand Petkowski, and Sara Seager. 2021. "A Data Resource for Sulfuric Acid Reactivity of Organic Chemicals" Data 6, no. 3: 24. https://0-doi-org.brum.beds.ac.uk/10.3390/data6030024