
Tools for Remote Exploration: A Lithium (Li) Dedicated Spectral Library of the Fregeneda–Almendra Aplite–Pegmatite Field

 ,
,  ,
,  , ,
, ,  , , , ,
Abstract
:1. Summary
2. Data Description
- Spectrum name
- Acquisition equipment
- Sample type
- Sample conditions
- Sample face type
- Sample color
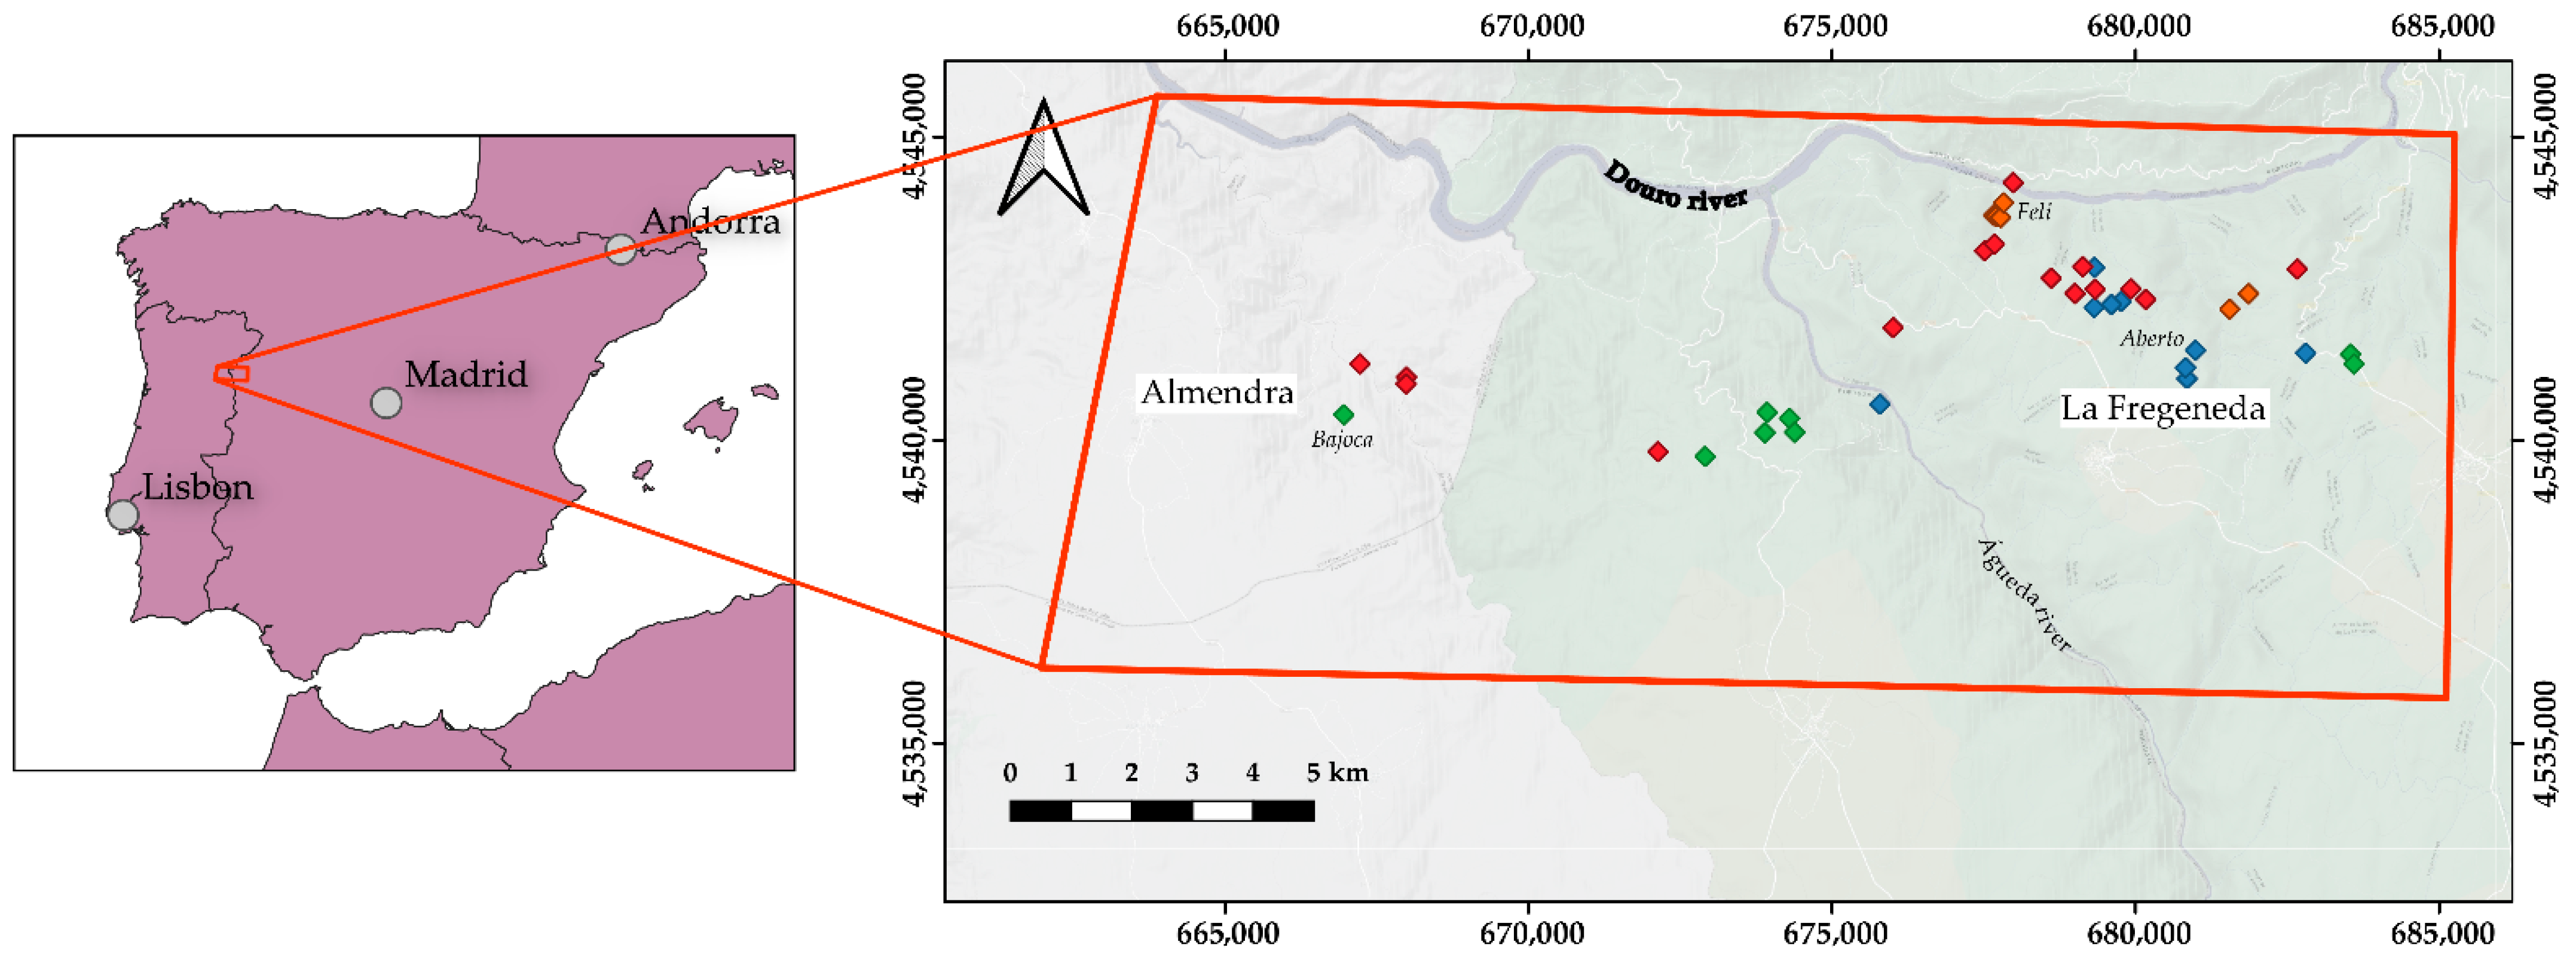
- Location
- Coordinates (Universal Transverse Mercator zone 29N from the WGS84 datum).
3. Methods
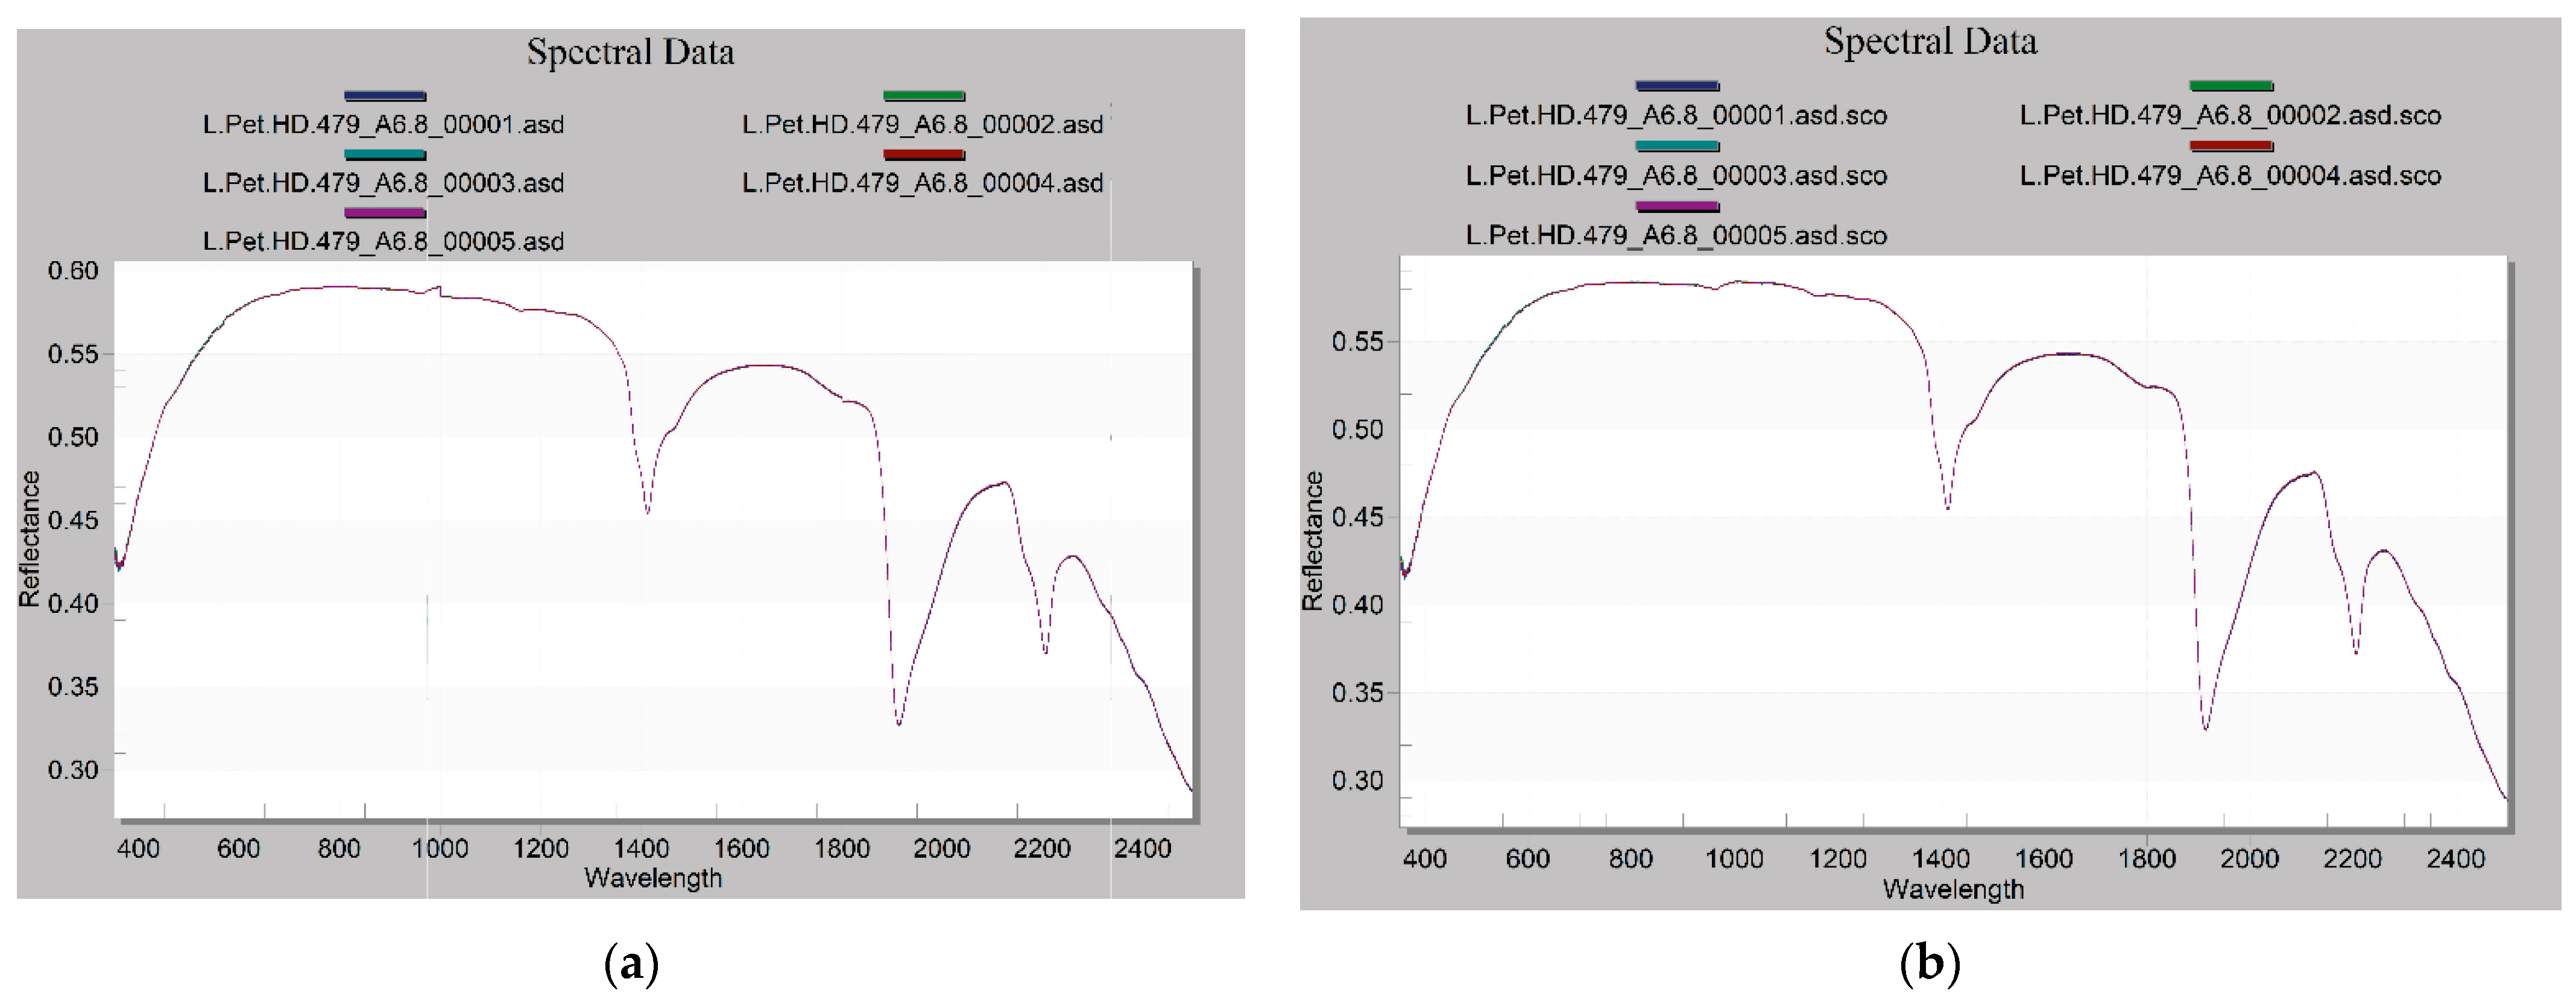
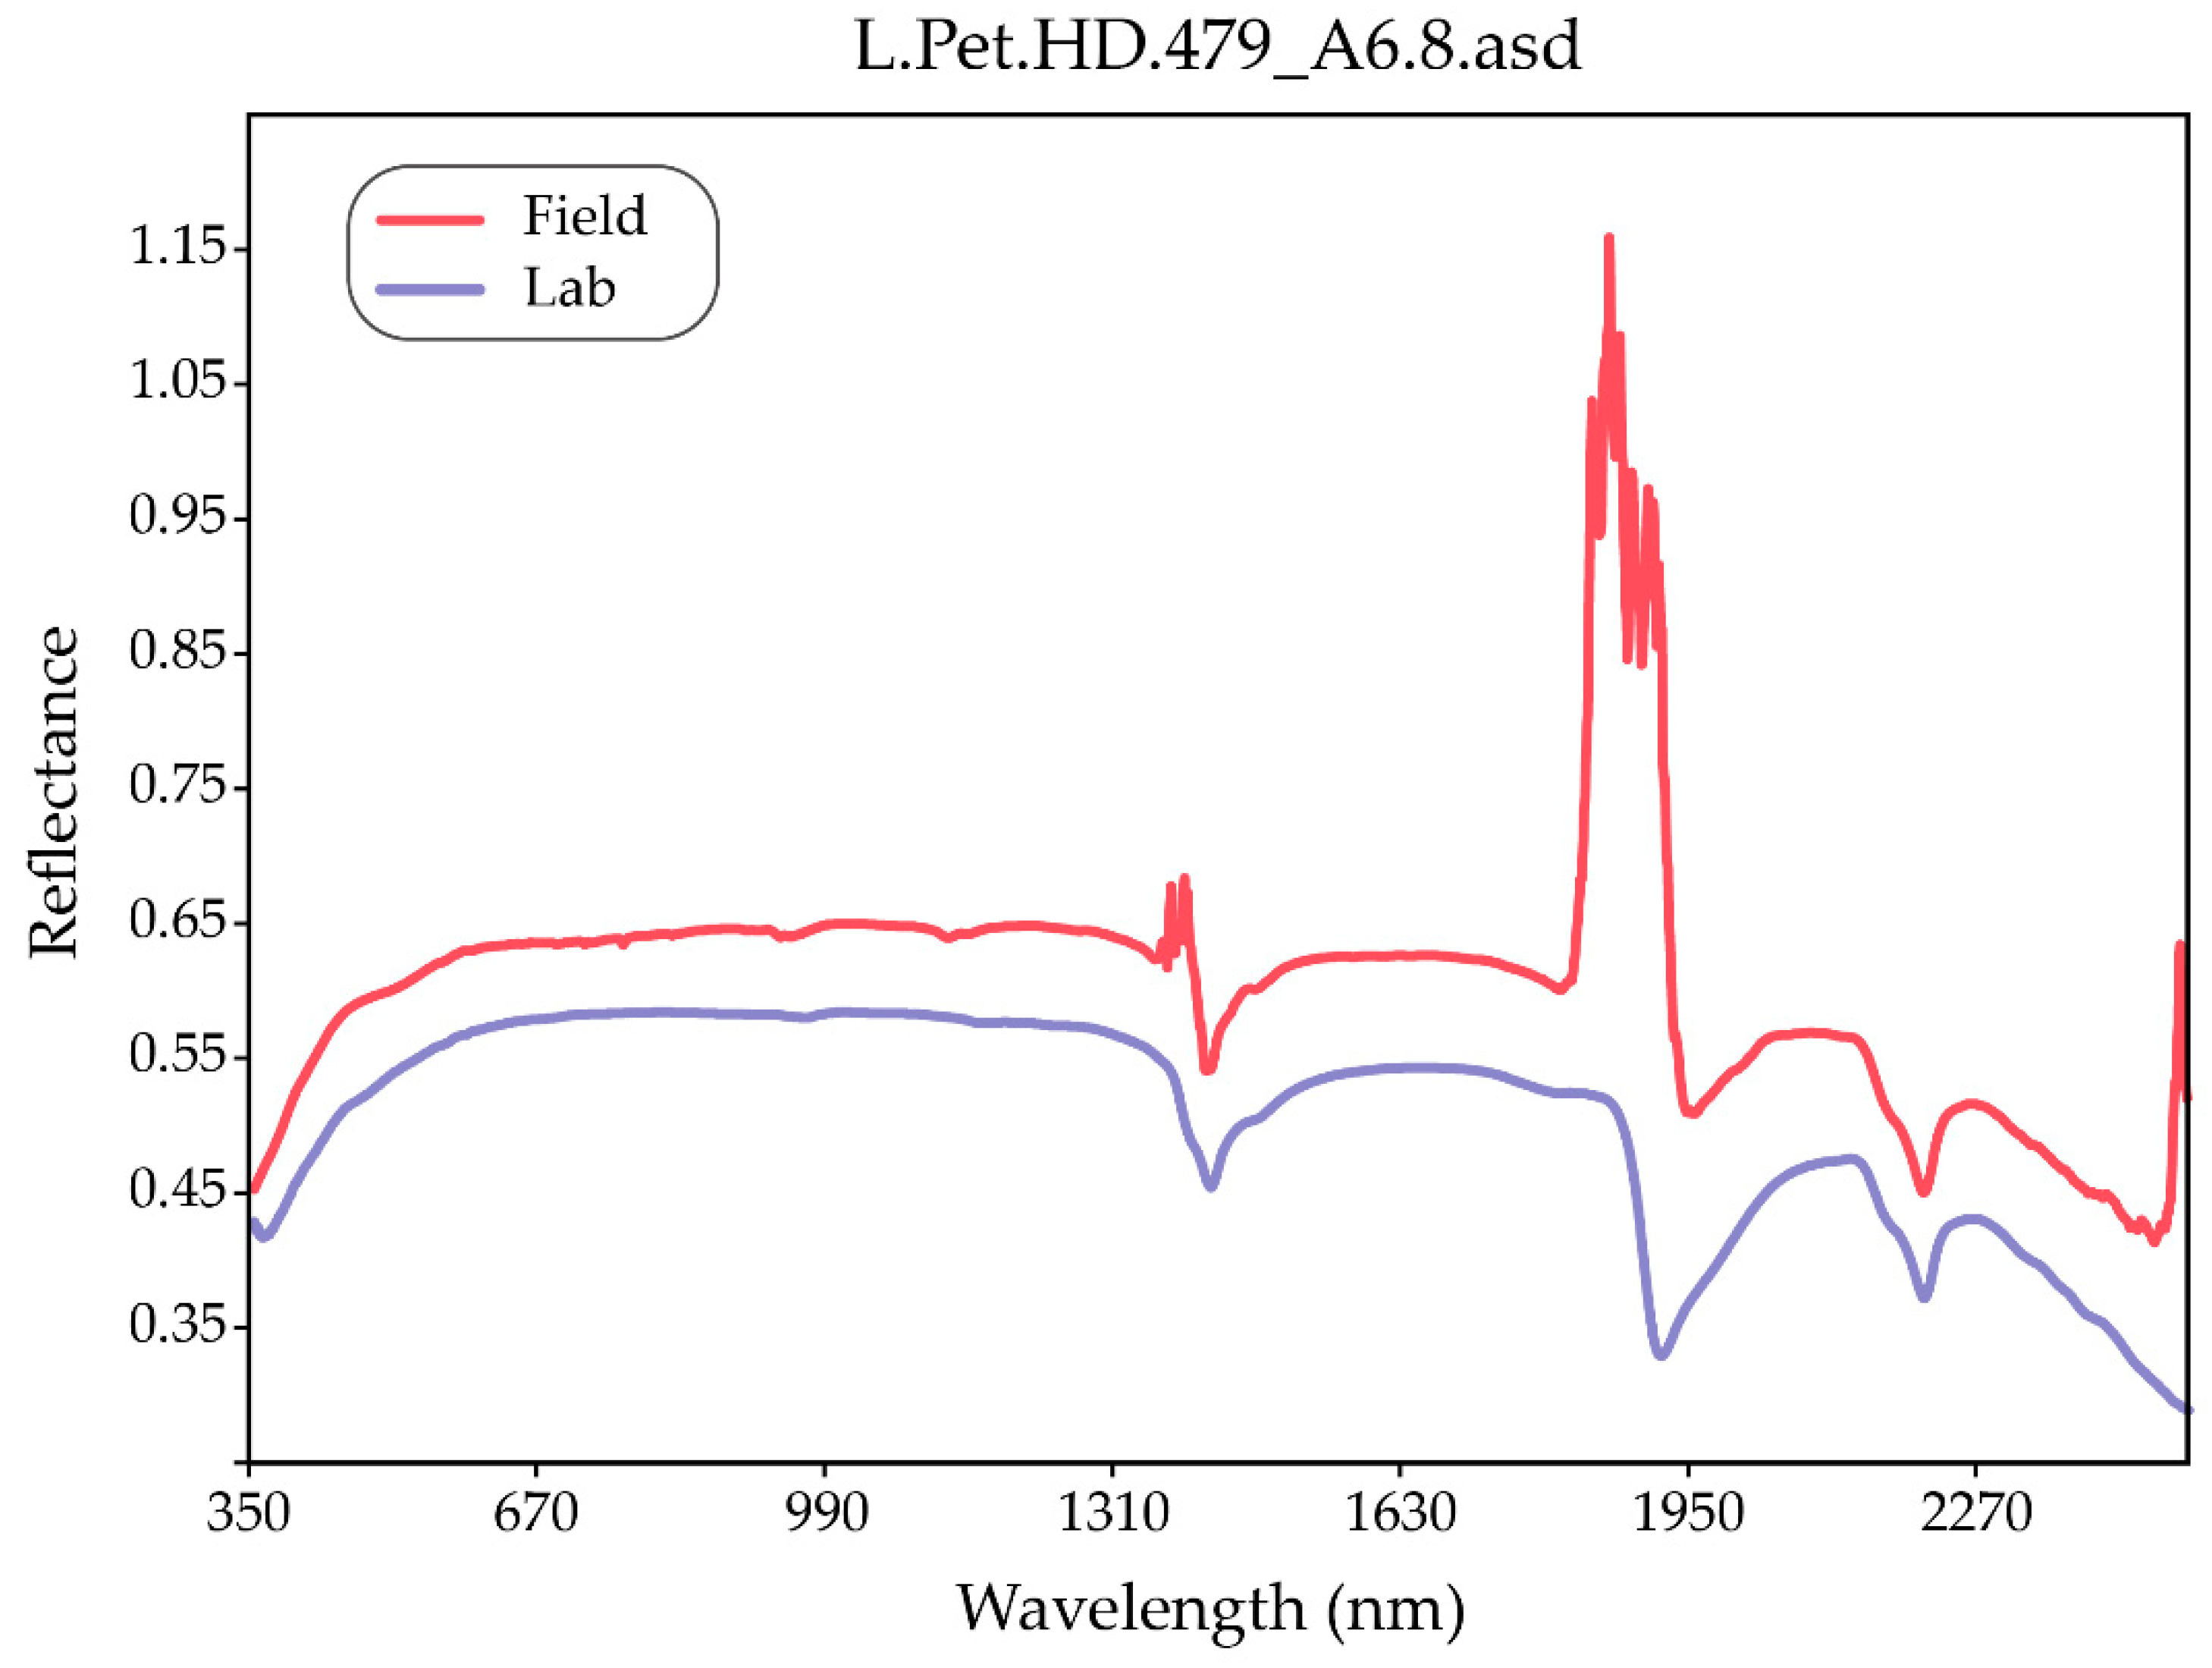
3.1. Spectra Acquisition
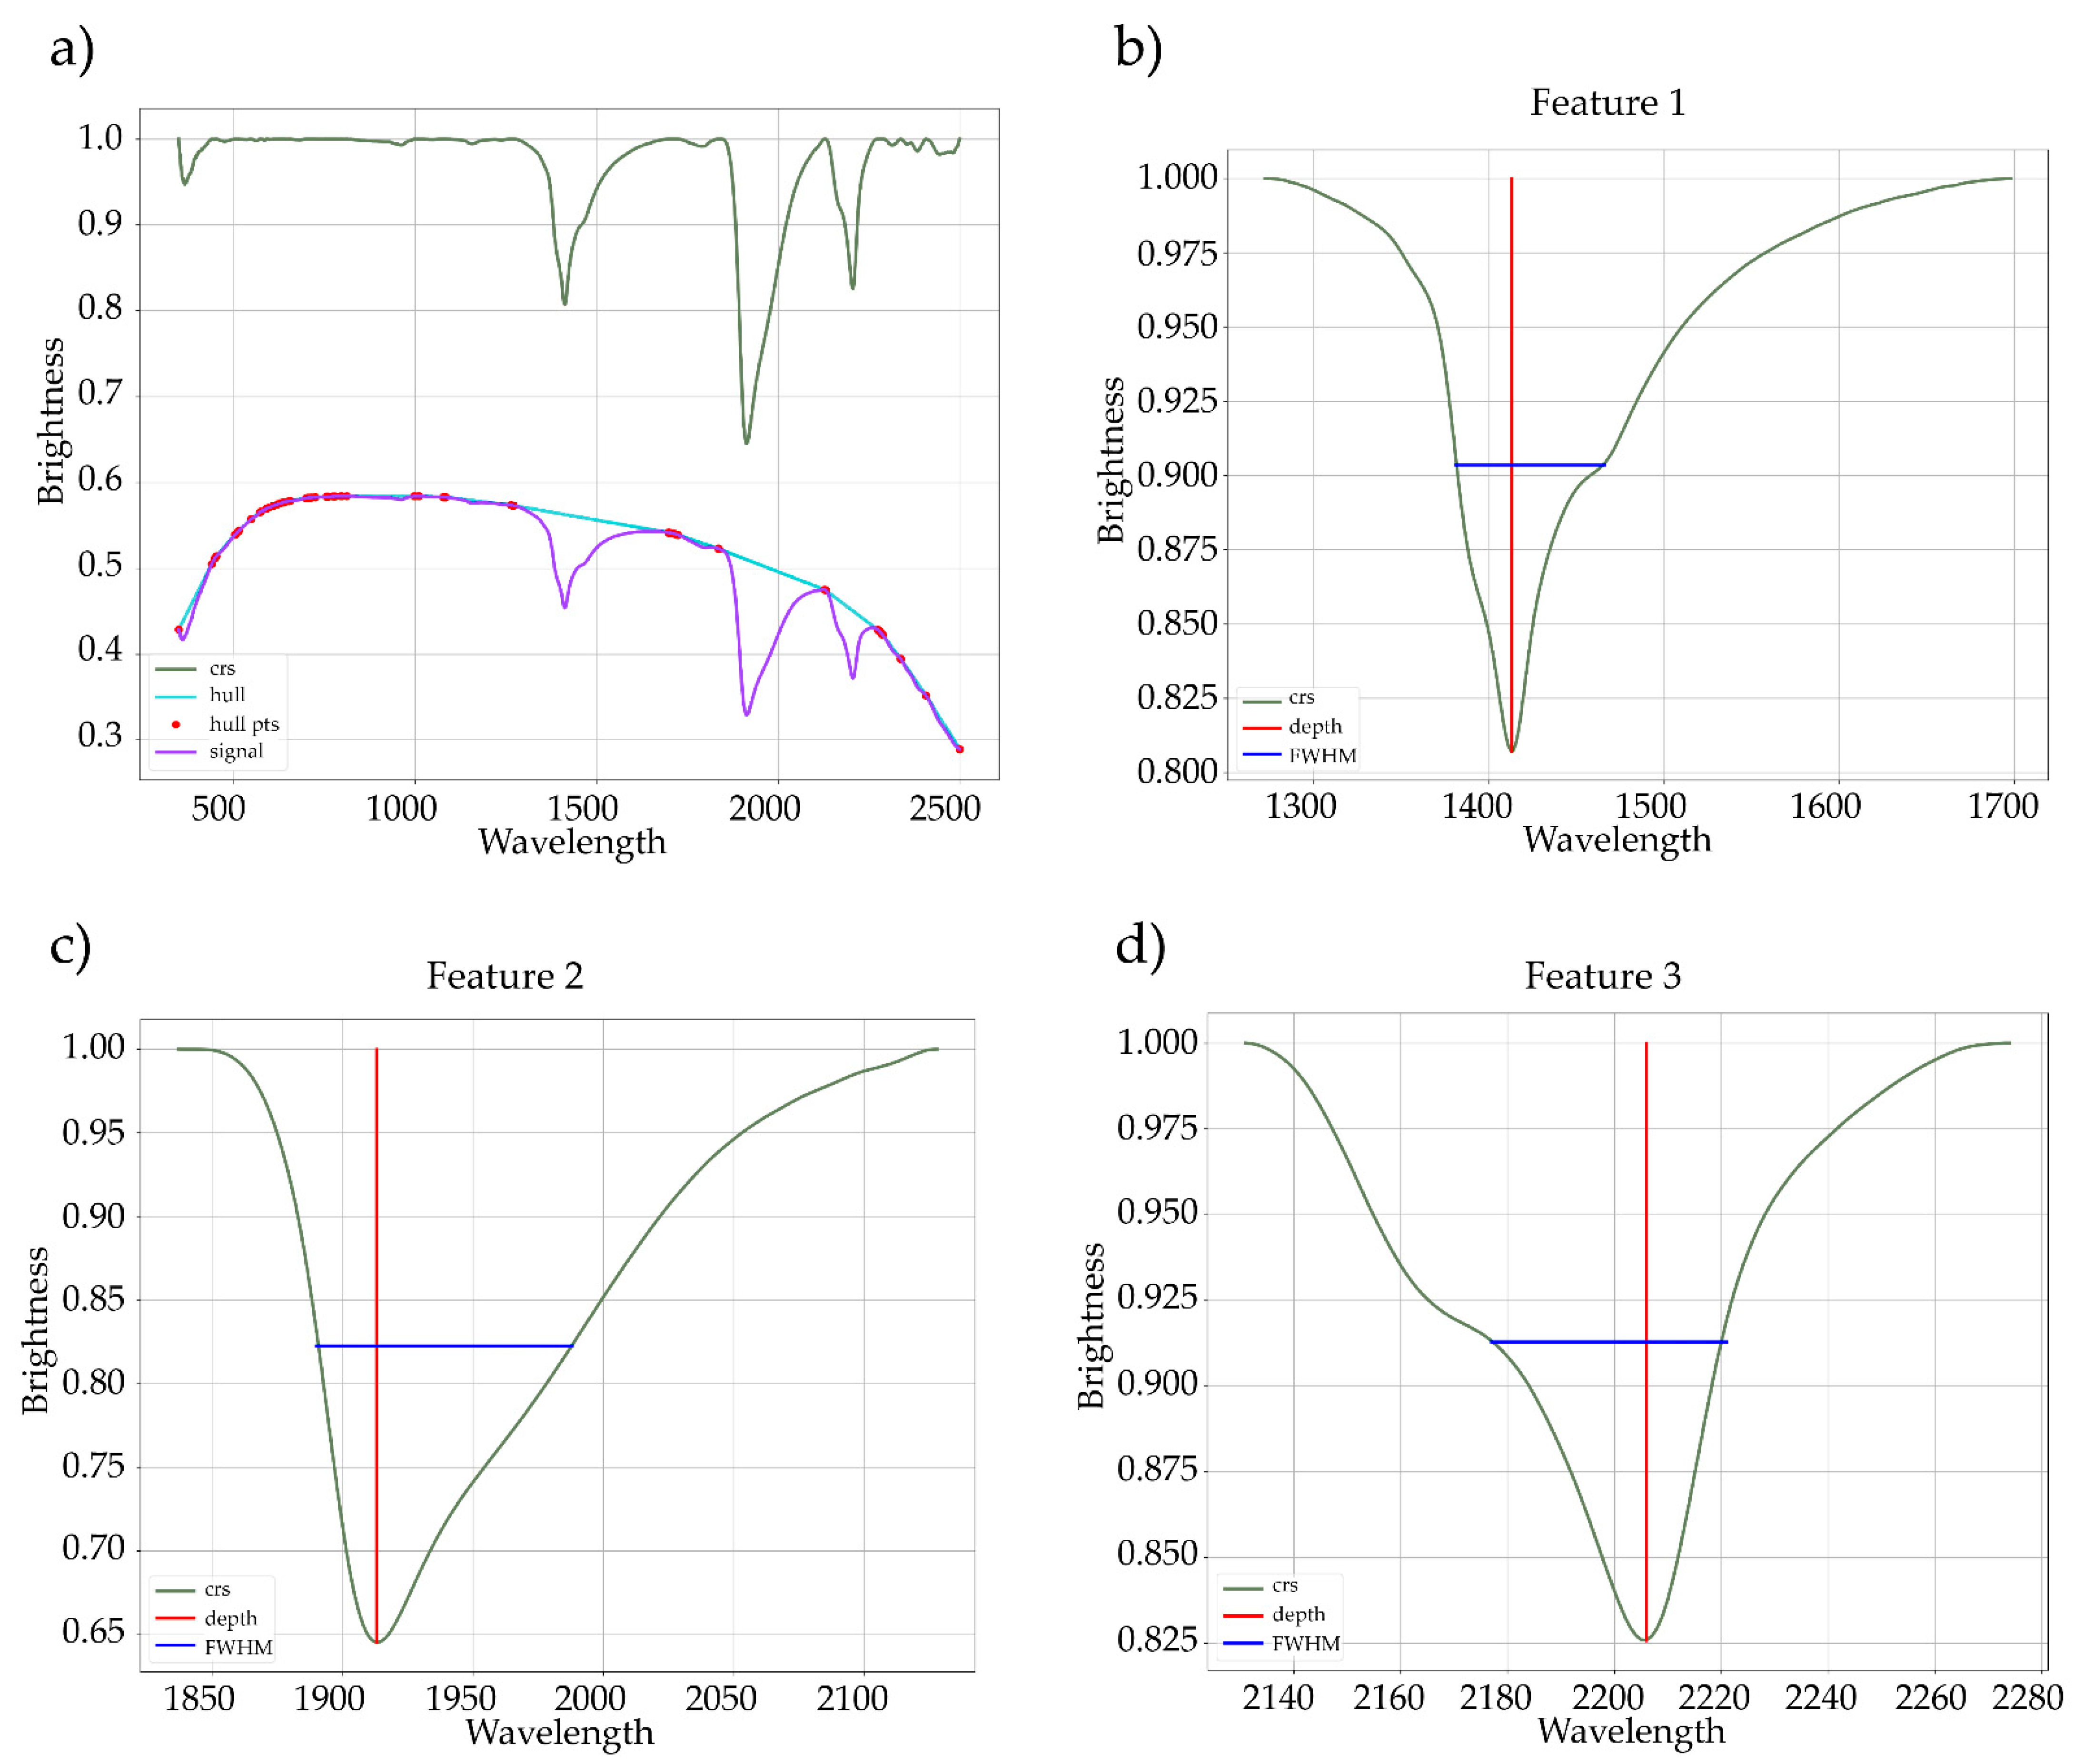
3.2. Spectra Curation and Treatment
4. User Notes
Supplementary Materials
Author Contributions
Funding
Data Availability Statement
Conflicts of Interest
Abbreviations
| CPRM | Geological Survey of Brazil |
| crs | continuum removed spectra |
| CSV | comma-separated values |
| CXG | Complexo Xisto–Grauváquico (Schist–graywacke complex) |
| FWHM | full-width at half maximum |
| Lab | laboratory |
| LIBS | laser-induced breakdown spectroscopy |
| Li | lithium |
| NEdL | noise equivalent radiance |
| PNG | portable network graphics |
| pts | points |
| SWIR | shortwave infrared |
| TE | thermoelectrically |
| USGS | United States Geological Survey |
| UTF | unicode transformation format |
| VNIR | visible and near-infrared |
| WGS | World Geodetic System |
References
- Hunt, G.R.; Salisbury, J.W. Visible and near-infrared spectra of minerals and rocks: I Silicate minerals. Modern Geol. 1970, 1, 283–300. [Google Scholar]
- Clark, R.N.; Roush, T.L. Reflectance spectroscopy: Quantitative analysis techniques for remote sensing applications. J. Geophys. Res. Space Phys. 1984, 89, 6329–6340. [Google Scholar] [CrossRef]
- Clark, R.N.; King, T.V.V.; Klejwa, M.; Swayze, G.A.; Vergo, N. High spectral resolution reflectance spectroscopy of minerals. J. Geophys. Res. Space Phys. 1990, 95, 12653–12680. [Google Scholar] [CrossRef]
- Pontual, S.; Merry, N.J.; Gamson, P. Spectral interpretation field manual. In GMEX Spectral Analysis Guides for Mineral Exploration, 3rd ed.; AusSpec International Ltd.: Queenstown, New Zealand, 2008; Volume 1. [Google Scholar]
- Asadzadeh, S.; Filho, C.R.D.S. A review on spectral processing methods for geological remote sensing. Int. J. Appl. Earth Obs. Geoinf. 2016, 47, 69–90. [Google Scholar] [CrossRef]
- Naleto, J.L.C.; Perrotta, M.M.; da Costa, F.G.; Filho, C.R.D.S. Point and imaging spectroscopy investigations on the Pedra Branca orogenic gold deposit, Troia Massif, Northeast Brazil: Implications for mineral exploration in amphibolite metamorphic-grade terrains. Ore Geol. Rev. 2019, 107, 283–309. [Google Scholar] [CrossRef]
- Pour, A.B.; Hashim, M. Hydrothermal alteration mapping from Landsat-8 data, Sar Cheshmeh copper mining district, south-eastern Islamic Republic of Iran. J. Taibah Univ. Sci. 2015, 9, 155–166. [Google Scholar] [CrossRef]
- Teodoro, A.C.; Veloso-Gomes, F. Quantification of the Total Suspended Matter Concentration around the Sea Breaking Zone from In Situ Measurements and Terra/Aster Data. Mar. Georesour. Geotechnol. 2007, 25, 67–80. [Google Scholar] [CrossRef]
- Rivard, B.; Zhang, J.; Feng, J.; Sanchez-Azofeifa, A.G. Remote predictive lithologic mapping in the Abitibi Greenstone Belt, Canada, using airborne hyperspectral imagery. Can. J. Remote Sens. 2009, 35, 95. [Google Scholar] [CrossRef]
- Cardoso-Fernandes, J.; Teodoro, A.C.; Lima, A.; Perrotta, M.; Roda-Robles, E. Detecting Lithium (Li) Mineralizations from Space: Current Research and Future Perspectives. Appl. Sci. 2020, 10, 1785. [Google Scholar] [CrossRef]
- Cardoso-Fernandes, J.; Teodoro, A.C.; Lima, A. Remote sensing data in lithium (Li) exploration: A new approach for the detection of Li-bearing pegmatites. Int. J. Appl. Earth Obs. Geoinf. 2019, 76, 10–25. [Google Scholar] [CrossRef]
- Cardoso-Fernandes, J.; Lima, A.; Roda-Robles, E.; Teodoro, A.C. Constraints and potentials of remote sensing data/techniques applied to lithium (Li)-pegmatites. Can. Mineral. 2019, 57, 723–725. [Google Scholar] [CrossRef]
- Cardoso-Fernandes, J.; Teodoro, A.C.M.; Lima, A.; Roda-Robles, E. Evaluating the performance of support vector machines (SVMs) and random forest (RF) in Li-pegmatite mapping: Preliminary results. In Earth Resources and Environmental Remote Sensing/GIS Applications X; SPIE: Bellingham, DC, USA, 2019; Volume 11156, p. 111560Q. [Google Scholar]
- Cardoso-Fernandes, J.; Teodoro, A.C.; Lima, A.; Roda-Robles, E. Semi-Automatization of Support Vector Machines to Map Lithium (Li) Bearing Pegmatites. Remote Sens. 2020, 12, 2319. [Google Scholar] [CrossRef]
- Kokaly, R.F.; Clark, R.N.; Swayze, G.A.; Livo, K.E.; Hoefen, T.M.; Pearson, N.C.; Wise, R.A.; Benzel, W.M.; Lowers, H.A.; Driscoll, R.L.; et al. USGS Spectral Library Version 7, 1035; USGS: Reston, VA, USA, 2017; p. 68. [Google Scholar]
- Meerdink, S.K.; Hook, S.J.; Roberts, D.A.; Abbott, E.A. The ECOSTRESS spectral library version 1.0. Remote Sens. Environ. 2019, 230, 111196. [Google Scholar] [CrossRef]
- Costa, M.A.C.; Perrotta, M.M.; Melo, T.G.; Turra, B. Estudos Espectrais. In Avaliação do Potencial do Lítio no Brasil: Área do Médio Rio Jequitinhonha, Nordeste de Minas Gerais: Texto Explicativo e Mapas; Paes, V.J.C., Santos, L.D., Tedeschi, M.F., Betiollo, L.M., Eds.; CPRM: Belo Horizonte, Brazil, 2016; p. 276. [Google Scholar]
- Roda, E.; Fontan, F.; Pesquera, A.; Velasco, F. The phosphate mineral association of the granitic pegmatites of the Fregeneda area (Salamanca, Spain). Mineral. Mag. 1996, 60, 767–778. [Google Scholar] [CrossRef]
- Vieira, R. Aplitopegmatitos com Elementos Raros da Região Entre Almendra (V.N. de Foz Côa) e Barca d’Alva (Figueira de Castelo Rodrigo). Campo Aplitopegmatítico da Fregeneda-Almendra. Ph.D. Thesis, Faculdade de Ciências da Universidade do Porto, Porto, Portugal, 2010. [Google Scholar]
- Costa, J.C.S. Notícia Sobre uma Carta Geológica do Buçaco, de Nery Delgado; Serviços Geológicos de Portugal: Lisboa, Portugal, 1950. [Google Scholar]
- LIGHTS (Lightweight Integrated Ground and Airborne Hyperspectral Topological Solution). Available online: http://lights.univ-lorraine.fr/ (accessed on 9 November 2020).
- Cardoso-Fernandes, J.; Teodoro, A.C.; Lima, A.; Mielke, C.; Korting, F.; Roda-Robles, E.; Cauzid, J. Multi-Scale Approach using Remote Sensing Techniques for Lithium Pegmatite Exploration: First Results. IGARSS 2020, 5226–5229. [Google Scholar] [CrossRef]
- PROJECTS: FLAPSYS. Available online: https://www.inesctec.pt/pt/projetos/flapsys (accessed on 9 November 2020).
- GREENPEG. Available online: https://www.greenpeg.eu/ (accessed on 9 November 2020).
- Cardoso-Fernandes, J.; Silva, J.; Lima, A.; Teodoro, A.C.; Perrotta, M.; Cauzid, J.; Roda-Robles, E. Characterization of lithium (Li) minerals from the Fregeneda–Almendra region through laboratory spectral measurements: A comparative study. In Earth Resources and Environmental Remote Sensing/GIS Applications XI; SPIE: Bellingham, DC, USA, 2020; Volume 11534, p. 115340N. [Google Scholar]
- Cardoso-Fernandes, J.; Silva, J.; Lima, A.; Teodoro, A.C.; Perrotta, M.; Cauzid, J.; Roda-Robles, E.; Ribeiro, M.D.A. Reflectance spectroscopy to validate remote sensing data/algorithms for satellite-based lithium (Li) exploration (Central East Portugal). In Earth Resources and Environmental Remote Sensing/GIS Applications XI; SPIE: Bellingham, DC, USA, 2020; Volume 11534, p. 115340M. [Google Scholar]
- Full Range Photodiode Array UV-VIS-NIR-SWIR. Available online: https://spectralevolution.com/products/hardware/compact-lab-spectroradiometers/ (accessed on 5 November 2020).
- ASD FieldSpec 4 Standard-Res Spectroradiometer. Available online: https://www.malvernpanalytical.com/en/products/product-range/asd-range/fieldspec-range/fieldspec-4-standard-res-spectroradiometer#specs (accessed on 5 November 2020).
- ASD Inc. ViewSpec Pro™ User Manual. ASD Document 600555 Rev. A. Boulder, 2008. Available online: http://geoinfo.amu.edu.pl/geoinf/m/spektr/viewspecpro.pdf (accessed on 4 November 2020).
- Menges, F. Spectragryph Optical Spectroscopy Software, Version 1.2.14. Available online: http://www.effemm2.de/spectragryph/ (accessed on 22 July 2020).
- Therien, C. Welcome to the PySptools Documentation. Available online: https://pysptools.sourceforge.io/ (accessed on 22 July 2020).
- Van Der Meer, F. Spectral curve shape matching with a continuum removed CCSM algorithm. Int. J. Remote Sens. 2000, 21, 3179–3185. [Google Scholar] [CrossRef]
- Carrino, T.A.; Crósta, A.P.; Toledo, C.L.B.; Silva, A.M. Hyperspectral remote sensing applied to mineral exploration in southern Peru: A multiple data integration approach in the Chapi Chiara gold prospect. Int. J. Appl. Earth Obs. Geoinf. 2018, 64, 287–300. [Google Scholar] [CrossRef]
- Continuum Removal. Available online: https://www.l3harrisgeospatial.com/docs/ContinuumRemoval.html (accessed on 6 November 2020).
- Kokaly, R.F. PRISM: Processing Routines in IDL for Spectroscopic Measurements (Installation Manual and User’s Guide, Version 1.0); 2011-1155; Reston, VA, 2011. Available online: https://pubs.usgs.gov/of/2011/1155/pdf/ofr2011-1155-17oct2011.pdf (accessed on 6 November 2020).


| Code | Observation | |
|---|---|---|
| Purpose of the sample | L | Li mineral database |
| TA | Training areas | |
| SC | Spectral confusion (represents false positive areas) | |
| Lithology | G | Granitoid rock |
| LP | Li pegmatite | |
| M | Metasedimentary rock | |
| Mineralogy | Lep | Lepidolite |
| Pet | Petalite | |
| Spd | Spodumene | |
| Location | AL | Almendra |
| ALB | Alberto open pit mine | |
| BJ | Bajoca open pit mine | |
| FE | Feli open pit mine | |
| FG | Fregeneda | |
| HD | Hinojosa de Duero | |
| 999 | 3-digit numbers represent the GPS point number | |
| Multiple samples | A1 to An | Code given to distinct hand samples collected at the same location (where n = number of samples) |
| Equipment used | sr | SR-6500 (Spectral Evolution, Inc., Haverhill, MA, USA) |
| asd | FieldSpec 4 (ASD, Inc., untsville, AL, USA) | |
| Other | f | Spectra collected in the field under real conditions |
| Spectral Evolution SR-6500 | ASD FieldSpec 4 | |
|---|---|---|
 |  | |
| Spectral Range | 350–2500 nm | 350–2500 nm |
| Spectral Resolution | Ultra-High Resolution | Standard resolution |
| 1.5 nm @ 700 nm | 3 nm @ 700 nm | |
| 3.0 nm @ 1500 nm | 10 nm @ 1400 nm | |
| 3.8 nm @ 2100 nm | 10 nm @ 2100 nm | |
| Spectral sampling (bandwidth) | 1 nm increments | 1.4 nm @ 350–1000 nm 1.1 nm @ 1001–2500 nm |
| Wavelength reproducibility | 0.1 nm | 0.1 nm |
| Wavelength accuracy | 0.5 nm | 0.5 nm |
| Channels | 2151 | 2151 |
| Detectors | 1024 element TE-cooled silicon photodiode array detector (VNIR) | VNIR detector: 512 element silicon array |
| 512 element TE-cooled InGaAs photodiode array detector (SWIR 1) | SWIR 1 detector: Graded Index InGaAs Photodiode, Two-Stage TE Cooled | |
| 512 element TE-cooled extended InGaAs photodiode array detector (SWIR 2) | SWIR 2 detector: Graded Index InGaAs Photodiode, Two-Stage TE Cooled | |
| Noise Equivalent Radiance (NEdL) | 0.8 × 10⁻⁹ W/cm2/nm/sr @ 400 nm | 1.0 × 10⁻⁹ W/cm2/nm/sr @ 700 nm |
| 0.3 × 10⁻⁹ W/cm2/nm/sr @ 1500 nm | 1.2 × 10⁻⁹ W/cm2/nm/sr @ 1400 nm | |
| 5.8 × 10⁻⁹ W/cm2/nm/sr @ 2100 nm | 1.9 × 10⁻⁹ W/cm2/nm/sr @ 2100 nm | |
| Weight | 4.99 kg (11 pounds) | 5.44 kg (12 lbs) |
| Contact probe | Internal light source: | Internal light source: |
| Halogen bulb: 4.25 V, 1.06 A | Halogen bulb: 12–18 V, 6.5 W | |
| Spot size: | Spot size: | |
| 10 mm | 10 mm | |
| Field pistol grip | — | Natural lighting Spot size as a function of distance to the sample |
| Abbreviation | Extracted Statistics |
|---|---|
| id | feature number |
| area | area |
| cstart_wvl | continuum start wavelength |
| cstop_wvl | continuum stop wavelength |
| cslope | continuum slope |
| abs_wvl | center wavelength |
| abs_depth | absorption depth |
| FWHM_delta | full-width at half maximum |
Publisher’s Note: MDPI stays neutral with regard to jurisdictional claims in published maps and institutional affiliations. |
© 2021 by the authors. Licensee MDPI, Basel, Switzerland. This article is an open access article distributed under the terms and conditions of the Creative Commons Attribution (CC BY) license (http://creativecommons.org/licenses/by/4.0/).
Share and Cite
Cardoso-Fernandes, J.; Silva, J.; Dias, F.; Lima, A.; Teodoro, A.C.; Barrès, O.; Cauzid, J.; Perrotta, M.; Roda-Robles, E.; Ribeiro, M.A. Tools for Remote Exploration: A Lithium (Li) Dedicated Spectral Library of the Fregeneda–Almendra Aplite–Pegmatite Field. Data 2021, 6, 33. https://0-doi-org.brum.beds.ac.uk/10.3390/data6030033
Cardoso-Fernandes J, Silva J, Dias F, Lima A, Teodoro AC, Barrès O, Cauzid J, Perrotta M, Roda-Robles E, Ribeiro MA. Tools for Remote Exploration: A Lithium (Li) Dedicated Spectral Library of the Fregeneda–Almendra Aplite–Pegmatite Field. Data. 2021; 6(3):33. https://0-doi-org.brum.beds.ac.uk/10.3390/data6030033
Chicago/Turabian StyleCardoso-Fernandes, Joana, João Silva, Filipa Dias, Alexandre Lima, Ana C. Teodoro, Odile Barrès, Jean Cauzid, Mônica Perrotta, Encarnación Roda-Robles, and Maria Anjos Ribeiro. 2021. "Tools for Remote Exploration: A Lithium (Li) Dedicated Spectral Library of the Fregeneda–Almendra Aplite–Pegmatite Field" Data 6, no. 3: 33. https://0-doi-org.brum.beds.ac.uk/10.3390/data6030033