
Data for Interaction Diagrams of Geopolymer FRC Slender Columns with Double-Layer GFRP and Steel Reinforcement


1
Department of Civil Engineering, College of Engineering, American University of Sharjah, Sharjah 26666, United Arab Emirates
2
Structural Engineering Department, Faculty of Engineering, Mansoura University, Mansoura 35516, Egypt
*
Author to whom correspondence should be addressed.
Data 2021, 6(5), 43; https://0-doi-org.brum.beds.ac.uk/10.3390/data6050043
Submission received: 23 March 2021
/
Revised: 15 April 2021
/
Accepted: 22 April 2021
/
Published: 26 April 2021
Abstract
:This article provides data of axial load-bending moment capacities of plain and fiber-reinforced geopolymer concrete (GPC, FRGPC) columns. The columns were reinforced by double layers of longitudinal and transverse reinforcement using steel and/or glass-fiber-reinforced polymer (GFRP) bars. The concrete fiber-reinforcing materials included steel and synthetic fibers. The columns data included different parameters like the longitudinal reinforcement ratio, the applied load eccentricity, and the columns’ slenderness ratio. The data was collected from different analysis output files then sorted and tabulated in usable formatted tables. The data can support the development of design axial load-bending moment interactions. In addition, further processing of the data can yield analytical strength curves which are useful in determining the columns stability under different structural loading configurations. Researchers and educators can make use of these data for illustrations and prospective new research suggestions.
Dataset License: CC-BY
1. Summary
The provided dataset represents a group of axial load-bending moment tables for slender columns with double-layer reinforcement. The data included a variation in different design parameters like longitudinal reinforcement ratio, longitudinal and transverse reinforcement type, fiber reinforcement type, and the columns’ slenderness ratios. The data were collected from numerous analysis output files. Afterwards, the data were sorted and listed in nine files in an appropriate representation form. The axial load and bending moment capacities can provide a better understanding of the behavior of slender columns with various design configurations under different loading conditions. Researchers and educators in the field of structural columns analysis and design can make use of these datasets for illustrations, research, and design recommendations. The dataset can be used to develop interaction diagrams and analytical strength curves as introduced by [1,2,3,4]. In addition, it can provide recommendations for further analytical and experimental investigations. The provided dataset is an outcome of the research project (EFRG18-MSE-CEN-25) granted by the American University of Sharjah (AUS) through the enhanced faculty research grant program.
2. Data Description
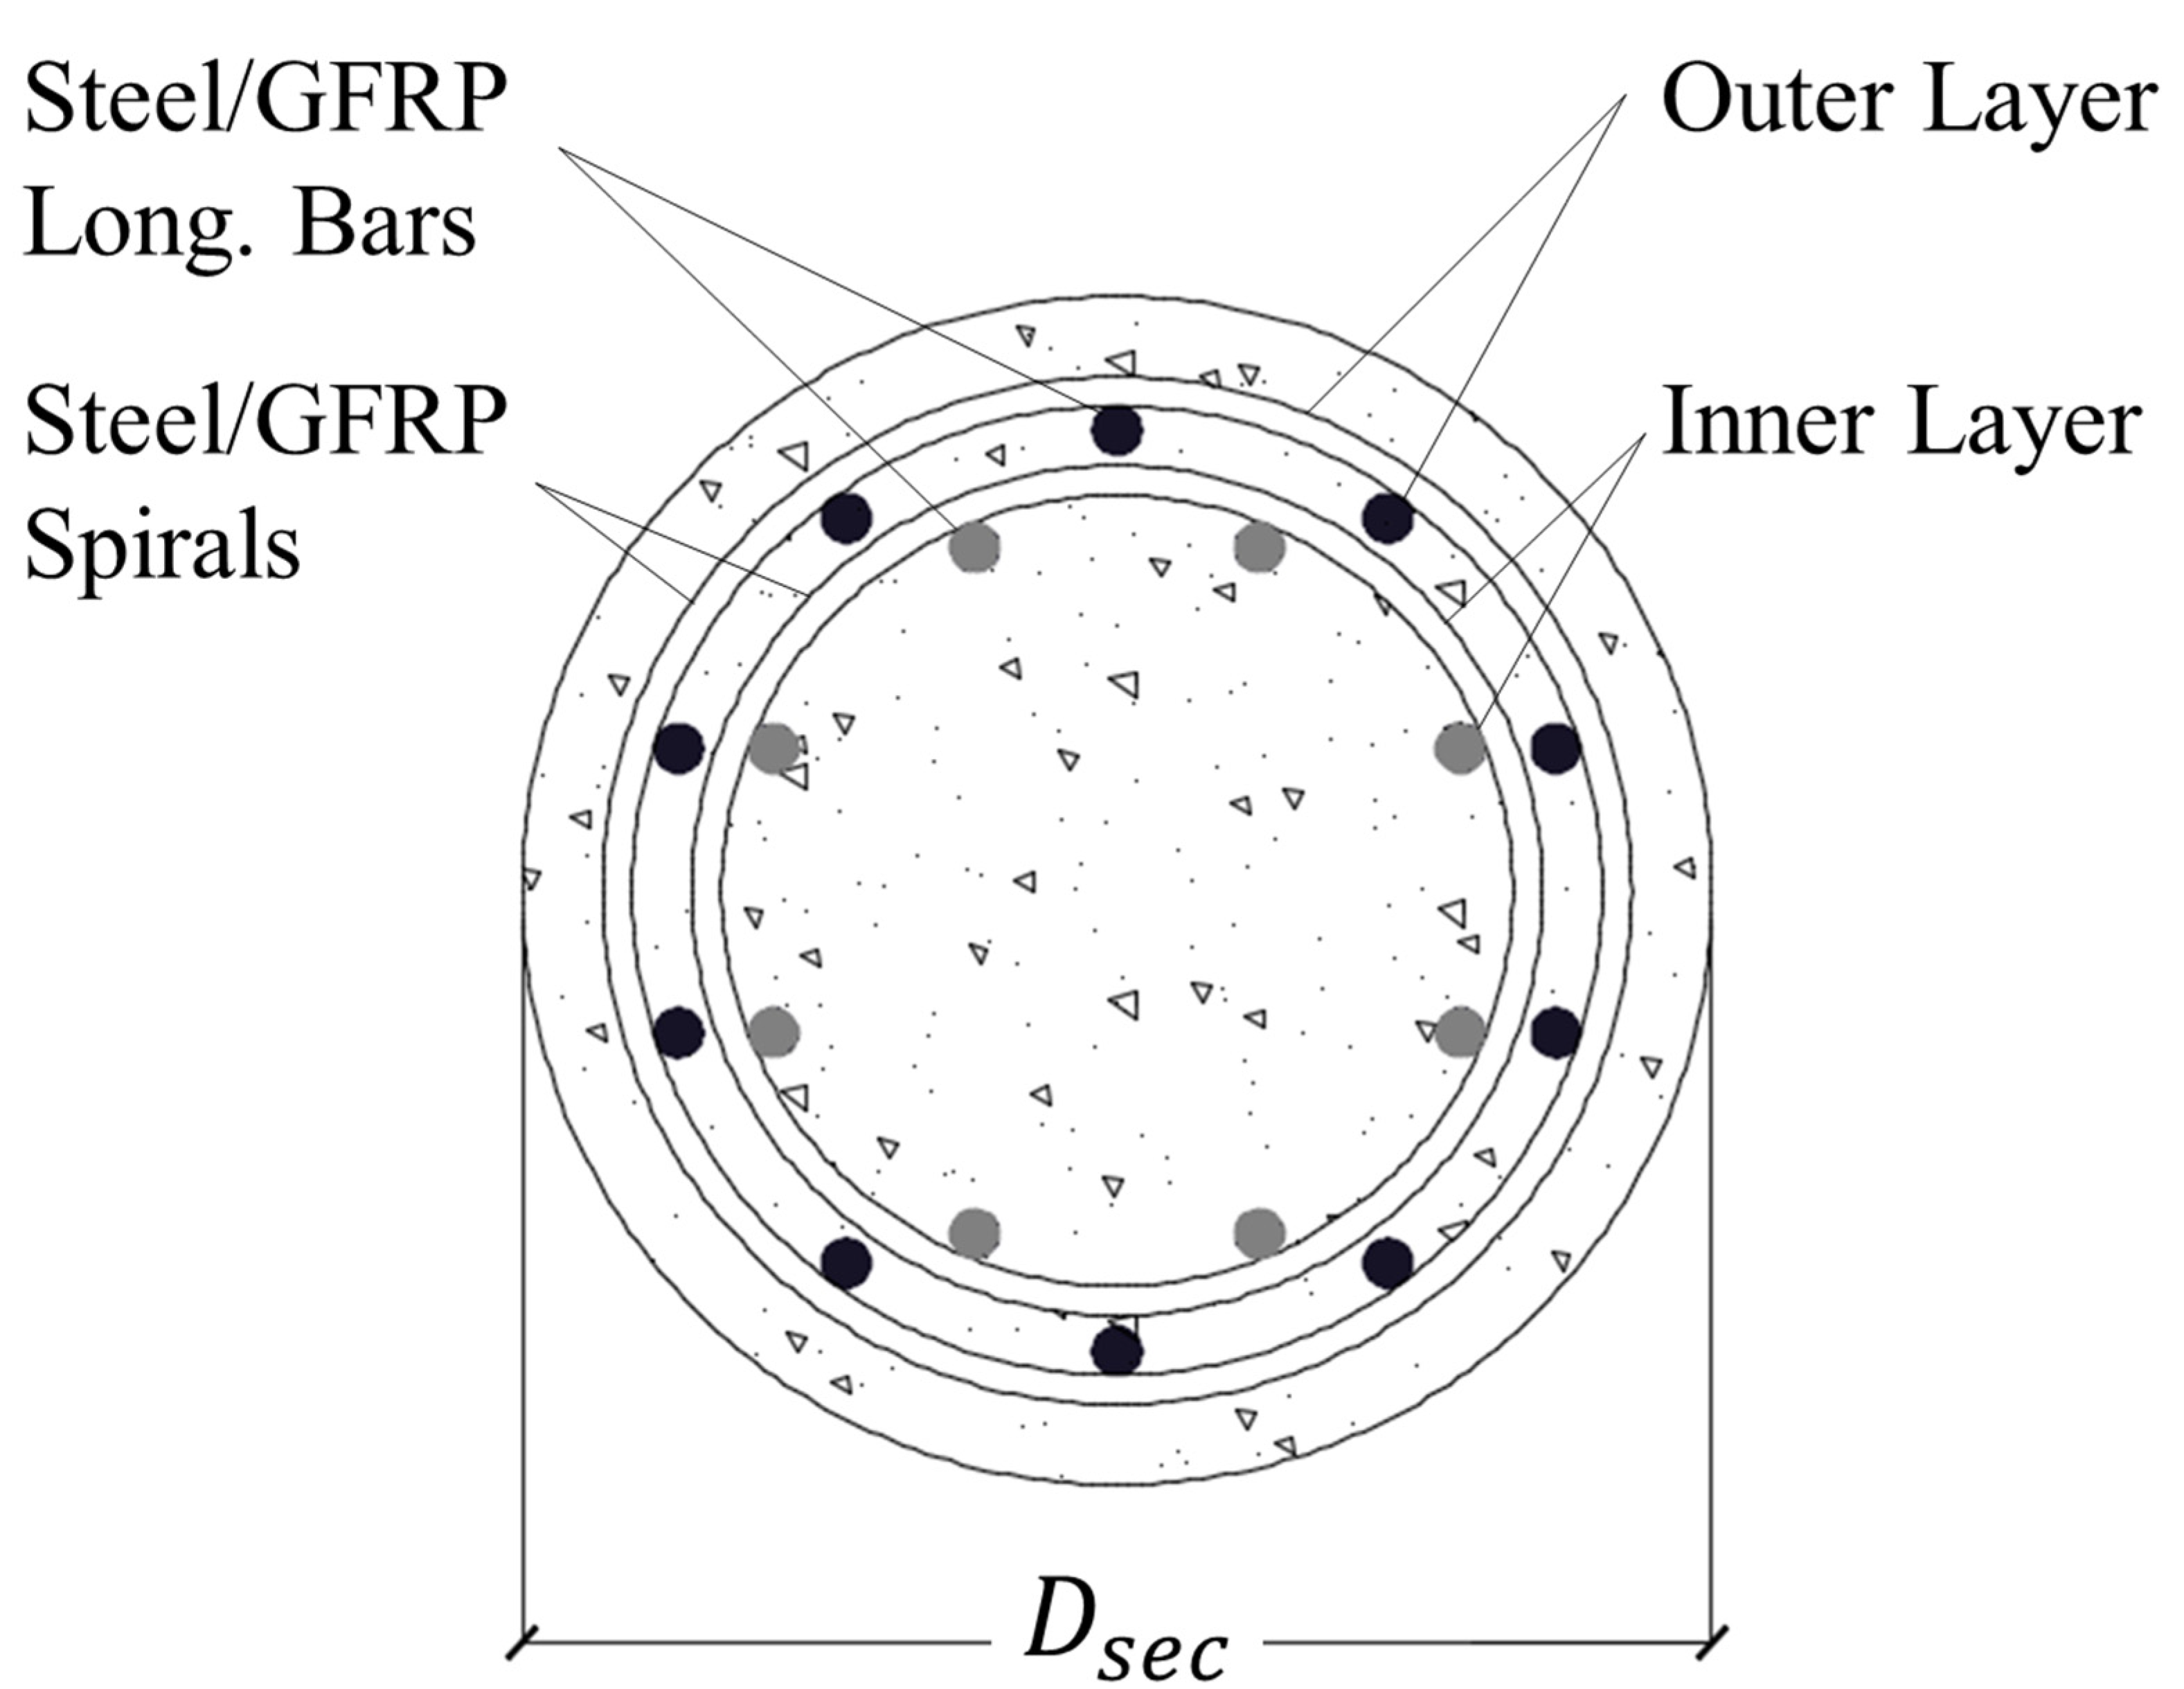
Normalized interaction diagrams were developed for slender columns with different reinforcement configurations. All the columns had double-layers of longitudinal and transverse reinforcement as shown in Figure 1. Different fiber reinforcement and longitudinal reinforcement types were incorporated. The fiber reinforcing index () for the FRPGPC was set at 1.7, which is considered as the product of the volumetric content ratio of the fibers and their aspect ratio. The value was selected as an average of the values found in the literature [2,5,6,7]. The confinement effects were considered in the modeling process, as a total transverse reinforcement ratio of 3.5% was provided by both inner and outer layers. Moreover, the second-order effects induced by the columns’ buckling are implicitly presented within the results. The analyzed columns were divided into nine groups with distinct attributes as given in Table 1. Within each group different strength levels were investigated. The ultimate/yield strength and elastic modulus values assigned to each strength level are given in Table 2. All the analyzed columns had a circular cross-section with a 900 mm diameter and concrete with a 60 MPa compressive strength. Later on, to broaden the results usability, the dataset values are presented in a normalized form. Furthermore, the results for different values of the longitudinal reinforcement ratio () and the slenderness ratio () are provided.
Nine data files were created to list the results of each group, as given in Table 1. Within each data file there are three tabs representing the three strength levels, as given in Table 2. The strength and elastic modulus values were selected based on the typical range provided by manufacturers and found in the literature [8,9,10]. Each tab provides tables for axial load-bending moment interactions at different slenderness and longitudinal reinforcement ratios. Headers were assigned to each table to specify its properties. For example, a table with the header “Rho1_KLr020” has the results for a column with longitudinal reinforcement ratio and a slenderness ratio . The data per each table were listed in three columns with each row representing a point on the interaction diagram curve. The first column provides the eccentricity ratio (/), where is the initial eccentricity applied on the columns ends and is the diameter of the column’s cross-section. Lastly, the values of the normalized bending moment () and the normalized axial load () are given in the second and third columns, respectively, where and are the bending moment and the axial load capacities at the columns’ ends, respectively. is the gross area of the column’s cross-section and is the plain concrete compressive strength. It should be noted that all the data values are unitless, as the first column represents a length ratio, while the other two columns provide normalized values.
3. Methods
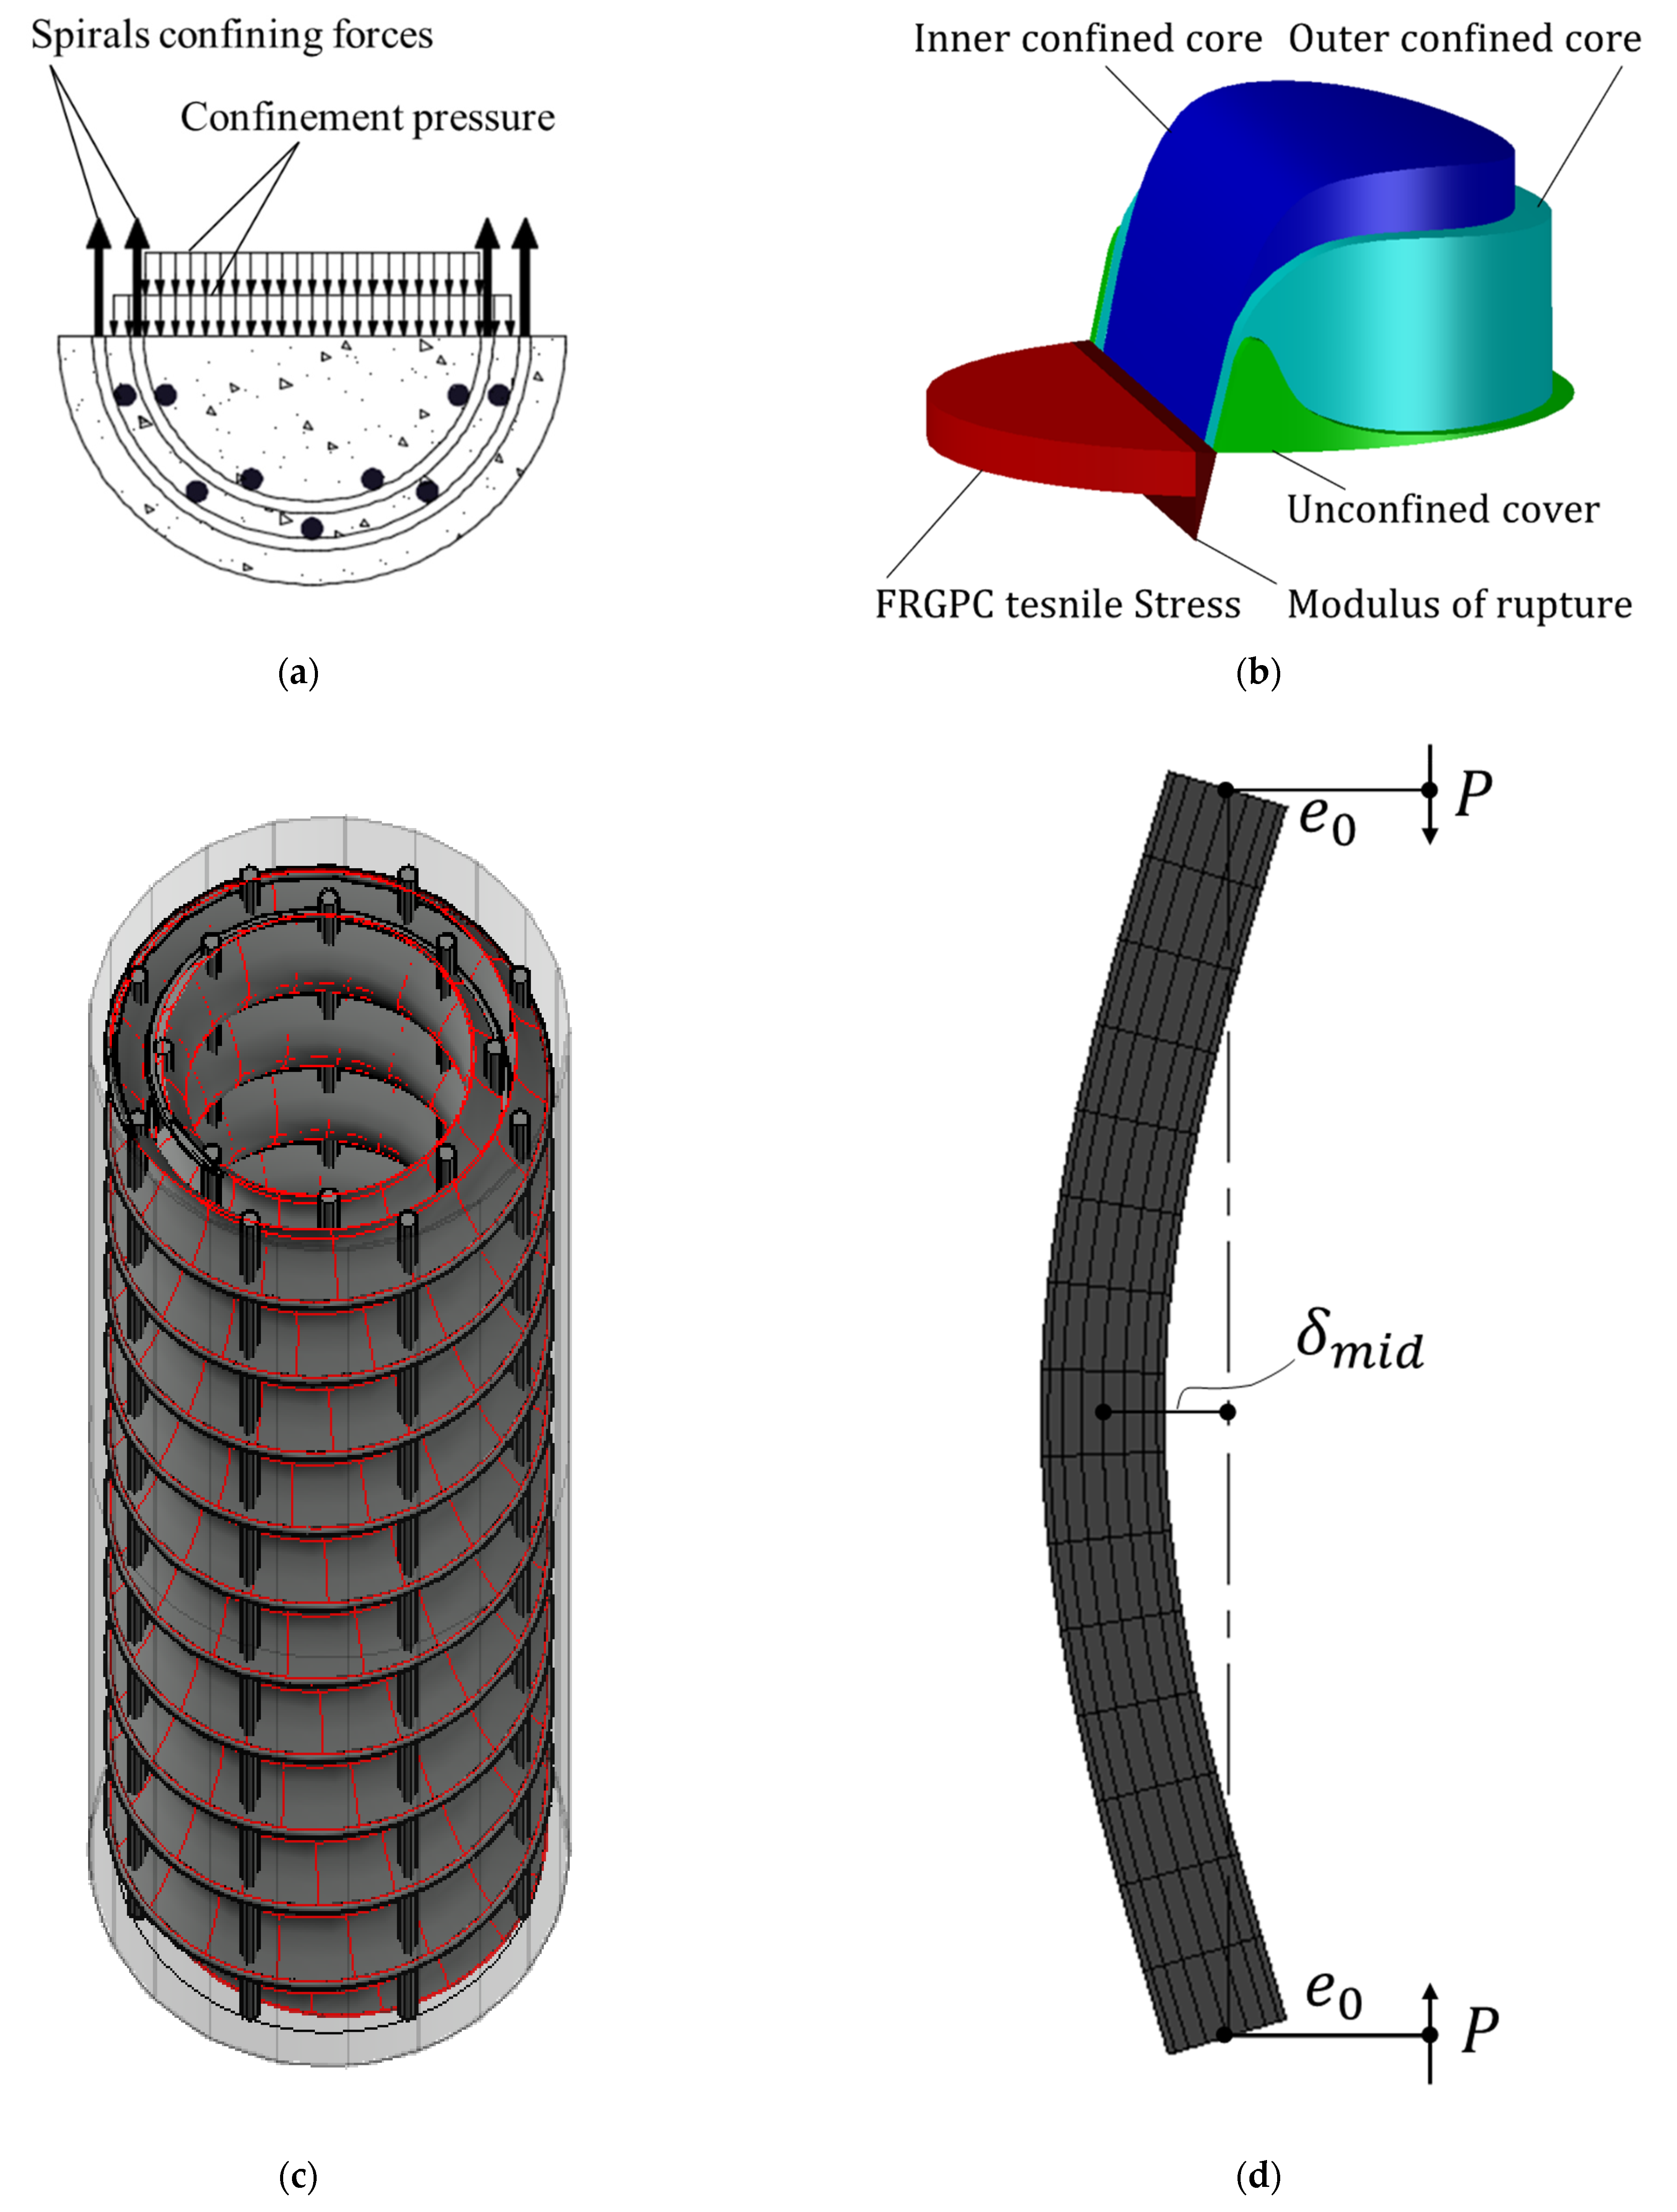
Figure 2 provides a typical representation of the effectively confined cores within the columns and the resulting stresses, as well as the second-order effects. The confined core geometrical representation was based on the analytical model provided by Mander et al. [11], which was later modified and adopted by Hales [12] for analyzing columns with double-layer reinforcement. Moreover, slenderness effects including the column’s curvature and lateral deformation were incorporated through a second-order iterative analysis proposed by Hasan et al. [13]. These assumptions have been proven to be practical in developing an analytical model with good matching results to the experimental ones [3,13]. The effects of steel and synthetic fibers on concrete properties, including enhancing compressive and tensile strengths, were adopted according to Farhan et al. [2] and Noushini et al. [5]. The modeling of the concrete stress-strain curves was based on the formulas provided by Sarker [14] and Maranan et al. [15].
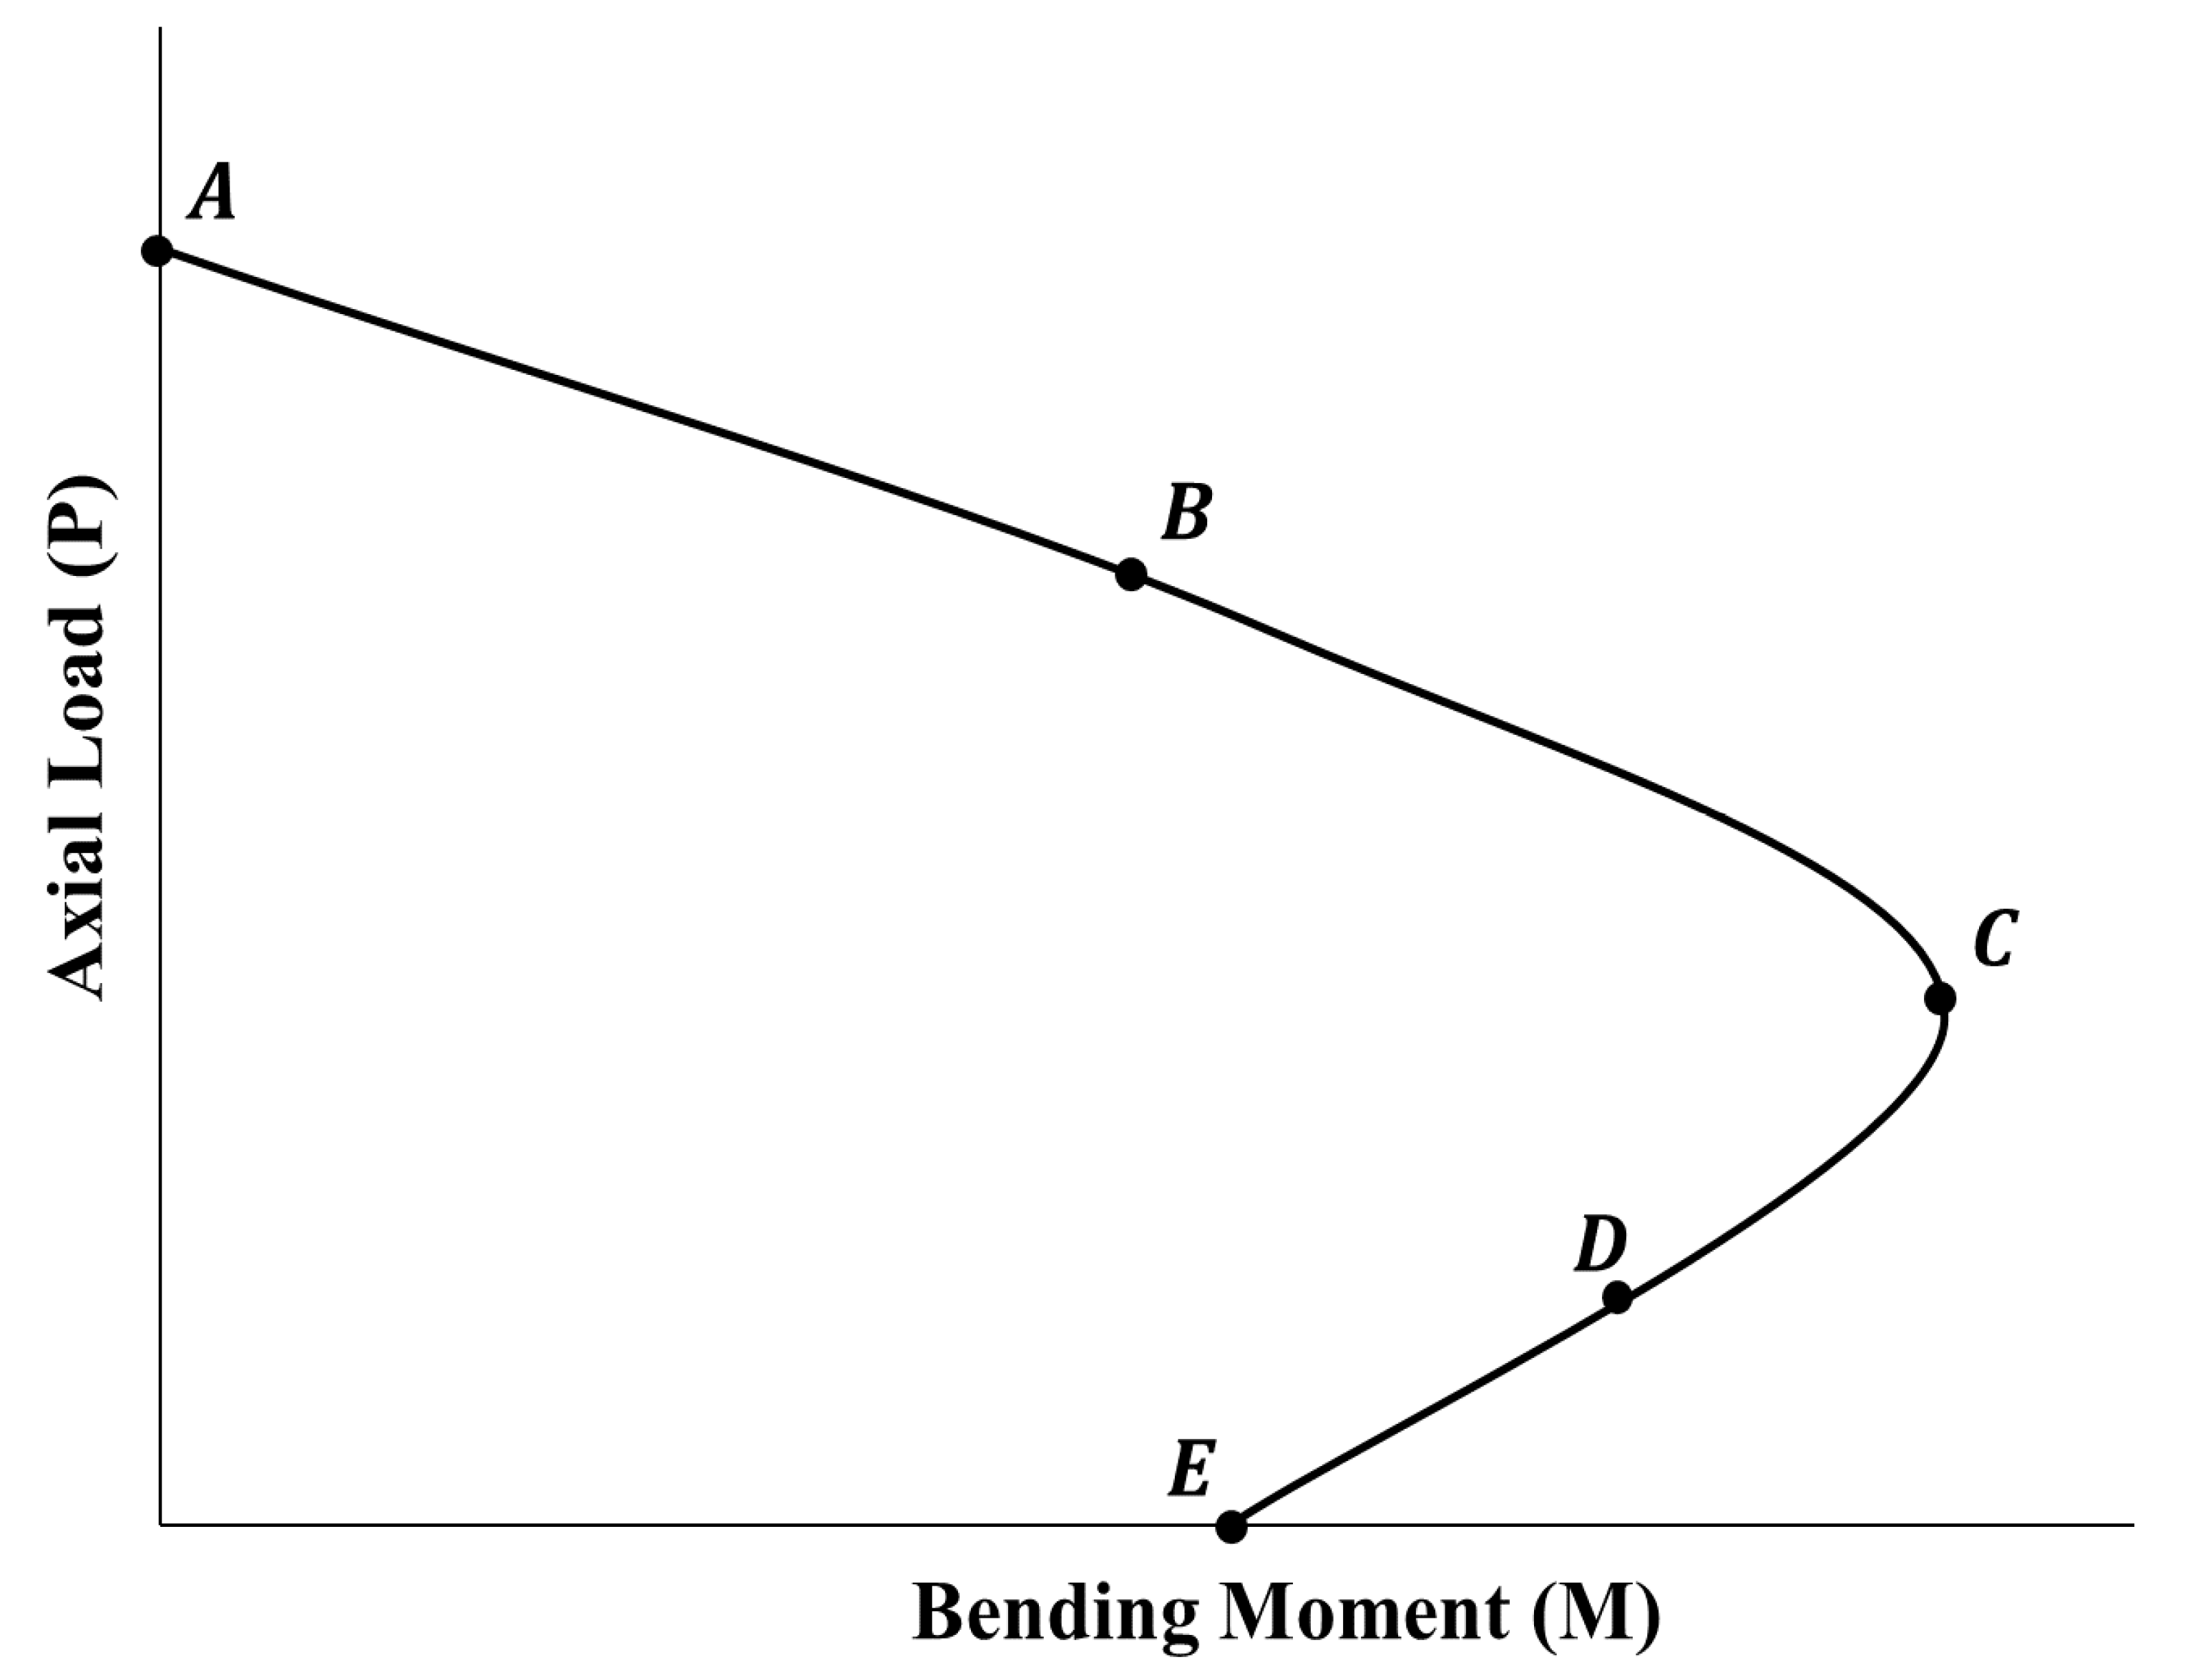
The development of a typical axial load-bending moment interaction for a steel reinforced concrete column can be illustrated using Figure 3. Usually plotted with the axial load vertically and the bending moment horizontally, it can be stated that the shape of the interactions curve can be controlled by five points [16]. Point A can be defined as the pure axial load point in which the applied moment is set at zero. This load is considered as the maximum axial load that can be sustained by the column. At that point, the axial load can be determined based on the compressive strength of the concrete cross-section as well as the longitudinal reinforcement. The absence of the bending moment implies a uniform strain among the cross-section. By adopting a full bond assumption between the longitudinal reinforcement and the concrete, the stresses among the cross section can be calculated using the constitutive stress-strain relationships of the concrete and the reinforcing rebars.
Point B, like point A, has a compressive stress among the whole cross-section. However, the stress distribution is not uniform as it varies between an edge with the maximum compressive stress and the other with approximately zero stress. This means that the cross-section is at the onset of developing tensile stresses as the eccentricity increases. Throughout the curve ABC, the failure of the column is initiated by compression failure. Upon reaching point C, a balanced state is recognized, in which the cross-section reaches the maximum compressive stress on the compression edge and also reaches the yield tensile stress of the extreme longitudinal rebars on the tension side. Moving on curve CD, known as the transition zone, the failure mode switches to a more ductile behavior as the tensile strains surpasses the steel elastic limit, thus allowing for more deformations before reaching the failure compressive stress. Columns with axial load and bending moment capacities that fall on the curve DE are characterized by tension-controlled failures in which the cross-section undergoes high plastic tensile strains before reaching the concrete crushing stress. Finally, on reaching point E, the structural loading resembles a beam with a pure applied moment and zero axial force.
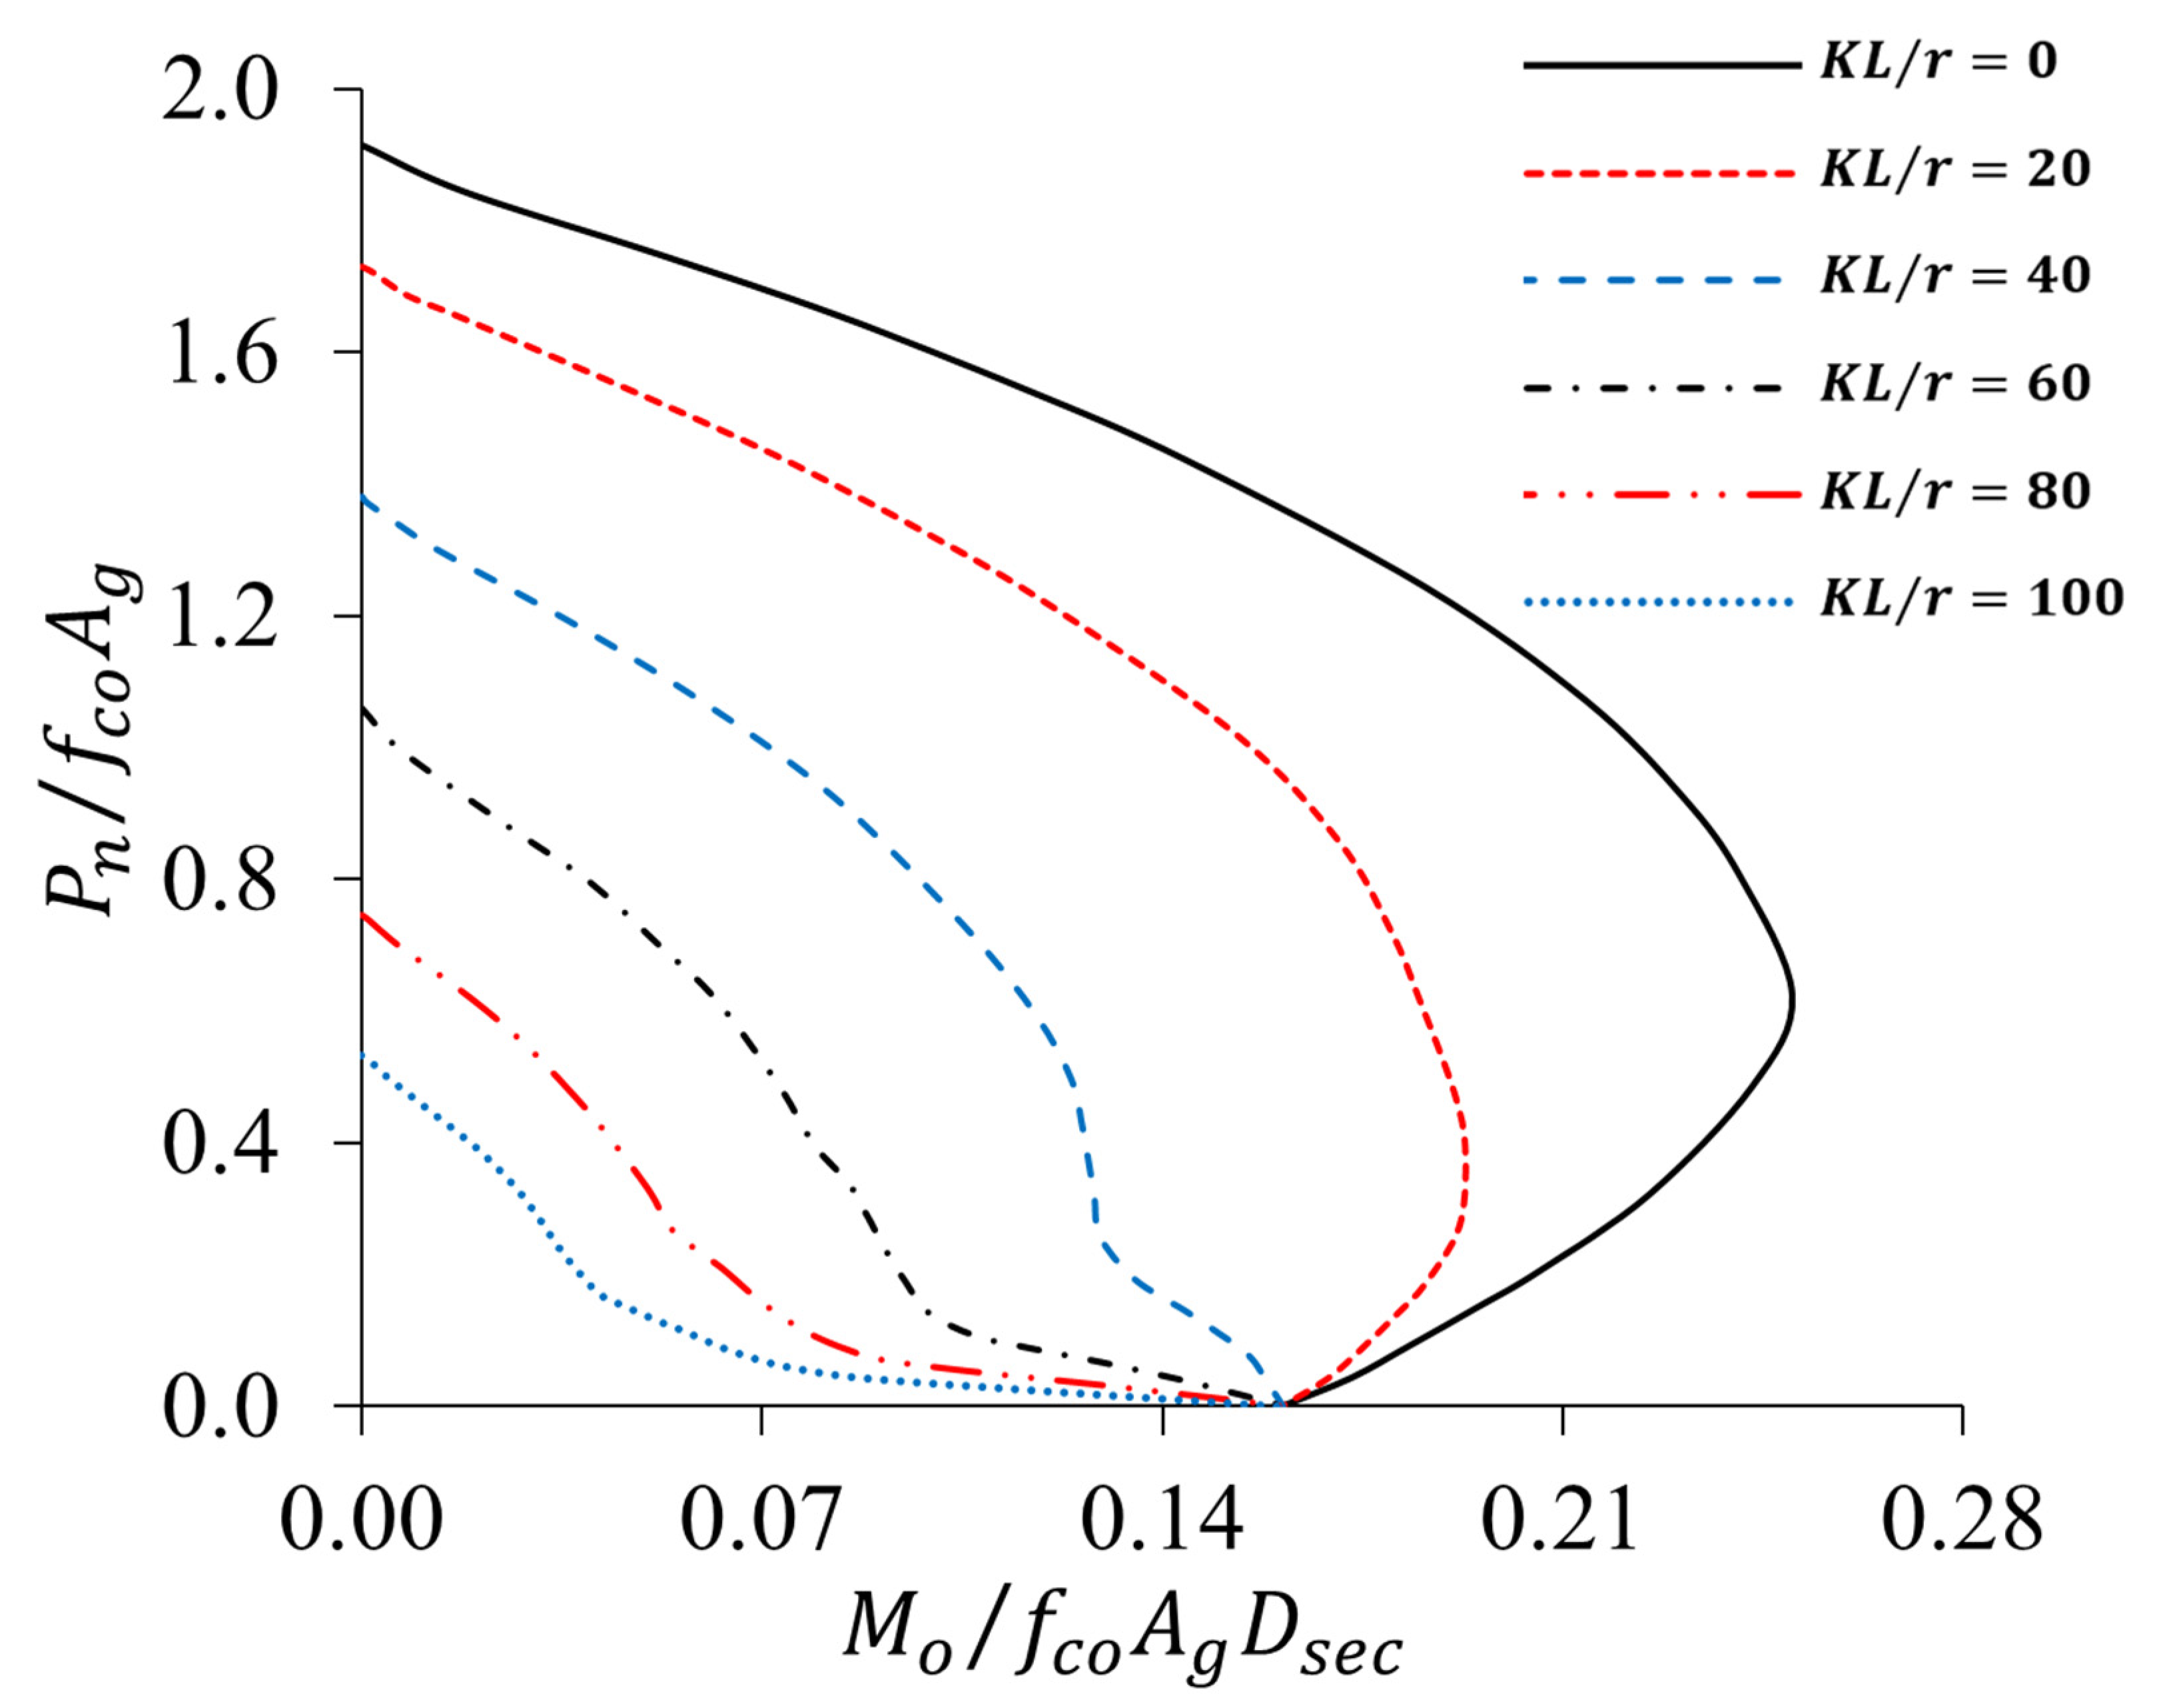
Figure 4 depicts a sample group of axial load-bending moment interactions that could be developed using the provided data. All the curves are from group G6 with hybrid reinforcement configuration and strength level 2. It can be seen how the slenderness effects could excessively reduce the column’s capacity for both the axial load and bending moment under different / values. As the value of increases, the interaction diagram behavior deviates from the typical one provided, as it gradually shifts from a material failure mode to an elastic buckling one. Likewise, the provided dataset could be used for generating charts and holding comparisons between different reinforcement configurations including material type, strength, and reinforcement ratio .
Author Contributions
Conceptualization, M.A.; methodology, M.A and F.A.; software, F.A.; validation, F.A.; formal analysis, F.A.; investigation, M.A. and F.A.; resources, M.A.; data curation, F.A.; writing—original draft preparation, F.A.; writing—review and editing, M.A.; visualization, M.A. and F.A.; supervision, M.A.; project administration, M.A.; funding acquisition, M.A. Both authors have read and agreed to the published version of the manuscript.
Funding
This research was funded by the American University of Sharjah (AUS) through the Enhanced Faculty Research Grant program (EFRG18-MSE-CEN-25).
Institutional Review Board Statement
Not applicable.
Informed Consent Statement
Not applicable.
Data Availability Statement
Some or all data, models, or code generated or used during the study are available in a repository or online in accordance with funder data retention policies. (AlHamaydeh and Amin 2021) “Interaction Diagrams of Geopolymer FRC Slender Columns with Double-Layer Reinforcement_Dataset”, Zenodo. http://0-doi-org.brum.beds.ac.uk/10.5281/zenodo.4568644. Last accessed on 4 April 2021.
Acknowledgments
The financial support provided by AUS is greatly appreciated. This paper represents the opinions of the authors and does not mean to represent the position or opinions of AUS. Authors would like to thank Eng. Hazem Kassab for his involvement in the initial stages of the project.
Conflicts of Interest
The authors declare no conflict of interest. The funders had no role in the design of the study; in the collection, analyses, or interpretation of data; in the writing of the manuscript, or in the decision to publish the results.
References
- Hadhood, A.; Mohamed, H.M.; Benmokrane, B. Axial Load–Moment Interaction Diagram of Circular Concrete Columns Reinforced with CFRP Bars and Spirals: Experimental and Theoretical Investigations. J. Compos. Constr. 2017, 21, 04016092. [Google Scholar] [CrossRef]
- Farhan, N.A.; Sheikh, M.N.; Hadi, M.N. Load-Bending Moment (P-M) Interactions of Geopolymer Concrete Column Reinforced with and without Steel Fiber. ACI Struct. J. 2020, 117, 133–144. [Google Scholar] [CrossRef]
- Hales, T.A.; Pantelides, C.P.; Reaveley, L.D. Analytical buckling model for slender FRP-reinforced concrete columns. Compos. Struct. 2017, 176, 33–42. [Google Scholar] [CrossRef]
- Effect of Critical Test Parameters on Behavior of Glass Fiber-Reinforced Polymer-Reinforced Concrete Slender Columns under Eccentric Load. ACI Struct. J. 2020, 117, 127–142. [CrossRef]
- Noushini, A.; Hastings, M.; Castel, A.; Aslani, F. Mechanical and flexural performance of synthetic fibre reinforced geopolymer concrete. Constr. Build. Mater. 2018, 186, 454–475. [Google Scholar] [CrossRef]
- Kazmi, S.M.S.; Munir, M.J.; Wu, Y.-F.; Patnaikuni, I.; Zhou, Y.; Xing, F. Axial stress-strain behavior of macro-synthetic fiber reinforced recycled aggregate concrete. Cem. Concr. Compos. 2019, 97, 341–356. [Google Scholar] [CrossRef]
- Farhan, N.A.; Sheikh, M.N.; Hadi, M.N. Behaviour of Ambient Cured Steel Fibre Reinforced Geopolymer Concrete Columns Under Axial and Flexural Loads. Structures 2018, 15, 184–195. [Google Scholar] [CrossRef]
- V.ROD. Technical Data Sheets. Available online: https://www.fiberglassrebar.com/en/Fiberglass-reinforcement/Technical-data-sheets (accessed on 13 April 2021).
- Hadhood, A.; Mohamed, H.M.; Benmokrane, B.; Nanni, A.; Shield, C.K. Assessment of Design Guidelines of Concrete Columns Reinforced with Glass Fiber-Reinforced Polymer Bars. ACI Struct. J. 2019, 116, 193–207. [Google Scholar] [CrossRef]
- Proposed Flexural Stiffness of Slender Concrete Columns Reinforced with Glass Fiber-Reinforced Polymer Bars. ACI Struct. J. 2021, 118, 227–240. [CrossRef]
- Mander, J.B.; Priestley, M.J.N.; Park, R. Theoretical Stress-Strain Model for Confined Concrete. J. Struct. Eng. 1988, 114, 1804–1826. [Google Scholar] [CrossRef] [Green Version]
- Hales, T.A. Slender Concrete Columns Reinforced with Fiber Reinforced Polymer Spirals. Ph.D. Thesis, University of Utah, Salt Lake City, UT, USA, 2015. [Google Scholar]
- Hasan, H.A.; Karim, H.; Sheikh, M.N.; Hadi, M.N.S. Moment-Curvature Behavior of Glass Fiber-Reinforced Polymer Bar-Reinforced Normal-Strength Concrete and High-Strength Concrete Columns. ACI Struct. J. 2019, 116, 65–75. [Google Scholar] [CrossRef]
- Sarker, P.K. Analysis of geopolymer concrete columns. Mater. Struct. Constr. 2009, 42, 715–724. [Google Scholar] [CrossRef]
- Maranan, G.; Manalo, A.; Benmokrane, B.; Karunasena, W.; Mendis, P. Behavior of concentrically loaded geopolymer-concrete circular columns reinforced longitudinally and transversely with GFRP bars. Eng. Struct. 2016, 117, 422–436. [Google Scholar] [CrossRef]
- Wight, J.K. Reinforced Concrete: Mechanics and Design, 7th ed.; Pearson Education Limited: Edinburgh, UK, 2015. [Google Scholar]
Figure 1.
Concrete column’s cross-section with double-layer reinforcement.

Figure 2.
Modeling considerations: (a) confinement pressure change through cross-section layers, (b) stress-strain distribution along the cross-section, (c) the effectively confined cores of the inner and outer reinforcing layers, and (d) a buckled column with additional moment at its mid-height cross-section.

Figure 3.
A typical axial load-bending moment interaction diagram with its significant control points.
Figure 3.
A typical axial load-bending moment interaction diagram with its significant control points.

Figure 4.
A sample axial load-bending moment interaction diagram that could be derived using provided data (group G6, strength level 2, ).
Figure 4.
A sample axial load-bending moment interaction diagram that could be derived using provided data (group G6, strength level 2, ).


Table 1.
Material assignment for interaction diagram groups.
| Group | Concrete Type | Longitudinal and Transverse Reinforcement Inner Layer | Longitudinal and Transverse Reinforcement Outer Layer | Data File |
|---|---|---|---|---|
| G1 | Steel-FRGPC | GFRP | GFRP | G1.xlsx |
| G2 | Steel-FRGPC | Steel | Steel | G2.xlsx |
| G3 | Steel-FRGPC | GFRP | Steel | G3.xlsx |
| G4 | Synthetic-FRGPC | GFRP | GFRP | G4.xlsx |
| G5 | Synthetic-FRGPC | Steel | Steel | G5.xlsx |
| G6 | Synthetic-FRGPC | GFRP | Steel | G6.xlsx |
| G7 | Plain-GPC | GFRP | GFRP | G7.xlsx |
| G8 | Plain-GPC | Steel | Steel | G8.xlsx |
| G9 | Plain-GPC | GFRP | Steel | G9.xlsx |
Table 2.
Strength level assignment for interaction diagrams.
| Strength Level | GFRP Reinforcement | Steel Reinforcement | ||
|---|---|---|---|---|
| [MPa] | [GPa] | [MPa] | [GPa] | |
| 1 | 900 | 40 | 420 | 200 |
| 2 | 1000 | 50 | 550 | 200 |
| 3 | 1100 | 60 | 690 | 200 |
Publisher’s Note: MDPI stays neutral with regard to jurisdictional claims in published maps and institutional affiliations. |
© 2021 by the authors. Licensee MDPI, Basel, Switzerland. This article is an open access article distributed under the terms and conditions of the Creative Commons Attribution (CC BY) license (https://creativecommons.org/licenses/by/4.0/).
Share and Cite
MDPI and ACS Style
AlHamaydeh, M.; Amin, F. Data for Interaction Diagrams of Geopolymer FRC Slender Columns with Double-Layer GFRP and Steel Reinforcement. Data 2021, 6, 43. https://0-doi-org.brum.beds.ac.uk/10.3390/data6050043
AMA Style
AlHamaydeh M, Amin F. Data for Interaction Diagrams of Geopolymer FRC Slender Columns with Double-Layer GFRP and Steel Reinforcement. Data. 2021; 6(5):43. https://0-doi-org.brum.beds.ac.uk/10.3390/data6050043
Chicago/Turabian StyleAlHamaydeh, Mohammad, and Fouad Amin. 2021. "Data for Interaction Diagrams of Geopolymer FRC Slender Columns with Double-Layer GFRP and Steel Reinforcement" Data 6, no. 5: 43. https://0-doi-org.brum.beds.ac.uk/10.3390/data6050043