
Measurements of LoRaWAN Technology in Urban Scenarios: A Data Descriptor

 , , , ,
  ,
,  , , and
Abstract
:1. Introduction
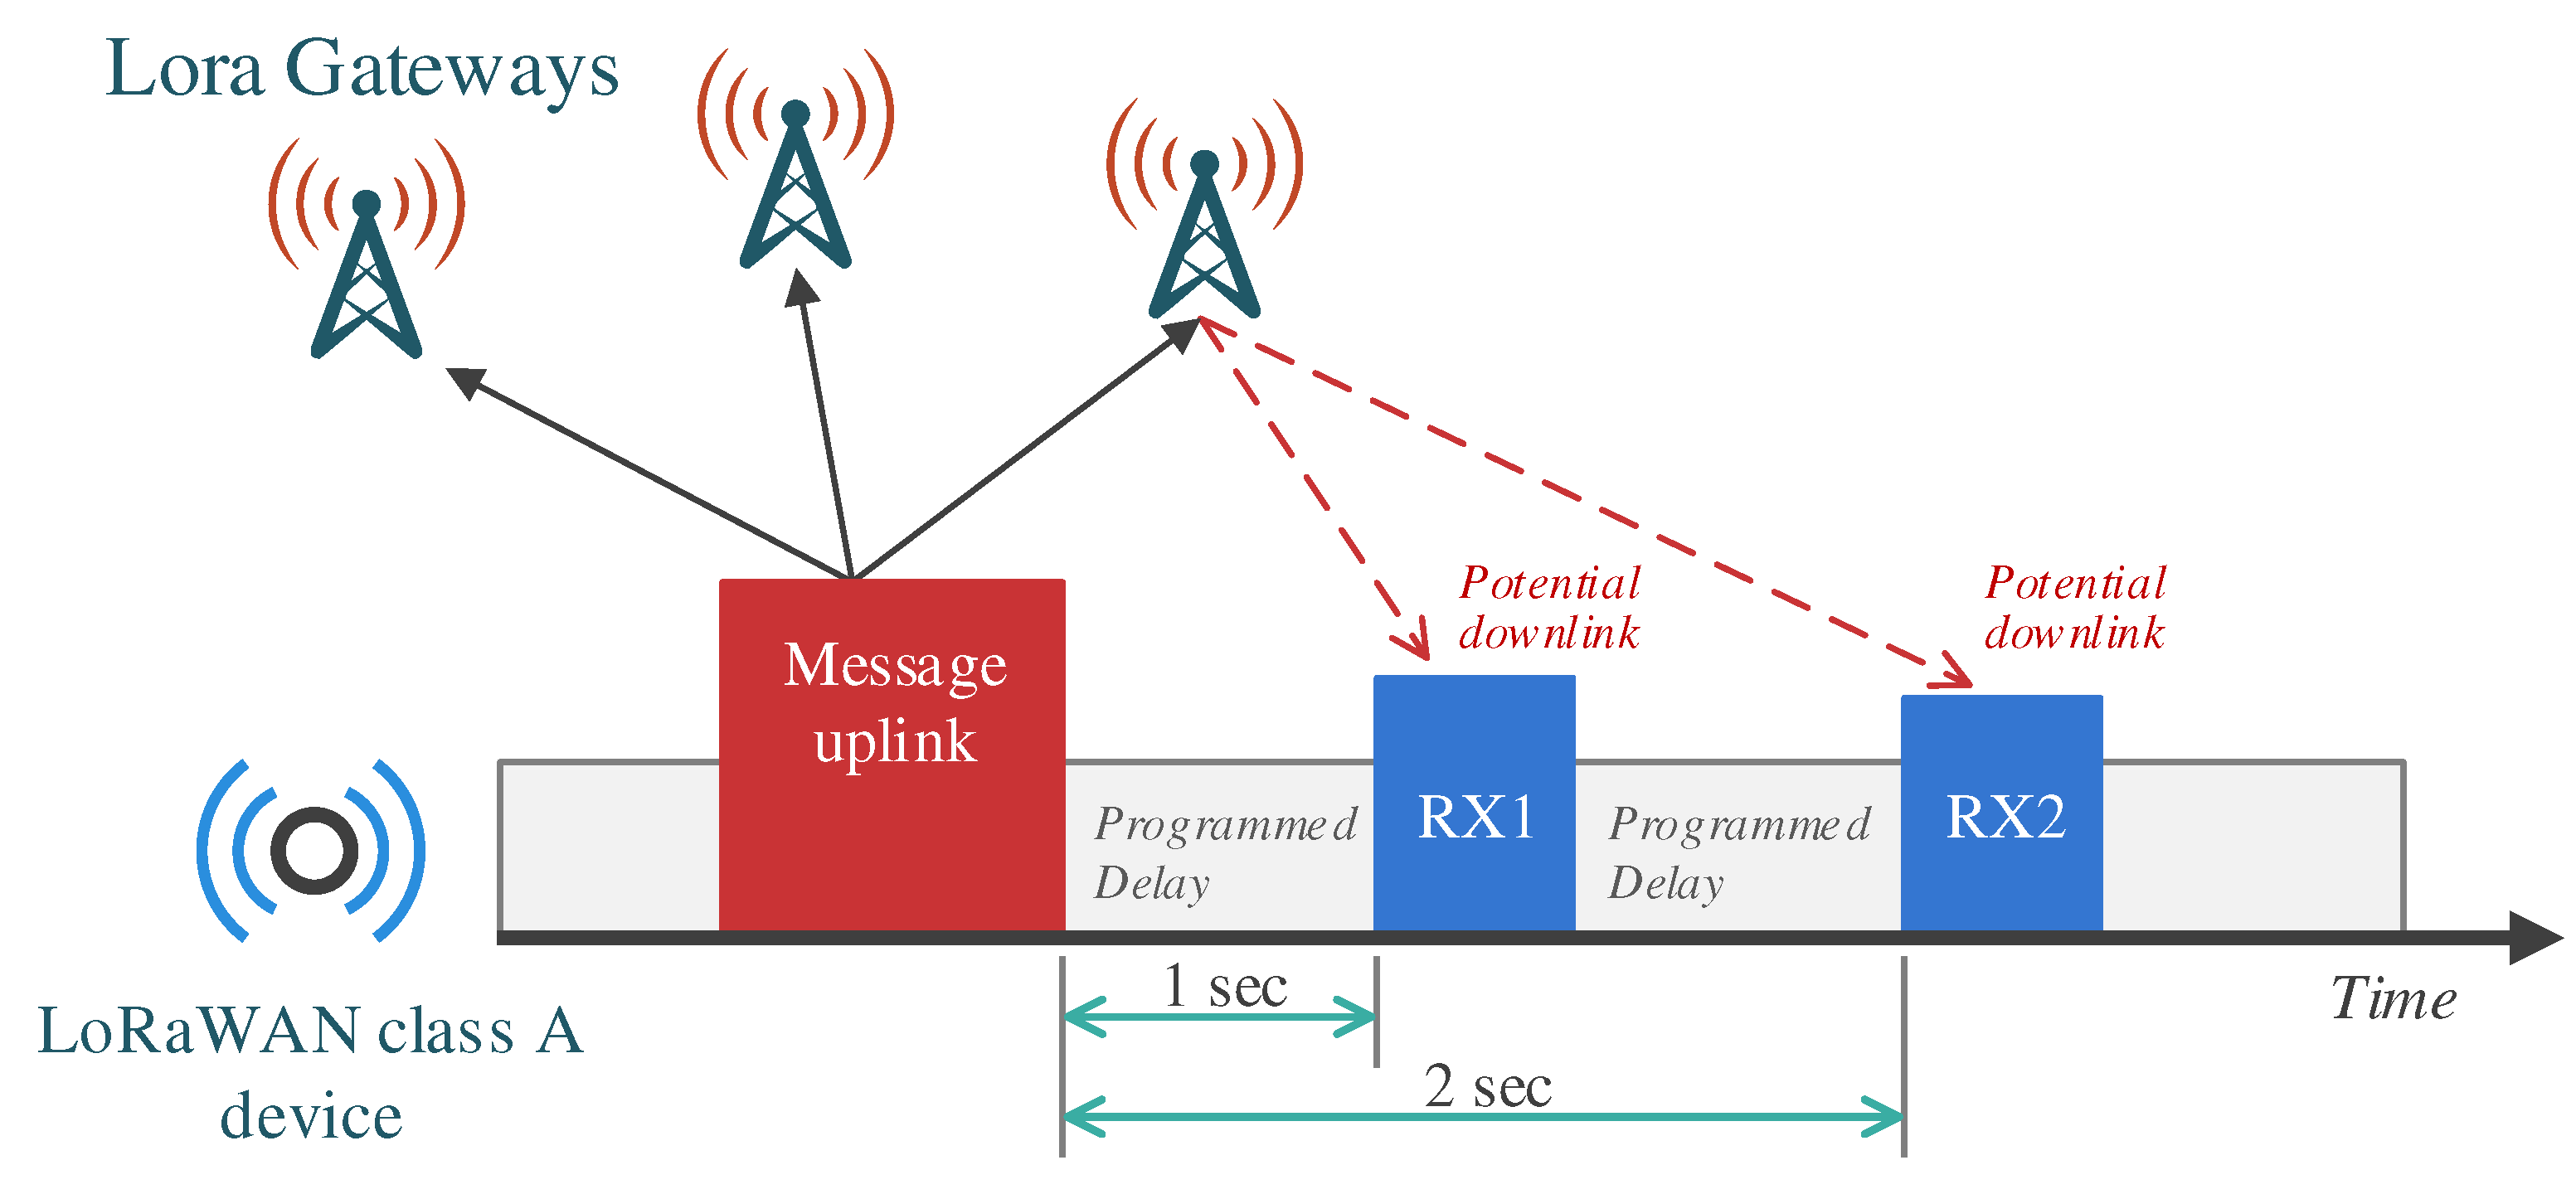
2. LoRaWAN Technology Overview
2.1. LoRaWAN Regional Parameters for EU
3. Data Description
- cmd—Command (message type): Incoming (uplink) message from the ED via the GW to the server. This also contains metadata from receiving GWs.
- seqno—Sequence number: The sequence number of the message in the form of a 32-bit integer. The Network Server generates this number.
- EUI—Extended Unique Identifier: A global identifier (64-bit) of the terminal device, which the manufacturer or owner assigns. The Institute of Electrical and Electronics Engineers (IEEE) Registration Authority manages the assignment of identifier pools. It is given in hexadecimal format. This identifier is used similarly to the MAC address of the network interface.
- ts—Timestamp: The time of the received message recorded at the first receiving GW. The parameter indicates the number of milliseconds since the Unix epoch (1 January 1970).
- fcnt—Frame count: Sequential number of the message (16-bit integer) sent from the device. In the case of a device reset, the value of the counter starts from zero. The value of this parameter can be used to detect a failure to receive messages.
- port—The port number is used to distinguish the type of application payload message. It is, therefore, not necessary to explicitly add it to the application payload. The Port parameter’s (8-bit integer) possible values range from 1 to 223 for the users. Other values are reserved.
- freq—Frequency: A value that corresponds to the frequency (expressed in Hertz) of the given LoRaWAN channel. Before transmitting each message, the ED pseudo-randomly selects from the range of available LoRaWAN channels on which it will transmit the message.
- toa—Time on Air: Message transmission time in milliseconds. This value is directly proportional to the data rate and message size.
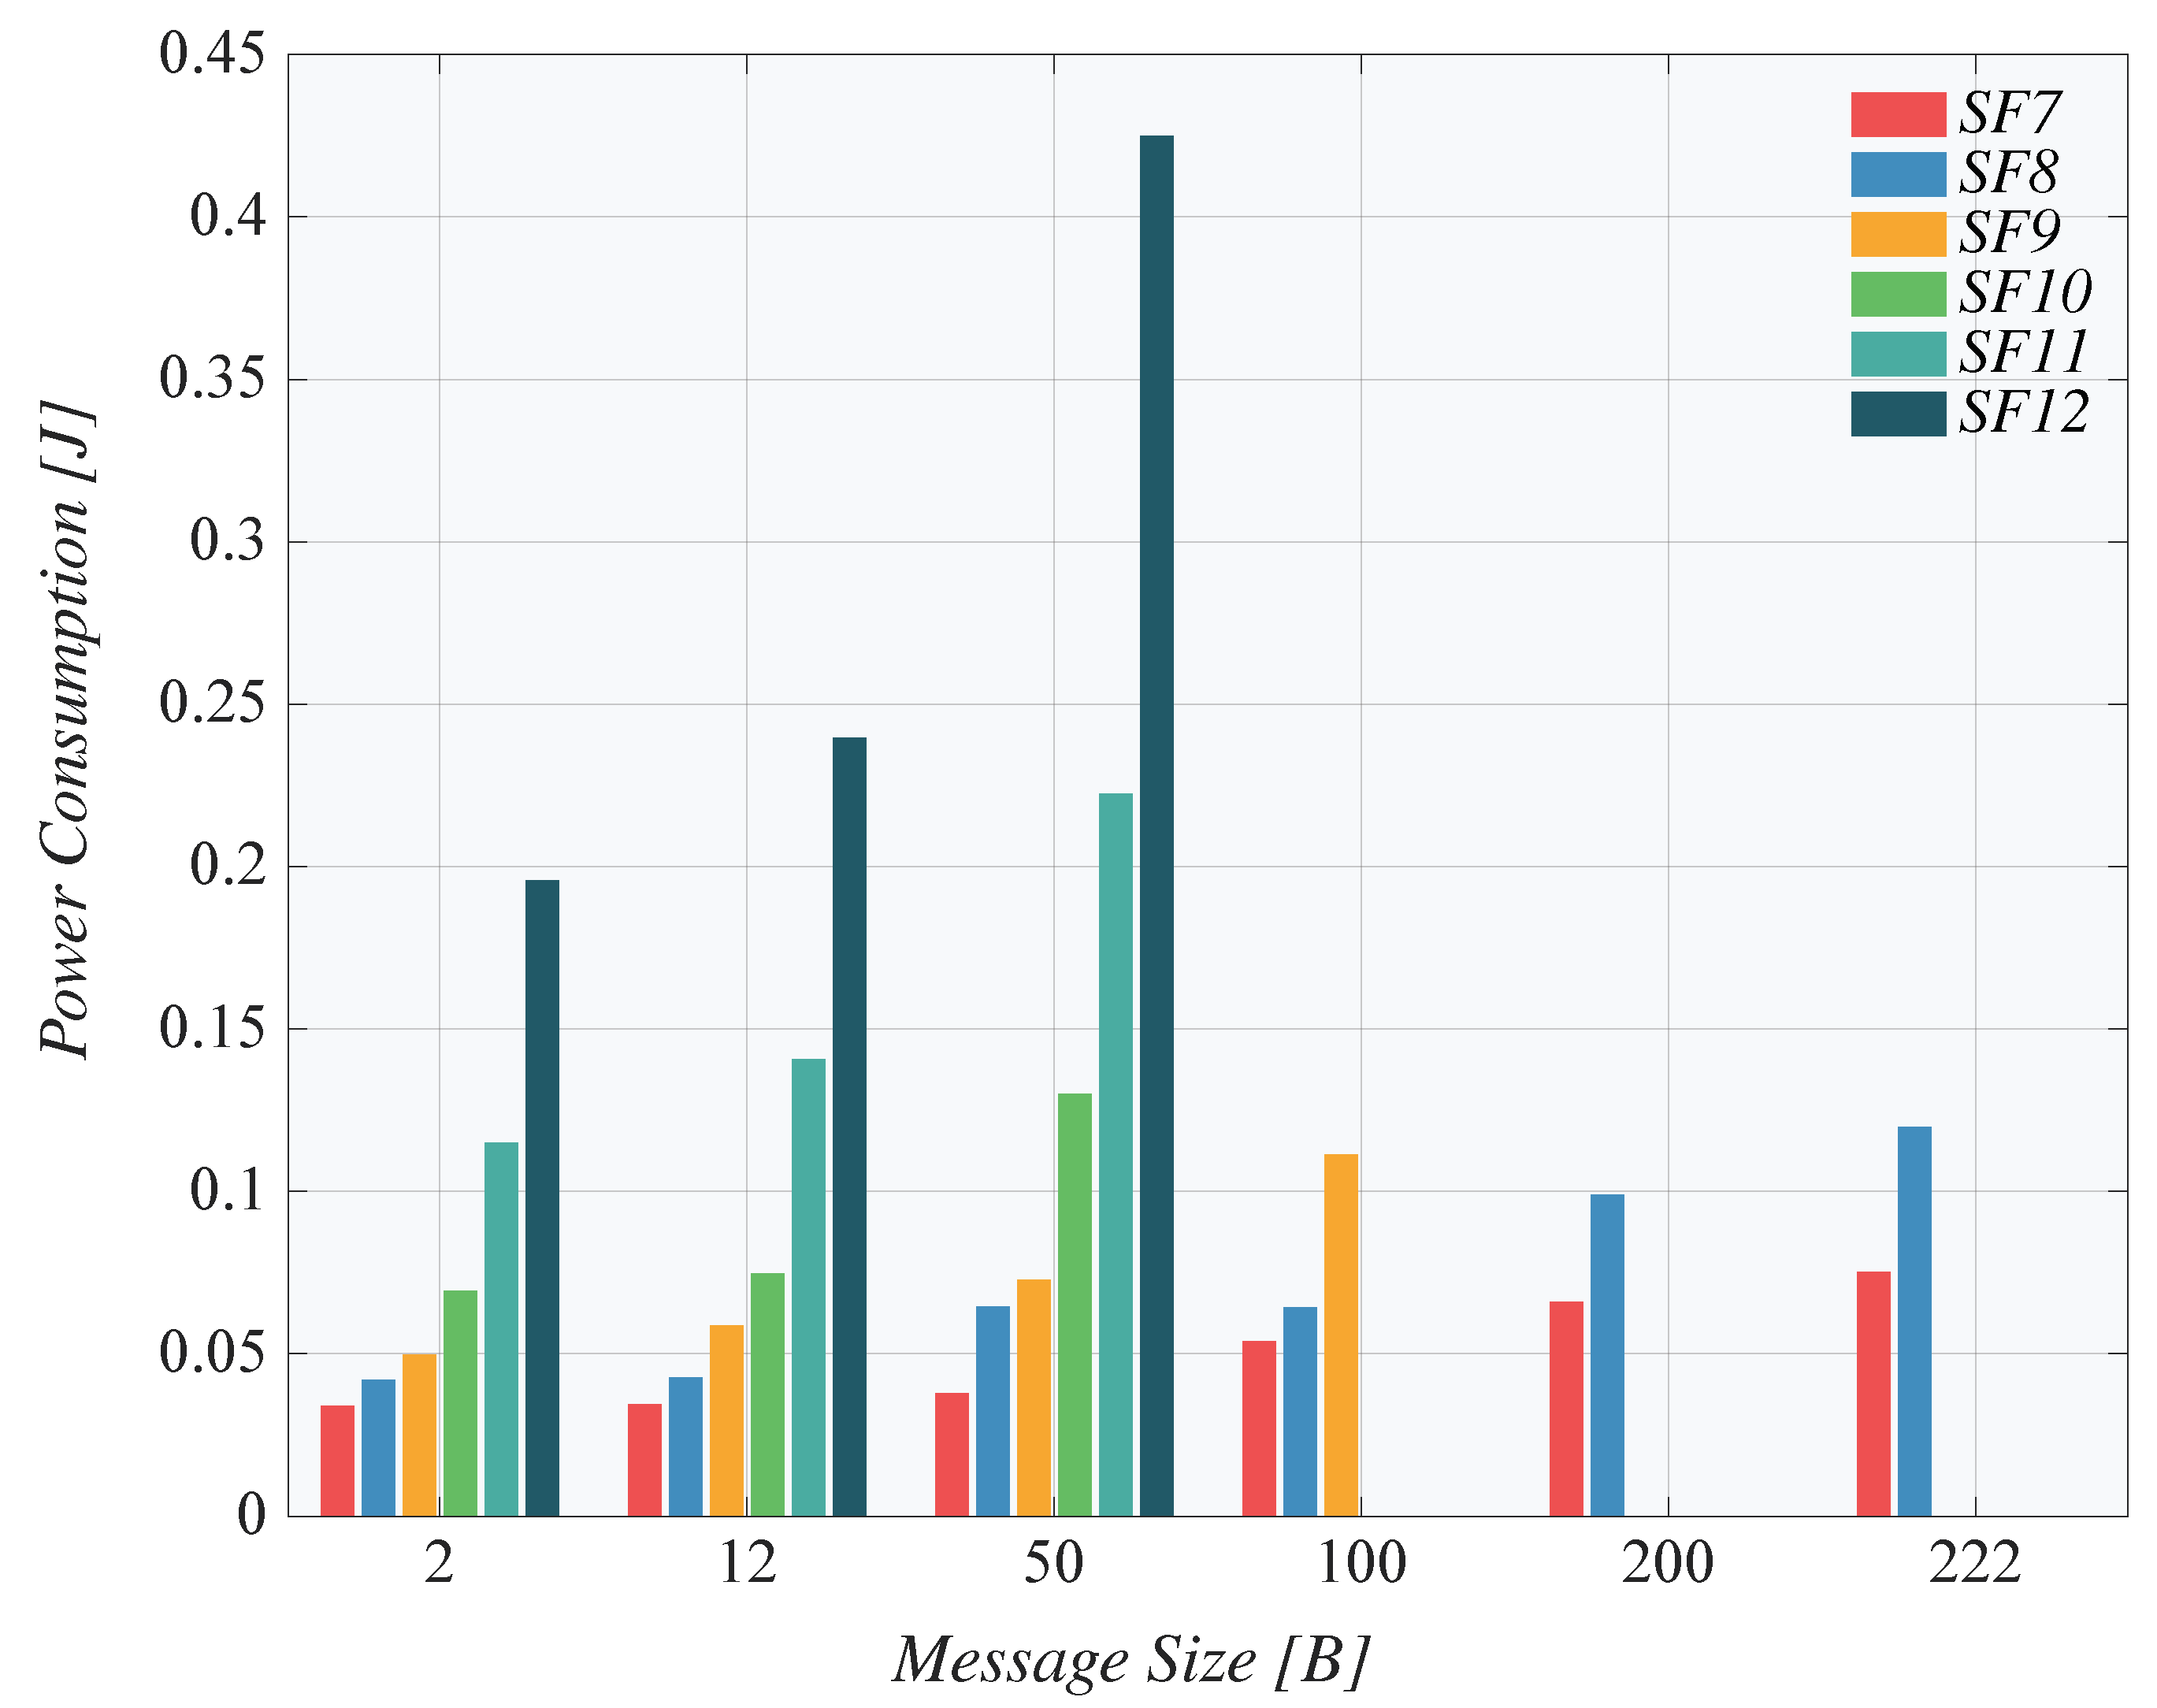
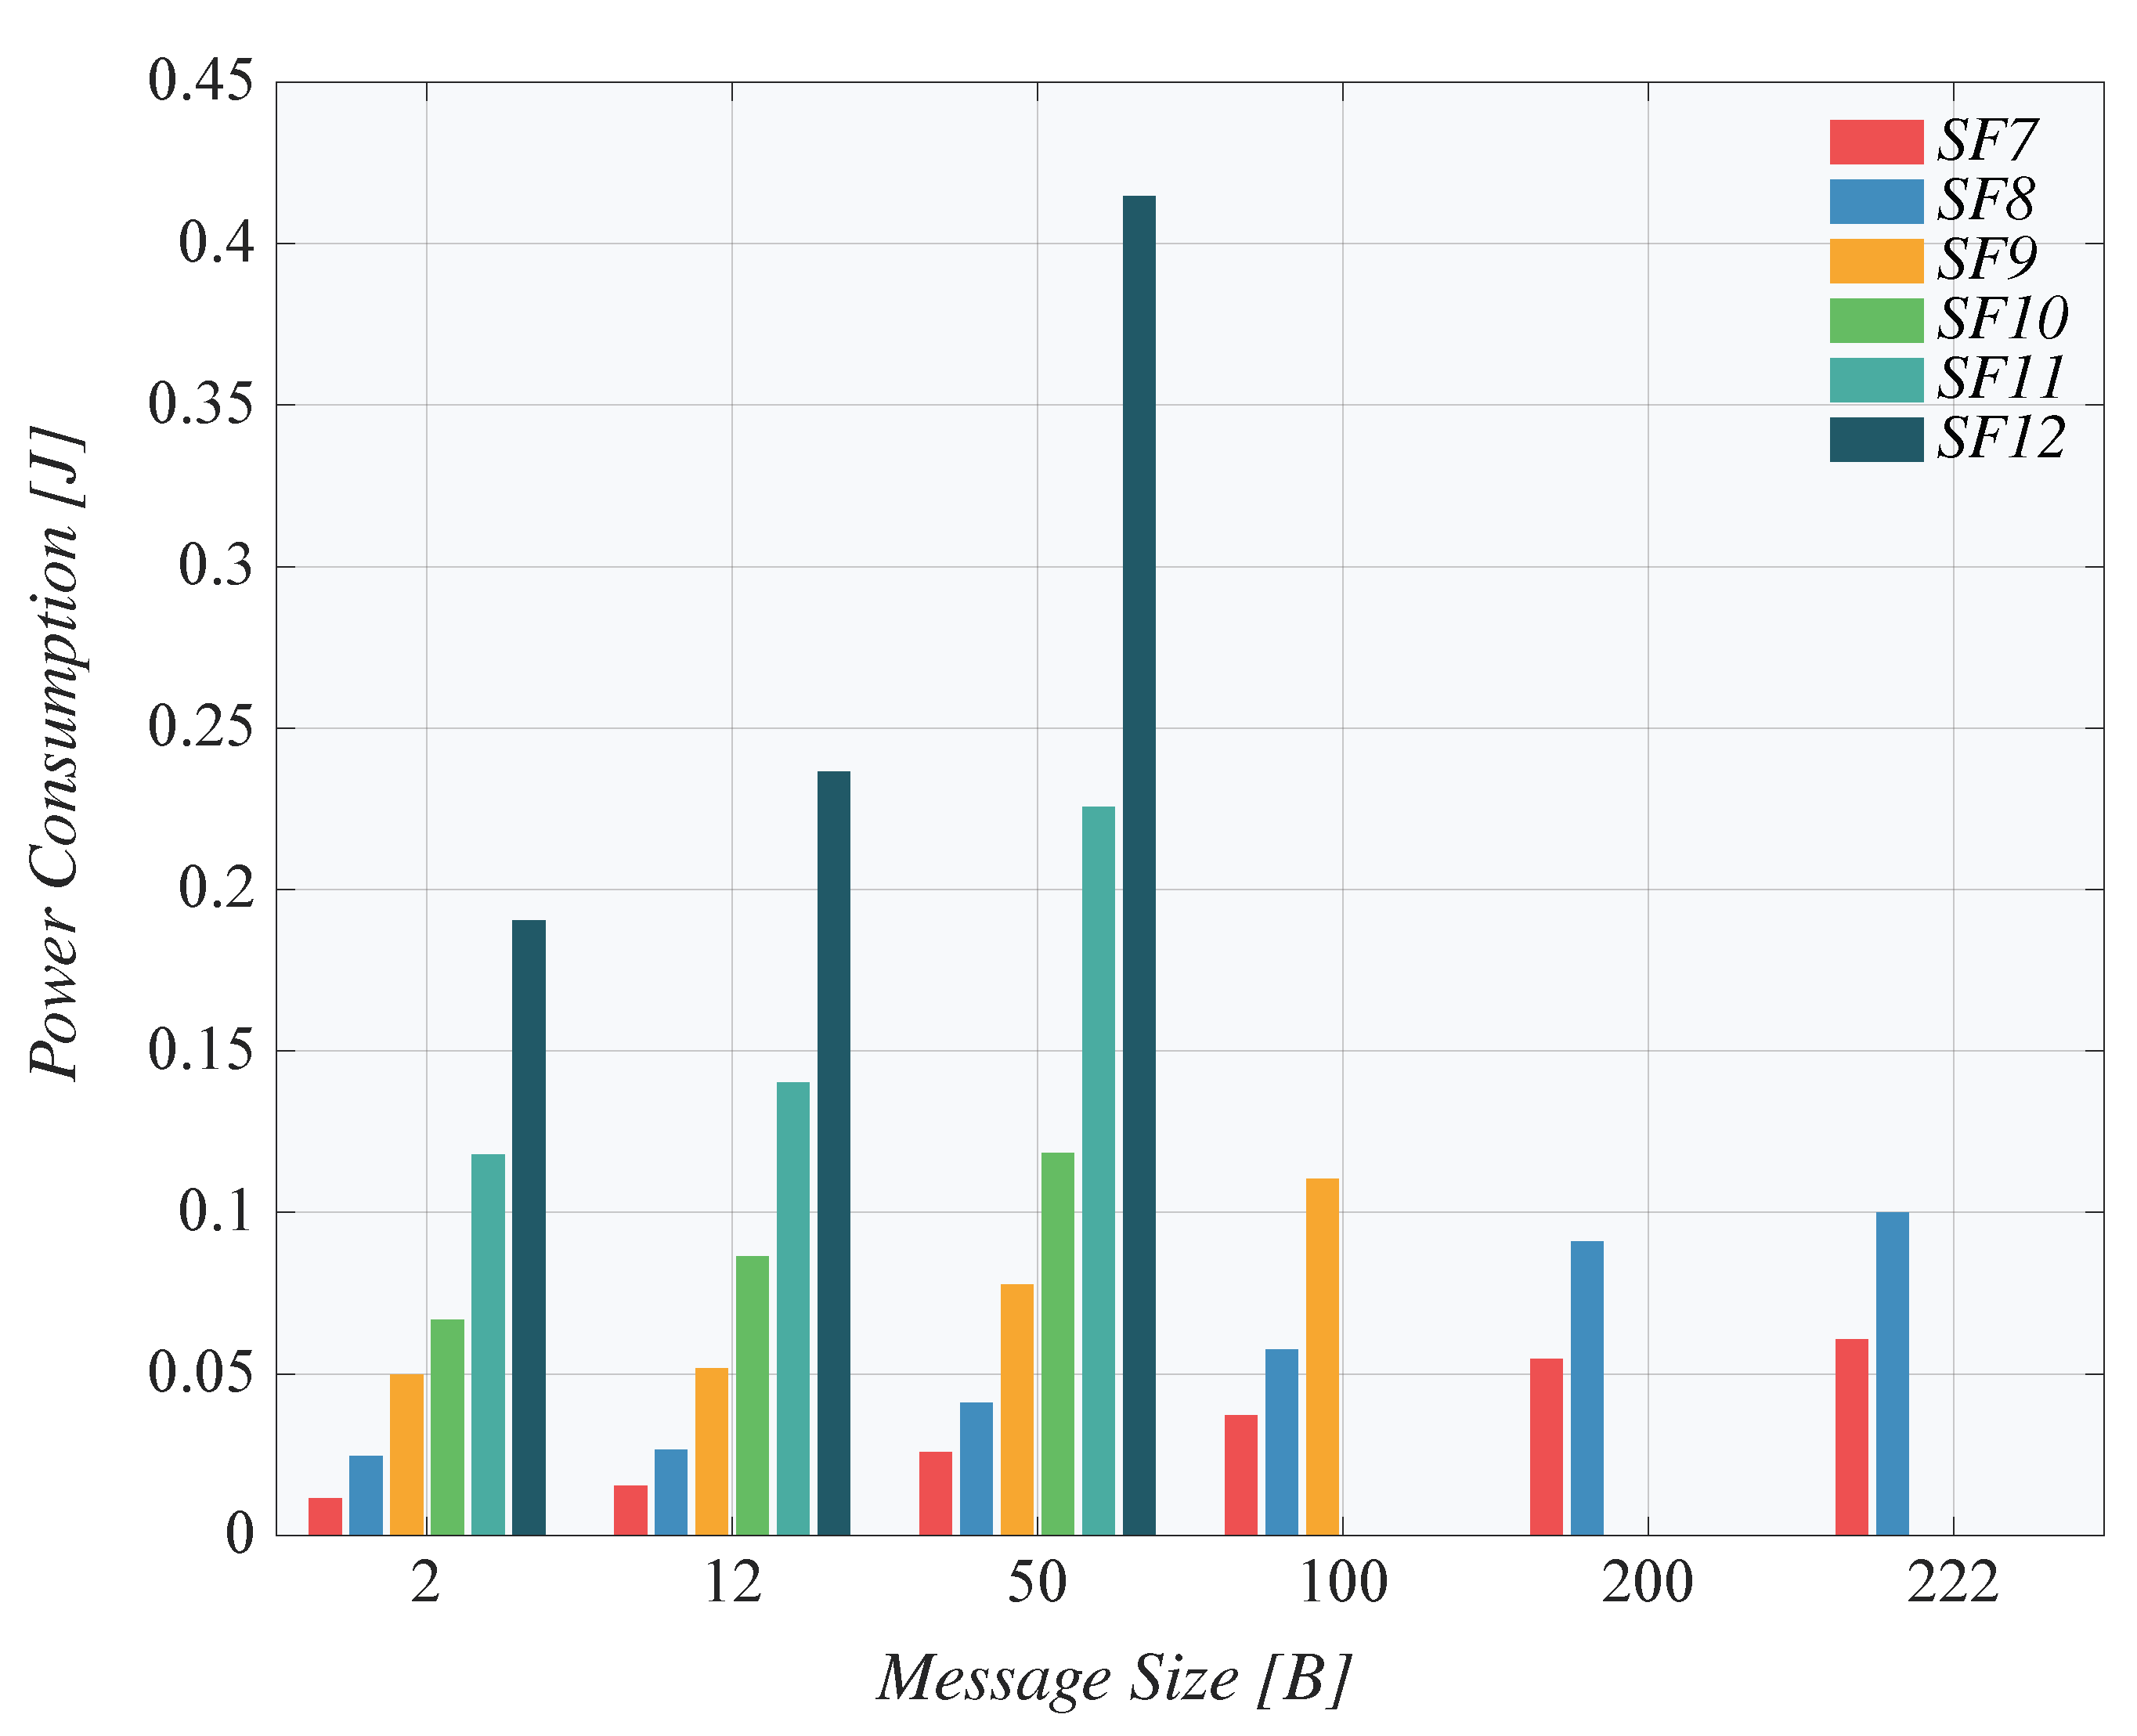
- dr—Data Rate: The string parameter specifying the spreading factor, bandwidth, and coding rate. The spreading factor fundamentally affects the data rate and thus, the message time on-air. The value can be selected from the interval 7 to 12. Bandwidth values are only 125, 250, and 500 kHz. The larger the bandwidth, the higher the data rate.
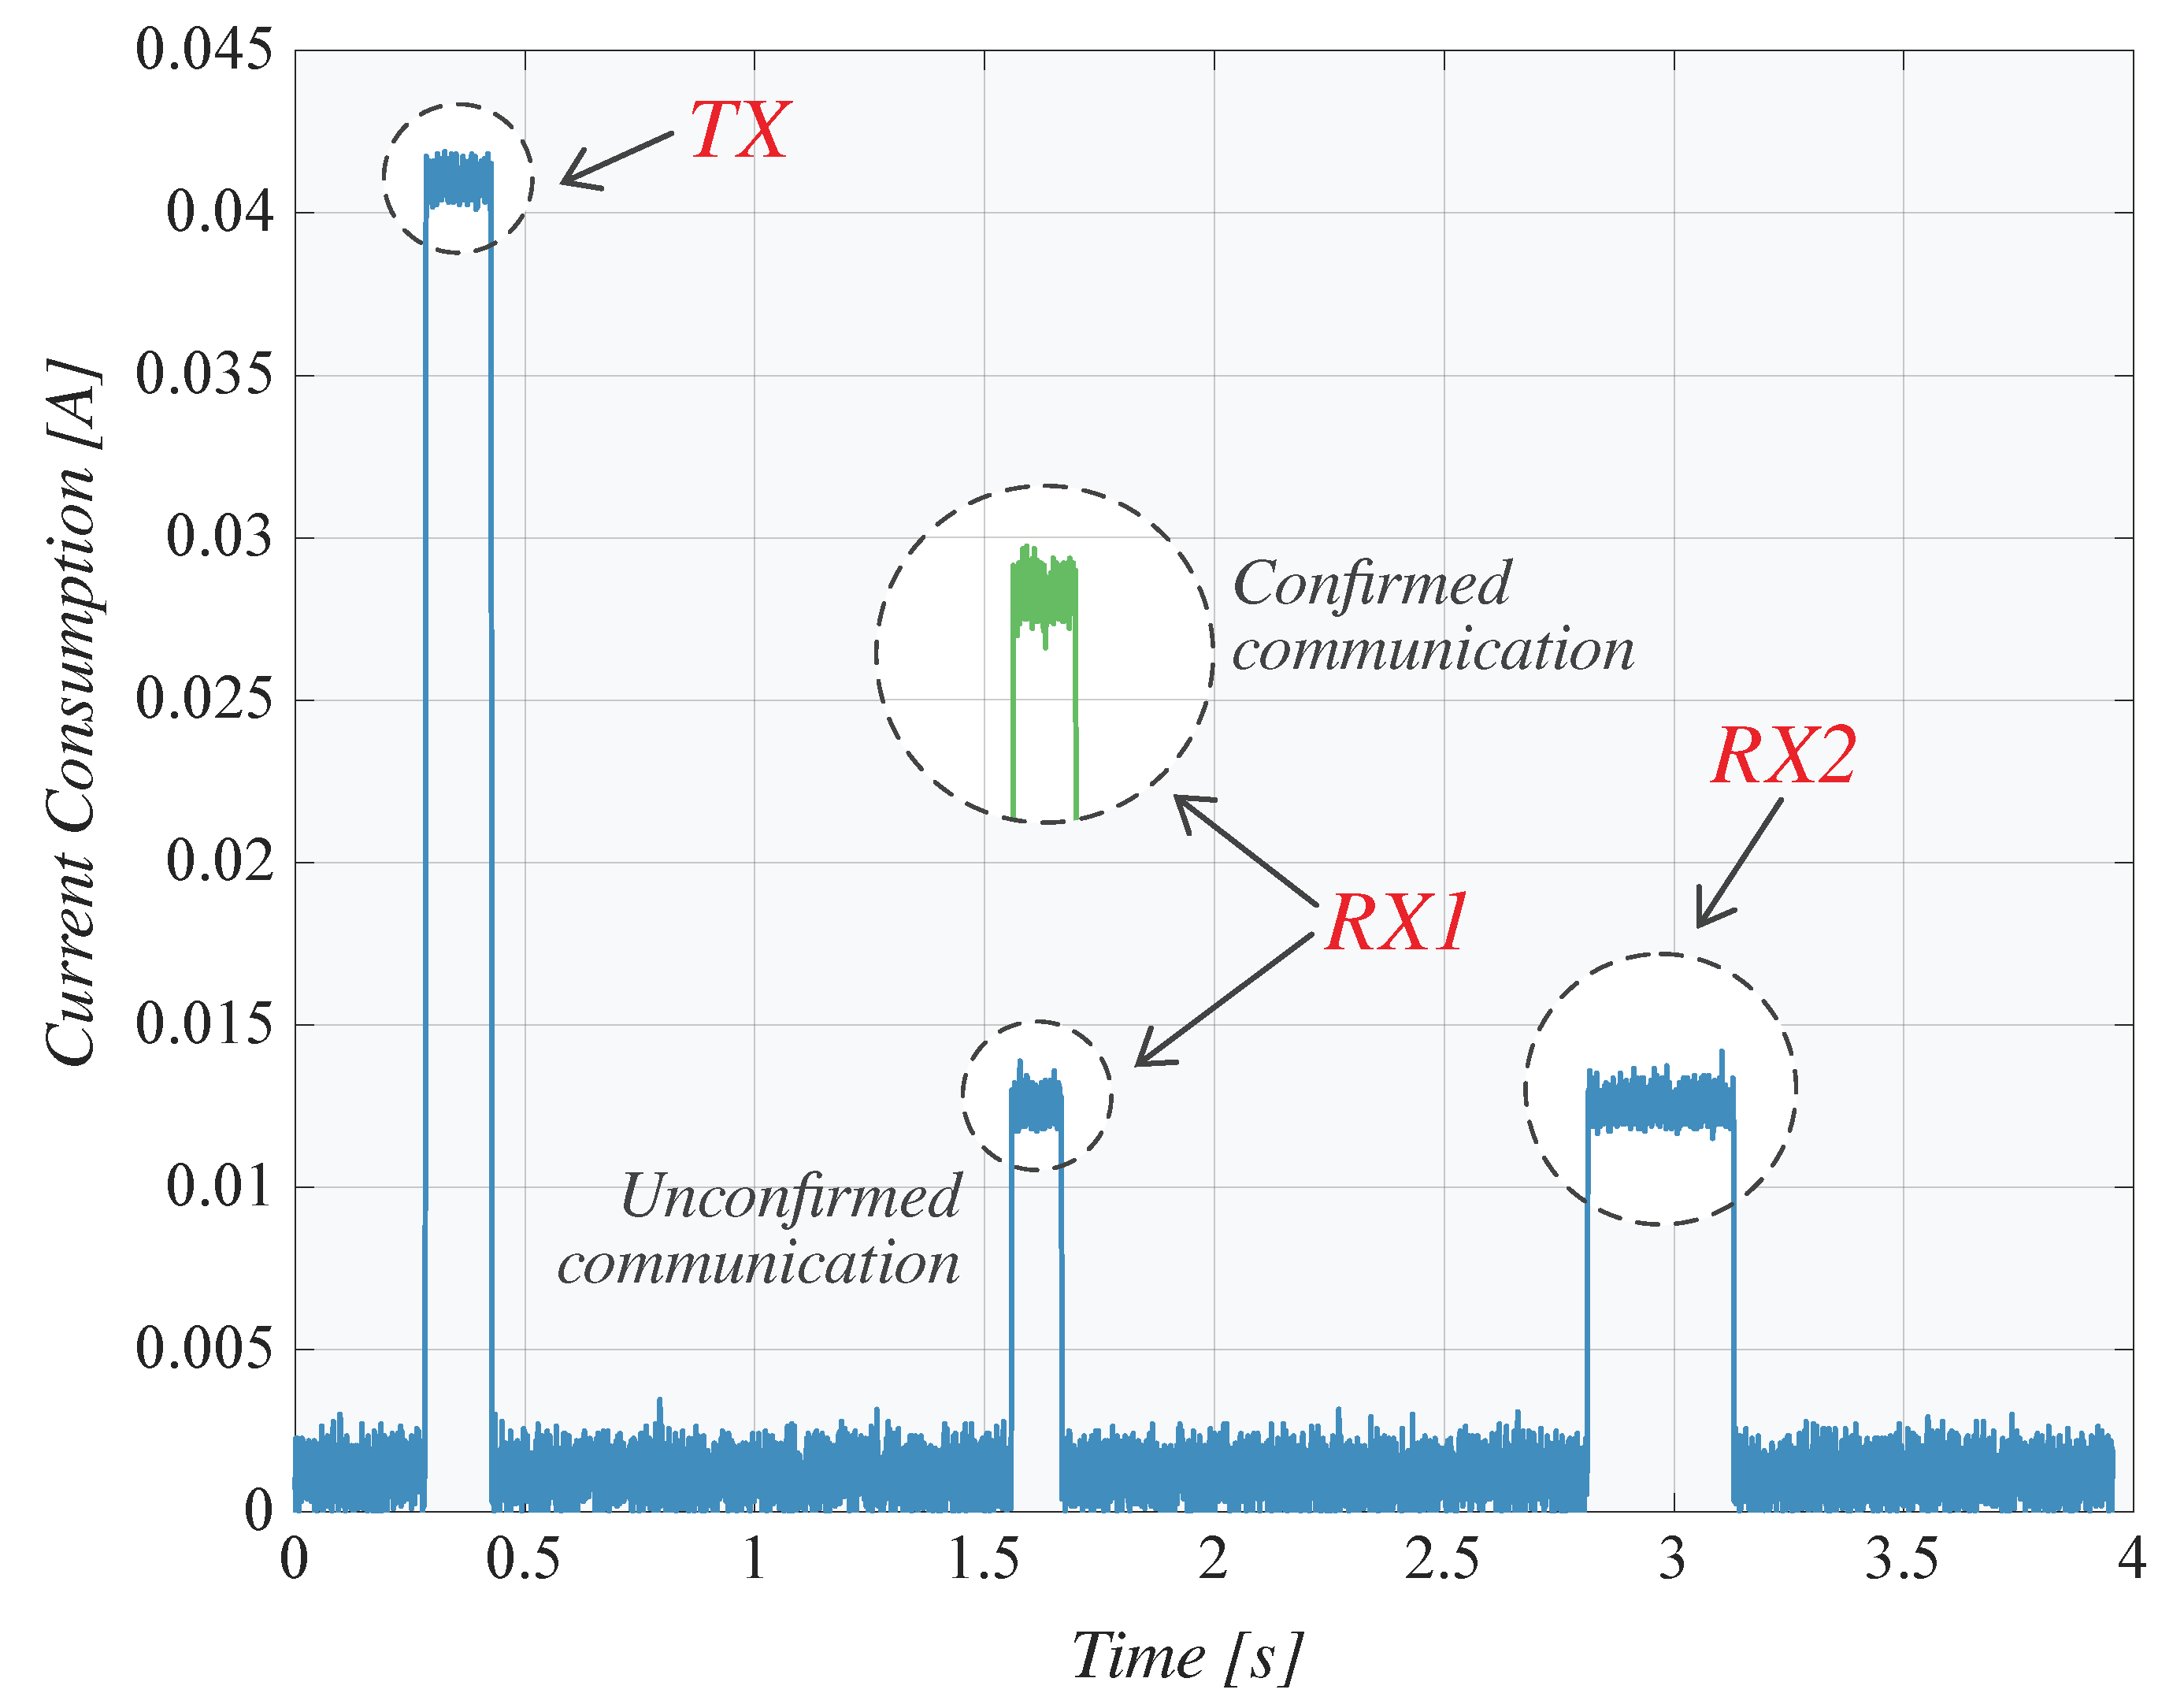
- ack—Acknowledge: The parameter is of a Boolean type and indicates whether the ED requires confirmation of the sent message. The default is to avoid using acknowledgments to reduce network traffic.
- gws—Gateways: Contain an array of information objects from individual GWs, especially information about the parameters of the received signal, timestamp, identifier, and location of the GW.
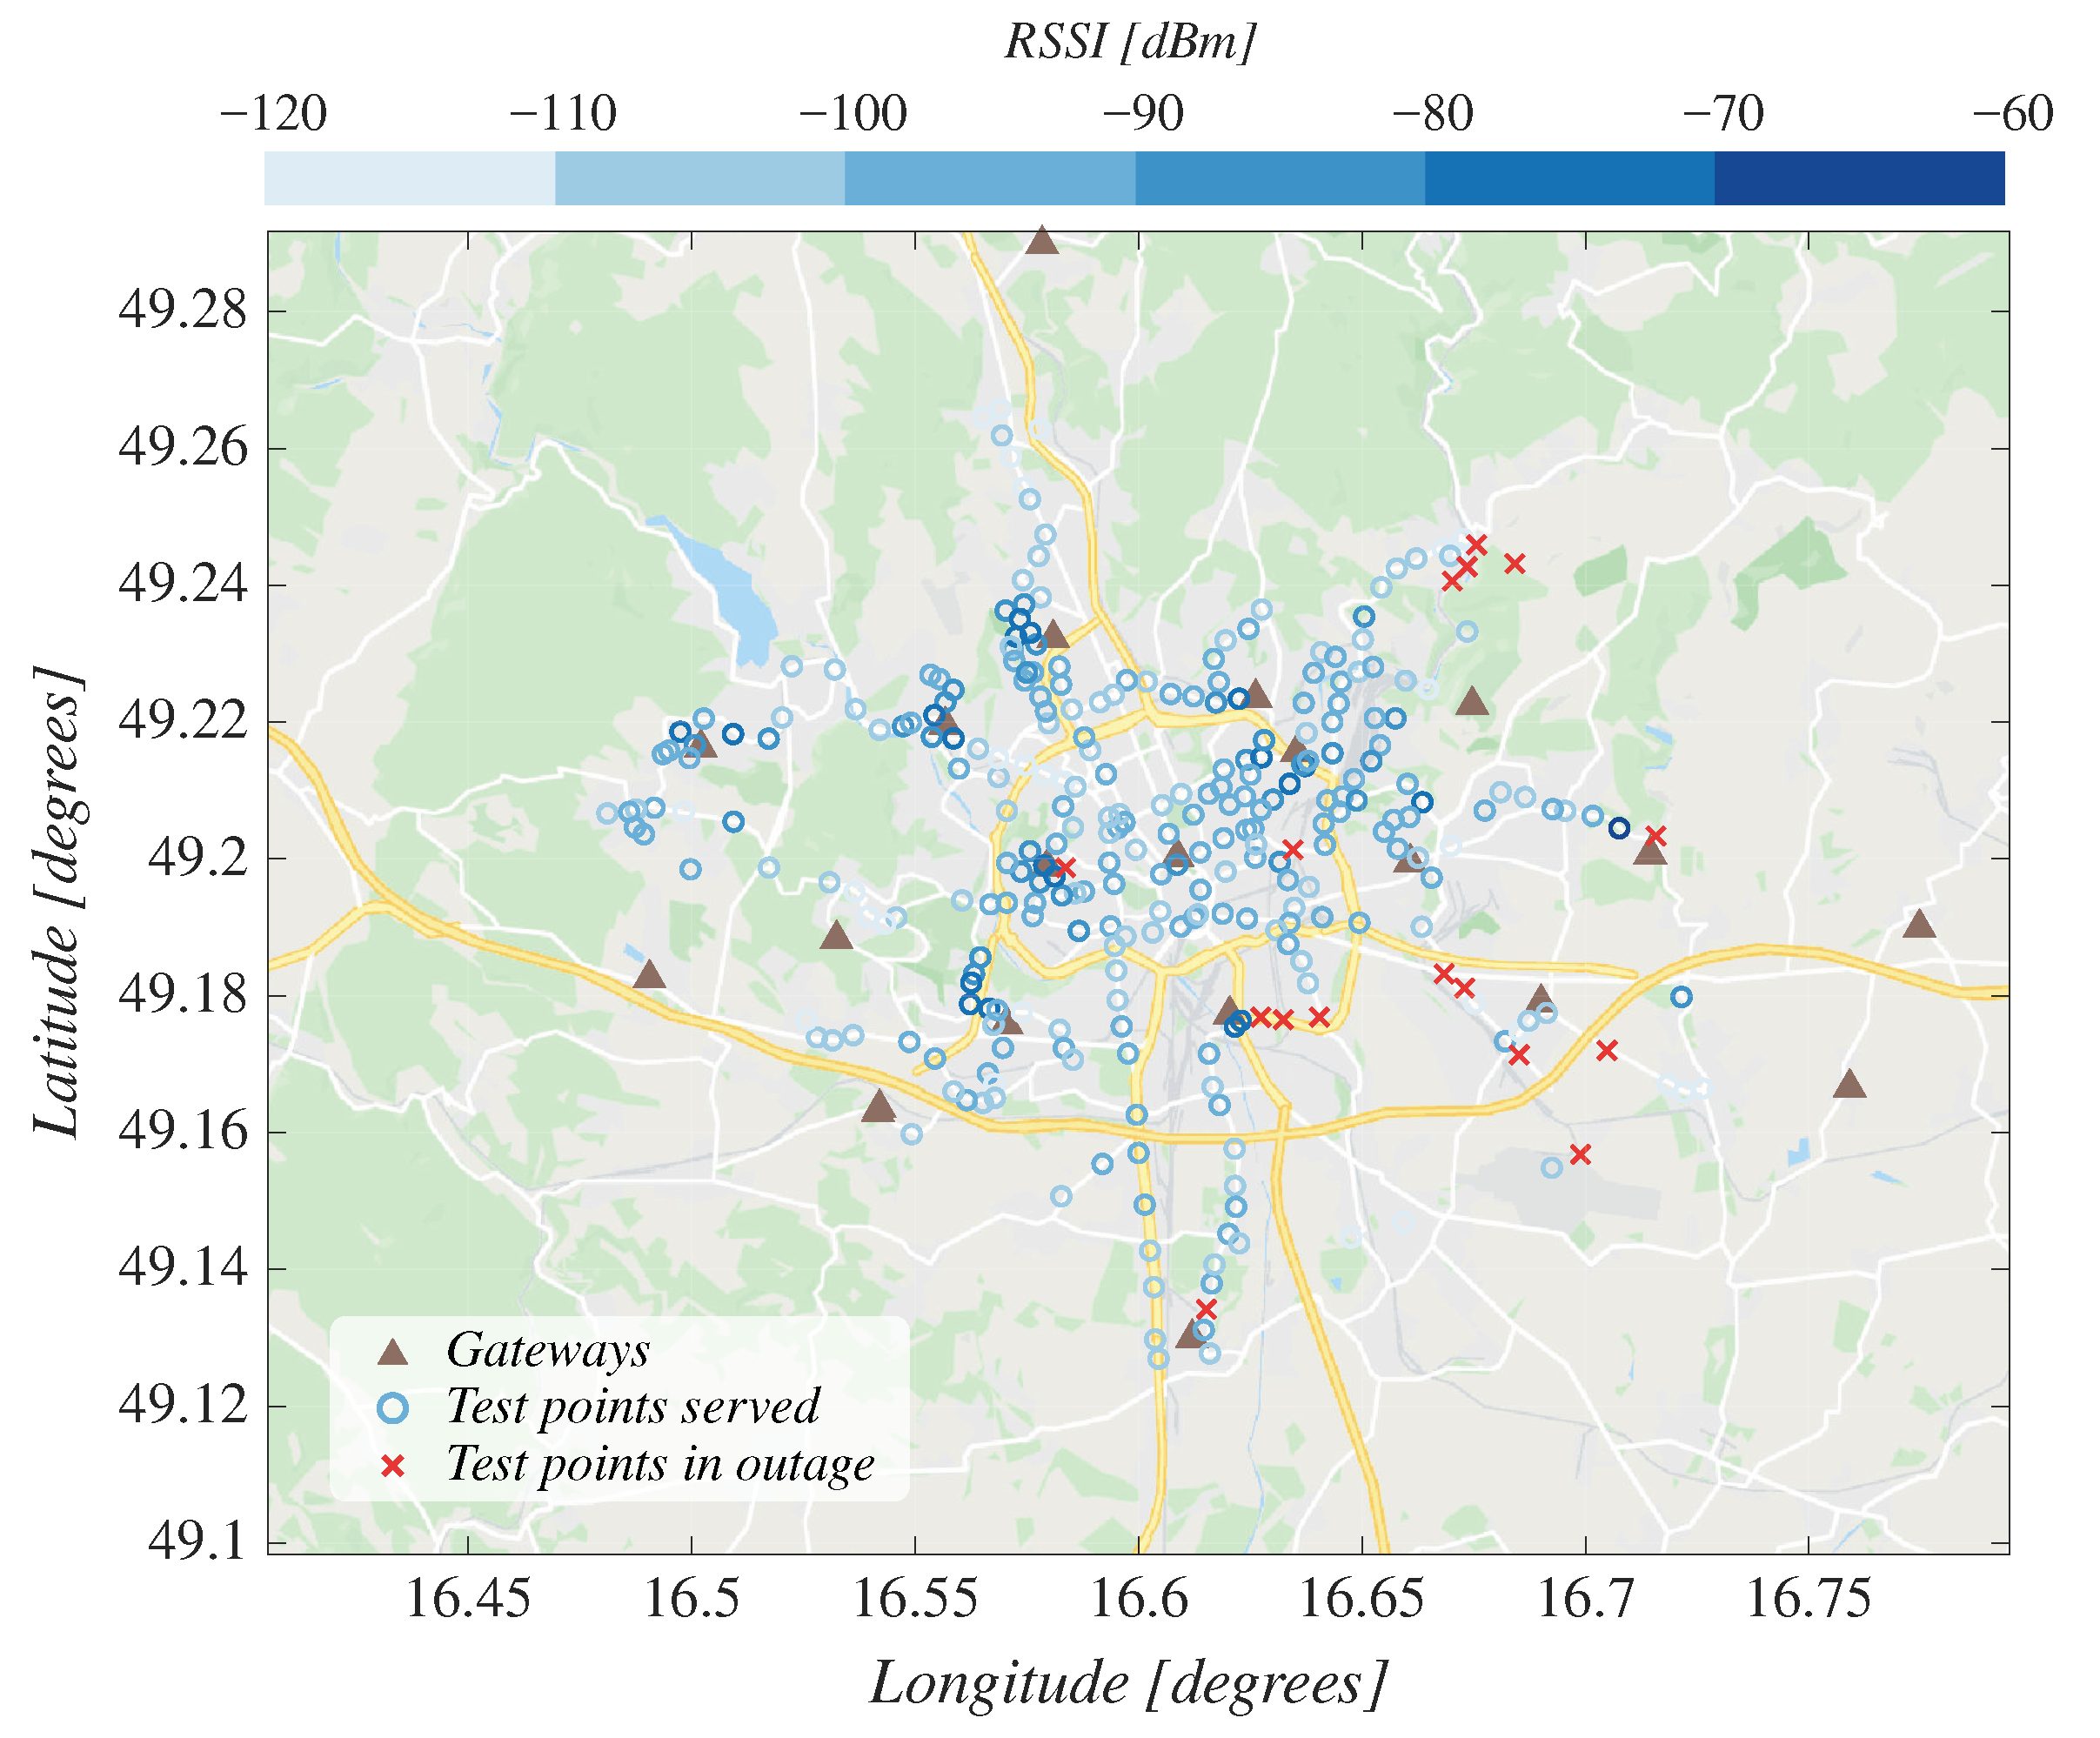
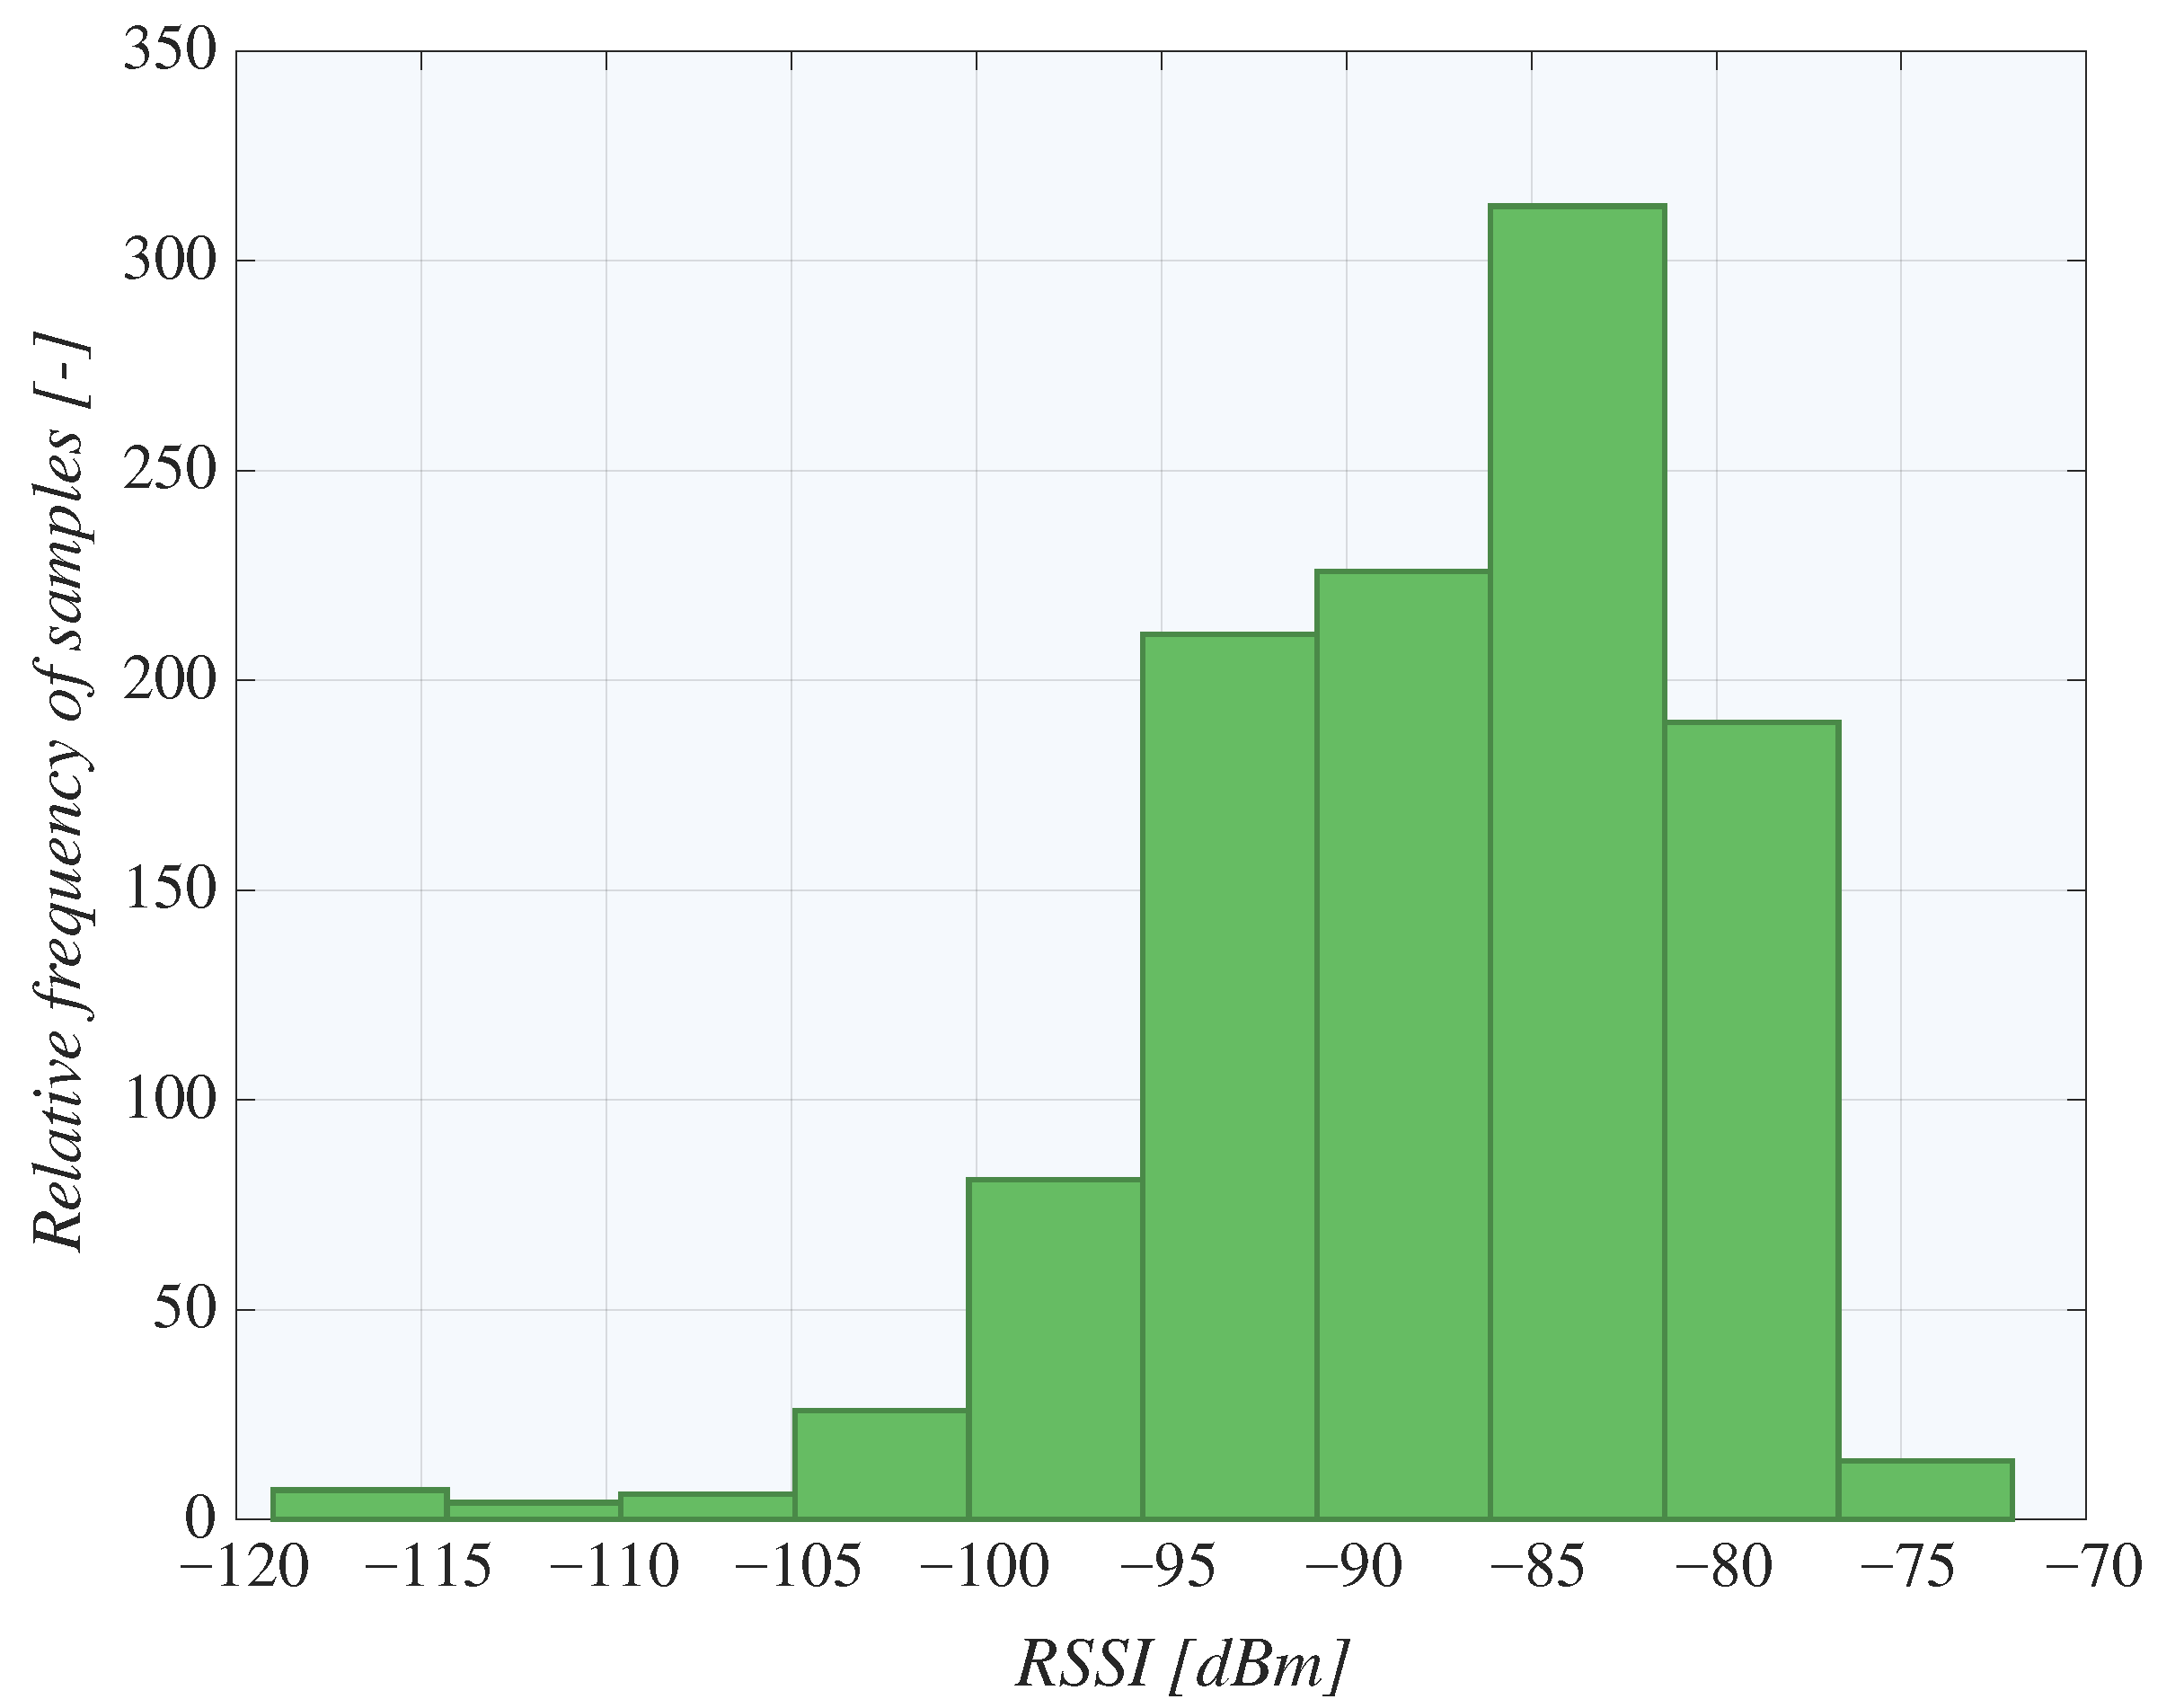
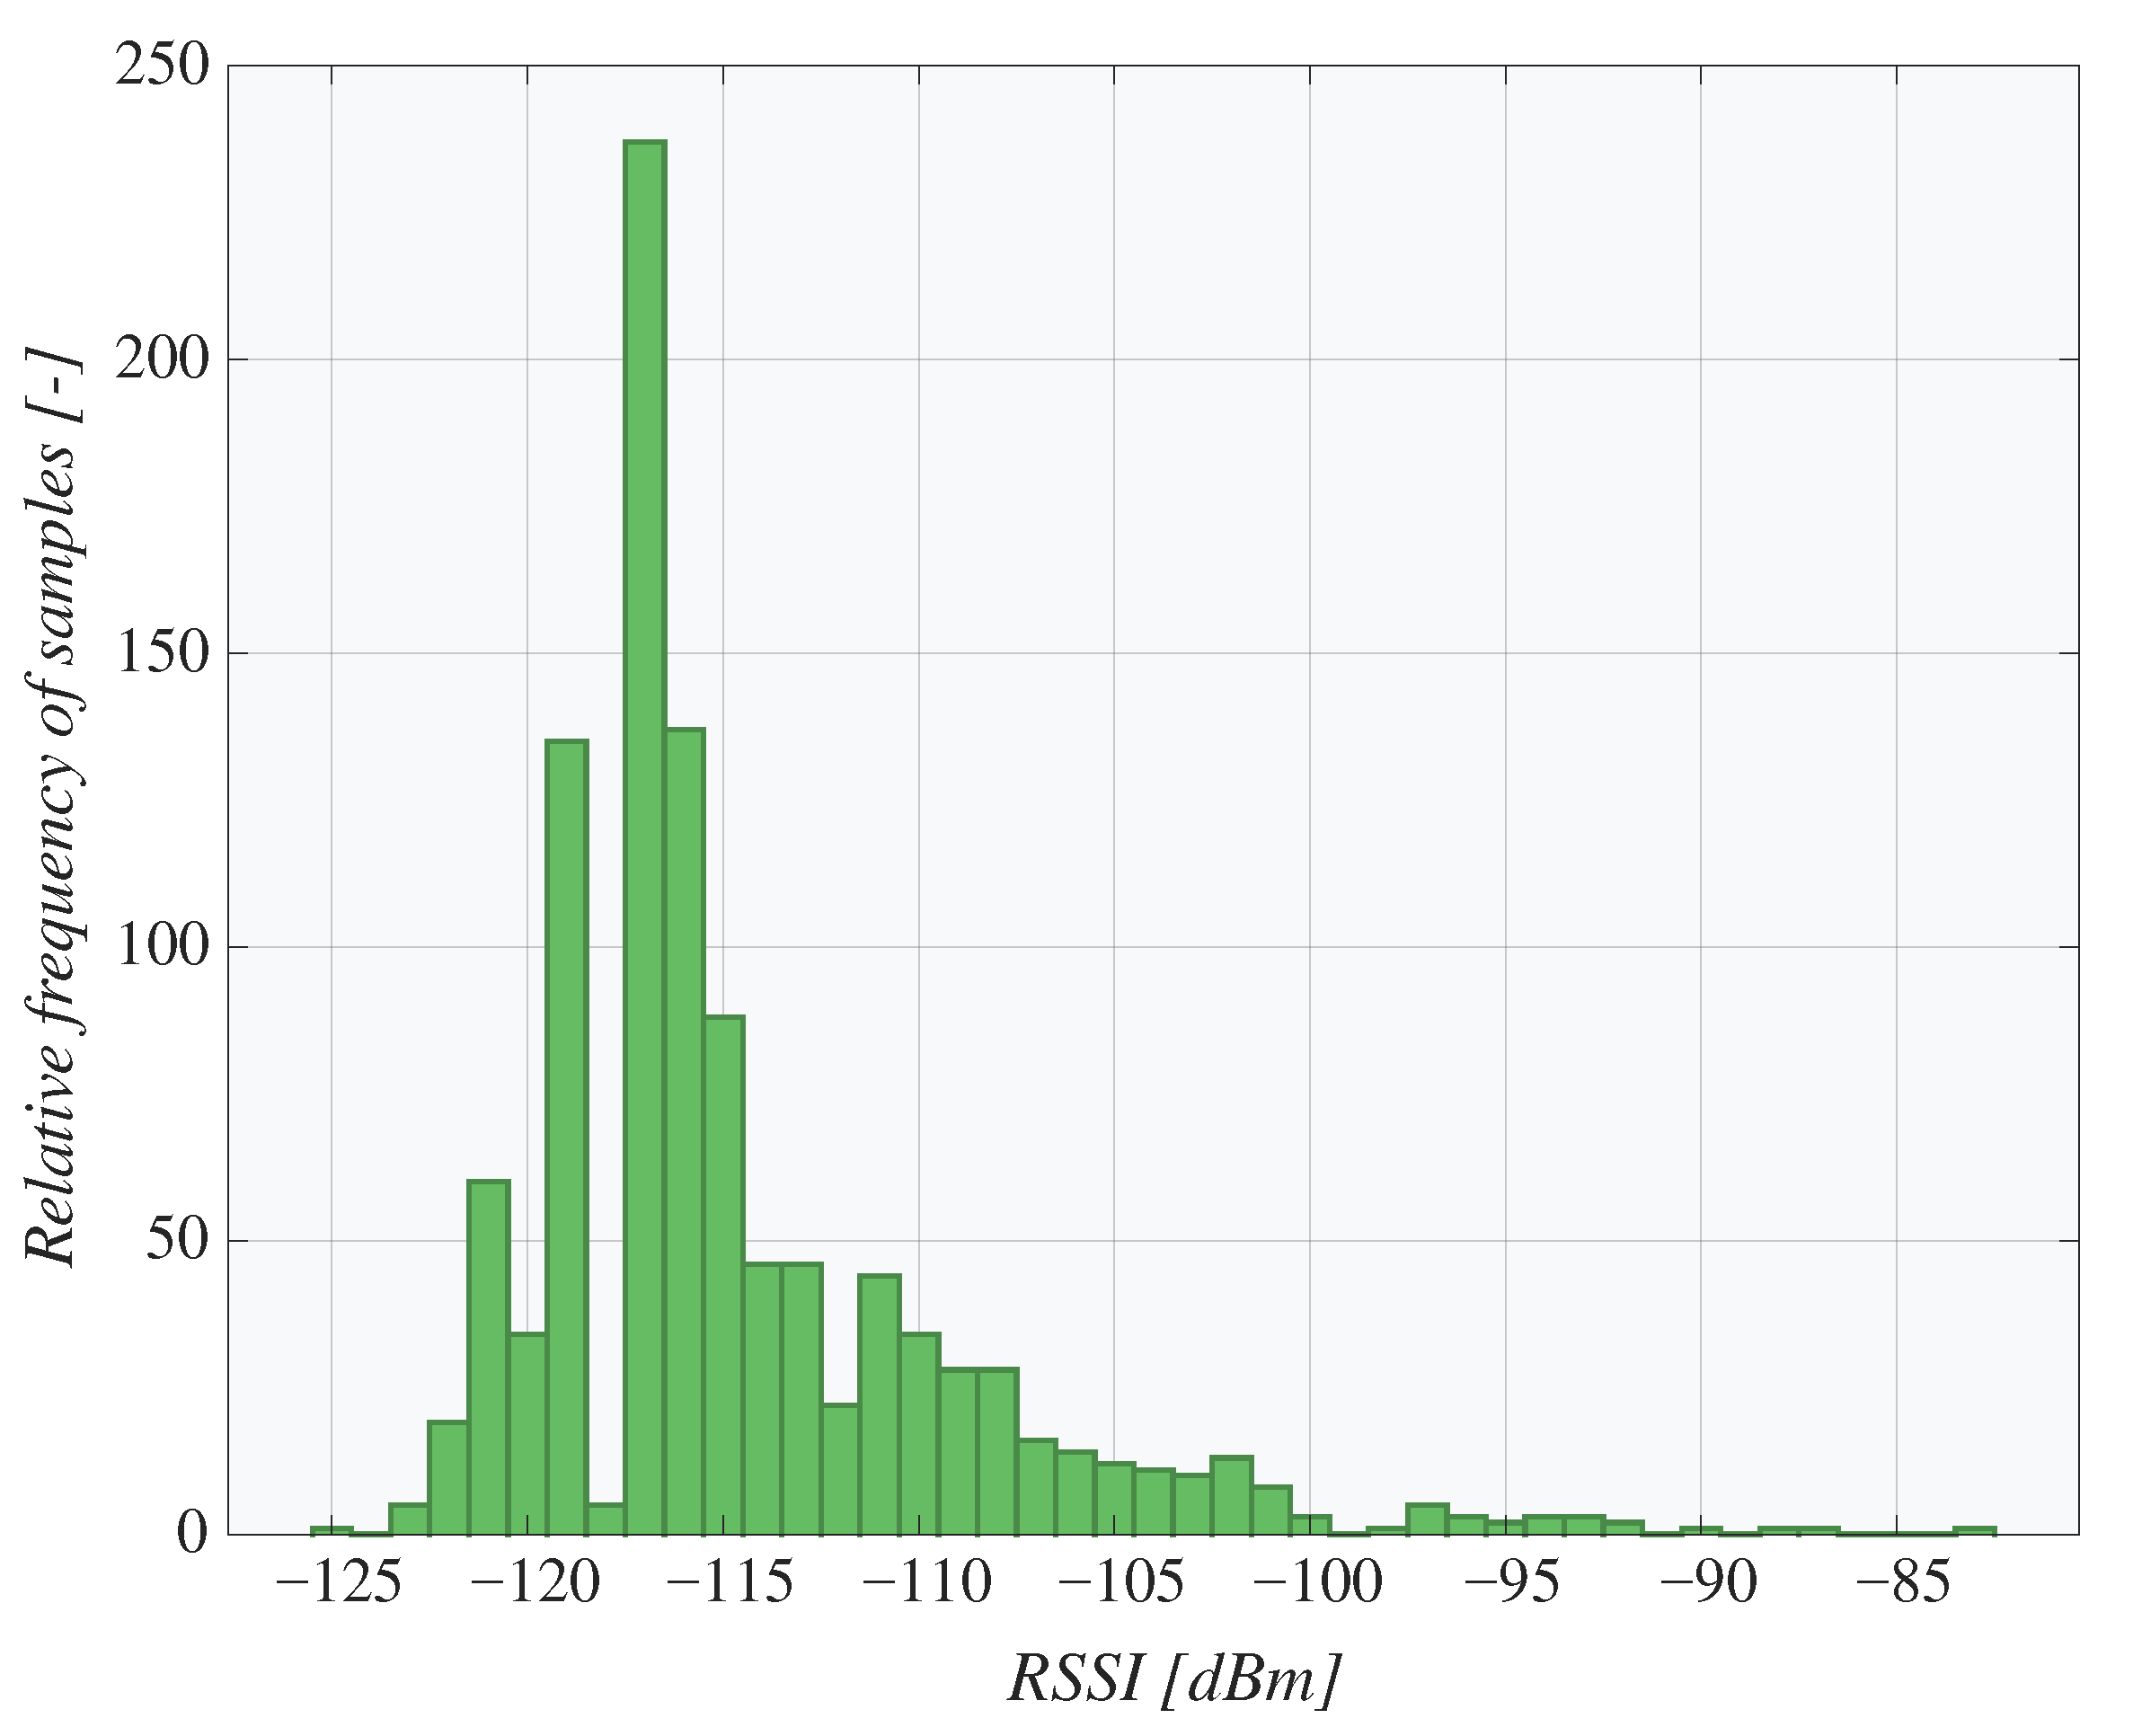
- rssi—Received Signal Strength Indicator: The received signal level on the GW, expressed in dBm. The threshold value of the Semtech SX1301 receiver is −142 dBm [44].
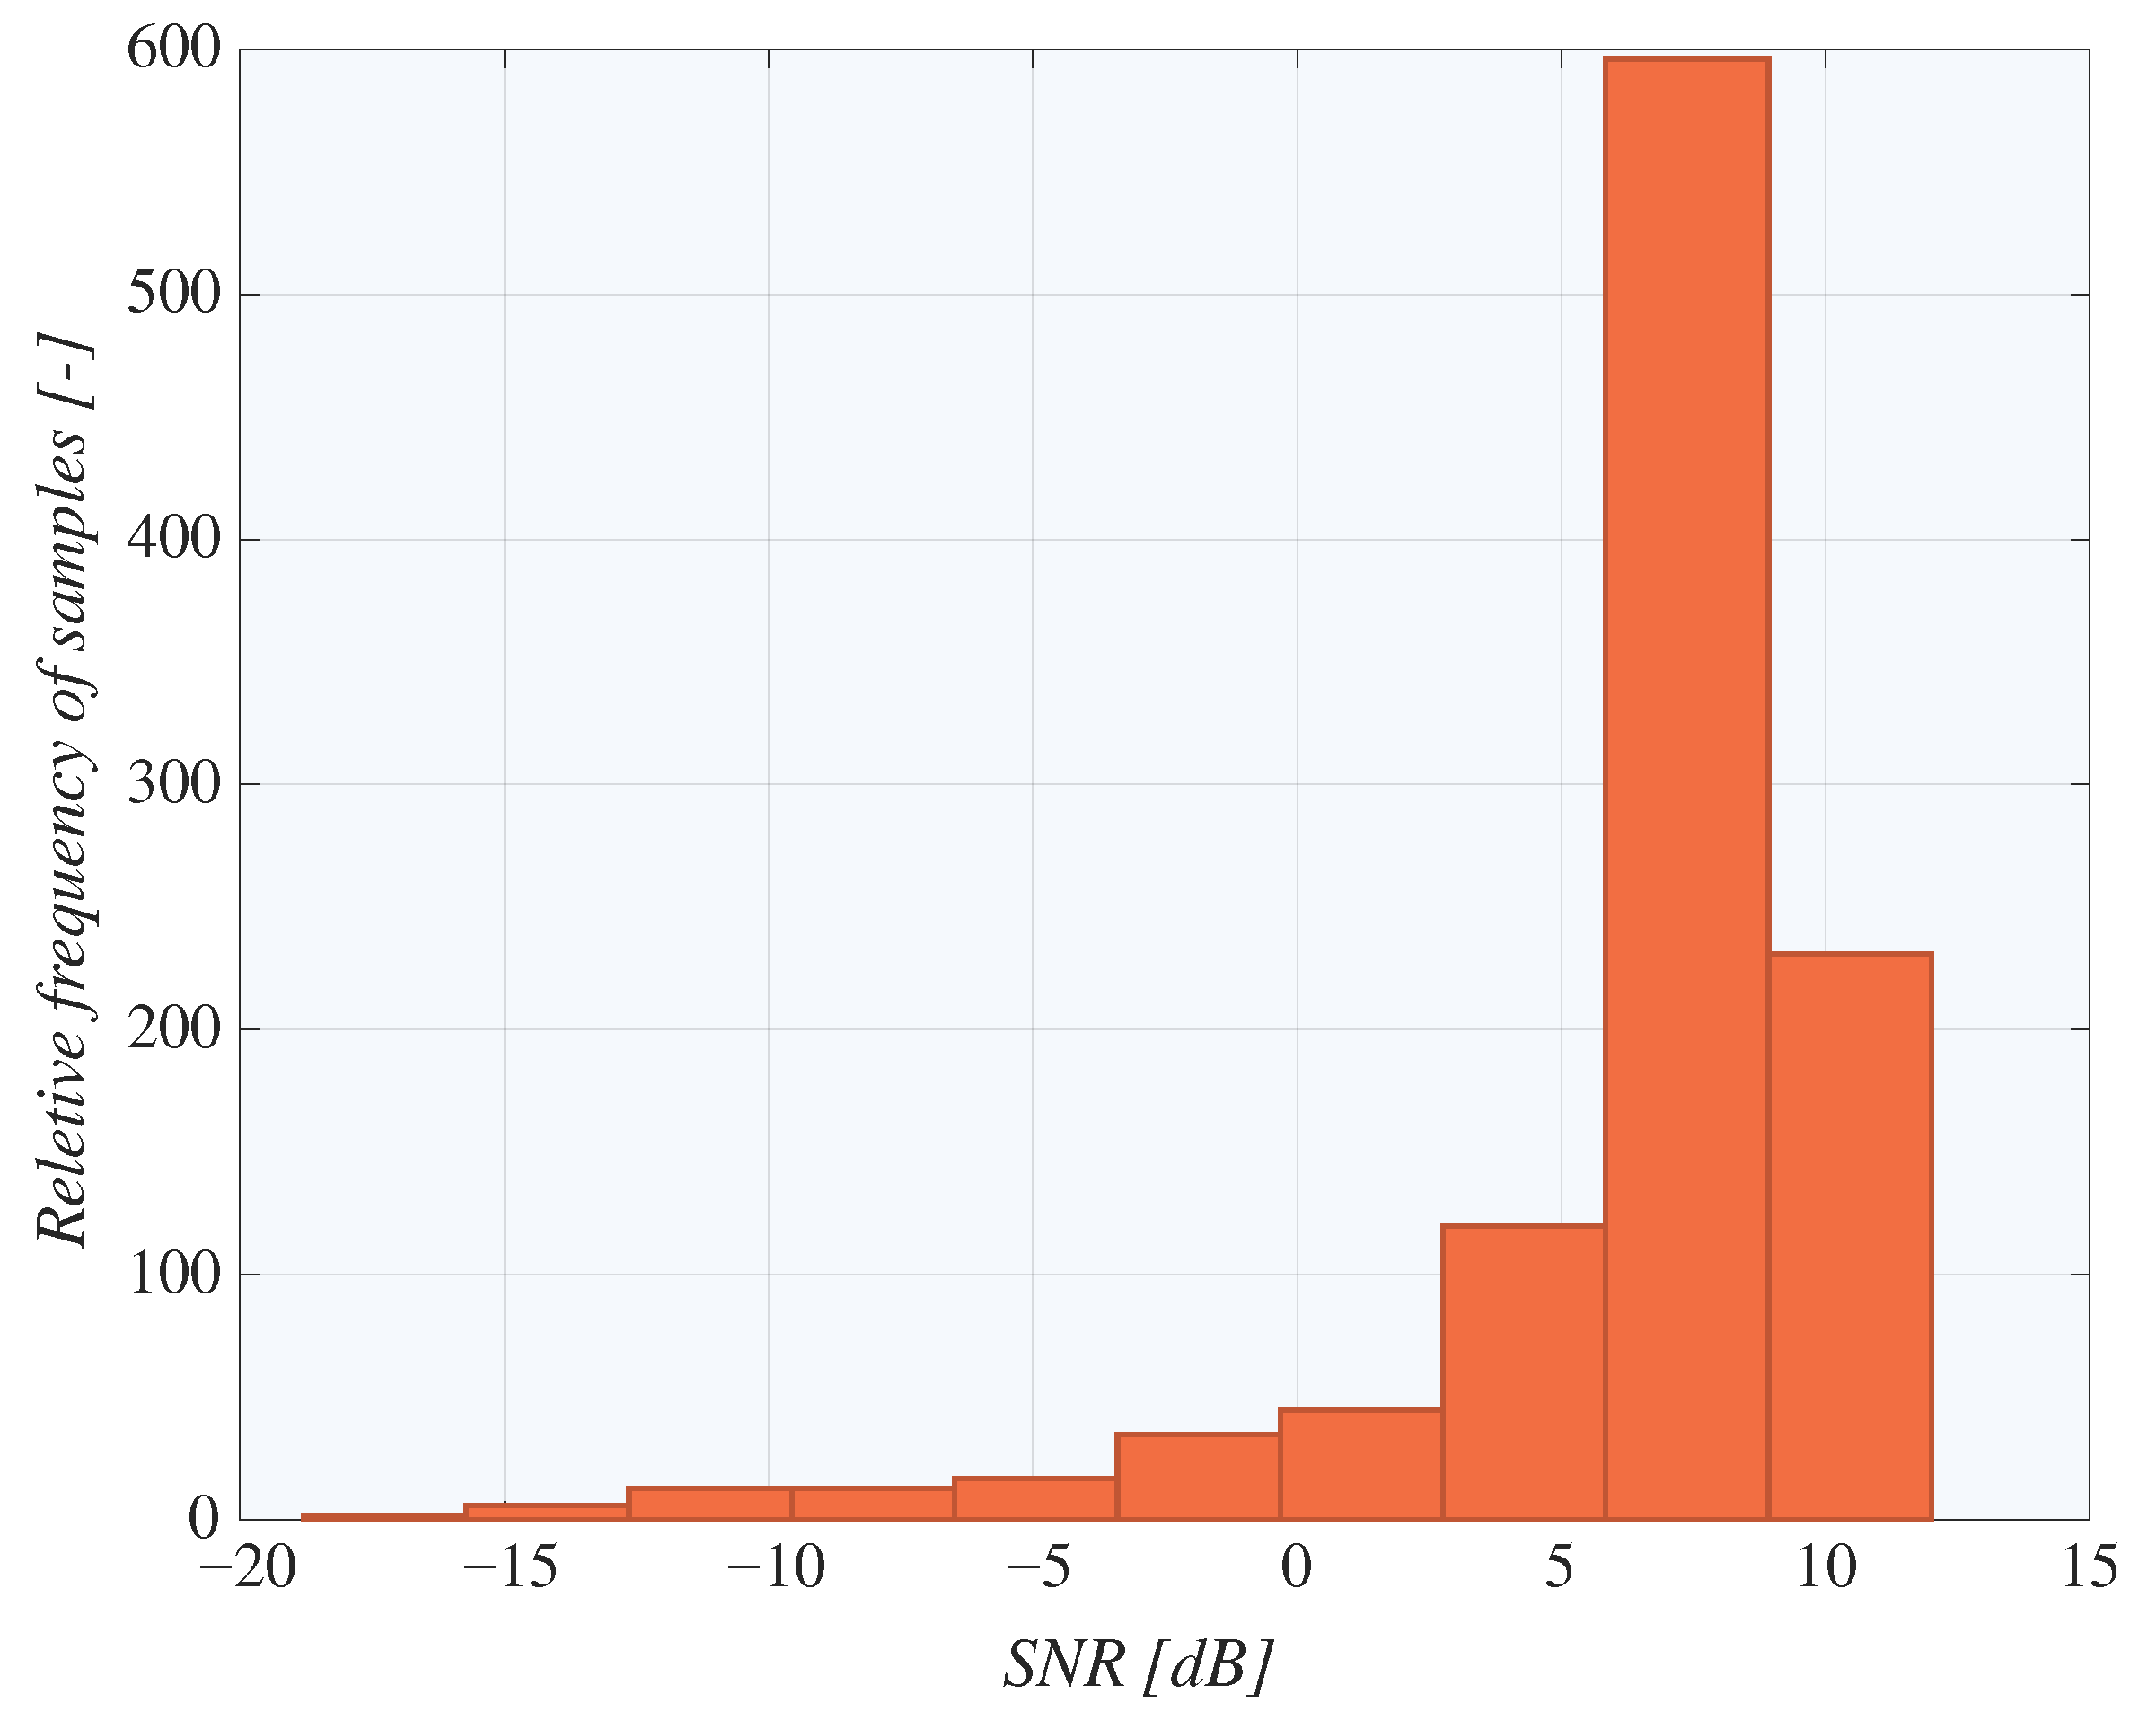
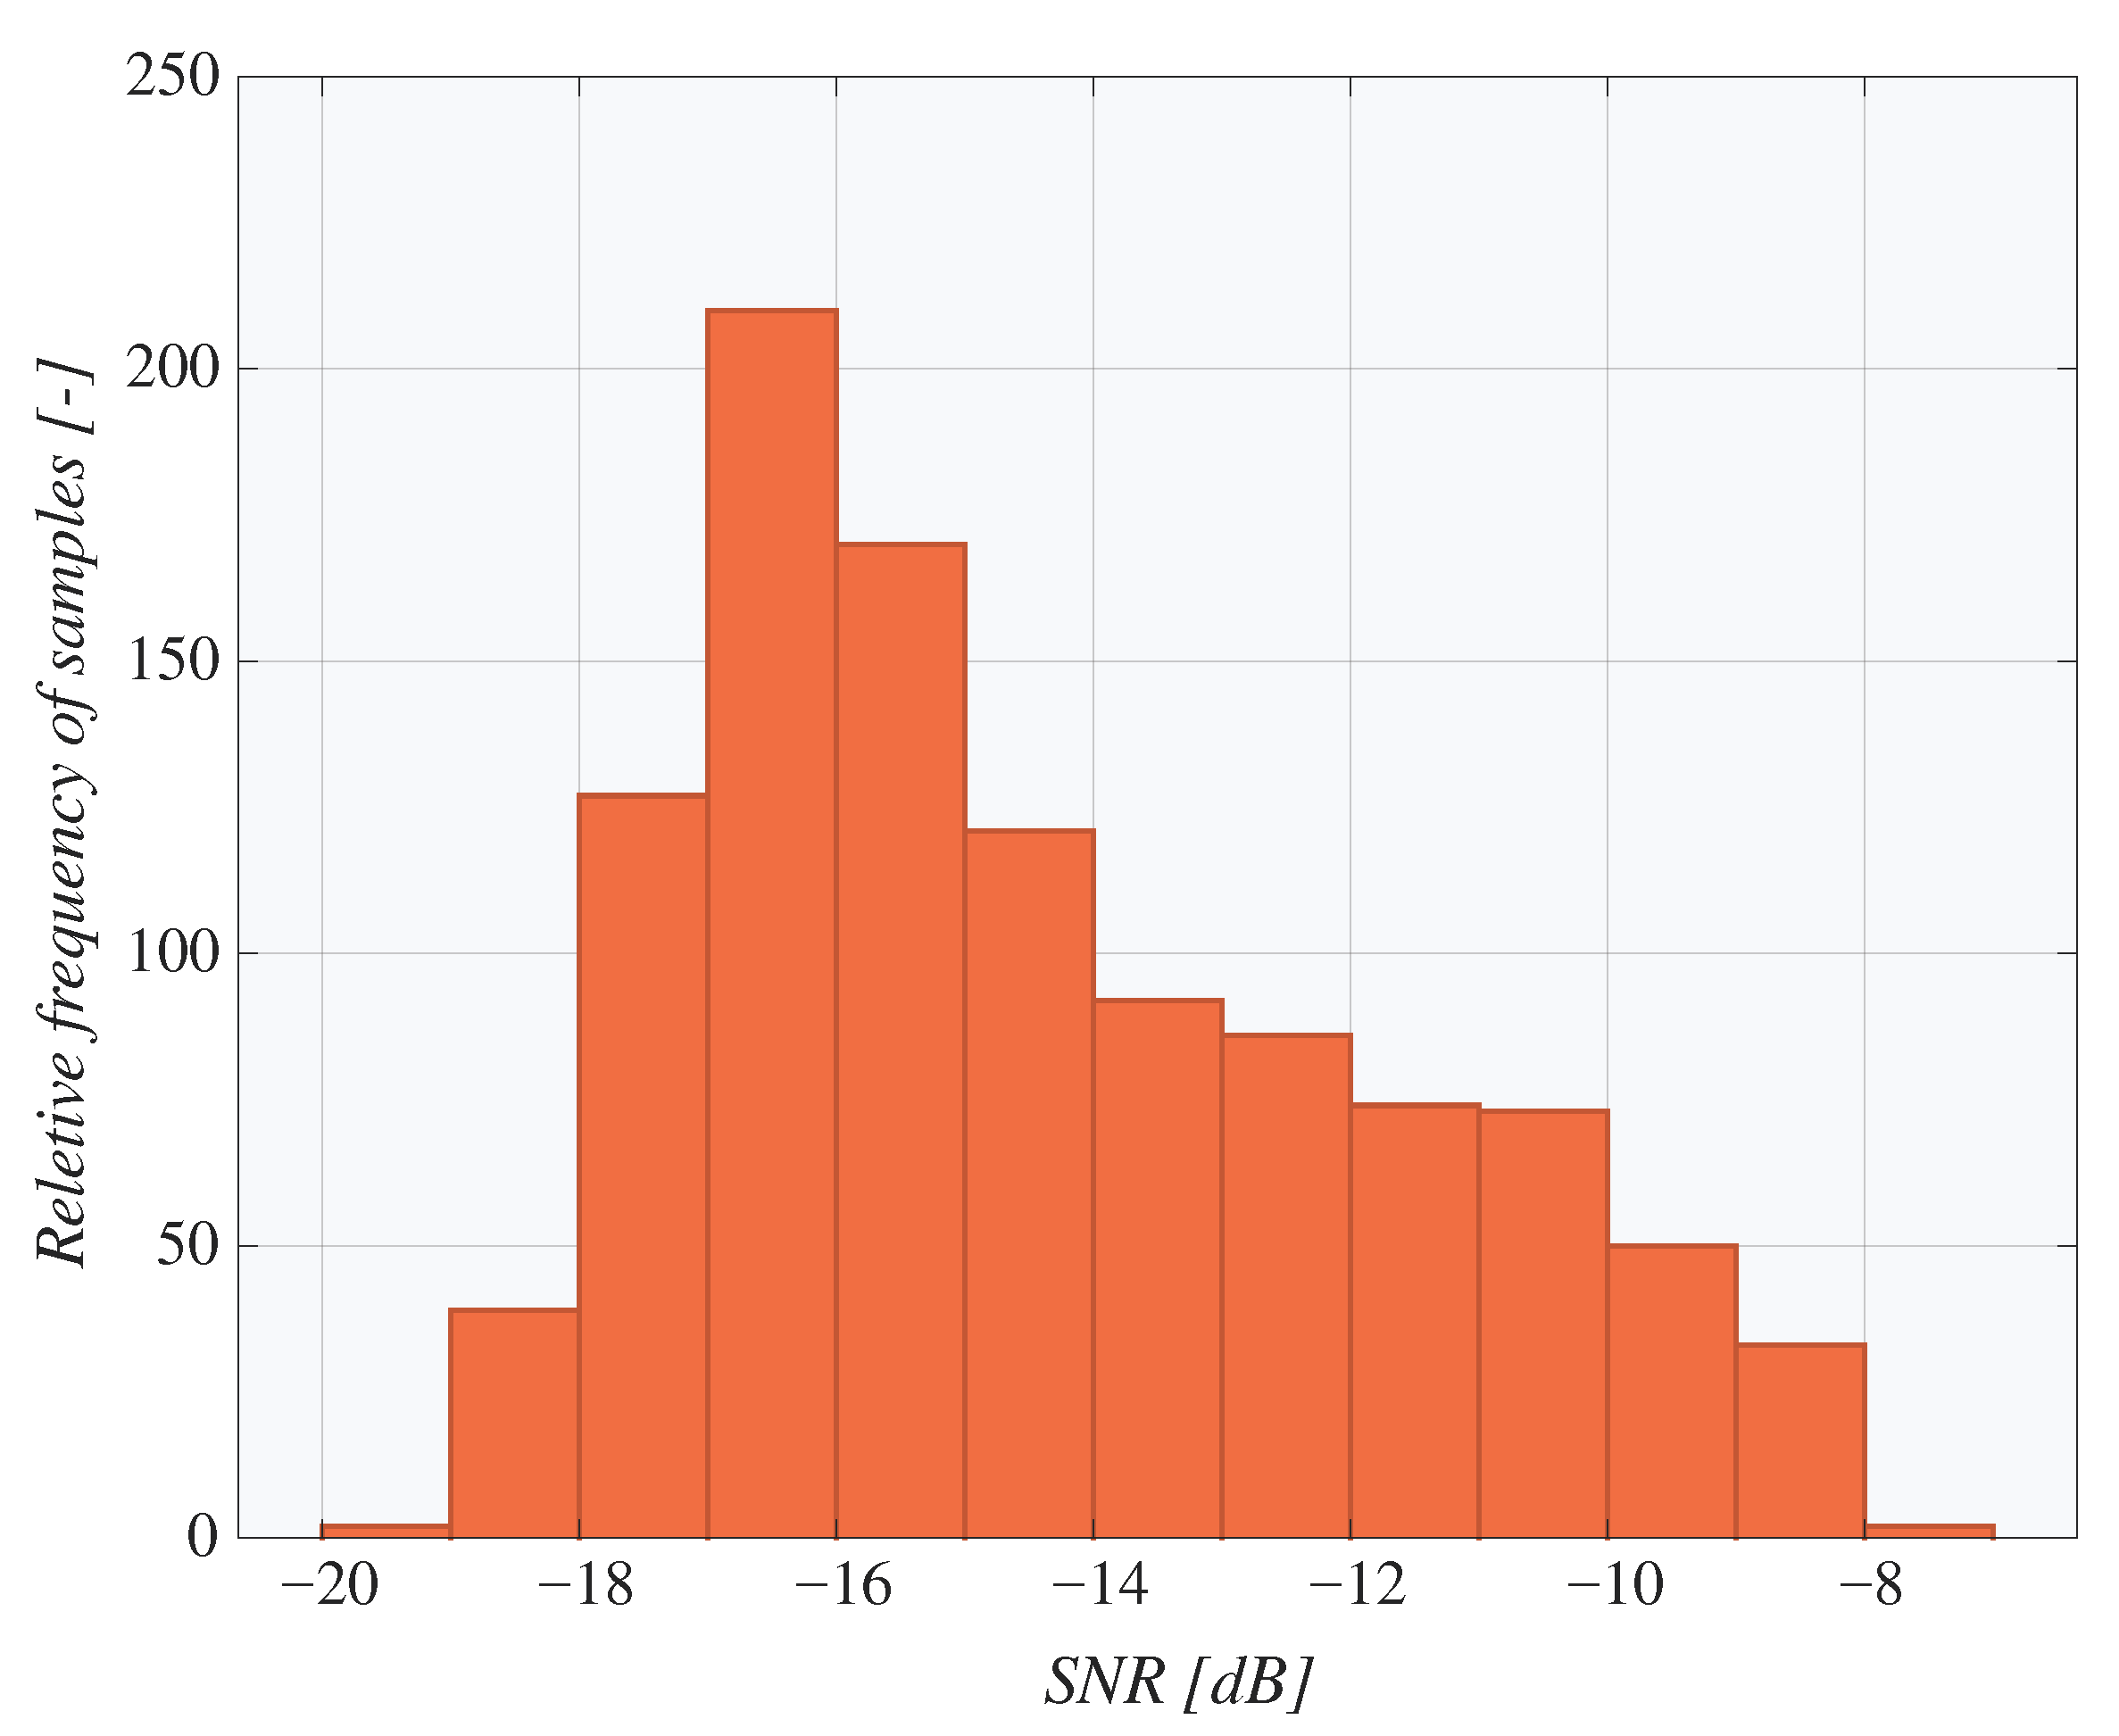
- snr—Signal-to-Noise Ratio: This parameter gives the ratio between the received power signal and the noise floor power level in dB. If the SNR is greater than 0, the received signal level is higher than the noise level.
- ts—Timestamp: The time of the received message in milliseconds since the Unix era (1 January 1970).
- tmms—Time in ms: GPS time in milliseconds since 6 February 1980. The GW must have GPS connectivity.
- time—UTC of the received message, with microsecond precision in the ISO 8601 format.
- gweui—GW extended unique identifier: The 64-bit number in a hexadecimal format specific for each GW.
- lat—Latitude: GW GPS latitude parameter in decimal degrees. The GW must have GPS connectivity.
- lon—Longitude: GW GPS longitude parameter in decimal degrees. The GW must have GPS connectivity.
- bat—Battery status of the ED 8-bit integer value (0—external power supply, 255—battery status is unknown, 1–254—correspond to battery status 0–100%).
- data—The field contains HEX data, which is unique for the LoRaWAN device in question. It consists of information related to temperature, position, battery level, etc. In the case of our device, it represents our unique data format, which is specifically designed for the purposes of our measurements.
- device_Lat—Latitude of the measurement point gathered from the GPS.
- device_Lon—Longitude of the measurement point gathered from the GPS.

4. Measurement Details
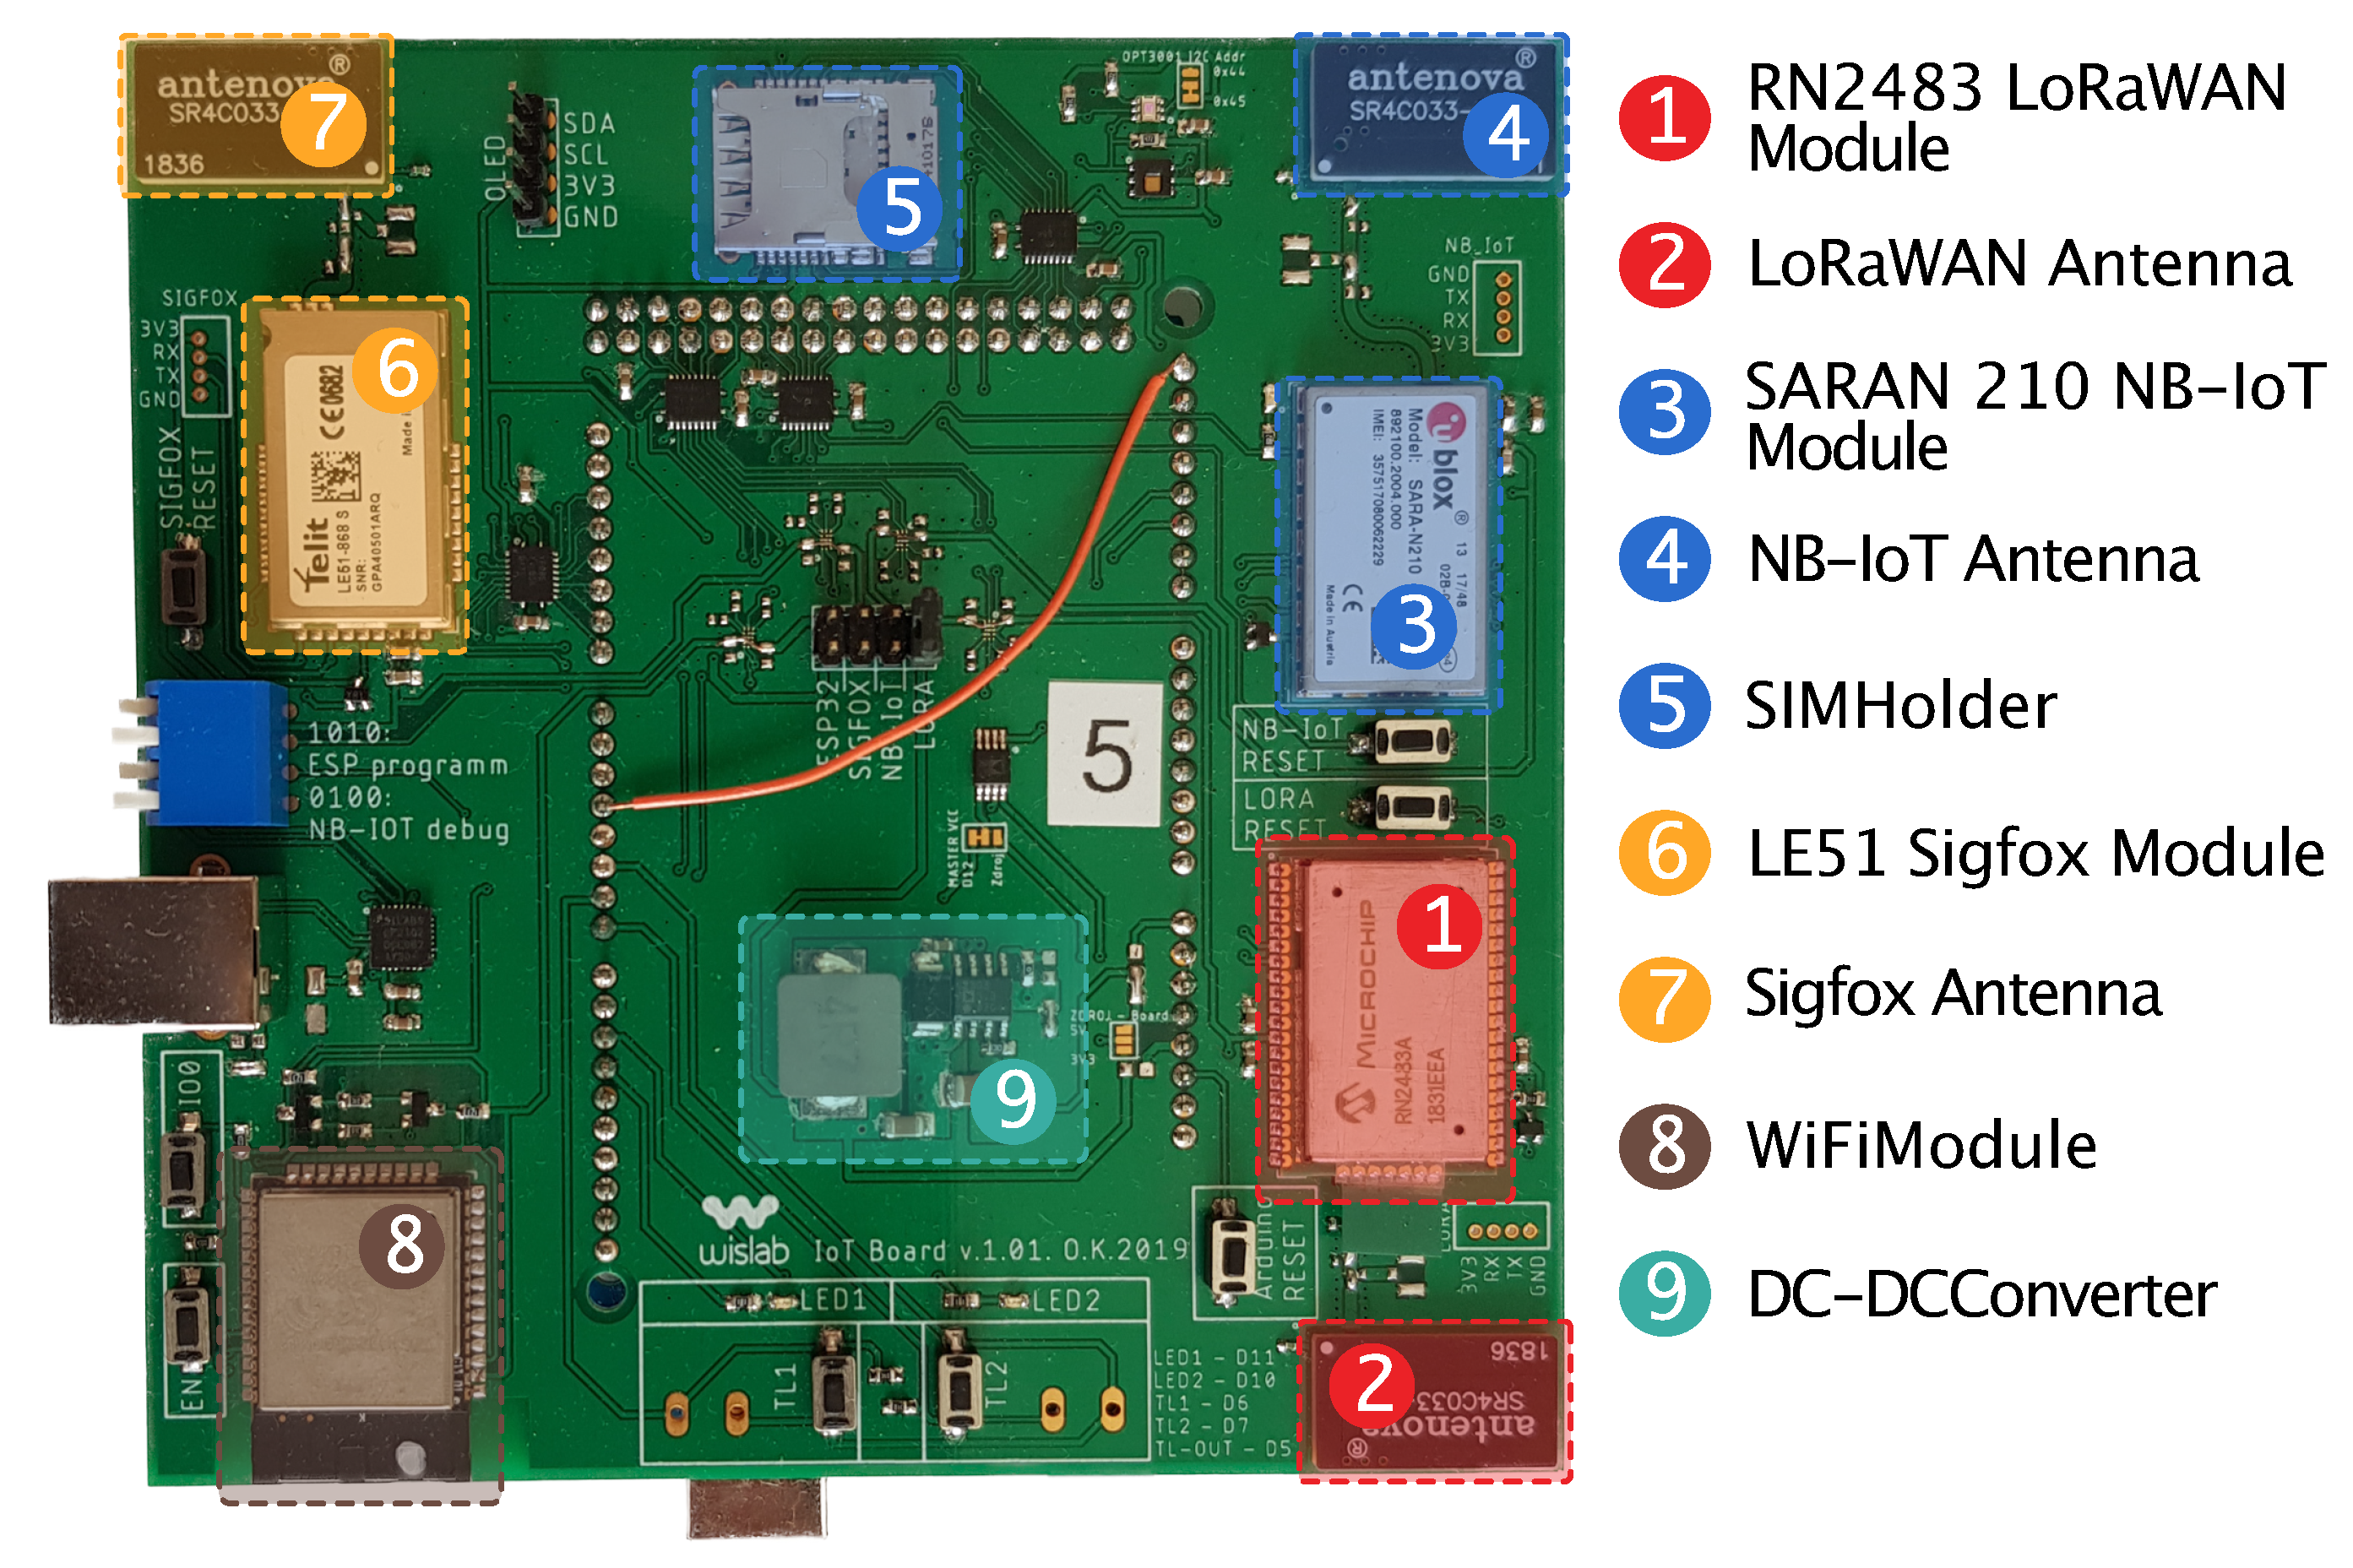
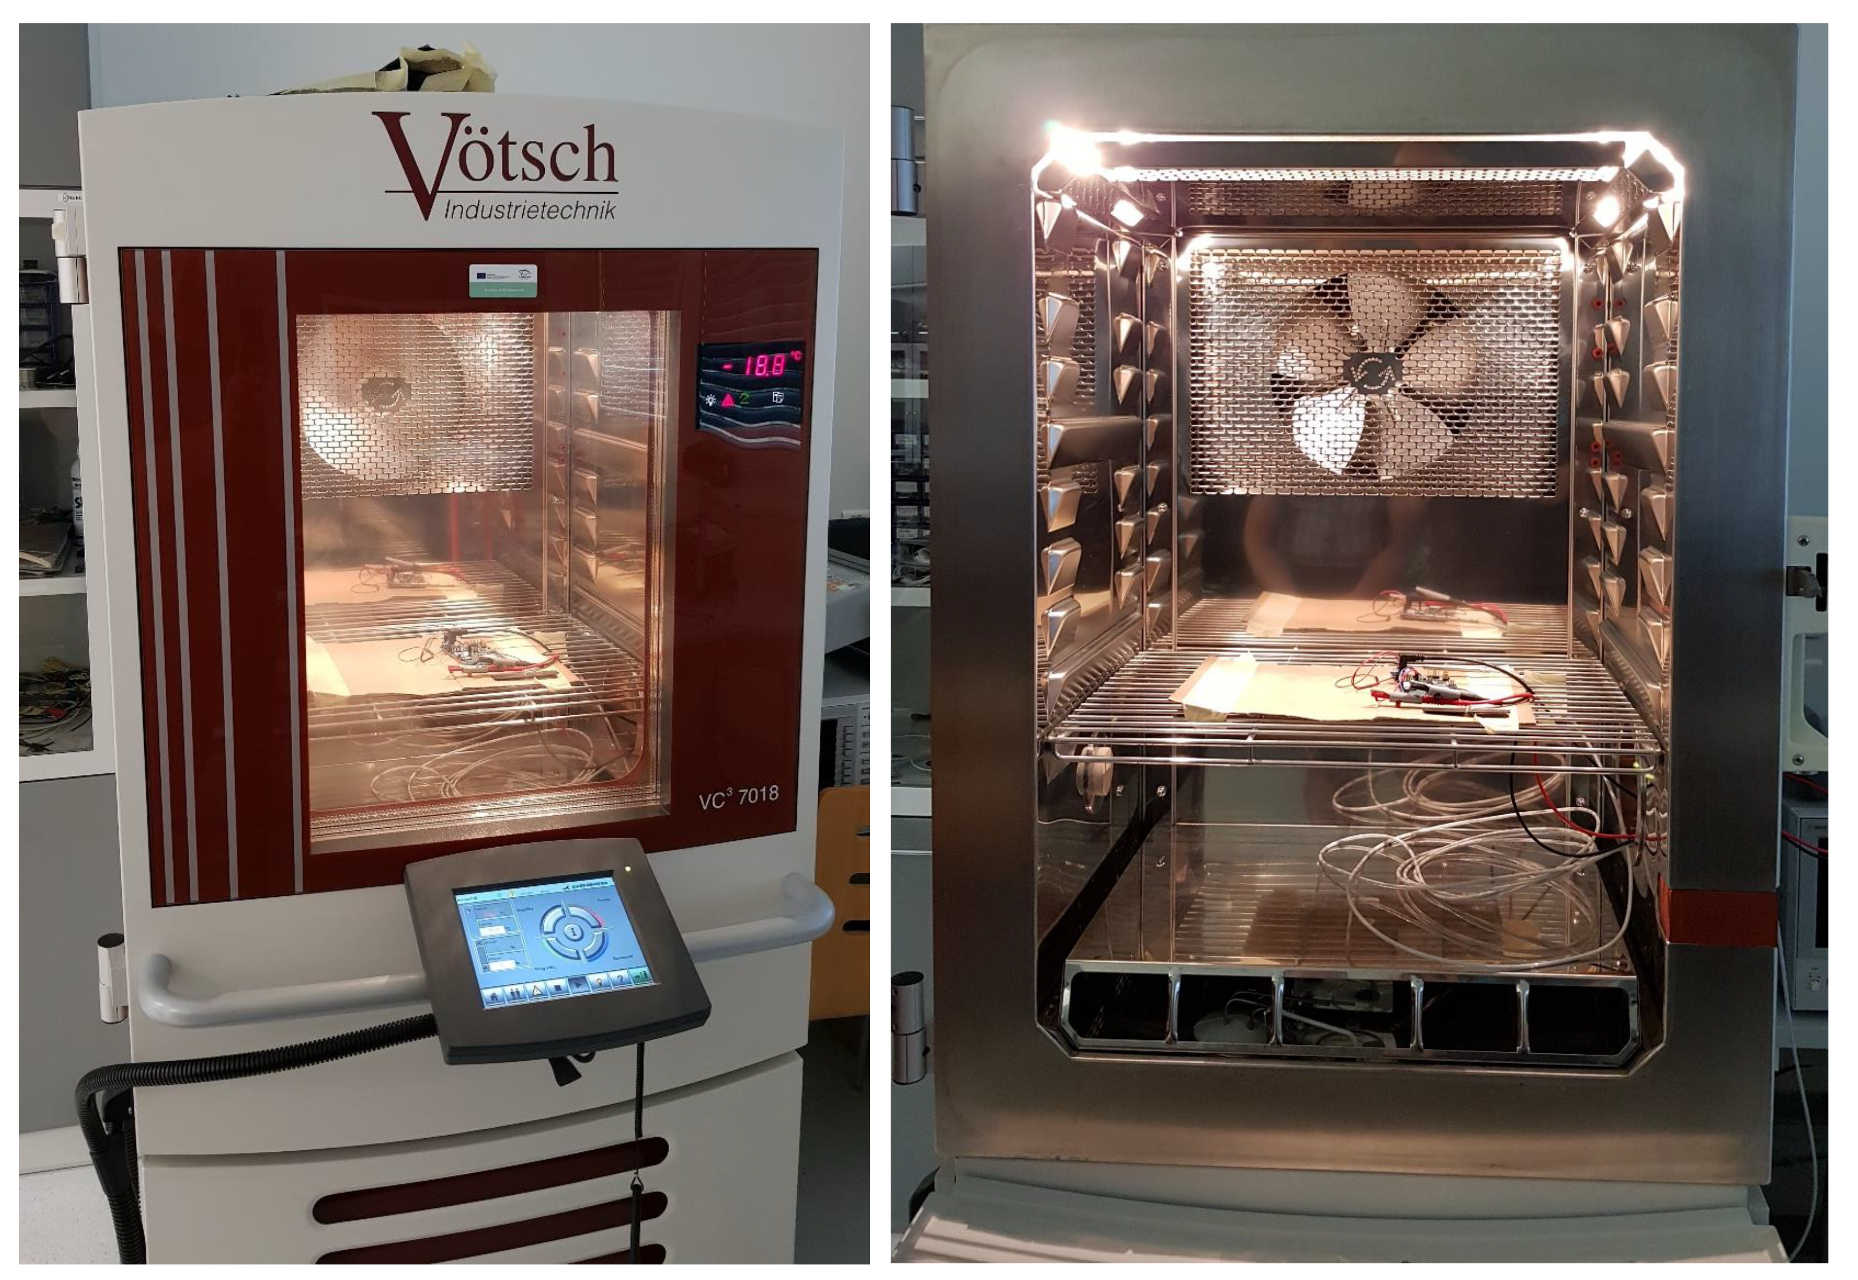
4.1. Evaluation Preparation
4.2. City-Scale Measurement Campaign
4.3. Long-Term Measurement Campaign
5. Measurements Results
5.1. City-Scale Measurements Results
5.2. Long-Term Measurement Results
6. Data Descriptor Summary
Author Contributions
Funding
Informed Consent Statement
Data Availability Statement
Conflicts of Interest
Abbreviations
| ADR | Adaptive Data Rate |
| API | Application Programming Interface |
| AR | Augmented Reality |
| BLE | Bluetooth Low Energy |
| CRA | Czechia national LoRaWAN provider |
| CSS | Chirp Spread Spectrum |
| DL | Downlink |
| ED | End Device |
| EIRP | Effective Isotropic Radiated Power |
| EIRP | Effective Isotropic Radiated Power |
| ERP | Effective Radiated Power |
| FSK | Frequency-Shift Keying |
| GFSK | Gaussian Frequency-Shift Keying |
| GW | Gateway |
| H2M | Human-to-Machine |
| IEC | International Electrotechnical Commission |
| IEEE | Institute of Electrical and Electronics Engineers |
| IoT | Internet of Things |
| ISM | Industrial, scientific, and medical |
| LPWAN | Low-Power Wide-Area Network |
| LTE | Long-Term Evolution |
| M2M | Machine-to-Machine |
| MCL | Maximum Coupling Loss |
| mMTC | massive Machine-Type Communications |
| MR | Mixed Reality |
| NB-IoT | Narrowband Internet of Things |
| NFC | Near-Field-Communication |
| NS | Network Server |
| RF | Radio Frequency |
| RFID | Radio-Frequency Identification |
| RSSI | Received Signal Strength Indicator |
| RW | Receive Window |
| SF | Spreading Factor |
| SNR | Signal-to-Noise Ratio |
| UL | Uplink |
| VR | Virtual Reality |
| WiFi | Wireless Fidelity |
References
- Silverio-Fernández, M.; Renukappa, S.; Suresh, S. What is a Smart Device?—A Conceptualisation within the Paradigm of the Internet of Things. Vis. Eng. 2018, 6, 3. [Google Scholar] [CrossRef] [Green Version]
- Stojkoska, B.L.R.; Trivodaliev, K.V. A Review of Internet of Things for Smart Home: Challenges and Solutions. J. Clean. Prod. 2017, 140, 1454–1464. [Google Scholar] [CrossRef]
- McKinsey and Company. Growing Opportunities in the Internet of Things. Available online: https://www.mckinsey.com/industries/private-equity-and-principal-investors/our-insights/growing-opportunities-in-the-internet-of-things# (accessed on 30 May 2021).
- Grand View Research. IoT Market Analysis By Component (Devices, Connectivity, IT Services, Platforms), By Application (Consumer Electronics, Retail, Manufacturing, Transportation, Healthcare) And Segment Forecasts To 2022. Available online: https://www.grandviewresearch.com/industry-analysis/iot-market (accessed on 30 May 2021).
- Mozny, R.; Masek, P.; Stusek, M.; Mikulasek, M.; Ometov, A.; Hosek, J. Pitfalls of LPWA Power Consumption: Hands-On Design of Current Probe. In Proceedings of the 12th International Congress on Ultra Modern Telecommunications and Control Systems and Workshops (ICUMT), Online, 5–7 October 2020; pp. 13–19. [Google Scholar]
- Ometov, A.; Daneshfar, N.; Hazmi, A.; Andreev, S.; Carpio, L.F.D.; Amin, P.; Torsner, J.; Koucheryavy, Y.; Valkama, M. System-Level Analysis of IEEE 802.11ah Technology for Unsaturated MTC Traffic. Int. J. Sens. Netw. 2018, 26, 269–282. [Google Scholar] [CrossRef]
- Solentive. Smart Devices—The Fastest Technology Adoption In History. Radio Versions. 2020. Available online: https://www.solentive.com.au/smart-devices-the-fastest-technology-adoption-in-history/ (accessed on 30 May 2021).
- HelpNetSecurity. Number of Connected Devices Reached 22 Billion, Where is the Revenue? 2019. Available online: https://www.helpnetsecurity.com/2019/05/23/connected-devices-growth/ (accessed on 30 May 2021).
- Top 10 Companies in Wearable Devices Market. Meticulous Research. 2019. Available online: https://meticulousblog.org/top-10-companies-in-wearable-devices-market/ (accessed on 30 May 2021).
- Ometov, A.; Shubina, V.; Klus, L.; Skibińska, J.; Saafi, S.; Pascacio, P.; Flueratoru, L.; Gaibor, D.Q.; Chukhno, N.; Chukhno, O.; et al. A Survey on Wearable Technology: History, State-of-the-Art and Current Challenges. Comput. Netw. 2021, 193, 108074. [Google Scholar] [CrossRef]
- Ometov, A.; Kozyrev, D.; Rykov, V.; Andreev, S.; Gaidamaka, Y.; Koucheryavy, Y. Reliability-Centric Analysis of Offloaded Computation in Cooperative Wearable Applications. Wirel. Commun. Mob. Comput. 2017, 2017, 9625687. [Google Scholar] [CrossRef] [Green Version]
- Svertoka, E.; Rusu-Casandra, A.; Marghescu, I. State-of-the-Art of Industrial Wearables: A Systematic Review. In Proceedings of the 13th International Conference on Communications (COMM), Bucharest, Romania, 18–20 June 2020; pp. 411–415. [Google Scholar]
- Wen, S.; Heidari, H.; Vilouras, A.; Dahiya, R. A Wearable Fabric-based RFID Skin Temperature Monitoring Patch. IEEE Sens. 2016, 1–3. [Google Scholar] [CrossRef] [Green Version]
- Ghamari, M.; Arora, H.; Sherratt, R.S.; Harwin, W. Comparison of Low-Power Wireless Communication Technologies for Wearable Health-Monitoring Applications. In Proceedings of the International Conference on Computer, Communications, and Control Technology (I4CT), Kuching, Malaysia, 21–23 April 2015; pp. 1–6. [Google Scholar] [CrossRef]
- Alliance, W. The Benefit of Wi-Fi Connectivity in Wearable Devices. Available online: https://www.wi-fi.org/ko/beacon/jay-white/the-benefit-of-wi-fi-connectivity-in-wearable-devices (accessed on 30 May 2021).
- Mozny, R.; Masek, P.; Stusek, M.; Zeman, K.; Ometov, A.; Hosek, J. On the Performance of Narrow-Band Internet of Things (NB-IoT) for Delay-Tolerant Services. In Proceedings of the 42nd International Conference on Telecommunications and Signal Processing (TSP), Budapest, Hungary, 1–3 July 2019; pp. 637–642. [Google Scholar]
- Sun, H.; Zhang, Z.; Hu, R.Q.; Qian, Y. Wearable Communications in 5G: Challenges and Enabling Technologies. IEEE Veh. Technol. Mag. 2018, 13, 100–109. [Google Scholar] [CrossRef]
- LPWAN Revenue Forecast, 2017 to 2023. 2017. Available online: https://shop.maravedis-bwa.com/products/lpwan-revenue-forecast-2017-to-2023 (accessed on 30 May 2021).
- LoRa and Sigfox get Five-Year Boost with LTE-M and NB-IoT Failures. Enterprise IoT Insights. 2019. Available online: https://enterpriseiotinsights.com/20190606/channels/news/lora-and-sigfox-get-boost-with-lte-m-nb-iot-failures (accessed on 30 May 2021).
- De Carvalho Silva, J.; Rodrigues, J.J.; Alberti, A.M.; Solic, P.; Aquino, A.L. LoRaWAN—A Low Power WAN Protocol for Internet of Things: A Review and Opportunities. In Proceedings of the 2nd International Multidisciplinary Conference on Computer and Energy Science (SpliTech), Split, Croatia, 12–14 July 2017; pp. 1–6. [Google Scholar]
- Adelantado, F.; Vilajosana, X.; Tuset-Peiro, P.; Martinez, B.; Melia-Segui, J.; Watteyne, T. Understanding the Limits of LoRaWAN. IEEE Commun. Mag. 2017, 55, 34–40. [Google Scholar] [CrossRef] [Green Version]
- Pasolini, G.; Buratti, C.; Feltrin, L.; Zabini, F.; De Castro, C.; Verdone, R.; Andrisano, O. Smart City Pilot Projects Using LoRa and IEEE 802.15.4 Technologies. Sensors 2018, 18, 1118. [Google Scholar] [CrossRef] [PubMed] [Green Version]
- Miles, B.; Bourennane, E.B.; Boucherkha, S.; Chikhi, S. A Study of LoRaWAN Protocol Performance for IoT Applications in Smart Agriculture. Comput. Commun. 2020, 164, 148–157. [Google Scholar] [CrossRef]
- Codeluppi, G.; Cilfone, A.; Davoli, L.; Ferrari, G. LoRaFarM: A LoRaWAN-based Smart Farming Modular IoT Architecture. Sensors 2020, 20, 2028. [Google Scholar] [CrossRef] [PubMed] [Green Version]
- LoRaWAN Market Projected to Grow by 47 Percent. GPS World. 2020. Available online: https://www.gpsworld.com/lorawan-market-projected-to-grow-by-47-percent/ (accessed on 30 May 2021).
- Almeida, R.; Oliveira, R.; Sousa, D.; Luis, M.; Senna, C.; Sargento, S. A Multi-Technology Opportunistic Platform for Environmental Data Gathering on Smart Cities. In Proceedings of the IEEE Globecom Workshops (GC Wkshps), Singapore, 4–8 December 2017; pp. 1–7. [Google Scholar]
- Baldo, D.; Mecocci, A.; Parrino, S.; Peruzzi, G.; Pozzebon, A. A Multi-Layer LoRaWAN Infrastructure for Smart Waste Management. Sensors 2021, 21, 2600. [Google Scholar] [CrossRef] [PubMed]
- Islam, B.; Islam, M.T.; Kaur, J.; Nirjon, S. LoRain: Making a Case for LoRa in Indoor Localization. In Proceedings of the IEEE International Conference on Pervasive Computing and Communications Workshops (PerCom Workshops), Kyoto, Japan, 11–15 March 2019; pp. 423–426. [Google Scholar]
- Ertürk, M.A.; Aydın, M.A.; Büyükakkaşlar, M.T.; Evirgen, H. A Survey on LoRaWAN Architecture, Protocol and Technologies. Future Internet 2019, 11, 216. [Google Scholar] [CrossRef] [Green Version]
- Cardell-Oliver, R.; Hübner, C.; Leopold, M.; Beringer, J. Dataset: LoRa Underground Farm Sensor Network. In Proceedings of the 2nd Workshop on Data Acquisition to Analysis, New York, NY, USA, 10 November 2019; pp. 26–28. [Google Scholar]
- Bhatia, L.; Breza, M.; Marfievici, R.; McCann, J.A. Dataset: LoED: The LoRaWAN at the Edge Dataset. arXiv 2020, arXiv:2010.14211. [Google Scholar]
- Aernouts, M.; Berkvens, R.; Van Vlaenderen, K.; Weyn, M. Sigfox and LoRaWAN Datasets for Fingerprint Localization in Large Urban and Rural Areas. Data 2018, 3, 13. [Google Scholar] [CrossRef] [Green Version]
- Mikhaylov, K.; Stusek, M.; Masek, P.; Fujdiak, R.; Mozny, R.; Andreev, S.; Hosek, J. On the Performance of Multi-Gateway LoRaWAN Deployments: An Experimental Study. In Proceedings of the IEEE Wireless Communications and Networking Conference (WCNC), Seoul, Korea, 25–28 May 2020; pp. 1–6. [Google Scholar]
- Laya, A.; Kalalas, C.; Vazquez-Gallego, F.; Alonso, L.; Alonso-Zarate, J. Goodbye, ALOHA! IEEE Access 2016, 4, 2029–2044. [Google Scholar] [CrossRef] [Green Version]
- Augustin, A.; Yi, J.; Clausen, T.; Townsley, W.M. A Study of LoRa: Long Range & Low Power Networks for the Internet of Things. Sensors 2016, 16, 1466. [Google Scholar]
- Reynders, B.; Meert, W.; Pollin, S. Range and Coexistence Analysis of Long Range Unlicensed Communication. In Proceedings of the 23rd International Conference on Telecommunications (ICT), Thessaloniki, Greece, 16–18 May 2016; pp. 1–6. [Google Scholar] [CrossRef] [Green Version]
- LoRa Alliance. LoRaWAN 1.1 Specification. 2017. Available online: https://lora-alliance.org/wp-content/uploads/2020/11/lorawantm_specification_-v1.1.pdf (accessed on 30 May 2021).
- Loy, M.; Karingattil, R.; Williams, L. ISM-Band and Short Range Device Regulatory Compliance Overview; Texas Instruments: Dallas, TX, USA, 2005; pp. 5–13. [Google Scholar]
- LoRa Alliance. LoRaWAN Regional Parameters, 2020. Available online: https://lora-alliance.org/sites/default/files/2020-02/rp_2-1.0.1.pdf (accessed on 30 May 2021).
- Georgiou, O.; Raza, U. Low Power Wide Area Network Analysis: Can LoRa Scale? IEEE Wirel. Commun. Lett. 2017, 6, 162–165. [Google Scholar] [CrossRef] [Green Version]
- Rizzi, M.; Ferrari, P.; Flammini, A.; Sisinni, E. Evaluation of the IoT LoRaWAN Solution for Distributed Measurement Applications. IEEE Trans. Instrum. Meas. 2017, 66, 3340–3349. [Google Scholar] [CrossRef]
- ERC Recommendation 70-03. 2020. Available online: https://docdb.cept.org/download/25c41779-cd6e/Rec7003e.pdf (accessed on 30 May 2021).
- LoRaWAN Network Server 6.x—Uplink Data Message. Available online: https://docs.loriot.io/display/LNS/Uplink+Data+Message (accessed on 30 May 2021).
- SX1301 Datasheet. 2017. Available online: https://sforce.co/3dPFtby (accessed on 30 May 2021).
- Keysight Technologies. N6700 Modular Power System Family—Data Sheet. Available online: https://www.keysight.com/fi/en/assets/7018-01522/data-sheets/5989-6319.pdf (accessed on 30 May 2021).


| Parameters | Property |
|---|---|
| Coverage (MCL) | 157 dB |
| Technology | PHY (Proprietary)/MAC (Open) |
| Frequency spectrum | Unlicensed/ISM |
| Duty cycle limitation | Yes (0.1% or 1% in EU) |
| Transmission power restrictions | Yes (16 dBm = 40 mW) |
| Data rates in Downlink (DL) | 0.25–50 kbps (50 kbps with FSK) |
| Data rates in Uplink (UL) | 0.25–50 kbps (50 kbps with FSK) |
| Max. message size UL | 243 B |
| Max. message size DL | 243 B |
| Current consumption | Sleep < 2 uA, Tx < 45 mA (14 dBm), Rx < 15 mA |
| Module cost | <8 USD |
| Security | Medium (AES-128) |
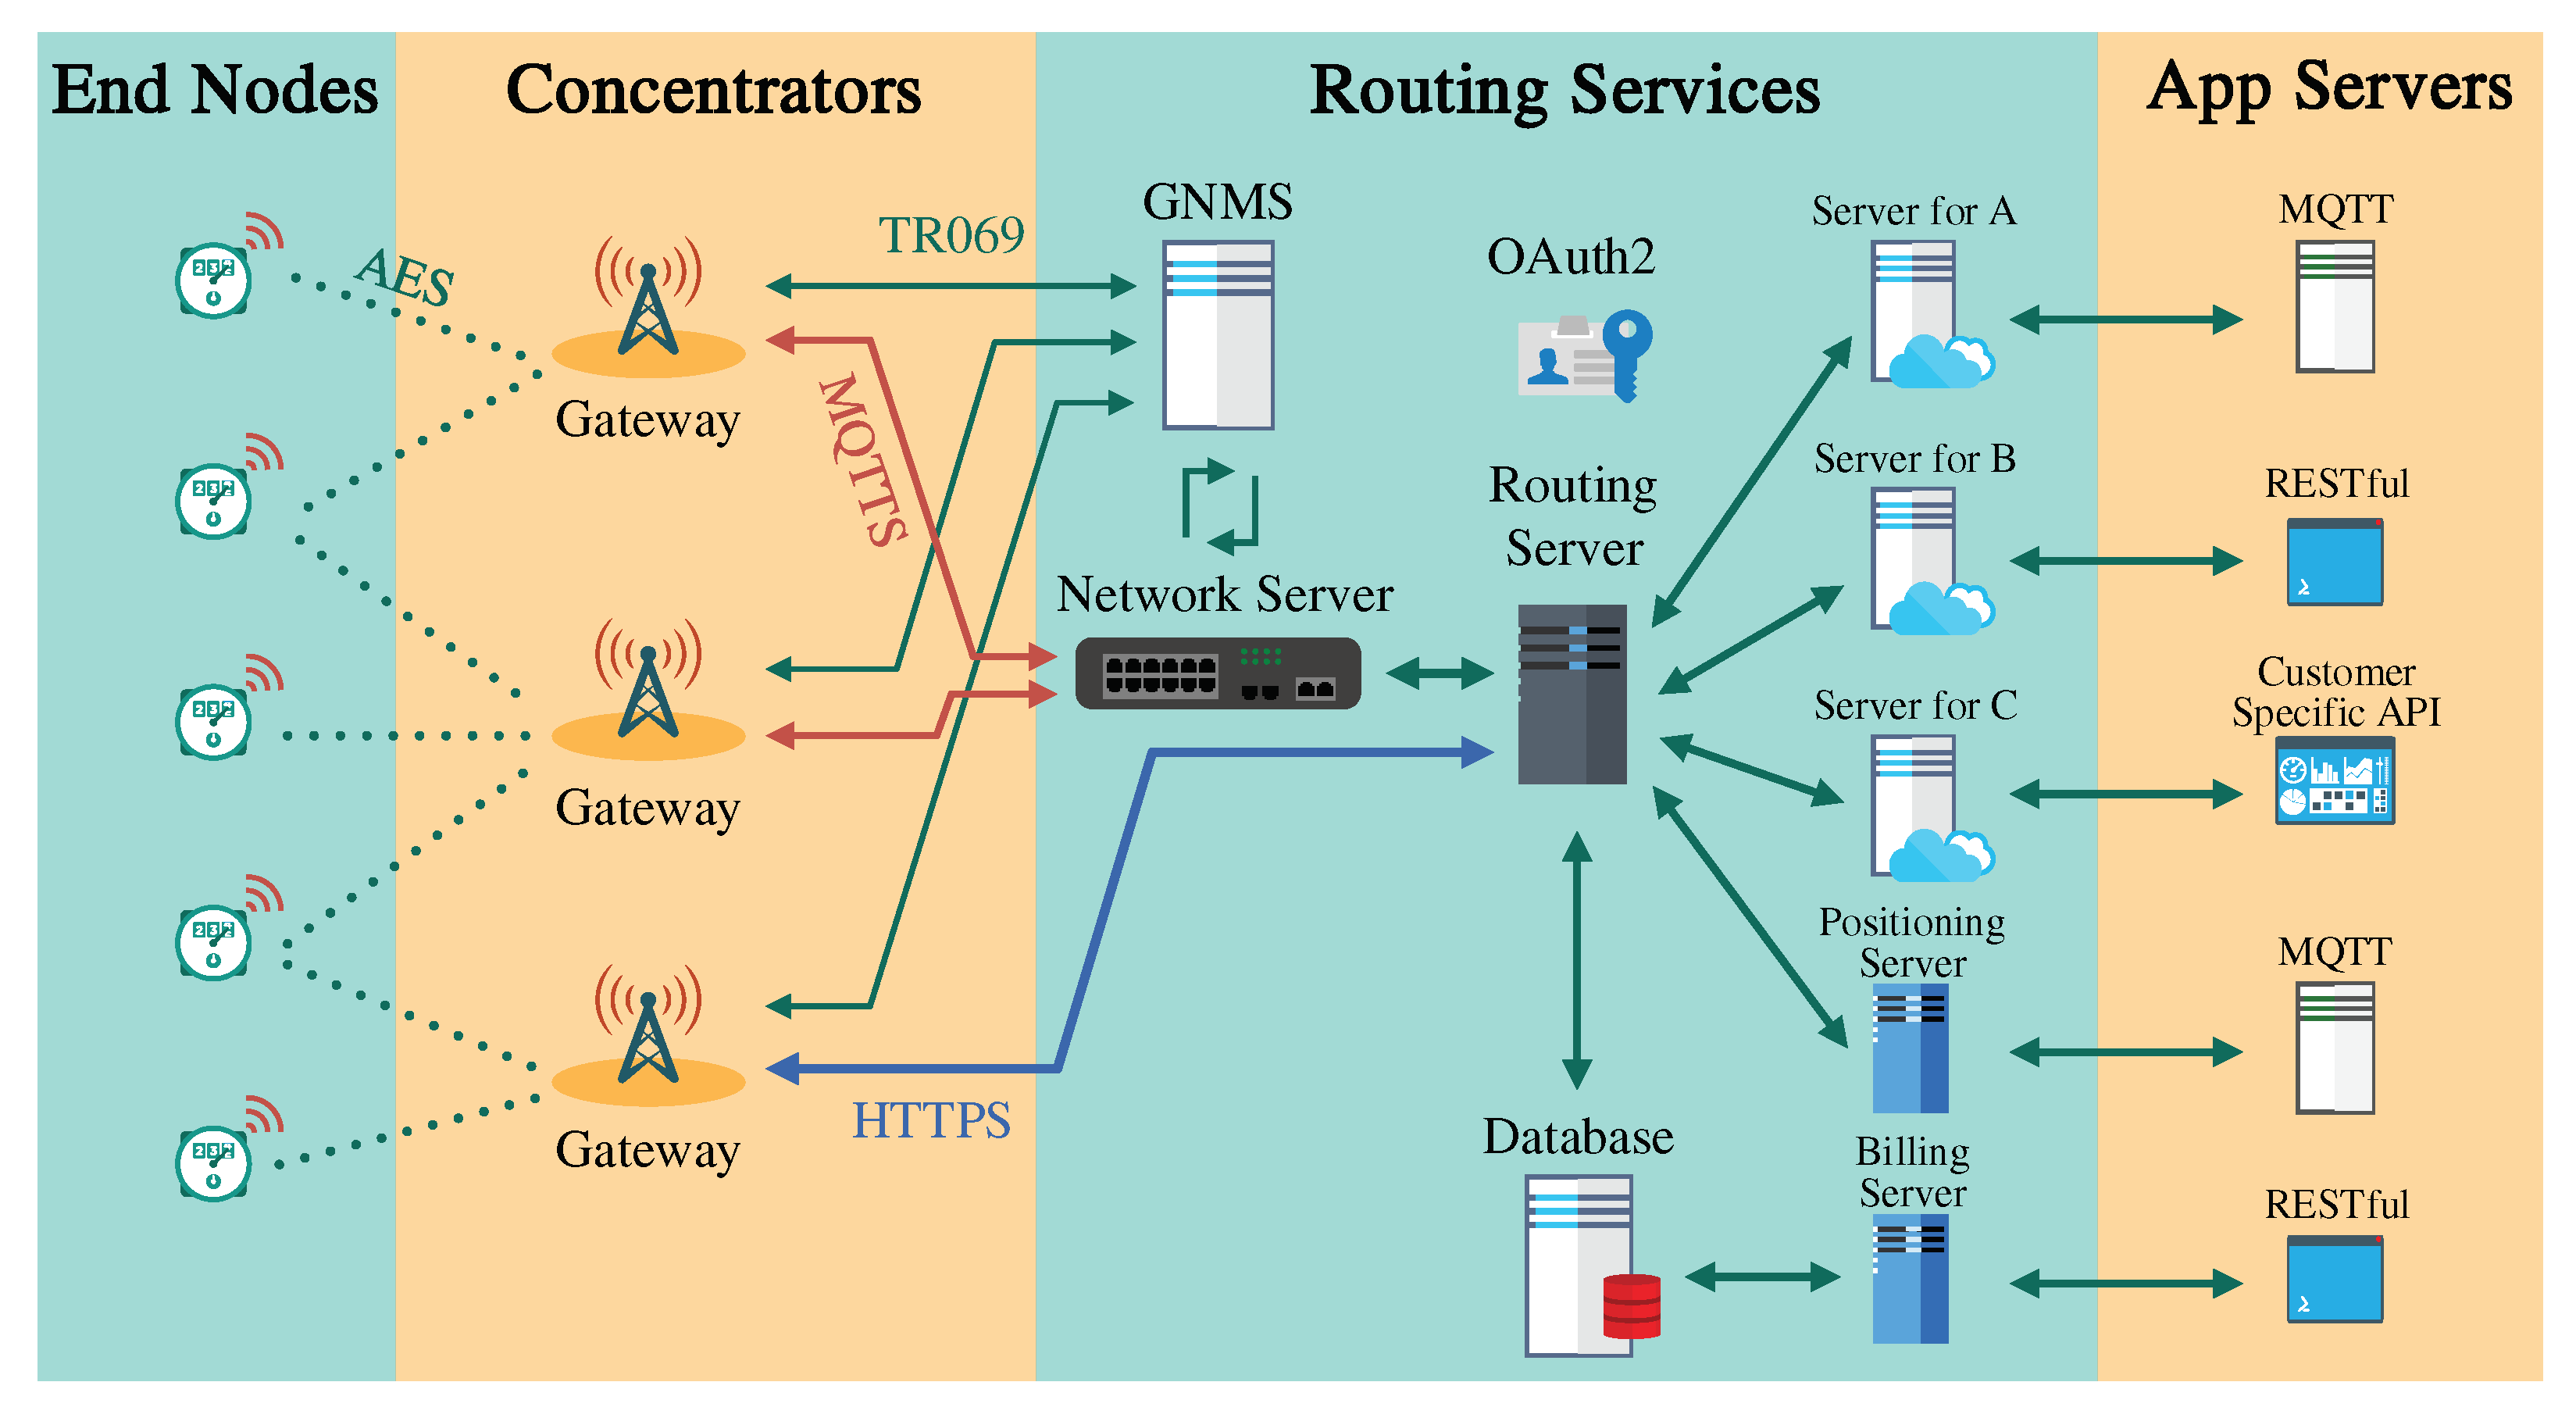
| End Nodes | |
|---|---|
| AES | Advanced Encryption Standard used for encrypted communication. |
| Concentrators | |
| TR-069 | Technical specification that defines an application protocol for remote management of network devices. |
| MQTTS | Lightweight messaging protocol MQTT (for M2M, IoT devices) with TLS (SSL) encryption support. |
| HTTPS | Hypertext transfer protocol (HTTP) with encryption protocol TLS (SSL), mostly used for web browsing. |
| Routing Services | |
| Network server | Implements LoRaWAN protocol, validates authenticity and integrity of devices, packet deduplication, organizes downlink transmission, and many others. |
| Routing server | Routes traffic based on the customer’s account and the selected server. |
| Database | Data storage for billing server. |
| Server for A, B, and C | Customer server that handles end-device join procedures, key storage, and management. |
| Positioning server | Provides position calculation (estimation) of end devices in the network. |
| Billing server | Handles the tracking of billable products and services. |
| GNMS | (Global network management system) Provides remote monitor and control functionality. |
| Oauth2 | Industry-standard protocol for authorization that provides API clients limited access to user data on a web server. |
| App Servers | |
| MQTT | Lightweight messaging protocol MQTT (for M2M and IoT devices). |
| RESTful | Architectural style for API (application program interface) that uses HTTPS requests to access and use data. |
| Customer-Specific API | Proprietary protocol implementation. |
| Data Rate (DR) | Configuration | Physical Bit Rate [b/s] |
|---|---|---|
| 0 | LoRa: SF12/125 kHz | 250 |
| 1 | LoRa: SF11/125 kHz | 440 |
| 2 | LoRa: SF10/125 kHz | 980 |
| 3 | LoRa: SF9/125 kHz | 1760 |
| 4 | LoRa: SF8/125 kHz | 3125 |
| 5 | LoRa: SF7/125 kHz | 5470 |
| 6 | LoRa: SF7/250 kHz | 11,000 |
| 7 | FSK: 50 kb/s | 50,000 |
| 8–14 | Reserved | - |
| Bandwidth [kHz] | Channel Frequency [MHz] | Bit Rate [kb/s] | Duty Cycle |
|---|---|---|---|
| 125 | 868.1, 868.3, 868.5 | 0.25 (DR0) to 5 (DR5) | <1% |
| Parameter | Value |
|---|---|
| Frequency Range | 863.0 MHz to 870.0 MHz; 433.050 MHz to 434.790 MHz |
| RF Output Power | Adjustable up to +14 dBm high Efficiency PA |
| Modulation Schemes | FSK, GFSK, and LoRa Technology Modulation |
| Data Rate | 300 kbps with FSK modulation; 10,937 bps with LoRa Technology modulation |
| Output Power | Adjustable up to max. 10 dBm on 433 MHz band (limited to meet regulations); max. 14 dBm on the 868 MHz band |
| Receiver Sensitivity | Up to −146 dBm |
Publisher’s Note: MDPI stays neutral with regard to jurisdictional claims in published maps and institutional affiliations. |
© 2021 by the authors. Licensee MDPI, Basel, Switzerland. This article is an open access article distributed under the terms and conditions of the Creative Commons Attribution (CC BY) license (https://creativecommons.org/licenses/by/4.0/).
Share and Cite
Masek, P.; Stusek, M.; Svertoka, E.; Pospisil, J.; Burget, R.; Lohan, E.S.; Marghescu, I.; Hosek, J.; Ometov, A. Measurements of LoRaWAN Technology in Urban Scenarios: A Data Descriptor. Data 2021, 6, 62. https://0-doi-org.brum.beds.ac.uk/10.3390/data6060062
Masek P, Stusek M, Svertoka E, Pospisil J, Burget R, Lohan ES, Marghescu I, Hosek J, Ometov A. Measurements of LoRaWAN Technology in Urban Scenarios: A Data Descriptor. Data. 2021; 6(6):62. https://0-doi-org.brum.beds.ac.uk/10.3390/data6060062
Chicago/Turabian StyleMasek, Pavel, Martin Stusek, Ekaterina Svertoka, Jan Pospisil, Radim Burget, Elena Simona Lohan, Ion Marghescu, Jiri Hosek, and Aleksandr Ometov. 2021. "Measurements of LoRaWAN Technology in Urban Scenarios: A Data Descriptor" Data 6, no. 6: 62. https://0-doi-org.brum.beds.ac.uk/10.3390/data6060062